Positional and Rotational Molecular Degrees of Freedom in a Metal-Organic Surface Alloy: the Copper-Fullerene System and its Multiple Structural Phases
Abstract
Mixing two chemical elements at the surface of a substrate is known to produce rich phase diagrams of surface alloys. Here, we extend the concept of surface alloying to the case where the two constituent elements are not both atoms, but rather one atom (copper) and one molecule (fullerene). When deposited at room temperature on a Cu(111) surface, fullerenes intermix with the metal substrate. Surprisingly, 10 distinct copper-fullerene surface alloys are found to coexist. The structure of these alloys, i.e. their composition and commensurability relationship with the substrate, is resolved using scanning tunneling microscopy and density functional theory calculations. This diversity in the alloying process is associated to the multiple possibilities a fullerene can bind to the Cu surface. The molecules are indeed found to have in-plane and out-of-plane positional degree of freedom: the molecular alloys have elastic in-plane properties and can buckle. In addition, the molecules can rotate on their binding sites, conferring extra degrees of freedom to the system. We introduce a competing-interaction energy model, parametrized against the results of the ab initio calculations, that describes well all the phases we observe experimentally.
keywords:
fullerene, STM, epitaxy, DFT, energy landscape, surface alloyIntroduction
Surface binary alloys often form at the surface of a metal when it is exposed to a different chemical element, such as another metal, a group IV atom (C, Si, Ge) or a chalcogen. 1, 2, 3. Two-dimensional (2D) alloys are involved in countless situations, either as the targeted active materials or as intermediates, sometimes parasitic phases. Relevant applications include catalysis 4, 5, growth of 2D materials 6, 7, 8, 9, and nano-magnetism 10, 11, 12. The physico-chemical properties of these compounds usually depend on their composition and structure, which can be ordered 12, 13 or disordered in the manner of a frustrated magnet 14, 15.
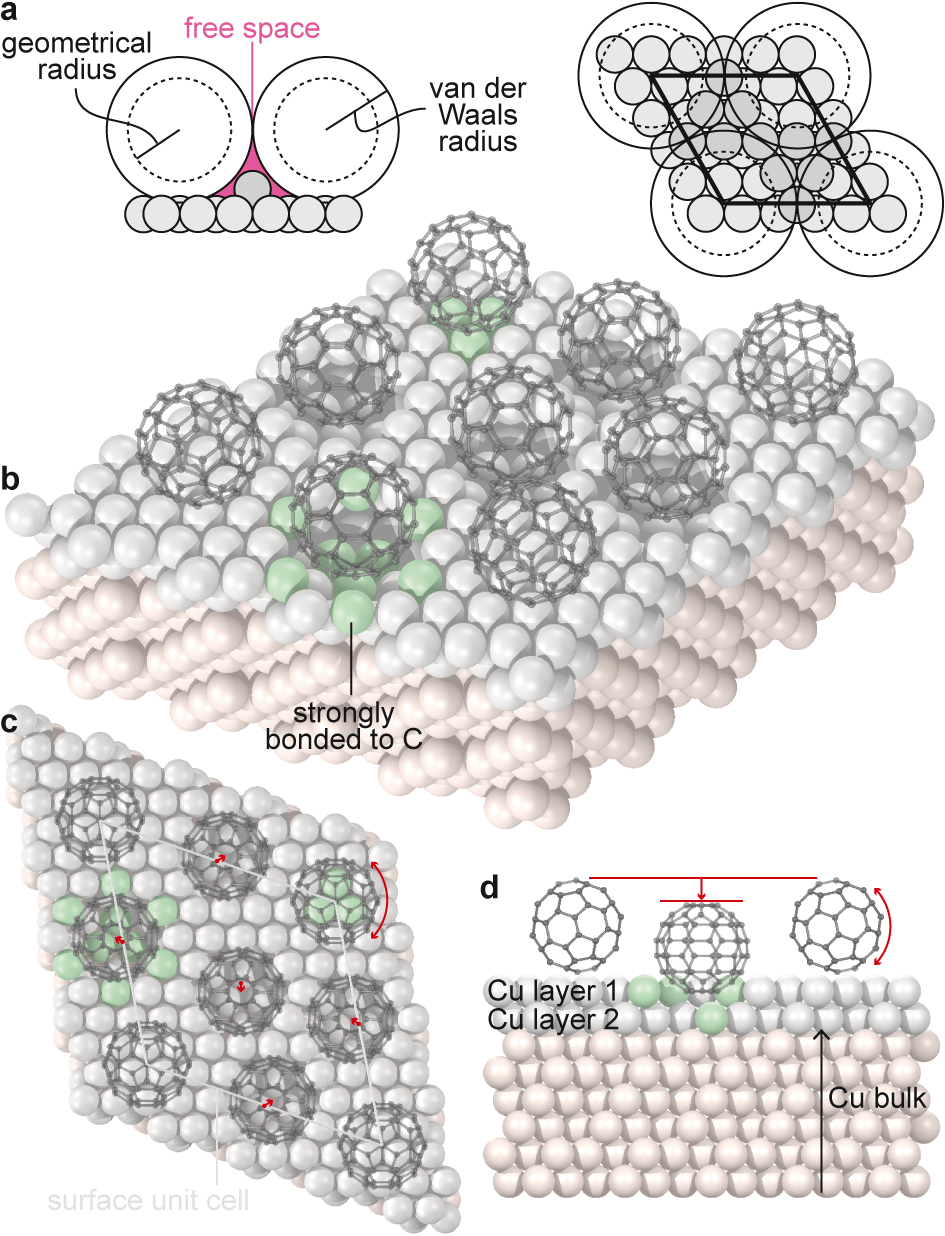
Molecules can also intermix with a metal substrate. Fullerenes (C60) are molecules known to sink into various metal surfaces, via the formation of one-atom-deep vacancies in the substrate 16, 17, 18, 19. Interestingly, close packing of the (spherical) C60 molecules on a flat substrate leaves an empty volume of typically 0.5 nm3 (per unit cell) between the two materials. On a Cu(111) surface, this volume is readily filled by nine metal atoms (Figure 1a), in a configuration where the full Cu layer onto which the molecules sit is not the topmost one, but rather the one underneath 19. Considered this way, metal-fullerene systems are analogs of 2D alloys in biatomic systems, in what we coin metal organic surface alloys. The two constituting elements being starkly different in size and nature, strain effects and various types of interactions (inter-molecular or with the substrate) may play a key role in the alloy stabilization at the surface while preventing bulk alloying (a common issue with biatomic alloys). Besides, the molecules may possess multiple positional and rotational degrees of freedom when lying on the metal surface (Figure 1b-d), rendering the interaction energy landcape complex.
In this work, we revisit the properties of the fullerene-Cu(111) binary system – one of the most finely analyzed 20, 21, 22, 23, 19 hybrid metal/organic interfaces of potential relevance for future molecular electronics, and a reference system for advanced investigations of, e.g., the mechanics of single molecules 24, the nature of individual chemical bonds 25 or molecular switching effects 26, 27. Specifically, we address the striking coexistence of numerous Cu-fullerene surface alloys, whose structure is atomically resolved combining scanning tunneling microscopy (STM) measurements and density functional theory (DFT) calculations. Using DFT estimates of the different energy contributions involved in the system, and exploring the impact of the aforementioned molecular degrees of freedom, we derive an energetic classification of about 20 surface alloy candidates. Representing the surface alloy energies versus the average inter-molecular distance and alloy composition, our model predicts that the lowest-energy phases are those observed experimentally.
Results
Coexistence of surface alloys
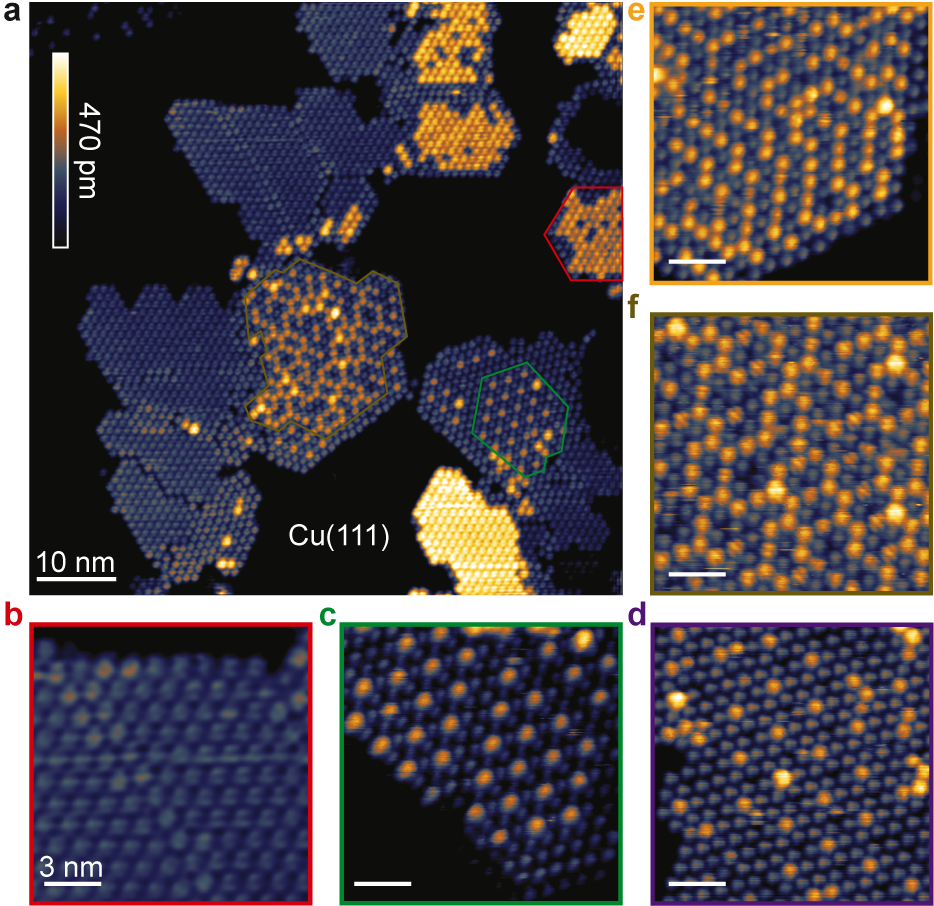
Thermal evaporation of fullerenes under ultra-high vacuum, onto a Cu(111) surface held at room temperature (see Methods section), produces 2D islands of densely-packed molecules. The first molecular layer grows fully before the second layer appears, presumably because several C atoms form bonds with metal atoms (Figure 1b), at the bottom pole of the molecular globe (which is not accessible to the STM tip), while fullerene diffusion onto fullerene-covered Cu(111) is a low energy-barrier-process 28, 29. STM imaging reveals that 10 distinct 2D phases coexist on the surface (Figure 2a and additional data in Supporting Information Figure S1), some of which were already observed 23. Figure 2b-f shows the five most frequent phases in our experiments, the one highlighted by a red frame (Figure 2b) being the most prominent one. Varying the fullerene flux by a factor four has no appreciable effect on the nucleation density and the relative proportion of each phase. Deposition temperature is, however, a more sensitive parameter: increasing it from 230 K to 300 K and 370 K (STM observations made at room temperature), we found that the phases’ nucleation densities decrease, and that only the phase highlighted by a red frame in Figure 2 grows at the highest temperature.
In the following, we focus on the rich energy landscape the system is able to explore at room temperature, and on the energy hierarchy between the different possible phases. To determine the energy of each phase, the precise binding configuration of each fullerene must be deciphered. This implies first to analyze the structural degrees of freedom of each molecule (see an example in Figure 1c,d), which is the purpose of the next sections. Although the positional degrees of freedom can be deduced experimentally, at least to some extent, the rotational degrees of freedom not directly accessible, since molecular orbitals, and not the carbon backbones, are imaged with STM. Finally, although geometrical considerations are used to determine the molecules’ binding sites (in the presence/absence of Cu vacancies), correlation with the molecular orbitals imaged with STM (down to 4 K, see Methods section) is required. We emphasize that the resolution of the molecular structure, which eventually relies on DFT calculations (see Methods section), has only been done so far for the Cu-fullerene phase imaged in Figure 2b.
Commensurability and positional degree of freedom
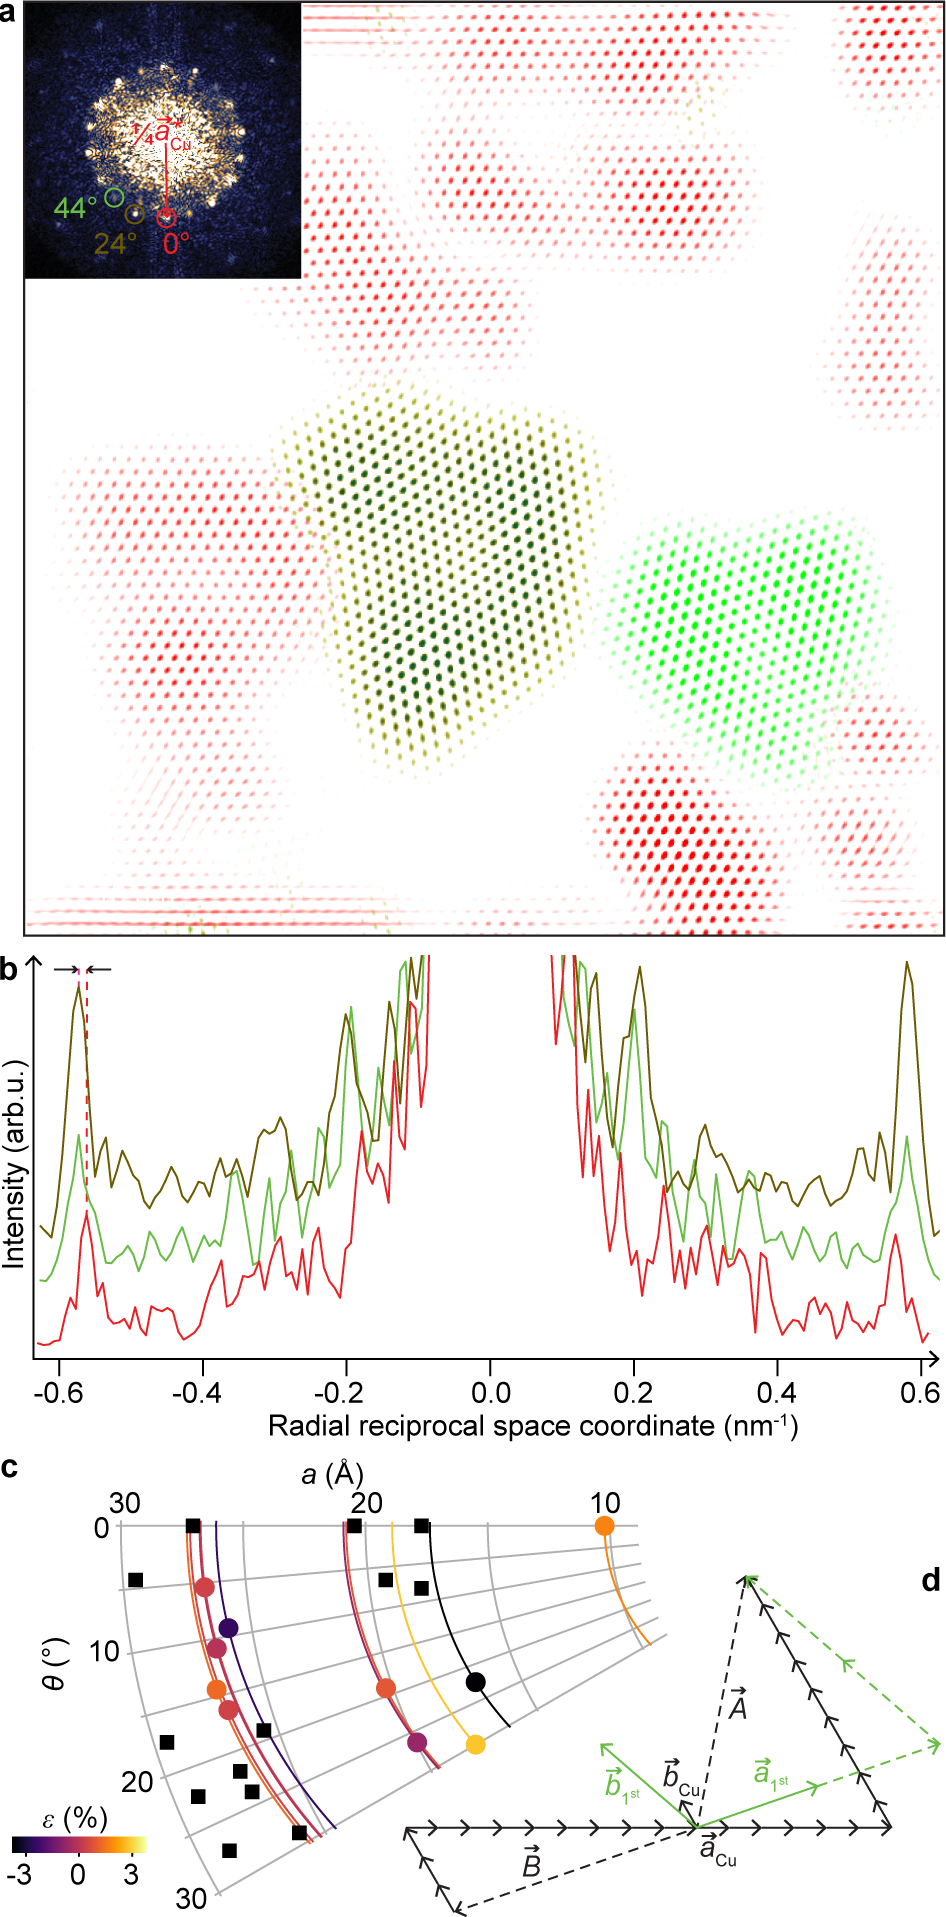
As mentioned above, 10 molecular phases are observed experimentally, five of which being already reported in previous works 23. Close inspection of the STM images reveals that they have distinct crystallographic orientations, i.e., each phase can be characterized by an angle between the dense rows of fullerenes and the dense Cu rows (see statistics over 90 fullerene-based domains, Supporting Information Section S2, Table S1). The different values are revealed by Fourier filtering our STM images, whereby we construct a colour-coded dark-field overlay of the phases (see an example in Figure 3a). Importantly, the first spatial harmonics do not appear at the same distance from the center of reciprocal space (compare, e.g., the dark green and red profiles reported in Figure 3b and derived from the Fourier transform shown in the inset of Figure 3a), i.e. the first nearest neighbour (NN) inter-molecular distances are different. Note that the differences are small (a few percents at most), close to the resolution limit, and are better identified when comparing Fourier harmonics of phases that coexist on single STM images (corrected from imaging artefacts, see Section S3 in Supporting Information).
From the and values of each molecular phase, a commensurate structure with the substrate can be inferred. The corresponding matrix transformation, between the unit cells of the substrate and of the phase 30, 31, is illustrated graphically in Figure 3d, and Supporting Information Table S2 gives the commensurability of the other observed phases. The simplest commensurate phase comprises one fullerene per unit cell, has a orientation and a lattice constant Å equal to . The latter equality does not hold for the other phases, which are so-called high-order commensurate phases 32. A real-space representation of the five phases imaged in Figure 2b-f is given in Figure 4a.
The number of conceivable commensurate structures is not limited to those observed experimentally, though, and is actually infinite in two dimensions. Limiting the remaining of the discussion to structures whose value remains within 4% of the equilibrium distance (strains beyond these values would be energetically prohibitive), and leaving aside structures with unit cells beyond 30 Å, we are still left with about 20 possible structures.
Besides, not only commensurate phases, but also a multitude of incommensurate ones may exist. Such phases would correspond to molecular lattices assuming a priori any orientation (possibly stabilized by so-called static distortion waves 33, 34). The characteristic variation expected for their lattice constant versus 31 is shown in Figure 3c. The fact that the values of the phases we observe do not fall or distribute evenly on the incommensurate arcs is a signature that the fullerene layer is not free-standing on its substrate. Translated in the language commonly used to describe binary compounds, the fullerene layer is not in a segregated phase onto the substrate, but rather involved in a surface alloy characterized by strong C-Cu bonds.
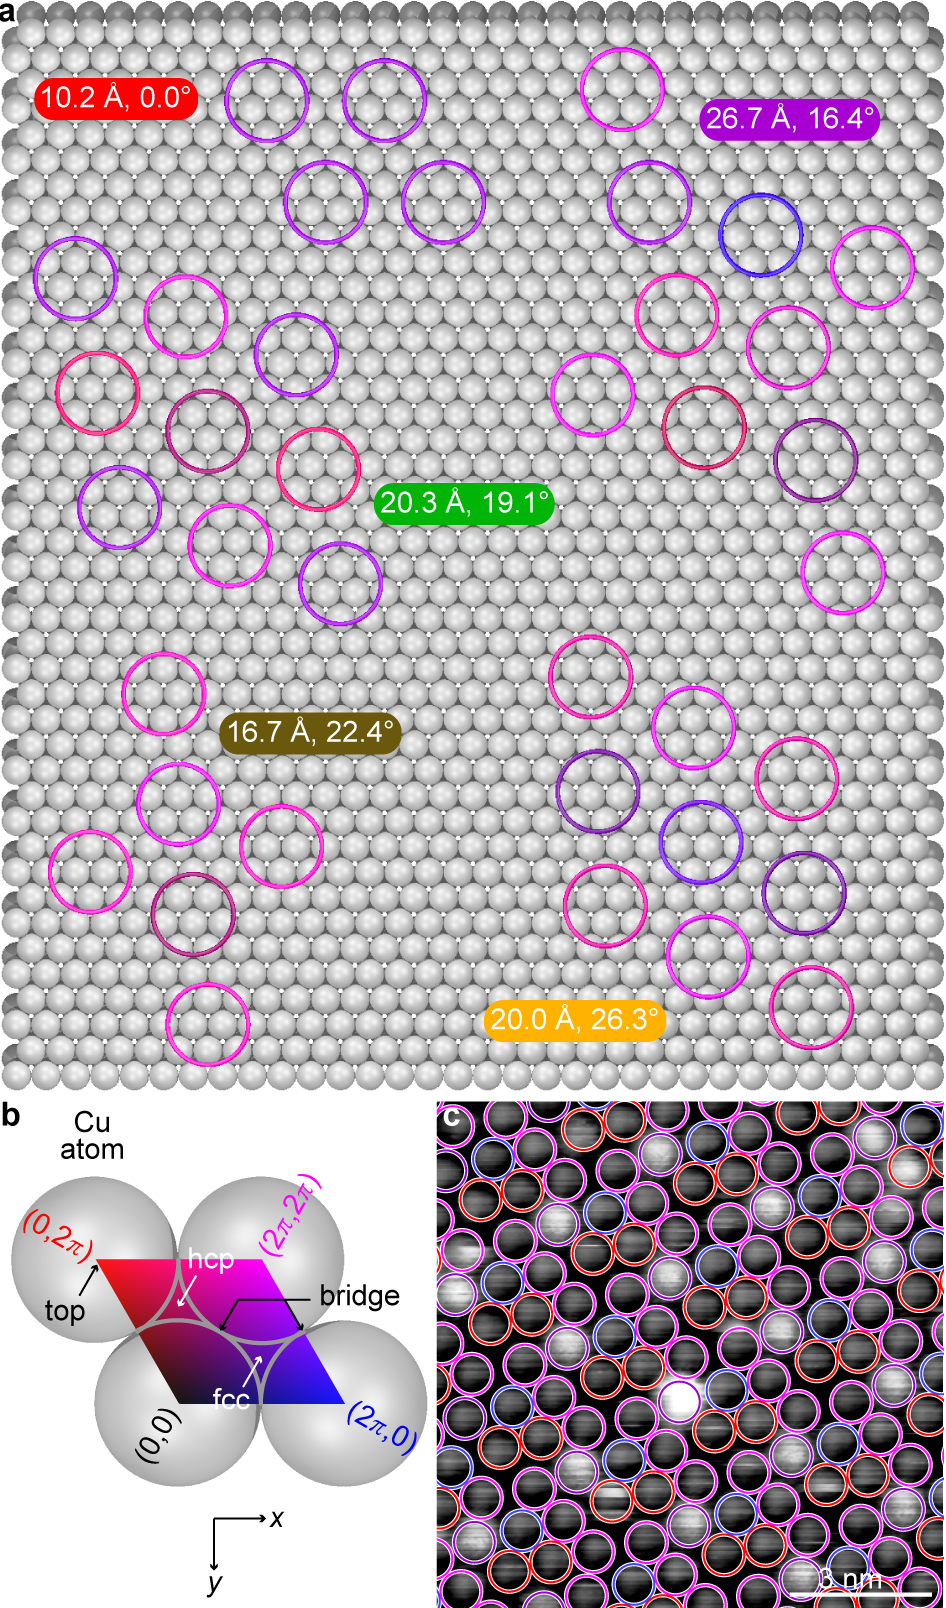
We now analyze the in-plane () position degree of freedom of the molecules, i.e. the relative position of the molecules’ center and substrate atoms in the commensurate phases. For that purpose, the so-called geometrical phase, a two-component variable assuming 0-2 variations, is employed to locate the molecules with respect to a specific crystallographic site. The geometrical phase is represented on a 2D map using a two colour channels (red and blue, see Figure 4b). If one assumes that the distances are all the same for a given phase, one realizes that except for the commensurate phase, only part of the molecules can occupy the most favourable binding sites (whatever they are: their nature will be discussed later). This raises the question whether the molecules may move in-plane to reach more favourable sites, as proposed earlier 35, 23. To answer this question, we inspect STM images of the high-order commensurate phase shown in Figure 2d. Converting the observed molecular positions (center of circles in Figure 4c) into a colour-coded geometrical phase, we find clear differences with the undistorted case considered in Figure 4a. This means that experimentally, the molecule position locally changes, demonstrating elastic properties 32 (also found in other high-order commensurate phases).
Alloying and positional degree of freedom (buckling)
We next consider the out-of-plane () positional degree of freedom the molecules can have on the Cu(111) surface. This degree of freedom is directly apparent on the STM images as a yellow/blue contrast (see Figure 2), which demonstrates that the molecular layer buckles. Our measurements reveal that buckling can be ordered, as evidenced by the , and R19.1 patterns visible in Figure 2b-d, or disordered (Figure 2e,f). Close inspection of the STM images suggests the presence of multiple contrasts associated to different apparent heights. We emphasize that the heights assessed with STM are not true heights, since topography and local electronic density of states are entangled. To determine the height values, we thus have performed a statistical analysis on STM images measured with different tunnel bias. This parameter was, however, found to have only marginal effect on the height values. A statistical analysis of the molecules’ height is summarized in Figure 5 for the different phases (see also Section S5 in Supporting Information, Table S3).
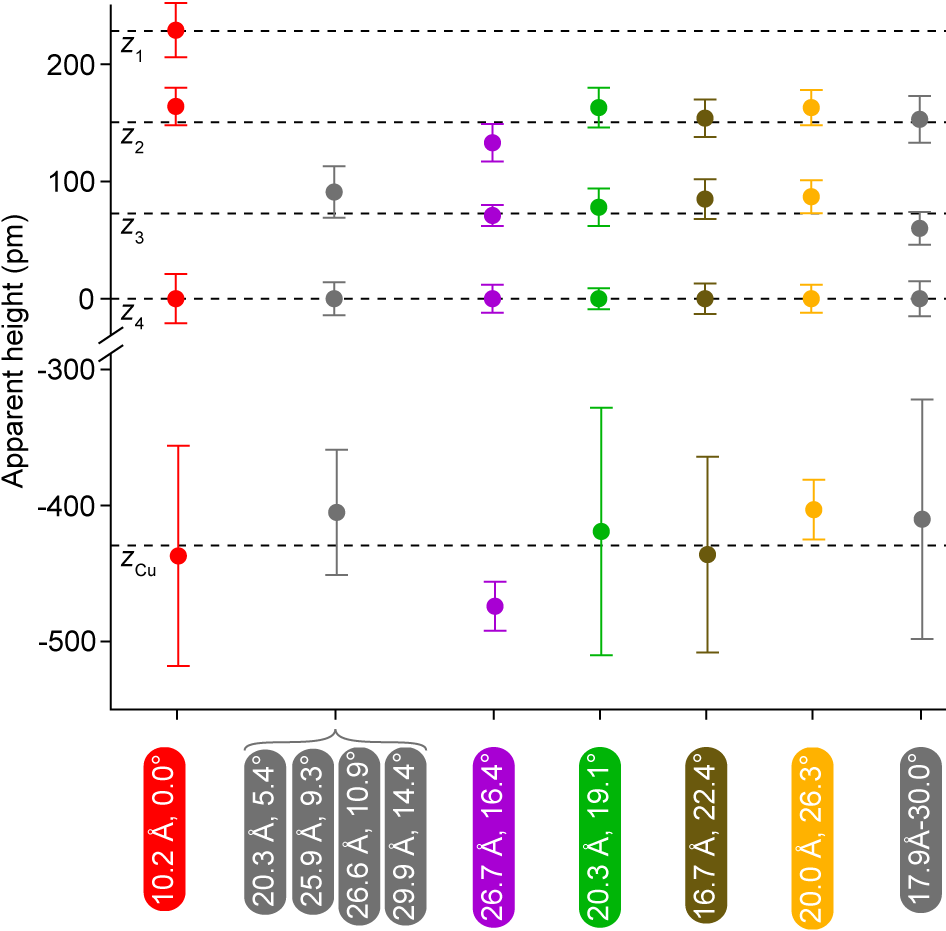
Assigning the origin of the heights to the lower molecular level, all phases are found to exhibit three characteristic apparent height levels, of 0 pm, 80 pm, and 155 pm – except for the commensurate phase, which does not exhibit the level but rather a higher level at 220 pm. Interestingly, this phase also tends to form extended patches with uniform height pattern (Figure 2a), whereas all other phases are truly mixtures of different heights. Around all the phases, the Cu(111) surface is found at 425 pm (a large dispersion is associated to this value, due to the known unstable imaging of the Cu(111) surface at room temperature).
Overall, the position of a molecule is found to have four well-defined values . To interpret this out-of-plane degree of freedom, two geometrical arguments can be invoked. First, the molecule’s geometrical diameter is 710 pm, and the height of a Cu(111) step height is 210 pm. From these numbers, the 425 pm value corresponds to a fullerene molecule sunk into the substrate, sitting on the second Cu layer. In other words, the Cu(111) surface is embossed with one-atom-deep vacancies (each vacancy being made of seven atoms, see below) at the bottom of which the molecule sit. Second, the height difference in the simple commensurate phase (10.2 Å, 0∘), between the low-laying molecules () and those found 220 pm above, suggests that the latter sit on the top Cu layer and the former sit on the second Cu layer. Consistent with previous works 19, 23, our conclusion is that the out-of-plane degree of freedom is intimately related to the formation of Cu vacancies. To go beyond these geometrical considerations and to complete the description of the Cu-fullerene surface alloy phases, we now need to determine the origin of the values.
Disentangling rotational and degrees of freedom with DFT
Unambiguously determining the origin of the values comes down to resolve the , , and rotational degrees of freedom of each molecule in the different phases. This means solving the atomic-scale structure of the system, which is not directly apparent in STM imaging. The set of possible high-symmetry configurations is unfortunately very large (64), considering
-
•
the position of the center of the molecule with respect to different possible crystallographic sites on the Cu surface, i.e. onto a Cu atom (top), at a hollow site between three Cu atoms (two possibilities), and halfway between two Cu atoms (bridge site);
-
•
the presence or absence of Cu vacancies of different kind (four, see below) underneath the fullerene, hence the position;
-
•
the orientation of the fullerene molecule, i.e. facing a pentagonal / hexagonal facet, an apical C atom (apex), or a C-C bond between hexagonal facets (6-6).
To tell which of these configurations may correspond to the STM observations, knowledge on their relative energy is desirable. This information has been sought for previously with DFT calculations, performed for selected configurations (see Supporting Information, Section S6.5), considering the commensurate phase 36, 37, 27 or small Cu clusters with individual fullerenes 38. Although these earlier works highlight energy differences in terms of and rotational degrees of freedom, and a global stabilization associated with the presence of Cu vacancies, they did not aim at a comprehensive classification of all the configurations that are relevant. We opted for a more systematic (and computationally time-consuming) approach: for reasons that will become clearer later, we selected 17 of the 64 possible configurations and calculated the binding energies with DFT calculations (Supporting Information, Section 6.1, Figure S3, Tables S4,S5).
In the absence of Cu vacancies, the molecule with the hexagon, pentagon, apex and 6-6 orientations have lowest calculated binding energies when attached to top, top, hollow (so-called fcc), and bridge Cu sites respectively. Of all these configurations, the apex/fcc is the lowest-energy one (on this matter, see Supporting Information, Section 6.4).
Seven-atom vacancies have mostly been discussed 19 in the context of the commensurate phase prepared by mild annealing, where all molecules sit in a vacancy. Recently however, a scenario with one-atom vacancies was also considered 39. In our calculations, we considered these two kinds of vacancies, and two additional ones, where three atoms are missing (Supporting Information, Figure S3). We considered only hexagon and pentagon molecular orientations, which are the experimentally relevant ones (see below). Except for one of the three-atom vacancies, we find substantially increased binding energy. The configuration with a pentagon on a top Cu site at the bottom of the seven-atom vacancies is about 5 eV lower in energy than the most stable site in the absence of a vacancy. The configuration with a hexagon on a top site is also very stable, slightly less though (1.5 eV). Note that creating a vacancy has a cost, related to the lower coordination of the Cu atoms expelled from the vacancy, that must be taken into account to understand the overall energy gain (Supporting Information, Section 6.2). This cost is actually only affordable, compared to other configurations without vacancies, for the seven-atom vacancies.
Another important information we derive from the DFT calculations are the true height differences between the different configurations. Without vacancies, they are of the order of tens of picometers. The molecules sink by 100 to 200 pm in the presence of the seven-atom vacancy.
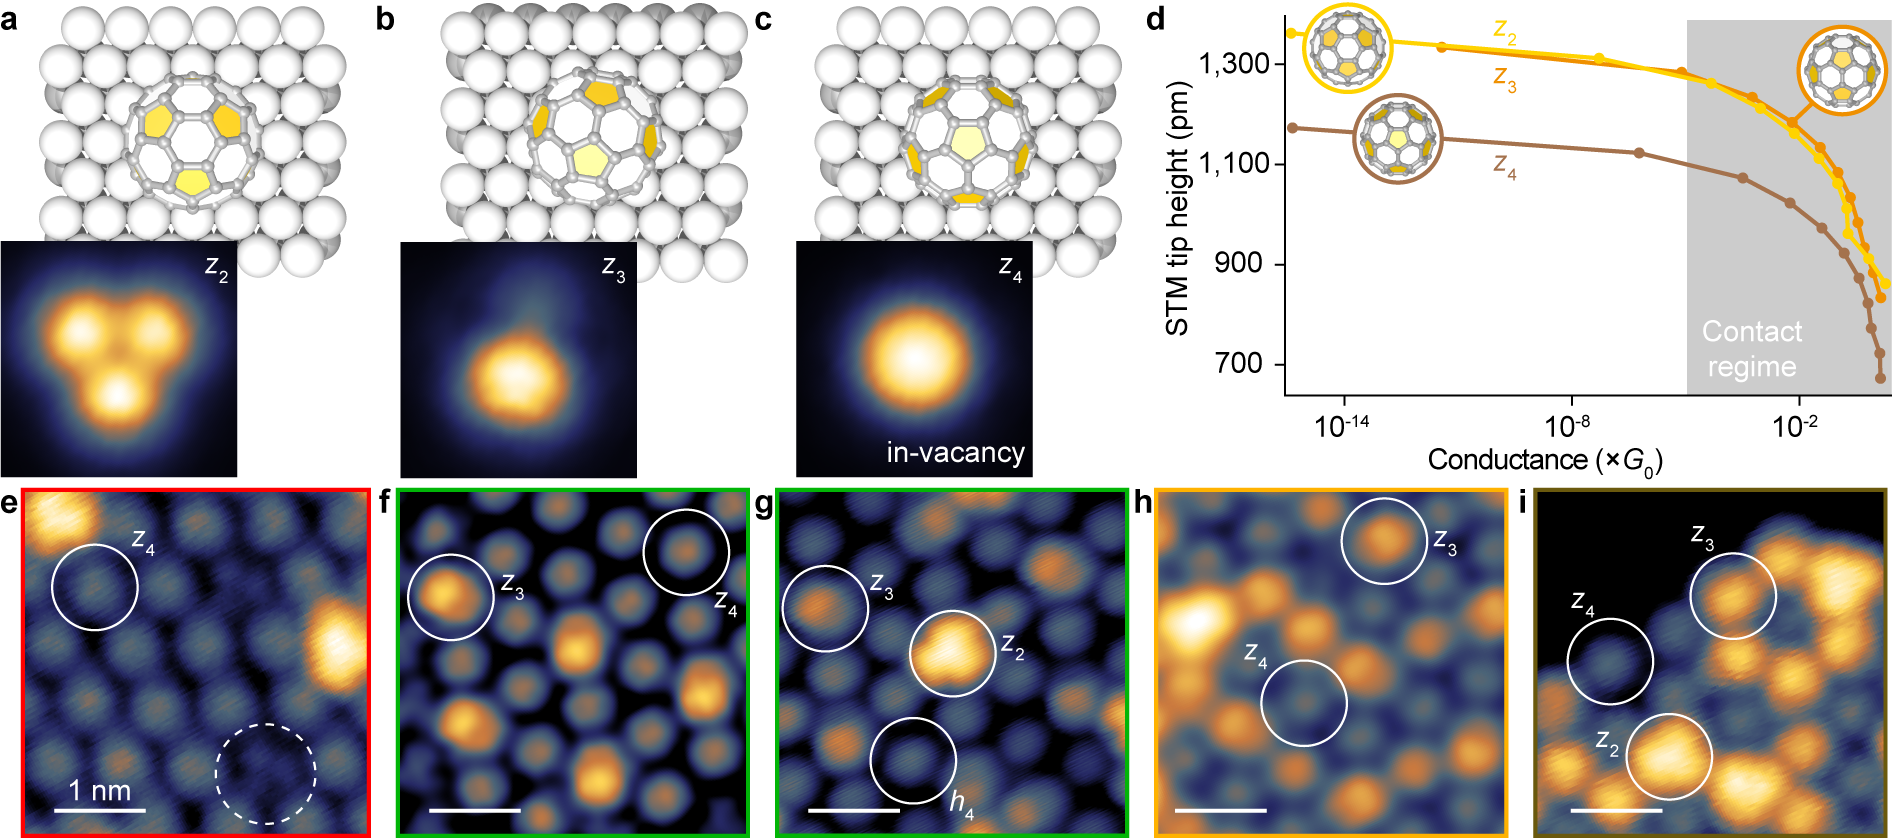
From the above discussion we predict that the , , heights can be assigned to hexagon/tip (no vacancy), apex/fcc (no vacancy), and pentagon/top (within a seven-atom vacancy) configurations, respectively. We simulated the STM images taking into account the effect of the tip and of the substrate (see Methods section) for these configurations (Figure 6a-c). Distinct contrasts are clearly expected for each configuration, accounting for different spatial distributions of the electronic density of states. Calculating the conductance of the molecule-Cu tunnel junction as a function of the STM tip height for the three configurations (Figure 6d), we additionally find that beyond the regime of molecule-tip contact, at fixed conductance value the apparent height is slightly larger for the hexagon/top than for the apex/fcc configuration – themselves substantially larger than for the in-vacancy configuration. The 130-200 pm topographic height difference in presence of the vacancy (compare Supporting Information, Tables S4,S5) is the strongest contribution to the STM height contrast. On the contrary, the hexagon/top and apex/fcc configurations (without vacancy) differ by 70 pm in height, but not so much in apparent height, pointing to a strong contribution of electronic effects.
Experimental confirmation of the DFT predictions were obtained by high resolution low-temperature STM imaging (see Methods section) of the different phases (Figure 6e-i), which reveals intra-molecular contrasts of different kinds (some already observed and related to the molecular orientation in specific Cu-fullerene and metal-fullerene phases 40, 41, 42, 24). We find a very good match between the predictions (Figure 6a-d) and the experimental data (Figure 5, Figure 6e-i). Noteworthy we also observe that while the majority of in-vacancy molecules seem to exhibit a pentagon facet (), a minority of them exhibits a hexagon facet (see dotted circle in Figure 6e), consistent with the lower predicted energy of the latter configuration.
We conclude, from our DFT+STM analysis, that the molecules essentially adopt two specific heights (), occasionally a third one (), anyhow in a one-to-one relationship with the presence () and absence () of a seven-atom, one-atom deep Cu vacancy. The molecules bind on specific crystallographic sites of the substrate with a well-defined orientation, essentially apex/fcc () and a pentagon/vacancy () configurations. In other words, the local tendency to alloying associated with the vacancy formation, i.e. the maximization of the number of C-Cu bonds, authorizes essentially two molecular states – these degrees of freedom being fully coupled.
Competing interaction model of surface alloying
As we have seen, fullerene molecules on Cu(111) are characterized by several degrees of freedom: they can rotate and move in the three space directions to reach favourable binding sites. In addition, the Cu surface is ‘reactive’ and has a tendency to form seven-atom vacancies that increase the number of Cu-fullerene bonds. As a consequence, a variety of structural phases (surface alloys) is expected, i.e., there is fairly large number of ways to establish the crystallographic orientation of the fullerene rows with respect to the Cu(111) lattice and the layer/substrate commensurability. Whether they all form or whether some are preferred is discussed below based on energy considerations.
From now on, the surface alloys will be named according to their Cu/fullerene composition. Both Cu atoms from the topmost Cu layer and Cu atoms belonging to the second (sub-surface) layer form strong bonds with fullerenes (see green-coloured Cu atoms in Figure 1b-d). The Cu content in the alloy compositions is then determined from the surface and subsurface Cu layers. Deeper Cu layers are considered to belong to the substrate (Figure 1b-d). The commensurability relationship sets the number of Cu atoms per full molecular layer, ; knowing the number of vacancies and the number of fullerenes within the unit cell, the alloy composition is : with (the factor 7 relates to the number of atoms per vacancy). The composition of the surface alloys observed experimentally are given in Figure 7a and in the Supporting Information, Tables S1,S2 and Figure S2.
To estimate the energy of each alloy phase, we now introduce a model that takes into account three, possibly antagonist, contributions: the inter-molecular pairwise interaction (), the dipole-dipole interaction due to an interfacial charge transfer (), and the substrate-molecule interaction (). The total energy can then be written as:
where the dependence on the composition, on the average NN fullerene distance , on the crystallographic orientation , and on the sets of molecular orientations ( along, e.g., the center-to-apex axis) and 3D displacements, , has been made explicit. We note that the two limit cases, in which eiher fullerene-fullerene interactions or Cu-fullerene interactions dominate, have been qualitatively addressed in a previous work 23. Here we consider all possible intermediate cases in a quantitative way, using the input of DFT calculations, and include the effect of dipole-dipole interactions.
The form of is shown in the Supporting Information, Figure S4c. It faithfully describes, with a simple analytical (hence easily parametrized) function, the result of time-dependent DFT calculations 43 performed in the absence of a substrate, carefully treating the van der Waals forces dominating at large distances. exhibits a marked minimum at an inter-molecular distance of 10.05 Å, and sensitively depends, especially in the repulsive (short distance) regime, on and that vary by typically 1% from phase to phase.
The fullerene-Cu system exhibits significant interfacial charge transfers, 1 to 3 electrons per molecule in the absence and presence of Cu vacancies respectively, according to indirect experimental estimates 19. Our DFT calculations predict a transfer of 1.2 and 1.9 electrons. The charged molecules have an image charge within the metallic substrate, implying that each molecule should be associated with an electrostatic dipole perpendicular to the surface. The distinct charge distributions, with and without vacancies, result in similar magnitude for these dipoles, 0.44 enm and 0.48 enm, i.e. 0.46 enm in average. The interaction between these dipoles () is taken in the form of the standard electrodynamics solution assuming a one-over-cubic-inter-molecular-distance dependency. It is repulsive and its strength compares to that of (Supporting Information, Figure S4c).
The main originality of our approach, and the difficulty in the calculation of , is the evaluation of . Unlike in the common modeling of molecule-on-substrate systems, cannot here be associated to a single form. It adopts two forms, in the presence/absence of a vacancy under the considered molecule. For that reason, we call an adaptative interaction energy. To parametrize it, we translate the 2D map of Figure 4b into a 2D energy landscape, by associating each high-symmetry crystallographic site to the Cu-fullerene interaction energy calculated with DFT in the presence/absence of a vacancy (Supporting Information, Figure S4a,b).
Knowing for each molecule, evaluating is in principle straightforward. A challenging task however is in the determination of , on which depends via (see above formulation of ). The value of changes from phase to phase, not only due to different numbers, but also due to the sometimes destabilizing interaction between neighbouring vacancies (Section S8 in Supporting Information, Figure S5) 37. For phases with orientation , two neighbour vacancies cannot destabilize each other, because they are sufficiently far appart. However, the decrease of the inter-molecular distances when molecules reach their binding site within a vacancy can come with an energy penalty (see next paragraph). This penalty may be moderate, with the total energy differing by only few 10 meV for configurations with 100% and 100% vacancies, explaining the observation of both configurations in experiments (see Supporting Information, Section S9). The energy penalty may be stronger though, preventing the formation of 100% of vacancies for some of phases, even when . For the (experimentally observed) phase orientation, we find that vacancies can only form under 75% of the molecules without being mutually destabilized, and for the same reason, the fraction decreases to 50% for phases with orientation.
To compute , we first consider all possible in-plane displacements liable to position each molecule on the nearest lowest- configuration. This is actually what appears to happen experimentally, with molecules most often found in well-defined configurations. If the binding configuration is compatible with the formation of a vacancy, then the vacancy is formed (adaptative potential), provided that the orientation criterion introduced above is satisfied, also consistent with the STM observations. There is an important subtlety in the process of finding the proper displacements: some of the supercells have odd multiplicity (odd ), which is incompatible with half the molecules sitting at the bottom of Cu vacancies (which is the experimental observation). For such supercells we hence compute the average energies, for configurations with different numbers of vacancies per unit cell (see Supporting Information, Section S8), and is then an half-integer number.
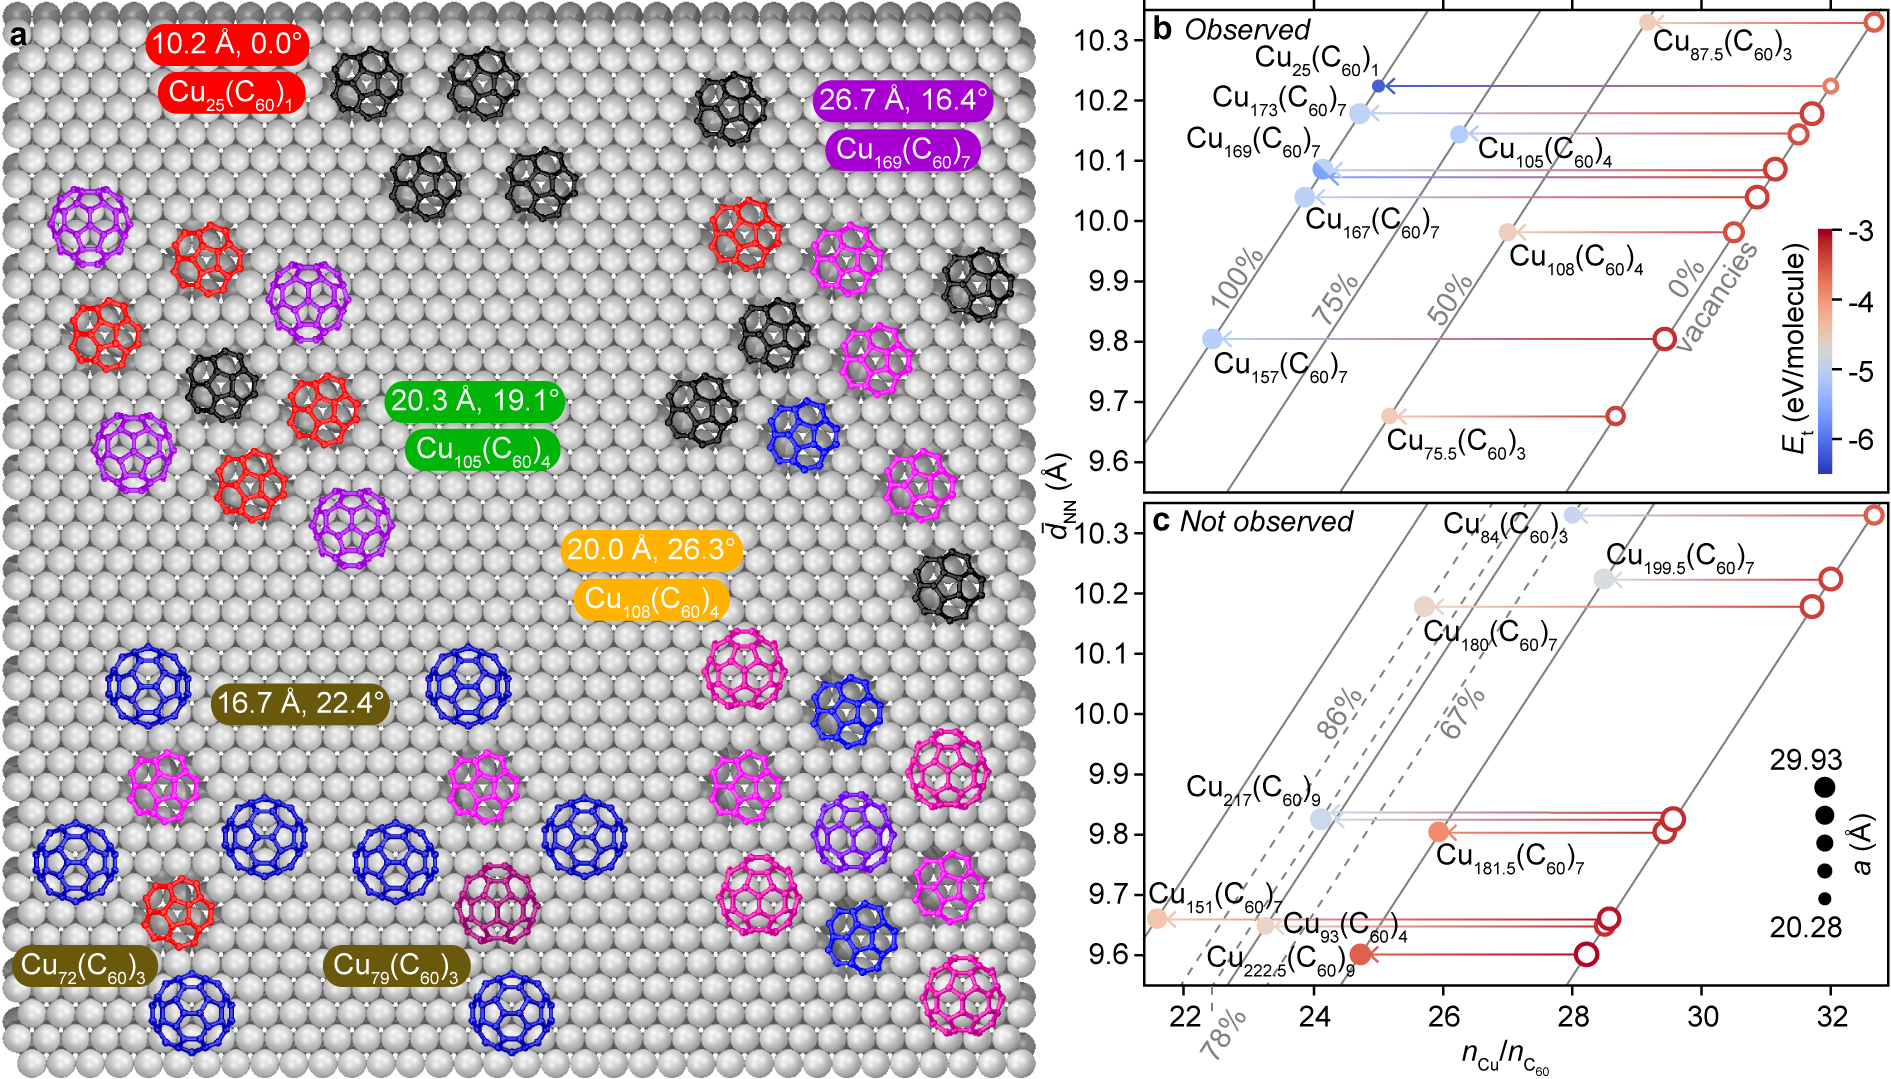
Discussion: energy hierarchy between phases and coexistence
We now compare the energies of all considered surface alloys, including those observed experimentally, when the molecular displacements and rotations are allowed and when they are not (filled/empty symbols in Figure 7b,c). Representing versus the composition and , these alloys fall on parallel lines, each having a given density of Cu vacancies. In the absence of vacancies, the lower-energy phases are those with smaller unit cells. This result is actually expected from seminal epitaxial models predicting that the degree of positional coincidence with the substrate, hence the stability, should be maximized for smaller unit cells 44, 45. However, this result does not hold anymore in the presence of vacancies as the energy strongly decreases. The reason is a strengthened binding ( gain) associated to the vacancies, causing changes in the inter-molecular distances, thus of . The energy span between the different phases is substantially extended in presence of the vacancies, reaching almost 2 eV. Strikingly, for each experimentally relevant vacancy density, according to our model the observed alloys have lower energies than other possible alloys (compare Figure 7b and Figure 7c for vacancy densities of 100%, 75% and 50%; the only exception being the not-observed Cu199.5(C60)7 phase). In that sense the agreement with the experiments is good.
Interesting, the 169:7 and 217:9 alloy compositions both correspond to two possible phases (5.4∘ / 16.4∘ and 4.3∘ / 17.5∘ orientations respectively) with different predicted (-5.76 eV / -5.14 eV and -4.97 eV / -4.93 eV; values expressed per molecule). This shows that, unlike in biatomic surface alloys, the composition alone is not sufficient to understand the alloy energetics. However, the crystallographic orientation of the alloy seems a relevant parameter as increases with it for the same composition.
The phases that are not observed experimentally have vacancy densities lower than 100% and are usually not, given the fraction of molecules within a vacancy, the lowest-energy configurations. Besides, three of the non-observed phases (Cu217(C60)9, 2, and Cu222.5(C60)9) have higher-order commensurability supercells, with large lattice constant (symbol size codes the lattice constants in Figure 7b,c) close to 30 Å. Forming such phases would imply a concerted assembling of a large number of fullerenes and vacancies, which is statistically unlikely, explaining the absence of the Cu217(C60)9 surface alloys in the measurements despite their relatively low energy. The same argument can explain why the Cu199.5(C60)7 phase, whose energy is smaller by 0.3 eV/molecule than that of the Cu75.5(C60)3, Cu108(C60)4 and Cu87.5(C60)3 phases having the same vacancy density, is absent in experiments. We note that the Cu84(C60)3 alloy could not be found in our STM images, although it has a relatively low energy and a rather small unit cell. It has a vacancy density of 2/3, and for similar orientations, lower energy phases are predicted by our model (and in fact observed experimentally, e.g. Cu157(C60)7). Whether accumulating yet more microscopy data would be necessary to observe this phase remains open questions.
We now address the question of phase coexistence. We first discuss the model’s approximations made to treat the problem with a reasonably small set of parameters (evaluated with DFT rather than freely adjusted). One important effect of the model is the formation of Cu vacancies. As explained in the previous section, we relate to the orientation of the dense fullerene rows. We came up with a criterion on , but did not consider the energy cost or gain. Intuitively, this cost/gain should depend on the relative position of the vacancies, since, for instance, Cu atoms can belong to the edges of two vacancies (see Section S7 in Supporting Information, Figure S4) 37. Disentangling the corresponding energy contribution from others is challenging in DFT calculations. In addition, such a DFT analysis would require to compare calculations made with large supercells (e.g., for the Cu169(C60)7 phase with and Å), and all having different and numbers, overall making the comparison almost unfeasible. This is why in our periodic boundary conditions DFT calculations, individual vacancies (together with one fullerene) were considered within a relatively large supercell, limiting the interactions between neighbouring supercells. In the actual phases, the vacancies+fullerenes may cross-talk through the substrate (and no only by van der Waals or dipole-dipole interactions), which we do not take into account. The energy of a C-Cu bonds formed within vacancies could then differ from our estimate, and so could the energy span between the different phases.
Yet, the energies of some of the phases will still be different, by few to several 100 meV. Such large differences prompt why a phase coexistence is observed experimentally. As discussed in the Supporting Information, Section S10, the Gibbs energy of the system comprise an entropy term, which represents here a small contribution that can only marginally modify the relative energies of the different phases. With this in mind, we can propose a growth-by-phase-coexistence scenario. We remind that the phase coexistence is observed at room temperature and slightly above it. A growth temperature increase of about 10% leads to the exclusive formation of the Cu25(C60)1 phase. The entropy term in the Gibbs free energy increases by 10% accordingly, hence a limited increase of the entropy stabilisation is expected. In contrast, temperature can influence the dynamics of domain boundaries (i.e., defects) between phases and/or the kinetics of the interconversion of the different phases into the most stable Cu25(C60)1 phase. The probability to cross the corresponding energy barrier, according to an Arrhenius law, may increase by much more than 10%, depending on the value of the energy barrier, which would explain both the full conversion of the different phases, whose total energies span over about 2 eV, into the Cu25(C60)1 phase at 370 K, and the coexistence at 300 K.
Summary and prospects
We showed that the fullerene-copper system forms what we coined metal-organic surface alloys, reminiscent of more commonly known biatomic surface alloys. The variety of alloys observed experimentally was found to be associated with the multiple degrees of freedom each fullerene molecule can have on the metal surface: in-plane and out-of-plane positional displacements, as well as internal rotation. We then resolved the binding configurations of the molecules based on high-resolution scanning probe microscopy and extensive first principles calculations. The alloying mechanism is systematically accompanied with the formation of one-atom-deep vacancies in the copper surface. To interpret the coexistence of metal-organic surface alloys, we developed a model that accounts for the inter-molecular interactions and the binding to the substrate in the presence or absence of Cu vacancies. Having considered (marginal) entropy contributions to the Gibbs free energy of the system, we finally rationalized the observed coexistence of phases.
The methodology we developed is relevant to explore various metal-organic systems, including other metal-fullerene systems 46, 21, 47, 48, 49, 50, 51, 52, 53, 54, 55, 16, 56, 57, 58, 59, 60, 61, 62. Our approach sheds light on the heteroepitaxy process involving a hybrid molecular/inorganic system on either sides of the interface. Beyond the vacancy-induced alloying mechanism, which may be seen as the premises of intermixing, the nature of heteroepitaxy could be further explored by considering the elastic properties of the fullerene lattice, for instance seeking for possible static distorsion waves 33 that were observed in non-alloyed metal-organic interfaces 34. Finally, some of the phases with non-trivial disorder show striking similarities with frustrated 2D spin systems. In this sense the Cu-fullerene system is also a rich playground to investigate the many-body physics often associated with frustrated magnetism, and more specifically the so-called triangular Ising antiferromagnet 63.
Methods
Sample preparation
Experiments were performed under ultra-high vacuum, inside two chambers (one in Grenoble, the other in Lille), each with base pressures in the low 10-10 mbar range. Copper single-crystals, cut and polished along a (111) surface, bought from Surface Preparation Laboratory, were prepared by repeated cycles of Ar+ ion sputtering (0.8-1.0 keV) and moderate temperature annealing (620-700 K). The surface quality was checked with electron diffraction and STM. Fullerene molecules (99.9% purity) were purchased from Sigma Aldrich. They were thoroughly out-gassed under ultra-high vacuum, within a Kentax evaporator. Evaporation was performed on clean Cu(111) at room temperature and 173-223 K, at rates of 0.5-2.0 Å/min using the water-cooled evaporator held at a temperature of around 620-640 K.
Scanning tunneling microscopy
Scanning tunneling microscopy was performed with two different instruments, (one in Grenoble, the other in Lille), both connected under ultra-high vacuum to the growth chambers. For room temperature measurements a STM-1 Omicron microscope was used, with electrochemically-etched W metal probes. For low temperature (4 K) measurements, experiments were carried out with a Joule-Thomson microscope (SPECS, Berlin) using a commercial length-extensional resonator (Kolibri, SPECS Berlin) with W tip prepared by Ar+ sputtering and substrate conditioning.
Correction of drift and hysteresis imaging artefacts are discussed in Section S3 of the Supporting Information.
Density functional theory calculations
The structures and binding energies of the fullerene molecules on their Cu(111) substrate were optimized using the localized-orbital density functional theory Fireball code 64, 65, 66, within the local density approximation. In our periodic boundary conditions simulations, the substrate was modeled with a five-layer stack of Cu atoms, imposing a fixed position for atoms in the bottom two layers to simulate bulk layers. Optimized minimal basis sets of localized orbitals, for carbon atoms and for copper atoms, were used for structure optimization, with respective cutoff radii (in atomic units) 4.5 (), 5.7 (), 3.7 (), for Cu, and 4.5 (), 4.5 (), for C, following a previous work on fullerene/Cu(111) 67. Also, an basis set of carbon orbitals has been used for a better description of charge transfer and electronic dipoles. Different sizes of supercells have been considered in this work to simulate different inter-molecular distances. All the structures have been fully optimized, using a set of 881 -points in the Brillouin zone until forces remained below 0.1 eV/Å.
The tunneling current in the STM simulations was calculated using the non-equilibrium Green function formalism developed by Keldysh 68, 69. First, we optimized the structure and determined the electronic properties of a Cu-tip formed by a pyramid of four atoms joined to four layers of Cu(111) using the same DFT calculation scheme as for the different C60/Cu(111) configurations. In a second step, the tip was placed above the upmost C atom of the fullerenes, at a distance of 5 Å from it, for different fullerene/Cu(111) configurations optimized with the DFT simulations and avoiding multiple scattering effects. The images presented in Figure 6f-h were calculated with a voltage or +1.5 V, corresponding to the empty states of the molecule. A complete description of the methodology can be found elsewhere 70.
The Supporting Information is available free of charge at https://pubs.acs.org.doi/XXXXX.
-
•
Supplementary figure (Supplementary Figure 1) on additional STM data of the different phases
-
•
Supplementary table (Supplementary Table 1) on the statistical analysis of the orientation of the phases
-
•
Supplementary table (Supplementary Table 2) on the nomenclatures that can be used to describe the different phases
-
•
Supplementary figure (Supplementary Figure 2) showing cartoon views of the 10 observed phases
-
•
Supplementary table (Supplementary Table 3) on the statistical analysis of the molecules’ height as measured with STM
-
•
Supplementary figure (Supplementary Figure 3) on DFT calculations of the energy versus Cu-molecule distance for various binding configurations
-
•
Supplementary tables (Supplementary Tables 4-6) summarizing the binding energies, molecular heights for various molecule-Cu binding configurations
-
•
Supplementary figure (Supplementary Figure 4) showing the 2D molecule-Cu interaction potential with and without vacancies and the inter-molecular interaction potential together with the dipole-dipole interaction versus inter-molecular distance
-
•
Supplementary figure (Supplementary Figure 5) showing cartoons of the possible arrangement of Cu vacancies in different phases observed experimentally
-
•
Supplementary figure (Supplementary Figure 6) giving a histogram of the density of vacancies per unit cell in the Cu75.5(C60)3 surface alloy
-
•
Supplementary figure (Supplementary Figure 7) representing two possible configurations for a given phase
-
•
Discussions about each of the Supplementary Figures and Tables, and about the correction of STM imaging artefacts, on different possible kinds of Cu vacancies, on the effect of the supercell size in the DFT calculations, on the evaluation of the energy cost for vacancy formation, on previous DFT work on Cu-fullerenes, on the possible interactions between neighbour vacancies, on the way disorder can be taken into account in our competing interaction model, and on the coexistence of two structures for spectific phases
1 Author Information
Corresponding Authors
María Alfonso Moro – Université Grenoble Alpes, CNRS, Grenoble INP, Institut NEEL, 38000 Grenoble, France,
http://orcid.org/0000-0003-3906-4899;
Email: maria.alfonso-moro@neel.cnrs.fr
Johann Coraux – Université Grenoble Alpes, CNRS, Grenoble INP, Institut NEEL, 38000 Grenoble, France,
http://orcid.org/0000-0003-2373-3453;
Email: johann.coraux@neel.cnrs.fr
Authors
Yannick Dappe – SPEC, CEA, CNRS, Université Paris-Saclay, CEA Saclay, 91191 Gif-sur-Yvette, Cedex, France
Sylvie Godey – Univ. Lille, CNRS, Centrale Lille, Junia, Univ. Polytechnique Hauts-de-France, UMR 8520-IEMN, Institut d’Electronique de Microélectronique et de Nanotechnologie, F-59000 Lille, France
Thierry Mélin – Univ. Lille, CNRS, Centrale Lille, Junia, Univ. Polytechnique Hauts-de-France, UMR 8520-IEMN, Institut d’Electronique de Microélectronique et de Nanotechnologie, F-59000 Lille, France
César González – Instituto de Magnetismo Aplicado (IMA-UCM-ADIF), 28230 Madrid, Spain and Departamento de Física de Materiales, Universidad Complutense de Madrid (UCM), 28040 Madrid, Spain
Valérie Guisset – Université Grenoble Alpes, CNRS, Grenoble INP, Institut NEEL, 38000 Grenoble, France
Philippe David – Université Grenoble Alpes, CNRS, Grenoble INP, Institut NEEL, 38000 Grenoble, France
Benjamin Canals – Université Grenoble Alpes, CNRS, Grenoble INP, Institut NEEL, 38000 Grenoble, France
Nicolas Rougemaille – Université Grenoble Alpes, CNRS, Grenoble INP, Institut NEEL, 38000 Grenoble, France
Author contributions
J.C. and N.R. conceived the projet. M.A.M and S.G. performed the experiments with support from V.G., P.D., T.M. and J.C. Y.D. performed the DFT calculations and C.G. performed the STM image simulations. M.A.M and J.C analyzed the results. All authors wrote and revised the paper.
Note
The authors declare no competing financial interest.
M.A.M. thanks the Nanosciences Foundation, hosted by the Université Grenoble Alpes Foundation, for a Ph.D. grant, and Groupement de Recherche NS-CPU (Nanosciences en champ proche sous ultravide) for funding of accommodation fees during measurement campaigns in Lille. This work was carried out in part using the SPM facilities of the Multi-Physics Characterisation Platform (PCMP) of the IEMN and the RENATECH network. We thank Dr. Alexandre Artaud for assistance in the correction of imaging artefacts in STM images. CG acknowledges the computer resources at Lusitania II and the technical support provided by the Centro Extremeño de iNvestigación, Innovación Tecnológica y Supercomputación (CENITS), project FI-2022-1-0020 and funding by Comunidad de Madrid (Spain), project S2018/NMT-4321 NANOMAGCOST.
References
- Christensen et al. 1997 Christensen, A.; Ruban, A.; Stoltze, P.; Jacobsen, K. W.; Skriver, H. L.; Nørskov, J. K.; Besenbacher, F. Phase Diagrams for Surface Alloys. Phys. Rev. B 1997, 56, 5822
- Bardi 1994 Bardi, U. The Atomic Structure of Alloy Surfaces and Surface Alloys. Rep. Progr. Phys. 1994, 57, 939
- Woodruff 2002 Woodruff, D. Surface Alloys and Alloy Surfaces; Elsevier: Amsterdam, 2002
- Besenbacher et al. 1998 Besenbacher, F.; Chorkendorff, I.; Clausen, B.; Hammer, B.; Molenbroek, A.; Nørskov, J. K.; Stensgaard, I. Design of a Surface Alloy Catalyst for Steam Reforming. Science 1998, 279, 1913–1915
- Kuld et al. 2014 Kuld, S.; Conradsen, C.; Moses, P. G.; Chorkendorff, I.; Sehested, J. Quantification of Zinc Atoms in a Surface Alloy on Copper in an Industrial-Type Methanol Synthesis Catalyst. Angew. Chem. Int. Ed. 2014, 126, 6051–6055
- Lahiri et al. 2011 Lahiri, J.; Miller, T.; Adamska, L.; Oleynik, I. I.; Batzill, M. Graphene Growth on Ni(111) by Transformation of a Surface Carbide. Nano Lett. 2011, 11, 518–522
- Qi et al. 2017 Qi, Y.; Meng, C.; Xu, X.; Deng, B.; Han, N.; Liu, M.; Hong, M.; Ning, Y.; Liu, K.; Zhao, J.; Fu, Q.; Li, Y.; Zhang, Y.; Liu, Z. Unique Transformation from Graphene to Carbide on Re(0001) Induced by Strong Carbon–Metal Interaction. J. Am. Chem. Soc. 2017, 139, 17574–17581
- Švec et al. 2014 Švec, M.; Hapala, P.; Ondráček, M.; Merino, P.; Blanco-Rey, M.; Mutombo, P.; Vondráček, M.; Polyak, Y.; Cháb, V.; Martín Gago, J.; Jelínek, P. Silicene Versus Two-Dimensional Ordered Silicide: Atomic and Electronic Structure of Si-(1919)R23.4∘/Pt(111). Phys. Rev. B 2014, 89, 201412
- Wang et al. 2015 Wang, Y.; Li, L.; Yao, W.; Song, S.; Sun, J.; Pan, J.; Ren, X.; Li, C.; Okunishi, E.; Wang, Y.-Q.; Wang, E.; Shao, Y.; Zhang, Y. Y.; Yang, H.-T.; Schwier, E. F.; Iwasawa, H.; Shimada, K.; Taniguchi, M.; Cheng, Z.; Zhou, S. et al. Monolayer PtSe2, a New Semiconducting Transition-Metal-Dichalcogenide, Epitaxially Grown by Direct Selenization of Pt. Nano Lett. 2015, 15, 4013–4018
- O’Brien et al. 1993 O’Brien, W.; Zhang, J.; Tonner, B. Local Magnetic Properties and Magnetic Ordering of the Two-Dimensional Surface Alloy c(22) Mn/Cu(001). J. Phys.: Condens. Matter 1993, 5, L515
- Honolka et al. 2009 Honolka, J.; Lee, T.; Kuhnke, K.; Enders, A.; Skomski, R.; Bornemann, S.; Mankovsky, S.; Minár, J.; Staunton, J.; Ebert, H.; Hessler, M.; Fauth, K.; Schütz, G.; Buchsbaum, A.; Schmid, M.; Varga, P.; Kern, K. Magnetism of FePt Surface Alloys. Phys. Rev. Lett. 2009, 102, 067207
- Mehendale et al. 2010 Mehendale, S.; Girard, Y.; Repain, V.; Chacon, C.; Lagoute, J.; Rousset, S.; Marathe, M.; Narasimhan, S. Ordered Surface Alloy of Bulk-Immiscible Components Stabilized by Magnetism. Phys. Rev. Lett. 2010, 105, 056101
- Sprunger et al. 1996 Sprunger, P.; Lægsgaard, E.; Besenbacher, F. Growth of Ag on Cu(100) Studied by STM: From Surface Alloying to Ag Superstructures. Phys. Rev. B 1996, 54, 8163
- Azizi et al. 2020 Azizi, A.; Dogan, M.; Cain, J. D.; Eskandari, R.; Yu, X.; Glazer, E. C.; Cohen, M. L.; Zettl, A. Frustration and Atomic Ordering in a Monolayer Semiconductor Alloy. Phys. Rev. Lett. 2020, 124, 096101
- Ottaviano et al. 2003 Ottaviano, L.; Ressel, B.; Di Teodoro, C.; Profeta, G.; Santucci, S.; Cháb, V.; Prince, K. Short-Range Order in Two-Dimensional Binary Alloys. Phys. Rev. B 2003, 67, 045401
- Stengel et al. 2003 Stengel, M.; De Vita, A.; Baldereschi, A. Adatom-Vacancy Mechanisms for the C60/Al(111)-(66) Reconstruction. Phys. Rev. Lett. 2003, 91, 166101
- Pai and Hsu 2003 Pai, W. W.; Hsu, C.-L. Ordering of an Incommensurate Molecular Layer with Adsorbate-Induced Reconstruction: C60/Ag(100). Phys. Rev. B 2003, 68, 121403
- Felici et al. 2005 Felici, R.; Pedio, M.; Borgatti, F.; Iannotta, S.; Capozi, M.; Ciullo, G.; Stierle, A. X-Ray-Diffraction Characterization of Pt(111) Surface Nanopatterning Induced by C60 Adsorption. Nat. Mater. 2005, 4, 688–692
- Pai et al. 2010 Pai, W. W.; Jeng, H.; Cheng, C.-M.; Lin, C.-H.; Xiao, X.; Zhao, A.; Zhang, X.; Xu, G.; Shi, X.; Van Hove, M.; Hsue, C.; Tsuei, K. Optimal Electron Doping of a C60 Monolayer on Cu(111) via Interface Reconstruction. Phys. Rev. Lett. 2010, 104, 036103
- Rowe et al. 1992 Rowe, J.; Rudolf, P.; Tjeng, L.; Malic, R.; Meigs, G.; Chen, C.; Chen, J.; Plummer, E. Synchrotron Radiation and Low Energy Electron Diffraction Studies of Ultrathin C60 Films Deposited on Cu(100), Cu(111) and Cu(110). Int. J. Mod. Phys. B 1992, 6, 3909–3913
- Motai et al. 1993 Motai, K.; Hashizume, T.; Shinohara, H.; Saito, Y.; Pickering, H. W.; Nishina, Y. N. Y.; Sakurai, T. S. T. C60 Grown on the Cu(111) 11 Surface. J. J. Appl. Phys. 1993, 32, L450
- Tsuei et al. 1997 Tsuei, K.-D.; Yuh, J.-Y.; Tzeng, C.-T.; Chu, R.-Y.; Chung, S.-C.; Tsang, K.-L. Photoemission and Photoabsorption Study of C60 Adsorption on Cu(111) Surfaces. Phys. Rev. B 1997, 56, 15412
- Pai et al. 2004 Pai, W. W.; Hsu, C.-L.; Lin, M.-C.; Lin, K.; Tang, T. Structural Relaxation of Adlayers in the Presence of Adsorbate-Induced Reconstruction: C60/Cu(111). Phys. Rev. B 2004, 69, 125405
- Pawlak et al. 2011 Pawlak, R.; Kawai, S.; Fremy, S.; Glatzel, T.; Meyer, E. Atomic-Scale Mechanical Properties of Orientated C60 Molecules Revealed by Noncontact Atomic Force Microscopy. ACS Nano 2011, 5, 6349–6354
- Gross et al. 2012 Gross, L.; Mohn, F.; Moll, N.; Schuler, B.; Criado, A.; Guitián, E.; Peña, D.; Gourdon, A.; Meyer, G. Bond-Order Discrimination by Atomic Force Microscopy. Science 2012, 337, 1326–1329
- Chandler et al. 2019 Chandler, H. J.; Stefanou, M.; Campbell, E. E.; Schaub, R. Li@C60 as a Multi-State Molecular Switch. Nat. Commun. 2019, 10, 1–8
- Xu et al. 2020 Xu, H.; Wang, Z.; Lu, Y.; Wei, S.; Liu, X.; Wang, L. Construction of a Molecular Switch Based on Two Metastable States of Fullerene on Cu(111). J. Phys. Chem. C 2020, 124, 11158–11164
- Cuberes et al. 1998 Cuberes, M.; Schlittler, R.; Gimzewski, J. Manipulation of C60 Molecules on Cu(111) Surfaces Using a Scanning Tunneling Microscope. Appl. Phys. A 1998, 66, S669–S673
- Tang et al. 1997 Tang, H.; Cuberes, M.; Joachim, C.; Gimzewski, J. Fundamental Considerations in the Manipulation of a Single C60 Molecule on a Surface with an STM. Surf. Sci. 1997, 386, 115–123
- Hooks et al. 2001 Hooks, D. E.; Fritz, T.; Ward, M. D. Epitaxy and Molecular Organization on Solid Substrates. Adv. Mater. 2001, 13, 227–241
- Artaud et al. 2016 Artaud, A.; Magaud, L.; Le Quang, T.; Guisset, V.; David, P.; Chapelier, C.; Coraux, J. Universal Classification of Twisted, Strained and Sheared Graphene Moiré Superlattices. Sci. Rep. 2016, 6, 1–12
- Forker et al. 2017 Forker, R.; Meissner, M.; Fritz, T. Classification of Epitaxy in Reciprocal and Real Space: Rigid Versus Flexible Lattices. Soft Matter 2017, 13, 1748–1758
- Novaco and McTague 1977 Novaco, A. D.; McTague, J. P. Orientational Epitaxy – The Orientational Ordering of Incommensurate Structures. Phys. Rev. Lett. 1977, 38, 1286
- Meissner et al. 2016 Meissner, M.; Sojka, F.; Matthes, L.; Bechstedt, F.; Feng, X.; Müllen, K.; Mannsfeld, S. C.; Forker, R.; Fritz, T. Flexible 2D Crystals of Polycyclic Aromatics Stabilized by Static Distortion Waves. ACS Nano 2016, 10, 6474–6483
- Hsu and Pai 2003 Hsu, C.-L.; Pai, W. W. Aperiodic Incommensurate Phase of a C60 Monolayer on Ag(100). Phys. Rev. B 2003, 68, 245414
- Wang and Cheng 2004 Wang, L.-L.; Cheng, H.-P. Rotation, Translation, Charge Transfer, and Electronic Structure of C60 on Cu(111) Surface. Phys. Rev. B 2004, 69, 045404
- Shi et al. 2012 Shi, X.-Q.; Van Hove, M. A.; Zhang, R.-Q. Adsorbate-Induced Reconstruction by C60 on Close-Packed Metal Surfaces: Mechanism for Different Types of Reconstruction. Phys. Rev. B 2012, 85, 075421
- Larsson et al. 2008 Larsson, J. A.; Elliott, S. D.; Greer, J. C.; Repp, J.; Meyer, G.; Allenspach, R. Orientation of Individual C60 Molecules Adsorbed on Cu(111): Low-Temperature Scanning Tunneling Microscopy and Density Functional Calculations. Phys. Rev. B 2008, 77, 115434
- Forcieri et al. 2021 Forcieri, L.; Taylor, S.; Moriarty, P.; Jarvis, S. P. Origin of C60 Surface Reconstruction Resolved by Atomic Force Microscopy. Phys. Rev. B 2021, 104, 205428
- Hashizume et al. 1993 Hashizume, T.; Motai, K.; Wang, X.; Shinohara, H.; Saito, Y.; Maruyama, Y.; Ohno, K.; Kawazoe, Y.; Nishina, Y.; Pickering, H.; Kuk, Y.; Sakurai, T. Intramolecular Structures of C60 Molecules Adsorbed on the Cu(111)-(11) Surface. Phys. Rev. Lett. 1993, 71, 2959
- Lu et al. 2004 Lu, X.; Grobis, M.; Khoo, K.; Louie, S. G.; Crommie, M. Charge Transfer and Screening in Individual C60 Molecules on Metal Substrates: A Scanning Tunneling Spectroscopy and Theoretical Study. Phys. Rev. B 2004, 70, 115418
- De Menech et al. 2006 De Menech, M.; Saalmann, U.; Garcia, M. E. Energy-Resolved STM Mapping of C60 on Metal Surfaces: A Theoretical Study. Phys. Rev. B 2006, 73, 155407
- Pacheco and Prates Ramalho 1997 Pacheco, J.; Prates Ramalho, J. First-Principles Determination of the Dispersion Interaction Between Fullerenes and their Intermolecular Potential. Phys. Rev Lett. 1997, 79, 3873
- Grimmer et al. 1974 Grimmer, H.; Bollmann, W.; Warrington, D. Coincidence-Site Lattices and Complete Pattern-Shift in Cubic Crystals. Acta Cryst. A 1974, 30, 197–207
- Smith and Pond 1976 Smith, D.; Pond, R. Bollmann’s 0-Lattice Theory; a Geometrical Approach to Interface Structure. Int. Met. Rev. 1976, 21, 61–74
- Altman and Colton 1992 Altman, E. I.; Colton, R. J. Nucleation, Growth, and Structure of Fullerene Films onAu (111). Surf. Sci. 1992, 279, 49–67
- Altman and Colton 1993 Altman, E. I.; Colton, R. J. Determination of the Orientation of C60 adsorbed on Au(111) and Ag(111). Phys. Rev. B 1993, 48, 18244
- Wang et al. 1994 Wang, X.-D.; Yamazaki, S.; Li, J.-L.; Hashizume, T.; Shinohara, H.; Sakurai, T. Reconstructions of C60 on the Ag(111) 11 Surface. Scanning Microscopy 1994, 8, 25
- Sakurai et al. 1995 Sakurai, T.; Wang, X.; Hashizume, T.; Yurov, V.; Shinohara, H.; Pickering, H. Adsorption of Fullerenes on Cu(111) and Ag(111) Surfaces. Appl. Surf. Sci. 1995, 87, 405–413
- Sakurai et al. 1996 Sakurai, T.; Wang, X.-D.; Xue, Q.; Hasegawa, Y.; Hashizume, T.; Shinohara, H. Scanning Tunneling Microscopy Study of Fullerenes. Progr. Surf. Sci. 1996, 51, 263–408
- Johansson et al. 1996 Johansson, M.-J.; Maxwell, A.; Gray, S.; Brühwiler, P.; Mancini, D.; Johansson, L.; Mårtensson, N. Scanning Tunneling Microscopy of C60/Al(111)-66: Inequivalent Molecular Sites and Electronic Structures. Phys. Rev. B 1996, 54, 13472
- Maxwell et al. 1995 Maxwell, A.; Brühwiler, P.; Andersson, S.; Arvanitis, D.; Hernnäs, B.; Karis, O.; Mancini, D.; Mårtensson, N.; Gray, S.; Johansson, M.-J.; Johansson, L. C60 on Al(111): Covalent Bonding and Surface Reconstruction. Phys. Rev. B 1995, 52, R5546
- Maxwell et al. 1998 Maxwell, A.; Brühwiler, P.; Arvanitis, D.; Hasselström, J.; Johansson, M.-J.; Mårtensson, N. Electronic and Geometric Structure of C60 on Al(111) and Al(110). Phys. Rev. B 1998, 57, 7312
- Rogero et al. 2002 Rogero, C.; Pascual, J. I.; Gomez-Herrero, J.; Baro, A. Resolution of Site-Specific Bonding Properties of C60 Adsorbed on Au(111). J. Chem. Phys. 2002, 116, 832–836
- Guo et al. 2004 Guo, S.; Fogarty, D. P.; Nagel, P. M.; Kandel, S. A. Thermal Diffusion of C60 Molecules and Clusters on Au(111). J. Phys. Chem. B 2004, 108, 14074–14081
- Zhang et al. 2008 Zhang, X.; Yin, F.; Palmer, R. E.; Guo, Q. The C60/Au(111) Interface at Room Temperature: A Scanning Tunnelling Microscopy Study. Surf. Sci. 2008, 602, 885–892
- Schull and Berndt 2007 Schull, G.; Berndt, R. Orientationally Ordered (77) Superstructure of C60 on Au(111). Phys. Rev. Lett. 2007, 99, 226105
- Li et al. 2009 Li, H.-I.; Pussi, K.; Hanna, K.; Wang, L.-L.; Johnson, D.; Cheng, H.-P.; Shin, H.; Curtarolo, S.; Moritz, W.; Smerdon, J.; McGrath, R.; Diehl, R. Surface Geometry of C60 on Ag(111). Phys. Rev. Lett. 2009, 103, 056101
- Tang et al. 2011 Tang, L.; Xie, Y.; Guo, Q. Complex Orientational Ordering of C60 Molecules on Au(111). J. Chem. Phys. 2011, 135, 114702
- Gardener et al. 2009 Gardener, J. A.; Briggs, G. A. D.; Castell, M. R. Scanning Tunneling Microscopy Studies of C60 Monolayers on Au(111). Phys. Rev. B 2009, 80, 235434
- Pussi et al. 2012 Pussi, K.; Li, H.; Shin, H.; Loli, L. S.; Shukla, A.; Ledieu, J.; Fournée, V.; Wang, L.; Su, S.; Marino, K.; Snyder, M.; Diehl, R. Elucidating the Dynamical Equilibrium of C60 Molecules on Ag(111). Phys. Rev. B 2012, 86, 205406
- Paßens et al. 2015 Paßens, M.; Waser, R.; Karthäuser, S. Enhanced Fullerene–Au(111) coupling in ()R30 Superstructures with Intermolecular Interactions. Beilstein J. Nanotechnol. 2015, 6, 1421–1431
- Wannier 1950 Wannier, G. Antiferromagnetism. The Triangular Ising Net. Phys. Rev. 1950, 79, 357
- Sankey and Niklewski 1989 Sankey, O. F.; Niklewski, D. J. Ab Initio Multicenter Tight-Binding Model for Molecular-Dynamics Simulations and Other Applications in Covalent Systems. Phys. Rev. B 1989, 40, 3979
- Lewis et al. 2011 Lewis, J. P.; Jelinek, P.; Ortega, J.; Demkov, A. A.; Trabada, D. G.; Haycock, B.; Wang, H.; Adams, G.; Tomfohr, J. K.; Abad, E.; Wang, H.; Drabold, D. A. Advances and Applications in the FIREBALL Ab Initio Tight-Binding Molecular-Dynamics Formalism. Phys. Status Solidi B 2011, 248, 1989–2007
- Jelínek et al. 2005 Jelínek, P.; Wang, H.; Lewis, J. P.; Sankey, O. F.; Ortega, J. Multicenter Approach to the Exchange-Correlation Interactions in Ab Initio Tight-Binding Methods. Phys. Rev. B 2005, 71, 235101
- Schull et al. 2011 Schull, G.; Dappe, Y. J.; González, C.; Bulou, H.; Berndt, R. Charge Injection Through Single and Double Carbon Bonds. Nano Lett. 2011, 11, 3142–3146
- Keldysh 1965 Keldysh, L. V. Diagram Technique for Nonequilibrium Processes. Sov. Phys. JETP 1965, 20, 1018–1026
- Mingo et al. 1996 Mingo, N.; Jurczyszyn, L.; Garcia-Vidal, F.; Saiz-Pardo, R.; De Andres, P.; Flores, F.; Wu, S.; More, W. Theory of the Scanning Tunneling Microscope: Xe on Ni and Al. Phys. Rev. B 1996, 54, 2225
- González et al. 2016 González, C.; Abad, E.; Dappe, Y.; Cuevas, J. Theoretical Study of Carbon-Based Tips For Scanning Tunnelling Microscopy. Nanotechnology 2016, 27, 105201