One Size Does not Fit All: Quantifying the Risk of Malicious App Encounters for Different Android User Profiles
Abstract
Previous work has investigated the particularities of security practices within specific user communities defined based on country of origin, age, prior tech abuse, and economic status. Their results highlight that current security solutions that adopt a one-size-fits-all-users approach ignore the differences and needs of particular user communities. However, those works focus on a single community or cluster users into hard-to-interpret sub-populations. In this work, we perform a large-scale quantitative analysis of the risk of encountering malware and other potentially unwanted applications (PUA) across user communities. At the core of our study is a dataset of app installation logs collected from 12M Android mobile devices. Leveraging user-installed apps, we define intuitive profiles based on users’ interests (e.g., gamers and investors), and fit a subset of 5.4M devices to those profiles. Our analysis is structured in three parts. First, we perform risk analysis on the whole population to measure how the risk of malicious app encounters is affected by different factors. Next, we create different profiles to investigate whether risk differences across users may be due to their interests. Finally, we compare a per-profile approach for classifying clean and infected devices with the classical approach that considers the whole population. We observe that features such as the diversity of the app signers and the use of alternative markets highly correlate with the risk of malicious app encounters. We also discover that some profiles such as gamers and social-media users are exposed to more than twice the risks experienced by the average users. We also show that the classification outcome has a marked accuracy improvement when using a per-profile approach to train the prediction models. Overall, our results confirm the inadequacy of one-size-fits-all protection solutions.
1 Introduction
In recent years, researchers conducted a large number of user studies to investigate the particularities of security and privacy practices within specific user communities defined based on their country of origin [32, 42], age [20, 32, 61], disabilities [5], professions [16, 36], economical status [52, 56], abuse-survivor condition [15, 19], and political exposure [24]. One of the most common takeaways of these studies is that current security-, privacy-, and digital-safety solutions fail to consider classes of at-risk users, who, due to their unique user characteristics, might encounter cyber threats more frequently or may encounter different cyber threats (e.g., more sophisticated) [60].
Prior work discusses the problems of the current one-size-fits-all approach and how the digital needs of particular populations receive less attention from the security community [57]. Following these invaluable insights, a few recent works target a specific community [14, 18, 23, 43]. However, these works should be supported by large-scale studies that can quantify and compare cyber-risk levels across different communities. Results from such studies could motivate security vendors to provide more personalized security and privacy solutions to help particular at-risk communities. Such large-scale quantitative analysis for customized security and risk analysis has been explored in enterprises [53]. However, enterprises are restricted environments with their own risk factors such as enterprise size, geographical location, assets owned, and the industrial sector they belong to [28]. Unfortunately, those indicators do not directly translate to consumers. Furthermore, the set of computers that belong to an enterprise is well-defined. In contrast, large-scale identification of individual users that belong to the same community (e.g., users with shared interests), without a priori user knowledge, is a challenging problem. Thus, researchers restricted their analysis to small sets of users that are interviewed about who they are, what they do, and what they like.
In this work, we perform a large-scale quantitative analysis of the risk of encountering malware and other potentially unwanted applications (PUA) across user communities. We group users in the same community if they share interests. Communities are identified based on information collected in a privacy-sensitive manner from their mobile devices. Mobile devices have some unique characteristics that make them a great source of data to identify user communities. First of all, mobile devices are most often personal, although there are known exceptions such as device sharing within households [9, 35] and in certain geographical locations such as South Asia [4, 44, 3, 6] and Africa [39]. Being portable, they are typically kept close to their users throughout their daily routine and have become an indispensable accessory for many activities such as getting informed, listening to music, consuming video content, creating art, booking travel, and ordering food. Furthermore, mobile devices are ubiquitous being used by 3.8B people, with an average user spending 5.4 hours a day using them, and 13% of the millennials over 12 hours [1].
In the smartphone world, users install a wealth of mobile applications (apps for short) on their mobile devices to enable the above activities. As such, the apps installed on a mobile device characterize its usage and thus can reveal user interests, needs, and personality traits, e.g., better than the set of programs installed in a desktop computer [65]. Motivated by this, recent studies leverage app installation logs to profile mobile users and infer users’ gender or age [64, 67, 46, 47], income [65], and interests [66]. Similarly, at the core of our study is a dataset of app installation logs collected in a privacy-sensitive manner by a security vendor from 12M Android mobile devices (8.6M after filtering).
Our main goal is to shed light on risk factors correlated with the encounter of malware or PUA, and assess the risk faced with respect to those factors by different user profiles. While risk assessment represents one of the cornerstones of computer security, very few studies provide quantitative findings by leveraging large and real-world empirical data. Our mid-term goal, on the other hand, is to promote more personalized security and to foster personalized risk assessments that put each user and their specific needs at the center by abandoning previous models and assumptions that consider the whole population as a unique entity to protect.
We start by categorizing Android users based on the apps they install into intuitive user profiles. Identifying user communities in the app installation logs is a challenging problem as the logs do not contain any information about the users that own the devices. Prior work has inferred user interests from app installations by applying unsupervised machine learning (ML) to cluster devices with similar apps installed [47, 66, 46]. Unfortunately, due to the ML black-box nature, it is not clear what user profile each cluster represents. In contrast, we define intuitive user profiles such as gamers and investors, and look for devices that fit those profiles. For this, we assume that users that install multiple apps from some selected categories (e.g., Games, Finance), have a shared interest and thus a common profile (e.g., gamer, investor). We also build profiles for users with more than one interest. For comparison, we include two additional profiles: average users and users with mixed profiles (i.e., with strong interests in more than two categories). The generated profiles cover 5.4M devices.
Our analysis is structured in three parts. First, we perform single-feature risk analysis on the whole population of 8.6M filtered users to measure how the risk of malicious app encounters is affected by 10 risk factors. As much as our data allows, we study similar features of previous studies that focused on the risk estimation of desktop computers and their users [7, 13, 40, 48, 29]. To the best of our knowledge, our work is the first to explore this topic on the mobile ecosystem. Next, we investigate whether risk differences across users may be due to their interests, i.e., to behaviors that users with common interests may share. For this, we perform a profile-based risk analysis to assess whether each profile presents cyber risks that are considerably different than those of the average users, who are the main target of current security solutions. Finally, we perform multi-feature risk analysis for investigating the contribution of risk factors when classifying clean and infected devices. We observe significant improvements in the classification accuracies when employing dedicated profile models to predict the risk scores of mobile devices. Such risk scores are fundamental for personalized security, privacy, and online safety solutions. For example, they can be used to adjust the AV engine settings (e.g., scan frequency) and to improve security notifications [25, 33, 62].
This paper provides the following main insights:
-
•
The diversity of the application signers and the use of alternative markets highly correlate with the risk of detecting malicious samples. While less marked, app reputation and update frequency show a not negligible contribution on the total risk.
-
•
Users assigned to specific profiles show significant differences when compared to the general population. While some maintain a lower infection rate, others such as Gamers are more impacted. Profiles also show different threat sources when measuring the most contributing categories of applications that are marked as malicious.
-
•
The classification results reflect the inadequacy of one-fits-all protection solutions. Using a single model, the accuracy score for some profiles is even worse than 50%, while for others it reaches upwards of 80%. The outcome of the per-profile classification approach is significantly better with an average accuracy of more than 76%.
2 Datasets
This section presents the datasets that constitute the basis of our study. At the core of our study lies a dataset of App installation logs from a security vendor with metadata of apps installed on 12M Android devices. For apps distributed through the official Play market, we also obtain their market metadata. We use the Play market category to classify the apps. We collect VirusTotal (VT) reports of the APKs and use the AV detection labels in the VT reports for identifying malware, PUA, and for classifying those into families.
| Dataset | Data | All | Filtered |
|---|---|---|---|
| App Installation Logs | Devices | 12.2 M | 8.6 M |
| Countries | 243 | 243 | |
| APKs | 34.6 M | 8.9 M | |
| Packages | 7.9 M | 2.2 M | |
| Signers | 4.1 M | 1.5 M | |
| VirusTotal | Reports | 4.8 M | 875 K |
App installation logs.
These logs capture metadata about the presence of apps in 12M Android devices. These logs are collected from real devices in use by customers of the security vendor that opted-in to share their data and are anonymized to preserve customer privacy. We discuss ethical concerns in Section 7. Each device in the dataset regularly queries a backend system to obtain the reputation of the APKs installed in the device. The dataset includes only app metadata and not the actual APK files. The dataset covers four months from June 1st, 2019 to September 30, 2019. It consists of file metadata such as APK hash, APK package name, the signer (i.e., the SHA256 of the public key in the APK’s certificate), and the name of the parent package that installed the APK. The parent information is obtained via Android’s PackageInstaller class using the PackageInstaller.getInstallerPackageName method. Parent information may not be available for all apps. For example, apps that come pre-installed on the device or sideloaded apps installed via the Android Debug Bridge (ADB) may not have parent information. The dataset also contains a list of countries from where a device has connected to the backend service, obtained through geo-location of the device’s IP address. An APK may have been queried by the same device more than once. We obtain the earliest date that an APK is observed in a device and use it as an approximation of the installation time for that app version. As shown in Table 1, the dataset contains 34.6M APKs that belong to 7.9M packages collected from 12.2M Android devices in 243 countries.
Play market.
For app categorization, we use Play market metadata, namely the app’s category. The Play market metadata was collected in February 2020 by trying to download the app’s public webpage using its package name. Of the 7.9M packages in the app installation logs, 24% (1.9M) were present in the Play market. This fraction is similar to that measured in previous works [21, 29]. Apps not in the Play market include AOSP packages, apps pre-installed by the vendor or carrier, apps available in the past but since removed [58], and apps distributed through alternative vectors (e.g., other markets, browser downloads). After filtering apps not installed by the user (see Section 3) the percentage of categorized apps on the filtered dataset raises to 53%.
VirusTotal.
We query the hash of APKs in VirusTotal (VT) [55]. VT offers a commercial API that given a file hash returns file metadata and the list of detection labels assigned by a large number of AV engines used to scan the file. Unfortunately, given VT’s API restrictions, we could not query all APKs. To minimize any bias and to increase our coverage we query the ten most prevalent APKs for each app signer and all APKs that install other apps. In total, we collect VT reports for 14% (4.8M) of all the APKs and 31% (2.5M) of all apps in the dataset. However, after the dataset filtering is done (see Section 3), we remain with VT reports for 10% (875K) of all APKs and 20% (443K) of all apps. On a per-device level, we measure that for 35% of the devices we have obtained VT reports for at least 20% of the installed apps. We present the whole distribution of the per-device VT coverage in Figure 2 in the Appendix. We use the AV labels from the VT reports to identify malware and PUA.
3 Dataset Preparation
Device and app filtering.
Before performing the risk analysis, we apply a number of filtering steps on the app installation logs and then identify malware and PUA among the remaining data. At a high level, the filtering comprises four steps and has two goals. First, three filters are applied for removing devices that do not capture real user behavior. These include devices used for tasks such as app testing or research, and devices for which there is not enough information to capture the behavior of its user (e.g., devices with very few apps). As done by previous work [43], we empirically selected these thresholds by analyzing the distribution of installed apps per device and looking for outliers for varying outlier cutoff values. Then, a fourth filter aims at removing apps that have not been installed by the user (e.g., OS apps, pre-installed apps) and thus cannot be used to characterize the user. We outline their technical details below.
-
•
The first filter removes devices with an excessive number of installed apps since they are most probably devices used for testing purposes. More specifically, we filter out 60K devices that have more than 500 apps installed.
-
•
The second filter removes devices that query the backend system only once within our analysis period. These devices likely uninstalled the AV app promptly after installation. No full scan was likely performed on those devices and therefore there is limited visibility on their list of apps. This step removes 1.9M devices.
-
•
The third filter removes devices with a very small number of installed apps, e.g., devices that turned off the telemetry consent. This step removes 1.4M devices with less than 15 installed apps including the OS and other system apps.
-
•
The fourth filter removes apps whose installation is not rooted on a decision by the device user.
In Section 5, we perform a systemic risk analysis to investigate whether certain user profiles diverge from the risk models made for the whole population. For this, we group users based on the kinds of apps they install on their devices. However, not every app on a device has been installed by its user. Some apps are already present when the device is acquired such as those belonging to the Android Open Source Project (AOSP) and those pre-installed by the device manufacturer and the carrier [21]. Other apps may be downloaded without user intervention by system-level apps, e.g., as part of firmware upgrades [8]. Since the user did not originate the installation of those apps, their presence does not provide information about user intentions. Thus, they should not be included in the user’s categorization. However, identifying user-installed apps is challenging. OS restrictions prohibit apps from monitoring such events. System-level apps are installed under a system partition (e.g., /system, /vendor, /oem), but the installation path is not available in our dataset. To address this issue, we consider as user-installed apps those installed from the official or alternative markets. The intuition is that AOSP and system-level apps are not distributed through markets, but come pre-installed and are updated through firmware upgrades [8]. We may miss user-installed apps distributed through other vectors such as IM and browser downloads. But, according to a prior study, 93% of app installations come from markets [29]. Thus, this filter will maintain a good representative list of user-installed apps for each device. To identify market-originated apps, we match the parent package against a list of 122 market packages (and their signers) produced in prior work [29]. We detail limitations of our user-installed app detection in Section 7.
As presented in Table 1, the final filtered dataset contains 8.9M APKs from 2.2M packages found on 8.6M devices.
Malware and PUA detection.
To measure the risk of malware and PUA installations, we first need to identify them in the dataset. A common practice is to collect AV detection labels from VT and consider malicious any sample flagged (i.e., assigned a non-empty label) by at least a threshold number of AV engines. A higher threshold reduces false positives due to a few AV engines making an incorrect determination, but may increase false negatives. Recent work has shown that threshold values between 2 and 14 are good for stability and for balancing precision and recall [68]. We use a threshold of at least 4 AV engines, which is within the recommended range and has been used by a variety of other works [30, 27, 29]. From the 4.8M APKs for which a VT report was collected, 28.8% (1.5M) have zero detections, 12.8% (681.4K) between one and three detections, and 58.5% (3.1M) have at least four detections will be the focus of the risk analysis. To distinguish between malware and PUA, we feed the VT reports of the 3.1M detected apps to the AVClass malware labeling tool [45]. AVClass outputs the most likely family name classifies the sample as PUA or malware based on the presence of PUA-related keywords (e.g., grayware, adware, pua, pup). AVClass classifies 73.4% of the 3.1M APKs as PUA and the remaining 26.6% as malware.
4 Android User Risk Factors
This section details our global risk analysis on the whole population for identifying risk indicators and their contribution.
To assess the cyber risk of users, previous works have investigated a wide range of features [7, 13, 40, 48, 29]. Those features can be grouped into five classes: features that measure the volume of online activity (e.g., number of websites browsed or files downloaded); those reflecting the diversity of a user’s online behaviors (e.g., category of websites browsed and programs downloaded); those capturing the reputation of entities the user interacts with (e.g., program publishers, browsed websites); those capturing software updates (e.g., vulnerability patching rate); and geographical features (e.g., user country). In this section, we test to what extent similar risk trends affect Android users. We focus on feature classes because we cannot use exactly the same features evaluated in prior work since our platform, dataset, and analysis time period are considerably different.
We measure how 10 features, representative of the above 5 feature classes, correlate with malicious encounters in the Android ecosystem. For this, we build three Generalized Linear Models (GLMs) [12], each of them modeling 10 independent variables (one per feature) by using a binomial distribution and a logarithmic link function. Each model captures respectively the outcome of detecting (1) any malicious app (i.e., malware or PUA), (2) only malware, and (3) only PUA. Once fitted to the data, each model outputs a Log-Odds distribution for the dependent variable that expresses the odds of a malicious encounter as a linear combination of the 10 features. The extent to which each feature influences a malicious encounter is captured by its regression coefficient. We reduce granularity by bucketing each feature into quartiles (i.e., 4 bins). We set the first bin as reference, a common choice in related works [51, 54], and express the odds ratios of other bins with respect to the reference.
To select the best model, we test different GLM configurations and analyze the outcome of several goodness-of-fit quantities (Pseudo R-Squared, Log-Likelihood, Dispersion) in addition to controlling for feature dimensionality by employing the Akaike Information Criterion (AIC). Table 2 summarizes the results and we discuss each feature class in the following paragraphs. In addition, in section A.1 of the Appendix, we conduct an in-depth analysis to evaluate how the identified factors differ between the best and worst devices in our dataset (i.e., clean devices exhibiting no signs of malicious apps for all the period of our experiments, and outlier devices that report a very high number of malicious detections)
| Feature | Class | Bin | Reference | Odds ratios | ||
|---|---|---|---|---|---|---|
| PUA | Malware | PUA & Malware | ||||
| Applications | Volume | 31-52 | 15-30 | 1.24 | 1.15 | 1.24 |
| 53-102 | 15-30 | 1.31 | 1.28 | 1.33 | ||
| >102 | 15-30 | 1.36 | 1.62 | 1.38 | ||
| Activity days | Volume | 6-20 | 2-5 | 1.13 | 1.07 | 1.14 |
| 21-49 | 2-5 | 1.36 | 1.30 | 1.37 | ||
| >49 | 2-5 | 1.38 | 1.51 | 1.41 | ||
| Signers | Diversity | 26-50 | 1-25 | 1.89 | 1.80 | 1.91 |
| 51-75 | 1-25 | 3.94 | 3.29 | 4.00 | ||
| >75 | 1-25 | 9.22 | 7.03 | 9.42 | ||
| Application categories | Diversity | 13-16 | 1-12 | 0.77 | 0.69 | 0.75 |
| 17-20 | 1-12 | 0.52 | 0.48 | 0.50 | ||
| >20 | 1-12 | 0.40 | 0.38 | 0.38 | ||
| Update rate | Updates | Medium | High | 1.19 | 1.46 | 1.22 |
| Low | High | 1.53 | 1.91 | 1.58 | ||
| Very Low | High | 1.99 | 2.75 | 2.07 | ||
| % Apps from Alternative markets | Distribution | 26%-50% | 0%-25% | 0.92 | 0.78 | 0.90 |
| 51%-75% | 0%-25% | 1.82 | 1.47 | 1.78 | ||
| >75% | 0%-25% | 8.21 | 12.03 | 7.68 | ||
| Alternative markets | Distribution | 1 | 0 | 1.08 | 0.97 | 1.09 |
| 2-4 | 0 | 1.57 | 2.04 | 1.64 | ||
| >4 | 0 | 12.74 | 12.99 | 17.94 | ||
| App prevalence | Reputation | Medium | Low | 0.76 | 0.79 | 0.78 |
| High | Low | 0.74 | 0.82 | 0.77 | ||
| Very High | Low | 0.69 | 0.69 | 0.71 | ||
| Countries | Geography | 2 | 1 | 1.22 | 1.26 | 1.21 |
| 3-5 | 1 | 1.47 | 1.60 | 1.44 | ||
| >5 | 1 | 2.32 | 2.40 | 2.27 | ||
| Continent | Geography | Africa | False | 1.54 | 1.65 | 1.58 |
| Asia | False | 0.97 | 0.92 | 0.96 | ||
| Europe | False | 0.62 | 0.58 | 0.62 | ||
| North America | False | 0.60 | 0.49 | 0.60 | ||
| Oceania | False | 0.61 | 0.41 | 0.59 | ||
| South America | False | 1.11 | 1.33 | 1.19 | ||
Volume.
Previous work has shown that the volume of online activity is highly correlated with the number of malicious encounters in Windows hosts [7] and in the Web [13]. We examine 2 volume features: the number of installed apps (i.e., package names) and the number of days the device is active. We observe a similar risk increase among Android users on both features. The overall risk is similar to the PUA encounter risk given the higher PUA prevalence (73%) in the dataset. Similar to other platforms, the more extensive use of a device increases the attack surface and thus the risk, although the risk increase is moderate compared to other classes.
Diversity.
We examine two app diversity features: the number of app signers and the number of app categories. The number of app signers represents a reliable risk indicator: users with apps belonging to 51–75 publishers have 4 times the probability of reporting malicious encounters compared to those installing apps from less than 25 publishers. The risk is 9 times higher when compared to users with apps from more than 75 publishers. The risk increase is much more pronounced for publisher diversity than for app volume, likely because installing many apps from benign publishers does not lower the security posture. Surprisingly, the number of app categories negatively correlates with malware encounter risk. Previous work has shown that the Play market hosts a smaller fraction of malicious apps [29]. Thus, this result could be explained by the high number of apps (47%) that are not available in the Play market and thus are uncategorized.
Updates.
Previous studies measured the impact of patching speed on encountering malware on Windows hosts [7]. To examine this risk factor in Android, we measure for each device the ratio between the number of distinct package names and the number of APKs installed. A ratio of 1 indicates a single version for each app, i.e., a low update rate. Ratios close to 0 indicate users who maintain an up-to-date device with multiple versions for each app. We consider the following four update rate levels (i.e., bins) based on the inverse of the ratio: High (), Medium (), Low (), Very Low (). The results reflect a steady risk increase as the update rate decreases. Frequent software updates can lower the risk of a malicious encounter by over 50%.
Distribution.
A recent study measured that 3.2% of the apps installed from alternative markets were PUA or malware [29]. We include as a feature the fraction of apps installed from alternative markets so that it can be compared with other feature classes. Indeed, this feature represents one of the most indicative risk factors. Downloading more than 75% of apps from alternative markets increases the risk of a malicious encounter 12 times. We also examine a second feature which counts the number of alternative markets in the device. We find negligible difference when comparing devices with zero alternative markets (i.e., only the Play market) and those with a single alternative market. This indicates that the often pre-installed device vendor market does not significantly increase user risk. On the contrary, when more than four alternative markets are installed, the risk increases 12 times indicating the existence of alternative markets with much higher risk.
Reputation.
To capture reputation we use the app prevalence, i.e., the number of devices where the app has been installed. We uniformly split the prevalence interval into 4 bins and assign them prevalence labels Very High, High, Medium and Low. The results show that using popular apps lowers the risk of a malicious encounter, but the decrease is very small. Compared to other feature classes, app reputation correlates less with the chance of a malicious encounter.
Geography.
Prior work has shown that the number and types of malicious software that hosts encounter greatly vary across countries [11, 63, 51, 10]. We examine two geographical features: the number of countries each device connects from and the user’s continent. The number of countries a user connects from increases the risk in all three models. In particular, users connecting from more than 5 countries have a risk of being exposed to malicious apps over two times higher than users always connecting from the same country. Such users may be exposed to threats that are specific to some geographical locations such as Brazilian banking trojans [10] or malware that may not be distributed to specific countries (e.g., Russia) [11]. It is worth noting that such users may include privacy-sensitive users that use a virtual private network (VPN) to connect to the Internet, and due to the VPN usage may be exposed to threats they may not otherwise encounter.
Finally, we examine risk differences when connecting from different continents. The reference bins for each continent are users that do not connect from that continent. Africa and South America are the two continents with a higher risk than their baseline. Previous work has measured higher malware encounter risk for African desktops [37], which we confirm as well for Android devices. On the other hand, there is a positive trend for users connecting from Oceania, North America, and Europe, whose risk is 40% to 60% lower than their baseline.
Summary: The diversity of publishers signing the apps and the use of alternative markets are the highest risk factors for Android users. Other factors such as app update rate, device usage, app prevalence, and geographical location are also important to define Android user risk. Furthermore, there are significant risk differences among users in different bins with respect to the same factor.
5 Profile-Based Risk Analysis
As shown in Section 4, there are significant differences in risk among users with respect to the same risk factor. In this section, we investigate whether such risk differences may be due to user interests, i.e., users with common interests may share similar risk behaviors. To this end, we propose a profile-based risk analysis that first groups users based on shared interests and then examines differences between selected user profiles. Section 5.1 details the user profile creation and Section 5.2 the profile-based risk analysis.
| Category | Devices | Apps | Malicious | Threshold |
|---|---|---|---|---|
| APKs | ||||
| Communication | 95.37% | 0.50% | 0.66% | 9 |
| Tools | 94.48% | 1.45% | 1.89% | 16 |
| Productivity | 88.61% | 0.84% | 0.81% | 12 |
| Entertainment | 81.72% | 1.41% | 1.58% | 8 |
| Social | 77.98% | 0.46% | 3.61% | 5 |
| Music and audio | 77.90% | 1.36% | 1.58% | 6 |
| Shopping | 75.49% | 0.70% | 0.25% | 8 |
| Finance | 73.29% | 0.76% | 0.38% | 8 |
| Travel and local | 67.12% | 0.78% | 0.40% | 7 |
| Video players | 66.59% | 0.15% | 1.96% | 4 |
| Game | 65.84% | 2.97% | 4.07% | 14 |
| Photography | 65.66% | 0.47% | 3.12% | 5 |
| News and magazines | 65.11% | 0.52% | 0.63% | 5 |
| Lifestyle | 63.51% | 1.48% | 0.90% | 6 |
| Maps and navigation | 54.53% | 0.34% | 0.75% | 4 |
| Books and reference | 50.89% | 1.18% | 3.39% | 4 |
| Health and fitness | 49.75% | 0.86% | 1.37% | 4 |
| Business | 46.11% | 1.60% | 0.34% | 4 |
| Food and drink | 39.96% | 0.71% | 0.27% | 4 |
| Education | 38.37% | 2.29% | 2.18% | 4 |
| Personalization | 35.94% | 1.05% | 2.02% | 3 |
| Weather | 34.96% | 0.09% | 0.83% | 3 |
| Sports | 25.36% | 0.45% | 0.91% | 3 |
| Medical | 17.42% | 0.38% | 0.65% | 2 |
| Auto and vehicles | 15.71% | 0.22% | 0.88% | 2 |
| Comics | 12.12% | 0.05% | 1.57% | 2 |
| House and home | 9.73% | 0.14% | 0.45% | 2 |
| Libraries and demo | 8.41% | 0.06% | 0.81% | 2 |
| Art and design | 7.24% | 0.18% | 5.87% | 2 |
| Events | 3.62% | 0.15% | 0.10% | 2 |
| Dating | 2.65% | 0.05% | 0.46% | 2 |
| Parenting | 2.51% | 0.04% | 0.91% | 2 |
| Beauty | 2.30% | 0.13% | 1.38% | 2 |
5.1 Creating the Profiles
Prior work has inferred user interests by applying unsupervised machine learning (ML) to cluster users with similar installed apps [47, 66, 46]. Unfortunately, the black-box nature of ML techniques makes it difficult to understand what type of user each cluster represents. Thus, those works typically analyze selected clusters for which the authors can come up with an easy-to-interpret explanation. In contrast, we assume that users that install multiple apps from the same category in the Play market (e.g., Games, Finance) have a shared interest in the category and thus an easy-to-interpret common profile (e.g., gamer, investor). To determine if a device exhibits an interest in a category, we select a threshold number of installed apps corresponding to a device being above the 10th percentile of all devices installing apps from the category. For example, 10.02% of devices have installed at least 13 games while 9% of devices have installed at least 14 games. Thus, 14 is selected as the threshold for the Game category as a device with at least 14 games installed is in the top 10% of its category, and thus its owner is likely a gamer.
Table 3 shows the prevalence of each Play market category in our dataset using two metrics: the percentage of devices with at least one app installed from the category and the fraction of all apps available in the Play market that belong to the category. The third column reports the fraction of malicious APKs and serves as an indicator of how much a category may be targeted by malicious developers. The rightmost column captures the threshold for the category. For the smallest categories (i.e., Dating, Parenting, Beauty) the threshold would be one app, which would be too sensitive to noise. For these small categories, we raise the threshold to two. For the interested reader, Table 11 in the Appendix reports the percentage distribution of devices installing apps for each category, which was used for selecting the thresholds.
We build single-category profiles for users with a single interest and multi-category profiles for users with multiple interests. We first build 33 single-category profiles, one for each Play category. Devices in a single-category profile exhibit only interest in that category (i.e., other category thresholds are not reached). We handle users with multiple interests by building multi-category profiles. In particular, we build 528 two-category profiles, each for a combination of two categories. For example, the Games--Finance profile captures devices that are above the 10th percentile of Games installations and also of Finance apps installations, but not above the 10th percentile for any other category. The more shared interests in a profile, the less devices satisfying the profile. We avoid building profiles with more than two categories since they would represent too few devices —e.g., there are only 8 two-category profiles with more than 10k devices— and would be more difficult to interpret. Instead, we create an additional Mixed profile that consists of devices with more than two interests. We also build an additional Average users profile that consists of devices with an average (i.e., within one standard deviation from the mean) number of apps in each category and use it as a baseline in the analysis.
In total, our analysis covers 563 profiles. We assign a single-category profile to 20.7% of the devices in the filtered dataset and a two-category profile to 11.3%. The average users profile covers 7.0% of the devices and the mixed profile another 5.5%. The remaining 55.5% of devices are not profiled and thus are excluded from the profile-based experiments.
One caveat in our profiles is that only 53% of all apps in the filtered dataset are available in the Play market. Thus, we may miss user interests that only manifest in uncategorized apps. However, the vast majority of devices has apps from the Play market with a mean of 47 (median of 37) Play apps per device. Figure 3 in the Appendix shows the whole distribution of Play market apps per device.
| Profile | Size | Encounter | Malware | PUA | Malicious APKs | Malicious Encounters |
|---|---|---|---|---|---|---|
| malicious apps | only | only | from profile apps | from profile apps | ||
| Social-Video Players | 17,184 | 6,034 (35.11%) | 7.41% | 81.27% | 23.42% | 2,248 (37.26%) |
| Entertainment-Game | 16,998 | 5,354 (31.50%) | 9.30% | 77.94% | 46.12% | 2,909 (54.33%) |
| Photography-Video Players | 10,993 | 3,123 (28.41%) | 10.79% | 78.67% | 24.32% | 955 (30.58%) |
| Video Players | 106,723 | 27,543 (25.81%) | 8.73% | 79.29% | 17.25% | 8,245 (29.94%) |
| Education-Game | 14,769 | 3,633 (24.60%) | 9.33% | 77.92% | 27.01% | 1,542 (42.44%) |
| Comics-Game | 13,549 | 3,317 (24.48%) | 8.38% | 81.49% | 40.62% | 1,646 (49.62%) |
| Game | 235,434 | 48,903 (20.77%) | 10.53% | 79.22% | 34.97% | 21,100 (43.15%) |
| Mixed | 470,383 | 93,407 (19.86%) | 10.92% | 79.70% | ||
| Books-Education | 12,024 | 2,267 (18.85%) | 12.31% | 77.06% | 6.63% | 297 (13.10%) |
| Social | 99,176 | 18,497 (18.65%) | 10.96% | 81.68% | 1.62% | 434 (2.35%) |
| Business-Finance | 16,242 | 3,000 (18.47%) | 14.10% | 78.60% | 12.88% | 410 (13.67%) |
| Average users | 599,483 | 51,885 (8.65%) | 12.01% | 73.14% | ||
| Overall average | 6,846 | 990 (14.55%) | 10.67% | 79.20% | 13.72% | 151 (16.55%) |
5.2 Profile-based risk
We start our profile-based analysis by examining the malicious app encounter rate in each profile. Table 4 lists the top-10 profiles sorted by malicious app encounter rate, (among those with at least 10k devices) and the same data for the Average users and Mixed profiles. For each profile, the table shows the number and fraction of devices that encounter a malicious app (malware or PUA), as well as the fraction that only encounter malware and that only encounter PUA. The right part of the table shows the fraction of malicious APKs from the same categories of the profile, and the number and fraction of devices with at least one encounter due to apps in the profile categories, e.g., the fraction of devices from the Entertainment-Game profile with encounters due to either games or entertainment apps. The last row of the table provides aggregated statistics for all 563 profiles including those that have less than 10k users. Table 12 in the Appendix contains similar statistics extended to all the profiles with at least 10k devices. We also release in an anonymized repository the complete statistics for all the 563 profiles [2].
The average malicious app encounter across all profiles is 14.55%, almost two times higher than the one of the Average users (8.65%). Similarly, the malicious app encounter rate for the top-10 profiles of Table 4 is more than double the one of the Average users, i.e., from 35.11% for Social-Video Players to 18.47% for Business-Finance. On the other side of the spectrum, profiles such as Comics have much fewer encounters (5.41%) than the Average users (8.65%), even though the number of devices in the profile is considerably high (36.4k). As shown in Table 3, this can be explained by the fact that Comics apps are less often detected as malicious with respect to other categories, such as Game, Art and design, and Social. Nevertheless, the profile Comics-Game reveals a much higher encounter rate (24.48%) than the overall average (14.55%), underlining the fact that users’ interests in multiple categories can amplify their risk. These results highlight that one-size-fits-all cybersecurity solutions might not be suitable for everyone since users with specific interests (e.g., games, video, social) may be exposed to significantly higher risks. In terms of the threat class, all profiles are affected by PUA roughly seven to eight times more than by malware.
| Profile | Top-categories | |||
|---|---|---|---|---|
| 1st | 2nd | 3rd | 4th | |
| Social-Video Players | Video Players (50.46%) | Tools (21.8%) | Game (5.68%) | Entertainment (3.49%) |
| Entertainment-Game | Game (55.54%) | Entertainment (17.99%) | Tools (7.98%) | Music (5.18%) |
| Photography-Video Players | Video Players (26.33%) | Photography (24.07%) | Tools (17.84%) | Music (6.74%) |
| Video Players | Video Players (46.9%) | Tools (19.27%) | Game (7.53%) | Music (4.44%) |
| Education-Game | Game (56.05%) | Tools (10.62%) | Entertainment (6.03%) | Video Players (5.08%) |
| Comics-Game | Game (67.02%) | Video Players (8.61%) | Tools (7.51%) | Music (5.12%) |
| Game | Game (64.04%) | Tools (8.02%) | Entertainment (7.56%) | Video Players (5.42%) |
| Mixed | Tools (25.37%) | Game (13.51%) | Video Players (10.00%) | Music (8.35%) |
| Books-Education | Tools (23.64%) | Game (11.2%) | Education (10.47%) | Video Players (9.38%) |
| Social | Tools (31.0%) | Video Players (22.05%) | Game (9.83%) | Music (5.06%) |
| Business-Finance | Tools (31.08%) | Finance (13.2%) | Business (11.58%) | Video Players (8.72%) |
| Average users | Tools (30.35%) | Game (16.83%) | Video Players (16.23%) | Entertainment (5.90%) |
| Overall average | Tools (22.19%) | Game (12.58%) | Music (7.27%) | Video Players (7.18%) |
Some app categories may be targeted more frequently by malicious developers than others, and thus have a larger fraction of malicious apps. For example, the last column of Table 3 shows that 5.87% and 4.07% of all the APKs in the Art and design and Game categories are flagged as malicious. Prior work also identifies the Game category as the one in the Play market that hosts the most malicious APKs [59]. Thus, users whose interests fall into those highly abused categories, have a higher risk of encountering malware. Indeed, according to the last column in Table 4, more than 50% of users in the Entertainment-Game profile encounter malware from one of those two categories. Overall, 5 of the top-10 profiles in Table 4, have encounters from malicious apps in their categories at least twice higher than the average of all profiles (16.55%), indicating that users in those profiles have a higher intrinsic risk due to their interests.
We further investigate the source of the risk by identifying for each profile the top-4 application categories where the most number of malicious apps come from. In Table 5, we report the results for the same set of 12 profiles identified in Table 4. We instead tabulate results for all the profiles with at least 10k users in Table 13 of the Appendix, and we release the full measurement on all the profiles in an anonymized repository [2]. On average, the biggest offenders are Tools, Game, Music, and Video Players. The Tools category is the most prevalent threat source for 5 of of the profiles in Table 5, and among the top-4 for all profiles with more than 10k devices (Table 13). Other categories frequently appearing in the top-4 are Game (86% of the profiles) and Video Players (59%). However, for some profiles, their defining categories contribute the most. In particular, 211 (37%) over all generated profiles and 12 of the 35 profiles with at least 10k users, have their own category as the top threat source. For example, the Health and Fitness, Photography, Weather, Finance, and Shopping profiles have a higher risk of malware encounters due to their interests, rather than due to the categories of apps that are more likely to be bringing malicious apps compared to the others.
| Feature | Social | Entertainment | Photography | Video | Education | Comics | Game | Mixed | Books | Social | Business | Average |
|---|---|---|---|---|---|---|---|---|---|---|---|---|
| Video Players | Game | Video Players | Players | Game | Game | Education | Finance | users | ||||
| Apps | 1.55 | 1.02 | 0.71 | 1.19 | 1.11 | 1.06 | 1.48 | 0.69 | 1.68 | 1.27 | 0.86 | 1.39 |
| Activitydays | 1.88 | 1.33 | 0.98 | 1.66 | 1.03 | 1.31 | 1.25 | 1.32 | 1.04 | 1.46 | 1.13 | 1.50 |
| Signers | 1.42 | 3.91 | 3.60 | 2.53 | 4.15 | 3.47 | 3.05 | 3.26 | 2.53 | 2.38 | 3.28 | 3.64 |
| AppCateg. | 0.79 | 0.65 | 0.41 | 0.42 | 0.78 | 0.56 | 0.70 | 0.47 | 0.67 | 0.52 | 0.85 | 0.41 |
| Updaterate | 1.15 | 1.87 | 1.48 | 2.21 | 1.79 | 3.23 | 2.33 | 1.70 | 1.43 | 1.48 | 1.05 | 3.28 |
| %AppsAM | 1.71 | 2.82 | 3.72 | 2.10 | 33.08 | 3.41 | 6.53 | 26.78 | 19.48 | 1.88 | 11.38 | 4.14 |
| Alt.Markets | 2.94 | 2.62 | 4.41 | 2.44 | 3.46 | 3.63 | 2.63 | 2.36 | 1.65 | 1.65 | 1.78 | 1.28 |
| AppPrev. | 0.63 | 0.77 | 0.85 | 0.87 | 0.77 | 0.80 | 0.75 | 0.70 | 0.69 | 0.48 | 0.73 | 0.61 |
| Countries | 0.40 | 1.17 | 1.15 | 1.55 | 1.08 | 1.03 | 1.09 | 1.18 | 1.15 | 0.30 | 1.41 | 1.26 |
In addition, we perform profile-based odds ratio analysis on the same set of selected profiles of Tables 4 and 5 and report the results in Table 6. The same results for the profiles larger than 10k devices are reported in Table 14 of the Appendix. Similarly to Section 4, we bucketize each feature into quartiles, however here our odds ratio analysis is performed separately for each profile. Due to space constraints, we do not report detailed risk analysis results separately for PUA and malware, PUA-only, and malware-only encounters. Instead, Table 6 summarizes the results comparing the risk estimation of the second bin with the last bin. Since the sizes of the bins are different among profiles, it would not be accurate to do comparisons among the absolute numbers presented in the Table. Our goal here is to identify trends for each profile. Cells with underlined values correspond to opposite trends compared to our findings in Section 4. Cells with bold values, on the other hand, represent features with significant impact on users risk.
One of our findings in Section 4 is that as volume-based features (e.g., total number of apps, active days) increase, so do the odds of a malicious encounter. While this remains the same for most user profiles, there are three profiles (Photography-Video Players, Mixed, Business-Finance) for which we observe the opposite trend with a slight difference. We observe a similar phenomenon for the two profiles related to social media (Social and Social-Video Players), in which the odds of malicious encounter decrease as the number of countries the device connected from increases.
This analysis further illustrated that risk profiles significantly vary for users with particular interests. In some cases, we observe reverse correlations for the same features among profiles as well as dramatically different impact of the same features on different profiles. The most evident examples of the latter are the Education-Game, Mixed, and Books-Education, profiles for which the fraction of the apps installed from alternative markets can increase the risk up to 33 times with respect to those that install less in their class.
Summary: The per-profile risk analysis results suggest that the risk profiles of the investigated categories are significantly different compared to the global risk analysis results. Although in general they share similar trends, we observe opposite trends for some of the features. Furthermore, the contribution of some of the indicators such as the number of apps installed from alternative markets can be much more significant for some profiles while not very important for the others.
| Profile | Whole-population model | Per-profile models | Avg improvement | ||||
|---|---|---|---|---|---|---|---|
| PUA or | Malware | PUA | PUA | Malware | PUA | ||
| Malware | only | only | Malware | only | only | ||
| Social-Video Players | 50.40% | 64.64% | 48.30% | 82.43% | 78.35% | 69.23% | 22.22% |
| Entertainment-Game | 50.10% | 62.89% | 49.80% | 68.00% | 63.16% | 61.29% | 9.89% |
| Photography-Video Players | 53.00% | 63.23% | 61.27% | 66.27% | 80.00% | 62.90% | 10.56% |
| Video Players | 48.50% | 50.10% | 53.10% | 73.20% | 82.16% | 67.24% | 23.63% |
| Education-Game | 45.80% | 70.00% | 51.10% | 74.04% | 62.90% | 69.47% | 13.17% |
| Comics-Game | 48.00% | 70.11% | 49.70% | 75.76% | 77.27% | 81.25% | 22.16% |
| Game | 53.50% | 49.60% | 48.80% | 64.38% | 64.22% | 72.22% | 16.31% |
| Mixed | 50.30% | 51.40% | 52.90% | 72.16% | 68.42% | 67.03% | 17.67% |
| Books-Education | 61.78% | 63.98% | 61.61% | 80.95% | 70.00% | 81.58% | 15.05% |
| Social | 52.30% | 49.60% | 47.30% | 54.76% | 75.29% | 70.21% | 17.02% |
| Business-Finance | 49.60% | 58.67% | 62.33% | 62.12% | 53.85% | 70.59% | 5.32% |
| Average users | 51.90% | 49.50% | 51.50% | 84.35% | 83.56% | 77.91% | 30.97% |
| Overall average | 52.19% | 62.34% | 52.89% | 69.84% | 70.14% | 71.65% | 14.74% |
6 Multi-Feature Risk Analysis
In previous sections, we have shown that particular users’ interests result in different risk profiles and that risk can significantly vary among users. We believe our findings can assist the security community and the designers of security solutions on providing tailored protections to users who need it the most. In this respect, we provide a concrete example of how our profiling strategy and the differences among profiles impact the classification task of devices that encounter malicious apps. To this end, we compare two machine learning (ML) classification approaches: using a one-size-fits-all classifier trained on the whole population (i.e., without any profiling) and using per-profile classifiers, each trained on a profile’s population. For both approaches, we create three classifiers for identifying devices that install (1) any malicious app (i.e., malware or PUA), (2) malware, and (3) PUA.
For the whole-population classifier, we use 86 features: 15 features correspond to those discussed in Section 4 with the Countries feature being one-hot encoded, 37 boolean features that capture whether the device belongs to one of the profiles with more than 10k users discussed in Section 5 and reported in Table 12, 33 features that measure the number of apps installed for each Play market category in Table 3, and one feature capturing the absolute number of uncategorized apps (i.e. Unknown). This classifier outputs a clean state or the presence of malicious installations for each device independently of their profile: we then link back the device to one of the 37 profiles to analyze per-profile performance. The per-profile classifiers use 49 features, the same as the whole-population classifier minus the 37 boolean features that indicate the user profiles.
We select a Random Forest (RF) classifier for the experiments because this learning method produces easier-to-interpret models and because prior work that builds prediction models for cyber incidents has shown it tends to outperform other classifiers (e.g., [7, 34, 48]). We tune the RF hyperparameters by looking at the Out of Bag (OOB) error during the training phase. Our dataset converges by employing tree estimators with as maximum tree depth, and the maximum number of features to consider when splitting each branch being the square root of the number of features.
Since the number of devices for each profile differs, the dataset used to train and test the whole-population model is obtained by sub-sampling each of the profiles and by further balancing the ratio between clean and infected devices. For each model, we sub-sample multiple times and average accuracy results. We use the same users selected at this step for building the per-profile models. Table 10 in the Appendix reports the exact dataset sizes of all models.
Table 7 presents the classification accuracy for both approaches when tested against profiles of Tables 4 and 5. Table 15 in the Appendix is similar but tests all profiles with at least 10k devices. We observe a clear improvement on identifying risky devices when the models are trained per-profile rather than on the whole population: the average classification accuracy for any malicious app encounter (PUA or malware) increases on average from to . This holds for all the profiles and all the threat types, although for some profiles the impact of the profiling is much higher than others. For example, the classification of Average users devices would benefit from a leap in accuracy of over 30% compared to using a one-size-fits-all classifier. In a similar way, a dramatic accuracy improvement happens on the Video Players category where more devices are categorized correctly. The least amount of accuracy improvement occurs for Productivity (0.53%) and Lifestyle (0.38%). For these cases, there is alignment between the accuracy score of the model specifically trained for that population and the one trained on the whole population, although the classification score is always higher in the former case. For these profiles, the classification of clean and devices that encounter malicious apps might be more complicated. This strongly suggests that such populations would benefit even more from specific models (e.g., dividing it into sub-categories, combining them with other categories etc.). We indeed notice an accuracy score barely above the output of a random classifier (i.e., 50%) for 19 of the 37 profiles of Table 15; even worse, the outcome is lower than 50% for 12 profiles when predicting the devices that encounter malware or PUA. Once again, such findings further indicate the need of dedicated methods for those users.
The results also show different accuracy across profiles. For example, Social-Video Players (82.43%), and Books-Education (80.95%) achieve much higher classification accuracies compared to Social (54.76%) and Business-Finance (62.12%) profiles. This might suggest that for some of the identified populations the users installing malicious apps have a more diversified set of features with respect to clean ones, thus helping the classification task. For other profiles with lower accuracy, this difference might not be fully captured by the features at our disposal, thus making it harder to classify the set of clean devices from the rest.
| \CenterstackFeature | |||||||
|---|---|---|---|---|---|---|---|
| rank | \CenterstackUnique | ||||||
| \CenterstackAverage users | \CenterstackMixed | \CenterstackGame | \CenterstackVideo | ||||
| \CenterstackSocial | \CenterstackSocial | Players | |||||
| Video Players | |||||||
| 1st | Signers - 9.76 | Unknown - 19.93 | Avg prev. - 7.56 | Unknown - 16.5 | Unknown - 10.83 | Unknown - 10.83 | Unknown - 11.69 |
| 2nd | Unknown - 8.93 | Avg prev. - 9.92 | Signers - 6.9 | Apps - 8.6 | Signers - 9.02 | Avg prev. - 8.65 | Avg prev. - 11.16 |
| 3rd | % apps AM - 5.61 | Signers - 7.11 | Update rate - 6.19 | Signers - 6.7 | Avg prev. - 7.32 | Days - 6.48 | Apps - 6.76 |
| 4th | Apps - 5.39 | Update rate - 6.91 | Days - 5.89 | Avg prev. - 6.33 | Apps - 6.97 | Apps - 5.64 | Signers - 6.22 |
| 5th | Update rate - 5.15 | Apps - 5.66 | Apps - 4.67 | Update rate - 5.77 | Update rate - 5.78 | Signers - 5.19 | Update rate - 4.64 |
| \CenterstackFeature | |||||||
|---|---|---|---|---|---|---|---|
| rank | \CenterstackEntertainment | ||||||
| \CenterstackBusiness | |||||||
| \CenterstackEducation | |||||||
| \CenterstackComics | |||||||
| \CenterstackBooks | |||||||
| \CenterstackPhotography | |||||||
| \CenterstackOverall | |||||||
| average | |||||||
| 1st | Unknown - 8.82 | Update rate - 7.73 | Unknown - 8.87 | Unknown - 12.78 | Avg prev. - 10.27 | Avg prev. - 8.52 | Unknown - 8.18 |
| 2nd | Signers - 8.57 | Days - 6.97 | Signers - 7.43 | Signers - 7.07 | Unknown - 9.85 | Signers - 7.48 | Avg prev. - 7.51 |
| 3rd | Apps - 7.3 | Avg prev. - 6.78 | Update rate - 7.21 | Apps - 6.45 | Days - 7.54 | Unknown - 6.99 | Signers - 7.1 |
| 4th | Days - 7.07 | Unknown - 5.23 | Apps - 6.68 | Avg prev. - 5.9 | Signers - 7.0 | Apps - 5.52 | Update rate - 5.86 |
| 5th | Game - 6.22 | Apps - 4.82 | Days - 6.09 | Game - 5.85 | % apps AM - 6.97 | Update rate - 5.48 | Apps - 5.39 |
Feature importance.
We also analyze the contribution of individual features for all the trained classifiers. We rank feature importance by assessing the Mean Decrease in Impurity (MDI) and tabulate the average of their relative importance in the three cases (e.g., considering malware, PUA, and malware or PUA) in Table 8 for the top profiles and Table 16 in the Appendix for all the profiles with more than 10k devices. For the whole population classifier, the most contributing features are: signers, uncategorized apps, the percentage of apps from alternative markets, the number of apps, and the update rate. For the per-profile classifiers, important features change for each profile. On average, the number of unclassified apps (i.e., Unknown) is the most important feature, followed by the one reflecting the average application prevalence (i.e., Avg prev.), the diversity of signers (i.e., Signers), the frequency of updates (i.e., Update rate), and the number of installed apps (i.e., Apps). The relevance of different features that are not so characteristic for other profiles explains why the classification accuracy significantly improves when employing a specific model rather than a unique solution that has to generalize on multiple profiles. While the order of the list and magnitude of each feature importance differs significantly among different profiles, we observe that in general the volume- and diversity-based features (e.g., signers, app category and number, days of activity, and average prevalence) remain on the top of the list across profiles.
Summary: The multi-feature risk analysis unveils important differences among profiles when attempting to distinguish clean devices from those that install malicious apps. For some of the profiles, the classification accuracy shows a substantial improvement when employing a dedicated model, often due to the difference importance of features compared to the other profiles. Overall, volume- and diversity-based features are the most relevant indicators across profiles.
7 Discussion and Limitations
Ethical considerations.
The data in the app installation logs comes from human subjects. It is collected by an AV engine installed on Android devices belonging to real users. The telemetry only includes users who voluntarily install the product, accept the company’s privacy policy [41], and opt-in to share their data. Users can revoke their consent at any time by modifying the app settings. Data is anonymized on the device before being sent to a central system. The telemetry data only identifies users through numeric anonymized identifiers that do not enable us to trace back to the originating device or its user. We do not attempt to deanonymize users or to profile specific users focusing instead on aggregated risk profiles.
How our results help the security community.
The mid-term goal of our work is to promote more personalized security. But, our results can also be applied in the short term. One concrete application is to adjust the AV engine settings according to the risk profile. For example, the frequency of the scan and the scan level (i.e., whether all files are scanned or only a subset) could be increased for devices exhibiting profiles with a high risk of malicious encounters. Another application is to deactivate unneeded security warnings, which create habituation that desensitizes users to other important warnings [31]. For example, if a device has a Parenting profile, the AV engine could avoid notifying the user about parental-control apps installed, while keeping the notifications for other users since such apps can be abused as stalkerware [38]. The profiles could also be used to provide personalized security “nudges”, i.e., warnings that try to entice a user action without forcing the user. In Android, AV engines cannot remove detected malicious apps by themselves (unless pre-installed with the required privilege) and thus nudge users to remove the detected apps. However, such nudges are not currently effective, as recent work shows that Android malware and PUA is only removed on average 24 days after the first detection [50]. Previous work has shown that personalization can improve security nudges [25, 33, 62] and the inferred profiles could be used towards that goal.
Device-user mapping.
A user could own multiple devices and a device could be shared among multiple users. When a user has multiple devices in the dataset, our analysis will assign profiles separately to each device, and if the devices are used for different tasks, the analysis will infer different profiles for each device, e.g., one for the gaming device, another for the work device. Since the device belongs to a single user, the inferred profile will be correct, but we will miss the fact that the user has other interests that manifest in the other device. Prior work has shown that mobile phone sharing is common within households [9, 35] and in certain geographical locations such as South Asia [4, 44, 3, 6] and Africa [39]. When a device is shared among multiple users, and each user installs its own apps, the inferred profiles may not uniquely correspond to one user, e.g., an inferred Games--Finance profile may be due to one user of the device being a gamer and another being an investor. It is also possible that a profile is inferred due to the accumulation of partial interests from multiple users, especially for app categories with low thresholds. We acknowledge this limitation, although it is worth noting that only 0.25% of devices in the filtered dataset come from Bangladesh, Pakistan, and Kenya and that the security vendor clients are biased towards North America, Europe, and Japan, where device sharing is not as popular as in South Asia and Africa. In addition, devices shared in households may have a dominant owner that the inferred profiles correspond to.
Profile interpretability vs coverage.
In contrast to previous ML clustering approaches our profiles are easy to interpret since they capture devices exhibiting one or two interests based on the categories of installed apps. The downside is that we can only profile one third of the devices. We favor interpretability over device coverage because we believe that personalized security requires a good understanding of the user, but personalization does not necessarily need to be applied to every user (e.g., average users).
Selection bias.
Our dataset comes from a single security vendor and thus has a selection bias towards the geographical distribution of the security vendor’s users. While the dataset has great geographical visibility (i.e., users from 243 countries) some countries like China or Indonesia may be under-represented with respect to their population. The dataset only covers users that have an AV engine installed and have explicitly enrolled in data sharing. Other users, e.g., those that do not invest in security solutions or those that decline the collection due to privacy concerns, may have different risk profiles that we cannot analyze. Our data captures only a partial view of user behavior. It captures whether the user installed an app, but does not capture how frequently the app is used, and it does not cover other user behaviors such as Web browsing.
Analysis biases.
Our VT querying, app categorization, and app filtering may have introduced other biases. First, due to VT API limits, we could not query all apps in the dataset. This prevents us from detecting all malicious encounters and thus we underestimate the malicious encounter rate for each profile. However, due to the size of our dataset and the query process, we believe that the relative encounter rate among profiles should not be significantly affected. Second, we categorize over 500K apps available on the Play market on February 2020. But, these are only 53% of all apps in the filtered dataset. This prevents us from detecting additional profiles that may only manifest through apps distributed through alternative vectors. Still, devices in the filtered dataset have a mean of 47 categorized apps (median of 37), allowing us to identify a profile for one third of the 8.9M devices. We plan to address how to categorize apps not in the Play market in future work. Finally, we filter apps that are not installed from markets as a proxy for removing apps whose installation is not rooted on a user decision. Such filtering may incorrectly remove user-installed apps when a market is missing in our list of 122 market package names and if the user installed the app through other vectors such as web downloads or the ADB bridge. However, after the filtering, our dataset is still large containing 8.9M devices and 2.2M apps.
8 Related Work
Security risk analysis and prediction
. Multiple works have focused on the prediction of security incidents on different platforms. Canali et al. [13] analyzed the browsing behavior of 160k users and crafted 74 features for predicting users that visit malicious websites. Sharif et al. [48] proposed a similar system, that instead of long-term prediction, is capable of predicting exposure to malicious content seconds before the actual exposure. Their system is evaluated using HTTP traffic from 20.6K users.
Shen et al. [49] proposed a system for predicting the installation of malicious applications on Android by observing the apps installed by the user as well as from users with similar behaviors. Their system is evaluated on a dataset of 1.8M real Android users. Other works focus on the prediction of malware encounters on Windows. Bilge et al. [7] propose RiskTeller, a system that predicts malware encounters on Windows enterprise hosts using 89 features.The system is evaluated on telemetry data collected from 600K machines from 18 enterprises. This study also uses classifiers for predicting malicious encounters on Android using similar features. But, our goal is not to improve the state of the art in terms of prediction accuracy. Instead, we build various classifiers for users of specific profiles (e.g., gamers, investors) and do comparisons among them as well as against a generic classifier to identify the differences in the importance of features.
Other research lines analyze the various risk factors affecting users’ security posture. Simoiu et al [51] analyzed 1.2 billion phishing and malware attacks against Gmail users and explore risk correlations for six factors, country of access, user age, security posture, prior risk exposure, type of device, and email activity. Similar to this study, we investigate correlations of 10 risk factors on 8.6M Android users. Kotzias et al. [29] analyzed the unwanted apps prevalence (malware and PUA) and distribution on 12M Android devices. Their study showed that Play market is the largest app distribution vector of both benign and unwanted apps, and installations from alternative markets are on average five times riskier than Play market with varying risks depending on the alternative market. Our work confirms that apps installed from alternative sources rather than the official Play market represent one of the most indicative risk factors of our model. However, in this work, in addition to distribution-related risk factors, we analyze five more types of risk factors related to volume, app diversity, updates, reputation, and geography.
Security posture of at-risk populations.
Arguments in favor of specialized solutions for vulnerable and at-risk populations have shifted the security research community interest towards that direction [57]. Warford et al. [60] recently analyzed prior work on the digital-safety experiences of at-risk populations and developed a framework of contextual risk factors and protective practices. Consolvo et al. [16] conducted a qualitative analysis of the security issues of 28 people involved with the US political campaigns and provided recommendations on security improvements. Similarly, McGregor et al. [36] analyzed the security practices of 15 journalists from the US and France via semi-structured interviews. Other works have followed a similar qualitative approach to analyze the security and privacy needs of vulnerable populations like human trafficking survivors [15], victims of intimate partner violence [19], residents at homeless shelters [52], undocumented immigrants [24], and proposed recommendations for improving the ways that such groups interact with technology. At last, some studies focused on the needs of specific age groups. Frik et al. [20] identified common threat models, misconceptions, and mitigation strategies for older adults (65+). Wisniewski et al. [61] performed an analysis of the online risk experiences of 68 teens for two months. Lastdrager et al. [32] focused on training children of Dutch primary school to distinguish phishing from non-phishing pages. Inspired by these studies, we perform an empirical quantitative analysis of risk factors for different profiles of users and provide further evidence that one-size-fits-all cybersecurity solutions might not be suitable for everyone since users with specific interests (e.g., games, social, education) may be exposed to significantly higher risks.
Android User profiling.
An extensive body of prior work attempts to profile Android users for different purposes [65]. These studies analyze the smartphone interactions of users to learn various characteristics about them like demographic attributes such as gender and age [64, 67, 46, 47], personal interests [66], psychological status like the users stress levels [22], and lifestyle related information [26]. It is common for those studies to do their profiling using the list of installed apps [47, 66, 46] but also using app usage information like the number of times an app is launched or the amount of time spent on each app [17]. In our study, we also use the list of installed apps for creating user profiles. But, instead of predicting specific characteristics of users, we perform a comparison of the security posture among profiles and the most important risk factors.
9 Conclusions
Over the past years, a growing number of researchers have studied the digital-safety needs of particular user communities, highlighting the inadequacy of current one-size-fits-all security solutions. These works are usually qualitative and limited in size. To fill this gap, we perform a quantitative risk analysis that compares the risk of encountering malicious apps (malware and PUA) for different profiles of Android users. Leveraging telemetry data of a popular security vendor, we analyze the impact of different risk indicators. We build easy-to-interpret user profiles and show how there exist risk differences across users due to their interests. Finally, we identify important differences among profiles when attempting to distinguish clean devices from those that install malicious apps. We hope our findings can motivate the security community to address the security and privacy needs of particular at-risk communities and offer more personalized solutions.
References
- [1] How much time does the average american spend on their phone in 2021, 2021. https://techjury.net/blog/how-much-time-does-the-average-american-spend-on-their-phone/.
- [2] Malicious app encounter rate for all the identified profile. https://anonymous.4open.science/r/Usenix_2023-86A2/README.md, 2022.
- [3] Syed Ishtiaque Ahmed, Md Romael Haque, Irtaza Haider, Jay Chen, and Nicola Dell. “Everyone Has Some Personal Stuff”: Designing to Support Digital Privacy with Shared Mobile Phone Use in Bangladesh. In Proceedings of the 2019 CHI Conference on Human Factors in Computing Systems, pages 1–13, 2019.
- [4] Syed Ishtiaque Ahmed, Steven J Jackson, Maruf Zaber, Mehrab Bin Morshed, Md Habibullah Bin Ismail, and Sharmin Afrose. Ecologies of use and design: individual and social practices of mobile phone use within low-literate rickshawpuller communities in urban bangladesh. In Proceedings of the 4th Annual Symposium on Computing for Development, pages 1–10, 2013.
- [5] Taslima Akter, Bryan Dosono, Tousif Ahmed, Apu Kapadia, and Bryan Semaan. "i am uncomfortable sharing what i can’t see": Privacy concerns of the visually impaired with camera based assistive applications. In USENIX Security Symposium, 2020.
- [6] Mahdi Nasrullah Al-Ameen, Huzeyfe Kocabas, Swapnil Nandy, and Tanjina Tamanna. “We, three brothers have always known everything of each other”: A Cross-cultural Study of Sharing Digital Devices and Online Accounts. Proceedings on Privacy Enhancing Technologies, 2021(4):203–224, 2021.
- [7] Leyla Bilge, Yufei Han, and Matteo Dell’Amico. Riskteller: Predicting the risk of cyber incidents. In ACM SIGSAC Conference on Computer and Communications Security, 2017.
- [8] Eduardo Blázquez, Sergio Pastrana, Álvaro Feal, Julien Gamba, Platon Kotzias, Narseo Vallina-Rodriguez, and Juan Tapiador. Trouble over-the-air: An analysis of fota apps in the android ecosystem. In IEEE Symposium on Security and Privacy (SP), 2021.
- [9] Susanne Bødker and Ellen Christiansen. Poetry in motion: appropriation of the world of apps. In Proceedings of the 30th European conference on cognitive ergonomics, pages 78–84, 2012.
- [10] Marcus Botacin, Hojjat Aghakhani, Stefano Ortolani, Christopher Kruegel, Giovanni Vigna, Daniela Oliveira, Paulo Lício De Geus, and André Grégio. One size does not fit all: a longitudinal analysis of brazilian financial malware. ACM Transactions on Privacy and Security (TOPS), 24(2):1–31, 2021.
- [11] Juan Caballero, Chris Grier, Christian Kreibich, and Vern Paxson. Measuring Pay-per-Install: The Commoditization of Malware Distribution. In USENIX Security Symposium, 2011.
- [12] A Colin Cameron and Pravin K Trivedi. Regression analysis of count data, volume 53. Cambridge University Press, 2013.
- [13] Davide Canali, Leyla Bilge, and Davide Balzarotti. On the effectiveness of risk prediction based on users browsing behavior. In Proceedings of the 9th ACM symposium on Information, computer and communications security, pages 171–182, 2014.
- [14] Rahul Chatterjee, Periwinkle Doerfler, Hadas Orgad, Sam Havron, Jackeline Palmer, Diana Freed, Karen Levy, Nicola Dell, Damon McCoy, and Thomas Ristenpart. The spyware used in intimate partner violence. In IEEE Symposium on Security and Privacy, 2018.
- [15] Christine Chen, Nicola Dell, and Franziska Roesner. Computer security and privacy in the interactions between victim service providers and human trafficking survivors. In USENIX Security Symposium, 2019.
- [16] Sunny Consolvo, Patrick Kelley, Tara Matthews, Kurt Thomas, Lee Dunn, and Elie Bursztein. "why wouldn’t someone think of democracy as a target?": Security practices & challenges of people involved with u.s. political campaigns. In USENIX Security Symposium, 2021.
- [17] Trinh Minh Tri Do, Jan Blom, and Daniel Gatica-Perez. Smartphone usage in the wild: a large-scale analysis of applications and context. In Proceedings of the 13th international conference on multimodal interfaces, pages 353–360, 2011.
- [18] Kasra EdalatNejad, Wouter Lueks, Julien Pierre Martin, Soline Ledésert, Anne L’Hôte, Bruno Thomas, Laurent Girod, and Carmela Troncoso. Datasharenetwork: A decentralized privacy-preserving search engine for investigative journalists. In USENIX Security Symposium, 2020.
- [19] Diana Freed, Sam Havron, Emily Tseng, Andrea Gallardo, Rahul Chatterjee, Thomas Ristenpart, and Nicola Dell. "is my phone hacked?" analyzing clinical computer security interventions with survivors of intimate partner violence. Proc. ACM Hum.-Comput. Interact., 3(CSCW), nov 2019.
- [20] Alisa Frik, Leysan Nurgalieva, Julia Bernd, Joyce Lee, Florian Schaub, and Serge Egelman. Privacy and security threat models and mitigation strategies of older adults. In Symposium on Usable Privacy and Security, 2019.
- [21] Julien Gamba, Mohammed Rashed, Abbas Razaghpanah, Juan Tapiador, and N. Vallina-Rodriguez. An analysis of pre-installed android software. In IEEE Symposium on Security and Privacy, 2020.
- [22] Yusong Gao, He Li, and Tingshao Zhu. Predicting subjective well-being by smartphone usage behaviors. In HEALTHINF, pages 317–322, 2014.
- [23] Arup Kumar Ghosh, Charles E. Hughes, and Pamela J. Wisniewski. Circle of Trust: A New Approach to Mobile Online Safety for Families. 2020.
- [24] Tamy Guberek, Allison McDonald, Sylvia Simioni, Abraham H. Mhaidli, Kentaro Toyama, and Florian Schaub. Keeping a Low Profile? Technology, Risk and Privacy among Undocumented Immigrants. 2018.
- [25] Marian Harbach, Markus Hettig, Susanne Weber, and Matthew Smith. Using personal examples to improve risk communication for security & privacy decisions. In Proceedings of the SIGCHI conference on human factors in computing systems, pages 2647–2656, 2014.
- [26] Chakajkla Jesdabodi and Walid Maalej. Understanding usage states on mobile devices. In Proceedings of the 2015 ACM international joint conference on pervasive and ubiquitous computing, pages 1221–1225, 2015.
- [27] Platon Kotzias, Leyla Bilge, and Juan Caballero. Measuring PUP Prevalence and PUP Distribution through Pay-Per-Install Services. In USENIX Security Symposium, 2016.
- [28] Platon Kotzias, Leyla Bilge, Pierre-Antoine Vervier, and Juan Caballero. Mind your Own Business: A Longitudinal Study of Threats and Vulnerabilities in Enterprises. In Network and Distributed Systems Security Symposium, 2019.
- [29] Platon Kotzias, Juan Caballero, and Leyla Bilge. How Did That Get In My Phone? Unwanted App Distribution on Android Devices. In Proceedings of the 42nd IEEE Symposium on Security and Privacy, 2021.
- [30] Platon Kotzias, Srdjan Matic, Richard Rivera, and Juan Caballero. Certified PUP: Abuse in Authenticode Code Signing. In ACM Conference on Computer and Communication Security, 2015.
- [31] Kat Krol, Matthew Moroz, and M Angela Sasse. Don’t work. can’t work? why it’s time to rethink security warnings. In 2012 7th international conference on risks and security of internet and systems (CRiSIS), pages 1–8. IEEE, 2012.
- [32] Elmer Lastdrager, Inés Carvajal Gallardo, Pieter Hartel, and Marianne Junger. How effective is anti-phishing training for children? In USENIX Conference on Usable Privacy and Security, 2017.
- [33] Bin Liu, Mads Schaarup Andersen, Florian Schaub, Hazim Almuhimedi, Shikun Aerin Zhang, Norman Sadeh, Yuvraj Agarwal, and Alessandro Acquisti. Follow my recommendations: A personalized privacy assistant for mobile app permissions. In Twelfth symposium on usable privacy and security (SOUPS 2016), pages 27–41, 2016.
- [34] Yang Liu, Armin Sarabi, Jing Zhang, Parinaz Naghizadeh, Manish Karir, Michael Bailey, and Mingyan Liu. Cloudy with a chance of breach: Forecasting cyber security incidents. In 24th USENIX Security Symposium (USENIX Security 15), pages 1009–1024, 2015.
- [35] Tara Matthews, Kerwell Liao, Anna Turner, Marianne Berkovich, Robert Reeder, and Sunny Consolvo. “She’ll just grab any device that’s closer”: A Study of Everyday Device & Account Sharing in Households. In Proceedings of the 2016 CHI Conference on Human Factors in Computing Systems, pages 5921–5932, 2016.
- [36] Susan E. McGregor, Polina Charters, Tobin Holliday, and Franziska Roesner. Investigating the computer security practices and needs of journalists. In USENIX Security Symposium, 2015.
- [37] Ghita Mezzour, Kathleen M Carley, and L Richard Carley. An empirical study of global malware encounters. In Symposium and Bootcamp on the Science of Security, 2015.
- [38] Rachel Gibson M.S. Countering tech abuse together, 2019. https://www.virusbulletin.com/uploads/pdf/conference_slides/2019/VB2019-ZakorzhevskyG.pdf.
- [39] Laura L Murphy and Alexandra E Priebe. “My co-wife can borrow my mobile phone!” Gendered Geographies of Cell Phone Usage and Significance for Rural Kenyans. Gender, Technology and Development, 15(1):1–23, 2011.
- [40] Antonio Nappa, Richard Johnson, Leyla Bilge, Juan Caballero, and Tudor Dimitras. The Attack of the Clones: A Study of the Impact of Shared Code on Vulnerability Patching. In IEEE Symposium on Security and Privacy, 2015.
- [41] NortonLifeLock. Nortonlifelock global privacy statement. https:www.nortonlifelock.com/us/en/privacy/global-privacy-statement/, 2021.
- [42] Jake Reichel, Fleming Peck, Mikako Inaba, Bisrat Moges, Brahmnoor Singh Chawla, and Marshini Chetty. ‘I Have Too Much Respect for My Elders’: Understanding South African Mobile Users’ Perceptions of Privacy and Current Behaviors on Facebook and WhatsApp. USENIX Association, USA, 2020.
- [43] Kevin A Roundy, Paula Barmaimon Mendelberg, Nicola Dell, Damon McCoy, Daniel Nissani, Thomas Ristenpart, and Acar Tamersoy. The many kinds of creepware used for interpersonal attacks. In IEEE Symposium on Security and Privacy, 2020.
- [44] Nithya Sambasivan, Garen Checkley, Amna Batool, Nova Ahmed, David Nemer, Laura Sanely Gaytán-Lugo, Tara Matthews, Sunny Consolvo, and Elizabeth Churchill. “Privacy is not for me, it’s for those rich women”: Performative Privacy Practices on Mobile Phones by Women in South Asia. In Fourteenth Symposium on Usable Privacy and Security (SOUPS 2018), pages 127–142, 2018.
- [45] Marcos Sebastian, Richard Rivera, Platon Kotzias, and Juan Caballero. Avclass: A tool for massive malware labeling. In Research in Attacks, Intrusions, and Defenses, 2016.
- [46] Suranga Seneviratne, Aruna Seneviratne, Prasant Mohapatra, and Anirban Mahanti. Predicting user traits from a snapshot of apps installed on a smartphone. ACM SIGMOBILE Mobile Computing and Communications Review, 18(2):1–8, 2014.
- [47] Suranga Seneviratne, Aruna Seneviratne, Prasant Mohapatra, and Anirban Mahanti. Your installed apps reveal your gender and more! ACM SIGMOBILE Mobile Computing and Communications Review, 18(3):55–61, 2015.
- [48] Mahmood Sharif, Jumpei Urakawa, Nicolas Christin, Ayumu Kubota, and Akira Yamada. Predicting impending exposure to malicious content from user behavior. In Proceedings of the 2018 ACM SIGSAC Conference on Computer and Communications Security, 2018.
- [49] Yun Shen and Gianluca Stringhini. Andruspex: Leveraging graph representation learning to predict harmful app installations on mobile devices. arXiv preprint arXiv:2103.05476, 2021.
- [50] Yun Shen, Pierre-Antoine Vervier, and Gianluca Stringhini. A Large-scale Temporal Measurement of Android Malicious Apps: Persistence, Migration, and Lessons Learned. In 31st USENIX Security Symposium (USENIX Security 22), pages 1167–1184, 2022.
- [51] Camelia Simoiu, Ali Zand, Kurt Thomas, and Elie Bursztein. Who is targeted by email-based phishing and malware? measuring factors that differentiate risk. In Proceedings of the ACM Internet Measurement Conference, pages 567–576, 2020.
- [52] Manya Sleeper, Tara Matthews, Kathleen O’Leary, Anna Turner, Jill Palzkill Woelfer, Martin Shelton, Andrew Oplinger, Andreas Schou, and Sunny Consolvo. Tough times at transitional homeless shelters: Considering the impact of financial insecurity on digital security and privacy. In Proceedings of the 2019 CHI Conference on Human Factors in Computing Systems, 2019.
- [53] Olivier Thonnard, Leyla Bilge, Anand Kashyap, and Martin Lee. Are you at risk? profiling organizations and individuals subject to targeted attacks. In Rainer Böhme and Tatsuaki Okamoto, editors, Financial Cryptography and Data Security, pages 13–31, Berlin, Heidelberg, 2015. Springer Berlin Heidelberg.
- [54] Rolf van Wegberg, Fieke Miedema, Ugur Akyazi, Arman Noroozian, Bram Klievink, and Michel van Eeten. Go see a specialist? predicting cybercrime sales on online anonymous markets from vendor and product characteristics. In Proceedings of The Web Conference 2020, pages 816–826, 2020.
- [55] VirusTotal. http://www.virustotal.com/.
- [56] Jessica Vitak, Yuting Liao, Mega Subramaniam, and Priya Kumar. ’i knew it was too good to be true": The challenges economically disadvantaged internet users face in assessing trustworthiness, avoiding scams, and developing self-efficacy online. Proc. ACM Hum.-Comput. Interact., 2(CSCW), nov 2018.
- [57] Ashley Marie Walker, Yaxing Yao, Christine Geeng, Roberto Hoyle, and Pamela Wisniewski. Moving beyond ’one size fits all’: Research considerations for working with vulnerable populations. Interactions, 26(6):34–39, oct 2019.
- [58] Haoyu Wang, Hao Li, Li Li, Yao Guo, and Guoai Xu. Why are Android Apps Removed from Google Play? A Large-Scale Empirical Study. In IEEE/ACM International Conference on Mining Software Repositories, 2018.
- [59] Haoyu Wang, Junjun Si, Hao Li, and Yao Guo. Rmvdroid: towards a reliable android malware dataset with app metadata. In 2019 IEEE/ACM 16th International Conference on Mining Software Repositories (MSR), pages 404–408. IEEE, 2019.
- [60] Noel Warford, Tara Matthews, Kaitlyn Yang, Omer Akgul, Sunny Consolvo, Patrick Gage Kelley, Nathan Malkin, Michelle L Mazurek, Manya Sleeper, and Kurt Thomas. Sok: A framework for unifying at-risk user research. In 2022 IEEE Symposium on Security and Privacy (SP), pages 2344–2360. IEEE, 2022.
- [61] Pamela Wisniewski, Heng Xu, Mary Beth Rosson, Daniel F. Perkins, and John M. Carroll. Dear diary: Teens reflect on their weekly online risk experiences. In CHI Conference on Human Factors in Computing Systems, 2016.
- [62] Pamela J Wisniewski, Bart P Knijnenburg, and Heather Richter Lipford. Making privacy personal: Profiling social network users to inform privacy education and nudging. International Journal of human-computer studies, 98:95–108, 2017.
- [63] Ting-Fang Yen, Victor Heorhiadi, Alina Oprea, Michael K Reiter, and Ari Juels. An Epidemiological Study of Malware Encounters in a Large Enterprise. In ACM Conference on Computer and Communications Security, 2014.
- [64] Josh Jia-Ching Ying, Yao-Jen Chang, Chi-Min Huang, and Vincent S Tseng. Demographic prediction based on users mobile behaviors. Mobile Data Challenge, 2012:1–4, 2012.
- [65] Sha Zhao, Shijian Li, Julian Ramos, Zhiling Luo, Ziwen Jiang, Anind K Dey, and Gang Pan. User profiling from their use of smartphone applications: A survey. Pervasive and Mobile Computing, page 101052, 2019.
- [66] Sha Zhao, Gang Pan, Yifan Zhao, Jianrong Tao, Jinlai Chen, Shijian Li, and Zhaohui Wu. Mining user attributes using large-scale app lists of smartphones. IEEE Systems Journal, 11(1):315–323, 2016.
- [67] Sha Zhao, Yizhi Xu, Xiaojuan Ma, Ziwen Jiang, Zhiling Luo, Shijian Li, Laurence Tianruo Yang, Anind Dey, and Gang Pan. Gender profiling from a single snapshot of apps installed on a smartphone: An empirical study. IEEE Transactions on Industrial Informatics, 2019.
- [68] Shuofei Zhu, Jianjun Shi, Limin Yang, Boqin Qin, Ziyi Zhang, Linhai Song, and Gang Wang. Measuring and Modeling the Label Dynamics of Online Anti-Malware Engines. In USENIX Security Symposium, 2020.
Appendix A Additional Results
A.1 Best vs Worst Devices
In this section, we validate the importance of the risk indicators identified in section 4 by performing a comparison between the best and the worse-in-class users in terms of malicious apps encounters. In the following paragraphs, we describe the selection criteria for each group, the insights unveiled when composing the two classes, and the results of the analysis.
Identifying devices with the best devices in our dataset requires more criteria beyond simply selecting devices with no malicious encounters. We decide to use the first 8 risk factors as criteria and select users from the riskiest buckets for each factor in the GLMs (Table 2). The rationale is that users who have risky behaviour but do not encounter any malicious apps may represent users that are very security conscious. We observe that there is no single device that falls in the riskiest bucket of all risk factors. To investigate which are the most critical features that filter out the majority of devices, we compute and report in Table 9 the percentage of clean and infected devices after applying the riskiest condition for each feature. For example, we compute the percentage of devices with more than 102 installed apps, since this value resulted to have the highest odds ratios (Table 2). We find out that the number of alternative markets and the percentage of applications downloaded from unofficial markets are very discriminative for the two sets, as only 214 and 19K devices fulfill these conditions for over 7.5M devices. On the contrary, applying those constraints to the set of devices that report at least one malicious application, produces a larger population of users. This indeed confirms the goodness of the model results and the importance of these two risk indicators. Although less pronounced, we also observe the signers number to have a much higher impact when looking at the clean subset: in this case, selecting devices with more than 75 signers brings the percentage of considered devices down to 14.92% while it keeps the one of the counterpart to 37.96%. For our initial task, since applying all the constraints would result in an empty dataset, we decide to relax the strictest ones (e.g., number of signers, alternative markets, and percentage of apps downloaded from them): our group of clean devices with a high-security profile accounts for 19k records (0.25% of the total).
| Feature | Riskiest bins | |
|---|---|---|
| Clean | Infected | |
| Applications | 1,680,125 (22.27 %) | 467,676 (41.55 %) |
| Activity days | 2,092,531 (27.73 %) | 336,172 (29.87 %) |
| Signers | 1,125,362 (14.92 %) | 427,298 (37.96 %) |
| Application categories | 1,986,501 (26.33 %) | 188,374 (16.73 %) |
| Update rate | 1,868,476 (24.76 %) | 365,541 (32.47 %) |
| % Apps from AM | 18,984 (0.25 %) | 36,809 (3.27 %) |
| Alternative markets | 214 (0.01 %) | 1,671 (0.15 %) |
| App prevalence | 1,771,623 (23.48 %) | 395,999 (35.18 %) |
On the contrary, to isolate at-risk users in the former group, we first check the percentage of malicious APKs with respect to the total number of installed APKs on devices that report at least one malicious sample. Among those, we then compute outliers by selecting users whose ratios exceed a threshold identified by the 95% quantile: out of 1.1M devices with at least one detection, we select 63K devices whose malicious APKs represent at least 5% of the total number of applications.
Overall, the risk-factor analysis of the best and worst devices confirms the higher relevance of a few indicators than others. In particular, the most marked difference is the one related to the percentage of applications downloaded from alternative sources: while for clean users this accounts for 8%, for at-risk devices the percentage is above 42%. In addition, we find the average number of application signers being for the best and for the worst devices, with the average for the whole population being around .
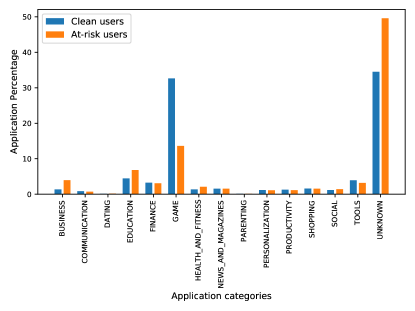
To dive deeper into the differences between the two groups, we compute the percentage of installed-application categories and plot their distribution in Figure 1. For this task, we do not consider in the computation the categories of malicious applications. The analysis of the figure reveals a non-uniform distribution in the two populations: remarkable cases are the high prevalence of Unknown apps for at-risk users and the one of Game APKs into the group of clean users.
A.2 Dataset breakdown for prediction models
| Model | PUA and | Malware | PUA |
|---|---|---|---|
| malware | only | only | |
| Average users | 5,000 | 5,000 | 5,000 |
| Mixed | 5,000 | 5,000 | 5,000 |
| Game | 5,000 | 5,000 | 5,000 |
| Video Players | 5,000 | 5,000 | 5,000 |
| Social | 5,000 | 5,000 | 5,000 |
| Education | 5,000 | 5,000 | 5,000 |
| Sports | 5,000 | 1,476 | 5,000 |
| Finance | 5,000 | 3,792 | 5,000 |
| News | 5,000 | 1,646 | 5,000 |
| Business | 5,000 | 2,928 | 5,000 |
| Health | 5,000 | 1,458 | 5,000 |
| Weather | 5,000 | 2,498 | 5,000 |
| Personalization | 5,000 | 3,764 | 5,000 |
| Communication | 5,000 | 3,084 | 5,000 |
| Navigation | 5,000 | 1,414 | 5,000 |
| Medical | 5,000 | 1,702 | 5,000 |
| Books | 5,000 | 1,924 | 5,000 |
| Lifestyle | 3,496 | 518 | 3,184 |
| Photography | 5,000 | 2,658 | 5,000 |
| Shopping | 5,000 | 1,870 | 5,000 |
| Music | 5,000 | 1,728 | 5,000 |
| Auto | 5,000 | 1,550 | 5,000 |
| Travel | 5,000 | 1,042 | 5,000 |
| Entertainment | 5,000 | 1,198 | 5,000 |
| Comics | 3,486 | 538 | 3,174 |
| Food | 4,634 | 816 | 4,086 |
| Tools | 5,000 | 2,240 | 5,000 |
| Communication-Tools | 5,000 | 1,110 | 4,506 |
| Productivity | 3,238 | 602 | 2,788 |
| House | 2,638 | 388 | 2,396 |
| Social-Video Players | 5,000 | 1,980 | 5,000 |
| Entertainment-Game | 5,000 | 1,762 | 5,000 |
| Business-Finance | 5,000 | 980 | 4,540 |
| Education-Game | 5,000 | 1,246 | 5,000 |
| Comics-Game | 5,000 | 968 | 5,000 |
| Books-Education | 3,950 | 804 | 3,530 |
| Photography-Video Players | 5,000 | 1,112 | 4,970 |
A.3 VirusTotal and Play Market coverage
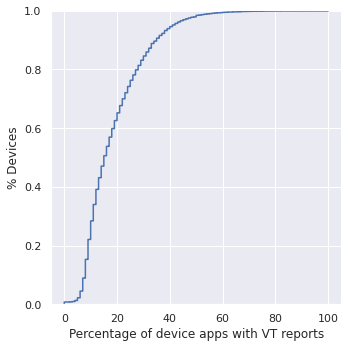
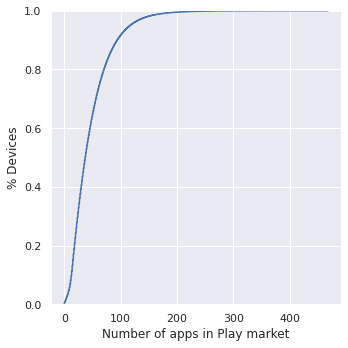
A.4 Extended measurement results
| Installed | Art and | Auto and | Beauty | Books and | Business | Comics | Communication | Dating | Education |
|---|---|---|---|---|---|---|---|---|---|
| Apps | design | vehicles | reference | ||||||
| 1 | 7.24 | 5.71 | 2.3 | 50.89 | 46.11 | 12.12 | 95.37 | 2.65 | 38.37 |
| 2 | 1.03 | 4.34 | 0.31 | 24.76 | 24.66 | 1.93 | 83.9 | 0.75 | 20.3 |
| 3 | 0.3 | 1.51 | 0.07 | 12.03 | 14.55 | 0.91 | 69.39 | 0.32 | 12.22 |
| 4 | 0.12 | 0.62 | 0.02 | 5.56 | 9.14 | 0.53 | 54.14 | 0.16 | 7.96 |
| 5 | 0.06 | 0.29 | 0.01 | 3.0 | 5.95 | 0.34 | 39.57 | 0.09 | 5.47 |
| 6 | 0.03 | 0.15 | 0.0 | 1.77 | 3.97 | 0.23 | 28.1 | 0.06 | 3.92 |
| 7 | 0.02 | 0.08 | 0.0 | 1.11 | 2.66 | 0.16 | 19.96 | 0.04 | 2.9 |
| 8 | 0.01 | 0.05 | 0.0 | 0.74 | 1.82 | 0.12 | 13.88 | 0.03 | 2.19 |
| 9 | 0.01 | 0.03 | 0.0 | 0.51 | 1.26 | 0.08 | 9.37 | 0.02 | 1.7 |
| 10 | 0.0 | 0.02 | 0.0 | 0.36 | 0.88 | 0.06 | 6.14 | 0.01 | 1.34 |
| 11 | 0.0 | 0.01 | 0.0 | 0.27 | 0.62 | 0.05 | 3.92 | 0.01 | 1.07 |
| 12 | 0.0 | 0.01 | 0.0 | 0.2 | 0.45 | 0.03 | 2.46 | 0.01 | 0.87 |
| 13 | 0.0 | 0.01 | 0.0 | 0.16 | 0.33 | 0.03 | 1.54 | 0.01 | 0.71 |
| 14 | 0.0 | 0.01 | 0.0 | 0.13 | 0.24 | 0.02 | 0.97 | 0.01 | 0.59 |
| 15 | 0.0 | 0.0 | 0.0 | 0.1 | 0.18 | 0.02 | 0.62 | 0.0 | 0.5 |
| 16 | 0.0 | 0.0 | 0.0 | 0.08 | 0.14 | 0.01 | 0.41 | 0.0 | 0.42 |
| 17 | 0.0 | 0.0 | 0.0 | 0.07 | 0.1 | 0.01 | 0.27 | 0.0 | 0.36 |
| 18 | 0.0 | 0.0 | 0.0 | 0.06 | 0.08 | 0.01 | 0.18 | 0.0 | 0.31 |
| 19 | 0.0 | 0.0 | 0.0 | 0.05 | 0.06 | 0.01 | 0.13 | 0.0 | 0.27 |
| 20 | 0.0 | 0.0 | 0.0 | 0.04 | 0.05 | 0.0 | 0.09 | 0.0 | 0.23 |
| Installed | Entertainment | Events | Finance | Food and | Game | Health and | House and | Libraries and | Lifestyle |
|---|---|---|---|---|---|---|---|---|---|
| Apps | drink | fitness | home | demo | |||||
| 1 | 81.72 | 3.62 | 73.29 | 39.96 | 65.84 | 49.75 | 9.73 | 8.41 | 63.51 |
| 2 | 62.34 | 0.62 | 54.48 | 20.66 | 51.31 | 24.48 | 2.45 | 1.0 | 39.33 |
| 3 | 46.29 | 0.16 | 39.73 | 11.56 | 41.52 | 13.4 | 0.84 | 0.66 | 25.37 |
| 4 | 33.74 | 0.05 | 28.83 | 6.61 | 34.29 | 7.98 | 0.33 | 0.09 | 16.87 |
| 5 | 24.33 | 0.01 | 21.45 | 3.93 | 28.84 | 5.01 | 0.14 | 0.03 | 11.47 |
| 6 | 17.46 | 0.0 | 16.17 | 2.43 | 24.6 | 3.28 | 0.07 | 0.02 | 7.91 |
| 7 | 12.55 | 0.0 | 12.33 | 1.56 | 21.23 | 2.22 | 0.03 | 0.0 | 5.51 |
| 8 | 9.01 | 0.0 | 9.48 | 1.02 | 18.51 | 1.54 | 0.02 | 0.0 | 3.89 |
| 9 | 6.49 | 0.0 | 7.36 | 0.69 | 16.27 | 1.1 | 0.01 | 0.0 | 2.78 |
| 10 | 4.69 | 0.0 | 5.75 | 0.48 | 14.41 | 0.8 | 0.01 | 0.0 | 2.02 |
| 11 | 3.41 | 0.0 | 4.53 | 0.34 | 12.84 | 0.59 | 0.0 | 0.0 | 1.48 |
| 12 | 2.5 | 0.0 | 3.59 | 0.25 | 11.5 | 0.44 | 0.0 | 0.0 | 1.1 |
| 13 | 1.85 | 0.0 | 2.87 | 0.18 | 10.36 | 0.34 | 0.0 | 0.0 | 0.83 |
| 14 | 1.38 | 0.0 | 2.31 | 0.14 | 9.37 | 0.26 | 0.0 | 0.0 | 0.64 |
| 15 | 1.04 | 0.0 | 1.87 | 0.1 | 8.51 | 0.2 | 0.0 | 0.0 | 0.49 |
| 16 | 0.79 | 0.0 | 1.53 | 0.08 | 7.77 | 0.16 | 0.0 | 0.0 | 0.38 |
| 17 | 0.61 | 0.0 | 1.25 | 0.06 | 7.12 | 0.13 | 0.0 | 0.0 | 0.3 |
| 18 | 0.48 | 0.0 | 1.04 | 0.05 | 6.54 | 0.11 | 0.0 | 0.0 | 0.24 |
| 19 | 0.37 | 0.0 | 0.86 | 0.04 | 6.03 | 0.09 | 0.0 | 0.0 | 0.19 |
| 20 | 0.3 | 0.0 | 0.72 | 0.03 | 5.58 | 0.07 | 0.0 | 0.0 | 0.15 |
| Installed | Maps and | Medical | Music and | News and | Parenting | Personalization | Photography | Productivity | Shopping |
|---|---|---|---|---|---|---|---|---|---|
| Apps | navigation | audio | magazines | ||||||
| 1 | 54.53 | 17.42 | 77.9 | 65.11 | 2.51 | 35.94 | 65.66 | 88.61 | 75.49 |
| 2 | 28.98 | 5.58 | 53.35 | 37.65 | 0.42 | 11.75 | 35.08 | 77.19 | 57.86 |
| 3 | 14.13 | 2.29 | 34.15 | 20.7 | 0.15 | 5.96 | 18.68 | 66.01 | 43.86 |
| 4 | 6.98 | 1.11 | 21.5 | 11.35 | 0.07 | 3.08 | 11.34 | 53.94 | 30.83 |
| 5 | 3.61 | 0.61 | 13.51 | 6.44 | 0.04 | 1.79 | 7.05 | 43.82 | 22.29 |
| 6 | 1.96 | 0.37 | 8.51 | 3.82 | 0.02 | 1.18 | 4.64 | 34.78 | 16.32 |
| 7 | 1.12 | 0.24 | 5.39 | 2.38 | 0.01 | 0.84 | 3.15 | 27.5 | 12.06 |
| 8 | 0.66 | 0.17 | 3.44 | 1.54 | 0.01 | 0.63 | 2.18 | 21.74 | 8.98 |
| 9 | 0.41 | 0.12 | 2.24 | 1.04 | 0.0 | 0.5 | 1.55 | 17.03 | 6.74 |
| 10 | 0.26 | 0.1 | 1.48 | 0.72 | 0.0 | 0.4 | 1.13 | 13.17 | 5.1 |
| 11 | 0.17 | 0.08 | 1.0 | 0.51 | 0.0 | 0.33 | 0.85 | 10.07 | 3.89 |
| 12 | 0.11 | 0.06 | 0.69 | 0.37 | 0.0 | 0.27 | 0.65 | 7.68 | 2.98 |
| 13 | 0.08 | 0.05 | 0.49 | 0.28 | 0.0 | 0.23 | 0.5 | 5.85 | 2.3 |
| 14 | 0.05 | 0.04 | 0.35 | 0.21 | 0.0 | 0.2 | 0.39 | 4.46 | 1.78 |
| 15 | 0.04 | 0.03 | 0.26 | 0.16 | 0.0 | 0.17 | 0.31 | 3.42 | 1.38 |
| 16 | 0.03 | 0.03 | 0.2 | 0.12 | 0.0 | 0.15 | 0.25 | 2.63 | 1.08 |
| 17 | 0.02 | 0.02 | 0.15 | 0.1 | 0.0 | 0.13 | 0.21 | 2.03 | 0.85 |
| 18 | 0.02 | 0.02 | 0.12 | 0.08 | 0.0 | 0.12 | 0.17 | 1.57 | 0.67 |
| 19 | 0.01 | 0.02 | 0.1 | 0.06 | 0.0 | 0.11 | 0.14 | 1.22 | 0.54 |
| 20 | 0.01 | 0.01 | 0.08 | 0.05 | 0.0 | 0.1 | 0.12 | 0.96 | 0.43 |
| Installed | Social | Sports | Tools | Travel and | Video | Weather |
|---|---|---|---|---|---|---|
| Apps | local | players | ||||
| 1 | 77.98 | 25.36 | 94.48 | 67.12 | 66.59 | 34.96 |
| 2 | 53.81 | 10.62 | 85.36 | 43.57 | 38.88 | 11.75 |
| 3 | 31.16 | 5.77 | 74.66 | 29.22 | 19.46 | 4.59 |
| 4 | 17.41 | 3.49 | 64.33 | 20.33 | 9.68 | 2.07 |
| 5 | 9.38 | 2.24 | 55.14 | 14.58 | 5.03 | 1.05 |
| 6 | 5.0 | 1.48 | 46.92 | 10.67 | 2.71 | 0.58 |
| 7 | 2.71 | 1.01 | 39.66 | 7.95 | 1.52 | 0.35 |
| 8 | 1.52 | 0.7 | 33.46 | 6.01 | 0.9 | 0.22 |
| 9 | 0.89 | 0.5 | 28.13 | 4.6 | 0.56 | 0.14 |
| 10 | 0.55 | 0.36 | 23.62 | 3.55 | 0.36 | 0.1 |
| 11 | 0.36 | 0.26 | 19.88 | 2.78 | 0.24 | 0.07 |
| 12 | 0.24 | 0.19 | 16.81 | 2.19 | 0.16 | 0.05 |
| 13 | 0.16 | 0.14 | 14.25 | 1.73 | 0.12 | 0.04 |
| 14 | 0.12 | 0.11 | 12.11 | 1.38 | 0.08 | 0.03 |
| 15 | 0.09 | 0.08 | 10.3 | 1.11 | 0.06 | 0.02 |
| 16 | 0.06 | 0.06 | 8.72 | 0.89 | 0.05 | 0.02 |
| 17 | 0.05 | 0.05 | 7.32 | 0.73 | 0.04 | 0.02 |
| 18 | 0.04 | 0.04 | 6.1 | 0.59 | 0.03 | 0.01 |
| 19 | 0.03 | 0.03 | 5.07 | 0.49 | 0.02 | 0.01 |
| 20 | 0.02 | 0.02 | 4.19 | 0.4 | 0.02 | 0.01 |
| Profile | Size | Encounter | Malware | PUA | Malicious APKs | Malicious Encounters |
|---|---|---|---|---|---|---|
| malicious apps | only | only | from profile apps | from profile apps | ||
| Average users | 599,483 | 51,885 (8.65%) | 12.01% | 73.14% | ||
| Mixed | 470,383 | 93,407 (19.86%) | 10.92% | 79.70% | ||
| Game | 235,434 | 48,903 (20.77%) | 10.53% | 79.22% | 34.97% | 21,100 (43.15%) |
| Video Players | 106,723 | 27,543 (25.81%) | 8.73% | 79.29% | 17.25% | 8,245 (29.94%) |
| Social | 99,176 | 18,497 (18.65%) | 10.96% | 81.68% | 1.62% | 434 (2.35%) |
| Education | 97,405 | 14,551 (14.94%) | 11.11% | 76.41% | 2.26% | 710 (4.88%) |
| Sports | 83,891 | 6,253 (7.45%) | 9.58% | 85.06% | 2.05% | 213 (3.41%) |
| Finance | 80,617 | 11,457 (14.21%) | 13.42% | 79.18% | 8.35% | 934 (8.15%) |
| News | 77,068 | 6,595 (8.56%) | 9.01% | 82.58% | 1.77% | 173 (2.62%) |
| Business | 74,982 | 8,561 (11.42%) | 10.55% | 79.30% | 2.86% | 410 (4.79%) |
| Health | 68,111 | 5,440 (7.99%) | 10.51% | 83.42% | 13.97% | 810 (14.89%) |
| Weather | 66,864 | 7,930 (11.86%) | 8.35% | 82.17% | 49.84% | 3,622 (45.67%) |
| Personalization | 62,944 | 9,076 (14.42%) | 13.14% | 75.31% | 1.62% | 272 (3.00%) |
| Communication | 60,478 | 8,939 (14.78%) | 12.84% | 78.67% | 4.93% | 498 (5.57%) |
| Navigation | 59,425 | 5,048 (8.49%) | 11.49% | 82.19% | 1.14% | 67 (1.33%) |
| Medical | 57,605 | 5,128 (8.90%) | 11.88% | 80.05% | 0.46% | 41 (0.80%) |
| Books | 57,493 | 5,865 (10.20%) | 12.86% | 79.54% | 5.61% | 404 (6.89%) |
| Lifestyle | 56,966 | 2,320 (4.07%) | 8.66% | 85.69% | 12.37% | 301 (12.97%) |
| Photography | 53,813 | 8,439 (15.68%) | 10.50% | 81.17% | 16.47% | 1,498 (17.75%) |
| Shopping | 49,444 | 5,824 (11.78%) | 13.72% | 80.72% | 5.30% | 296 (5.08%) |
| Music | 47,992 | 6,837 (14.25%) | 9.38% | 84.29% | 23.18% | 1,523 (22.28%) |
| Auto | 42,114 | 4,736 (11.25%) | 11.57% | 80.43% | 1.35% | 90 (1.90%) |
| Travel | 41,834 | 4,087 (9.77%) | 10.06% | 83.85% | 7.05% | 498 (12.18%) |
| Entertainment | 40,848 | 5,023 (12.30%) | 9.91% | 84.49% | 6.67% | 393 (7.82%) |
| Comics | 36,419 | 1,970 (5.41%) | 9.59% | 83.35% | 0.87% | 21 (1.07%) |
| Food | 33,164 | 2,747 (8.28%) | 11.90% | 82.27% | 0.78% | 37 (1.35%) |
| Tools | 32,549 | 4,778 (14.68%) | 15.93% | 71.16% | 24.64% | 1,670 (34.95%) |
| Communication-Tools | 23,632 | 3,154 (13.35%) | 13.67% | 77.65% | 23.21% | 914 (28.98%) |
| Productivity | 22,056 | 2,020 (9.16%) | 13.86% | 80.79% | 2.52% | 63 (3.12%) |
| House | 19,935 | 1,634 (8.20%) | 10.04% | 84.09% | 2.82% | 58 (3.55%) |
| Social-Video Players | 17,184 | 6,034 (35.11%) | 7.41% | 81.27% | 23.42% | 2,248 (37.26%) |
| Entertainment-Game | 16,998 | 5,354 (31.50%) | 9.30% | 77.94% | 46.12% | 2,909 (54.33%) |
| Business-Finance | 16,242 | 3,000 (18.47%) | 14.10% | 78.60% | 12.88% | 410 (13.67%) |
| Education-Game | 14,769 | 3,633 (24.60%) | 9.33% | 77.92% | 27.01% | 1,542 (42.44%) |
| Comics-Game | 13,549 | 3,317 (24.48%) | 8.38% | 81.49% | 40.62% | 1,646 (49.62%) |
| Books-Education | 12,024 | 2,267 (18.85%) | 12.31% | 77.06% | 6.63% | 297 (13.10%) |
| Photography-Video Players | 10,993 | 3,123 (28.41%) | 10.79% | 78.67% | 24.32% | 955 (30.58%) |
| Overall average | 6,846 | 990 (14.55%) | 10.67% | 79.20% | 13.72% | 151 (16.55%) |
| Profile | Top-categories | |||
|---|---|---|---|---|
| 1st | 2nd | 3rd | 4th | |
| Average users | Tools (30.35%) | Game (16.83%) | Video Players (16.23%) | Entertainment (5.90%) |
| Mixed | Tools (25.37%) | Game (13.51%) | Video Players (10.00%) | Music (8.35%) |
| Game | Game (64.04%) | Tools (8.02%) | Entertainment (7.56%) | Video Players (5.42%) |
| Video Players | Video Players (46.9%) | Tools (19.27%) | Game (7.53%) | Music (4.44%) |
| Social | Tools (31.0%) | Video Players (22.05%) | Game (9.83%) | Music (5.06%) |
| Education | Tools (24.54%) | Game (15.49%) | Video Players (13.33%) | Education (8.12%) |
| Sports | Tools (23.57%) | Game (11.97%) | Music (8.49%) | Photography (8.34%) |
| Finance | Tools (28.33%) | Finance (15.25%) | Video Players (10.11%) | Game (8.67%) |
| News | Tools (28.92%) | Weather (28.52%) | Video Players (10.56%) | Game (7.86%) |
| Business | Tools (26.2%) | Video Players (13.27%) | Game (10.54%) | Business (9.86%) |
| Health | Health (30.21%) | Tools (20.16%) | Photography (7.63%) | Game (7.57%) |
| Weather | Weather (66.84%) | Tools (9.75%) | Photography (4.23%) | Entertainment (3.17%) |
| Personalization | Tools (28.77%) | Game (15.57%) | Music (11.56%) | Video Players (9.19%) |
| Communication | Tools (25.62%) | Game (19.93%) | Communication (10.95%) | Video Players (6.44%) |
| Navigation | Tools (28.88%) | Weather (12.4%) | Game (8.23%) | Photography (7.58%) |
| Medical | Tools (22.89%) | Game (10.38%) | Video Players (8.19%) | Photography (8.16%) |
| Books | Tools (22.05%) | Books (13.46%) | Game (13.23%) | Music (7.58%) |
| Lifestyle | Tools (23.06%) | Lifestyle (15.06%) | Game (11.29%) | Weather (11.18%) |
| Photography | Photography (33.93%) | Tools (21.31%) | Video Players (7.84%) | Entertainment (7.83%) |
| Shopping | Tools (22.79%) | Shopping (11.3%) | Game (8.8%) | Health (8.63%) |
| Music | Music (44.47%) | Tools (18.46%) | Game (7.09%) | Entertainment (5.12%) |
| Auto | Tools (26.39%) | Game (11.92%) | Music (9.88%) | Photography (8.35%) |
| Travel | Tools (26.4%) | Travel (16.72%) | Photography (9.72%) | Music (6.34%) |
| Entertainment | Tools (23.5%) | Game (15.04%) | Entertainment (14.19%) | Video Players (9.19%) |
| Comics | Game (31.64%) | Tools (17.38%) | Video Players (15.66%) | Music (6.97%) |
| Food | Tools (26.57%) | Game (13.43%) | Video Players (6.97%) | Music (6.23%) |
| Tools | Tools (54.64%) | Game (7.38%) | Photography (4.59%) | Music (4.57%) |
| Communication-Tools | Tools (45.99%) | Game (8.85%) | Music (5.86%) | Photography (5.71%) |
| Productivity | Tools (28.13%) | Photography (10.8%) | Game (8.12%) | Health (7.88%) |
| House | Tools (21.64%) | Photography (12.39%) | Game (9.51%) | Music (8.81%) |
| Social-Video Players | Video Players (50.46%) | Tools (21.8%) | Game (5.68%) | Entertainment (3.49%) |
| Entertainment-Game | Game (55.54%) | Entertainment (17.99%) | Tools (7.98%) | Music (5.18%) |
| Business-Finance | Tools (31.08%) | Finance (13.2%) | Business (11.58%) | Video Players (8.72%) |
| Education-Game | Game (56.05%) | Tools (10.62%) | Entertainment (6.03%) | Video Players (5.08%) |
| Comics-Game | Game (67.02%) | Video Players (8.61%) | Tools (7.51%) | Music (5.12%) |
| Books-Education | Tools (23.64%) | Game (11.2%) | Education (10.47%) | Video Players (9.38%) |
| Photography-Video Players | Video Players (26.33%) | Photography (24.07%) | Tools (17.84%) | Music (6.74%) |
| Overall average | Tools (22.19%) | Game (12.58%) | Music (7.27%) | Video Players (7.18%) |
| Feature | Average | Mixed | Game | Video Players | Social | Education | Sports |
|---|---|---|---|---|---|---|---|
| users | |||||||
| Applications | 1.39 | 0.69 | 1.48 | 1.19 | 1.27 | 1.17 | 1.22 |
| Activity days | 1.50 | 1.32 | 1.25 | 1.66 | 1.46 | 1.30 | 1.19 |
| Signers | 3.64 | 3.26 | 3.05 | 2.53 | 2.38 | 3.88 | 5.19 |
| Categories | 0.41 | 0.47 | 0.70 | 0.42 | 0.52 | 0.67 | 0.41 |
| Update Rate | 3.28 | 1.70 | 2.33 | 2.21 | 1.48 | 1.78 | 1.54 |
| % apps from AM | 4.14 | 26.78 | 6.53 | 2.10 | 1.88 | 50.87 | 5.46 |
| Alternative Markets | 1.28 | 2.36 | 2.63 | 2.44 | 1.65 | 2.23 | 0.71 |
| Avg Prevalence | 0.61 | 0.70 | 0.75 | 0.87 | 0.48 | 0.68 | 0.81 |
| Countries | 1.26 | 1.18 | 1.09 | 1.55 | 0.30 | 0.64 | 1.01 |
| Feature | Finance | News and | Business | Health and | Weather | Personalization | Communication |
|---|---|---|---|---|---|---|---|
| Magazines | Fitness | ||||||
| Applications | 1.16 | 1.20 | 0.49 | 1.21 | 1.28 | 0.71 | 0.29 |
| Activity days | 1.16 | 1.45 | 1.28 | 1.15 | 1.11 | 1.11 | 0.90 |
| Signers | 3.27 | 3.23 | 5.28 | 3.47 | 2.23 | 6.15 | 3.63 |
| Categories | 0.72 | 0.51 | 1.28 | 0.52 | 0.55 | 0.39 | 0.61 |
| Update Rate | 1.13 | 2.42 | 1.36 | 1.41 | 2.25 | 1.93 | 1.48 |
| % apps from AM | 2.38 | 5.02 | 27.69 | 71.42 | 6.44 | 7.92 | 3.01 |
| Alternative Markets | 1.24 | 0.92 | 1.31 | 1.35 | 1.05 | 3.62 | 1.55 |
| Avg Prevalence | 0.65 | 0.71 | 0.66 | 0.71 | 0.83 | 0.57 | 0.61 |
| Countries | 1.37 | 1.31 | 1.15 | 1.01 | 1.10 | 1.19 | 1.38 |
| Feature | Maps and | Medical | Books and | Lifestyle | Photography | Shopping | Music and |
|---|---|---|---|---|---|---|---|
| Navigation | Reference | Audio | |||||
| Applications | 1.30 | 1.35 | 1.47 | 0.86 | 0.53 | 1.00 | 1.14 |
| Activity days | 1.03 | 1.03 | 1.01 | 0.95 | 1.03 | 1.13 | 1.19 |
| Signers | 4.77 | 4.16 | 4.58 | 5.20 | 7.51 | 4.42 | 3.51 |
| Categories | 0.43 | 0.61 | 0.35 | 0.57 | 0.29 | 0.48 | 0.38 |
| Update Rate | 1.39 | 1.42 | 1.77 | 1.10 | 1.52 | 1.23 | 1.58 |
| % apps from AM | 8.13 | 25.21 | 9.28 | 147.32 | 5.16 | 2.04 | 9.09 |
| Alternative Markets | 1.12 | 0.86 | 0.74 | 2.14 | 2.32 | 1.19 | 1.04 |
| Avg Prevalence | 0.84 | 0.69 | 0.64 | 0.65 | 0.87 | 0.80 | 0.68 |
| Countries | 1.04 | 1.18 | 1.15 | 1.19 | 1.14 | 1.12 | 1.07 |
| Feature | Auto and | Travel and | Entertainment | Comics | Food and | Tools | Communication |
|---|---|---|---|---|---|---|---|
| Vehicles | Locals | Drinks | Tools | ||||
| Applications | 1.37 | 1.56 | 0.95 | 0.63 | 1.04 | 0.14 | 0.36 |
| Activity days | 1.24 | 1.03 | 1.65 | 1.83 | 0.96 | 1.02 | 1.03 |
| Signers | 3.30 | 3.21 | 5.12 | 7.10 | 6.84 | 4.24 | 4.64 |
| Categories | 0.57 | 0.64 | 0.49 | 0.21 | 0.40 | 0.58 | 0.57 |
| Update Rate | 1.50 | 1.01 | 2.20 | 4.57 | 1.31 | 1.94 | 1.77 |
| % apps from AM | 24.74 | 40.49 | 1.38 | 7.28 | 22.88 | 3.62 | 1.78 |
| Alternative Markets | 0.93 | 1.69 | 0.89 | 0.32 | 1.19 | 2.72 | 5.94 |
| Avg Prevalence | 0.72 | 0.81 | 0.77 | 0.76 | 0.85 | 0.53 | 0.74 |
| Countries | 1.00 | 1.18 | 1.16 | 1.34 | 1.02 | 1.28 | 1.46 |
| Feature | Productivity | House and | Social and | Entertainment | Business | Education | Comics |
|---|---|---|---|---|---|---|---|
| Home | Video Players | Game | Finance | Game | Game | ||
| Applications | 0.52 | 1.30 | 1.55 | 1.02 | 0.86 | 1.11 | 1.06 |
| Activity days | 1.49 | 1.11 | 1.88 | 1.33 | 1.13 | 1.03 | 1.31 |
| Signers | 4.21 | 4.22 | 1.42 | 3.91 | 3.28 | 4.15 | 3.47 |
| Categories | 0.56 | 0.45 | 0.79 | 0.65 | 0.85 | 0.78 | 0.56 |
| Update Rate | 1.56 | 1.45 | 1.15 | 1.87 | 1.05 | 1.79 | 3.23 |
| % apps from AM | 11.56 | 46.29 | 1.71 | 2.82 | 11.38 | 33.08 | 3.41 |
| Alternative Markets | 0.73 | 1.29 | 2.94 | 2.62 | 1.78 | 3.46 | 3.63 |
| Avg Prevalence | 0.62 | 0.61 | 0.63 | 0.77 | 0.73 | 0.77 | 0.80 |
| Countries | 1.03 | 1.10 | 0.40 | 1.17 | 1.41 | 1.08 | 1.03 |
| Feature | Books | Photography and |
|---|---|---|
| Education | Video Players | |
| Applications | 1.68 | 0.71 |
| Activity days | 1.04 | 0.98 |
| Signers | 2.53 | 3.60 |
| Categories | 0.67 | 0.41 |
| Update Rate | 1.43 | 1.48 |
| % apps from AM | 19.48 | 3.72 |
| Alternative Markets | 1.65 | 4.41 |
| Avg Prevalence | 0.69 | 0.85 |
| Countries | 1.15 | 1.15 |
| Profile | Whole-population model | Per-profile models | Avg improvement | ||||
|---|---|---|---|---|---|---|---|
| PUA or | Malware | PUA | PUA | Malware | PUA | ||
| Malware | only | only | Malware | only | only | ||
| Average users | 51.90% | 49.50% | 51.50% | 84.35% | 83.56% | 77.91% | 30.97% |
| Mixed | 50.30% | 51.40% | 52.90% | 72.16% | 68.42% | 67.03% | 17.67% |
| Game | 53.50% | 49.60% | 48.80% | 64.38% | 64.22% | 72.22% | 16.31% |
| Video Players | 48.50% | 50.10% | 53.10% | 73.20% | 82.16% | 67.24% | 23.63% |
| Social | 52.30% | 49.60% | 47.30% | 54.76% | 75.29% | 70.21% | 17.02% |
| Education | 50.90% | 49.90% | 49.70% | 71.33% | 82.81% | 78.68% | 27.44% |
| Sports | 48.30% | 63.51% | 48.30% | 71.05% | 75.00% | 71.05% | 19.00% |
| Finance | 49.40% | 61.00% | 50.40% | 56.90% | 72.46% | 56.82% | 8.46% |
| News | 52.20% | 58.79% | 48.50% | 76.81% | 75.00% | 75.00% | 22.44% |
| Business | 51.50% | 68.26% | 52.10% | 78.91% | 77.85% | 82.11% | 22.34% |
| Health | 51.40% | 64.38% | 48.80% | 69.07% | 71.15% | 69.39% | 15.01% |
| Weather | 51.50% | 66.40% | 49.60% | 63.64% | 64.58% | 75.53% | 12.08% |
| Personalization | 51.00% | 67.33% | 49.60% | 69.31% | 69.46% | 77.78% | 16.21% |
| Communication | 52.10% | 61.59% | 48.20% | 59.68% | 75.00% | 73.08% | 15.29% |
| Navigation | 51.10% | 57.95% | 47.90% | 67.14% | 64.86% | 64.41% | 13.15% |
| Medical | 48.20% | 63.05% | 49.60% | 70.21% | 83.33% | 66.30% | 19.66% |
| Books | 46.10% | 70.39% | 49.70% | 72.22% | 71.05% | 76.06% | 17.71% |
| Lifestyle | 63.86% | 63.46% | 65.46% | 70.59% | 55.00% | 68.33% | 0.38% |
| Photography | 48.40% | 68.05% | 51.20% | 68.83% | 68.13% | 75.81% | 15.04% |
| Shopping | 49.60% | 60.96% | 49.40% | 67.31% | 57.58% | 66.00% | 10.31% |
| Music | 51.10% | 57.81% | 52.30% | 70.79% | 58.00% | 68.06% | 11.88% |
| Auto | 51.40% | 61.29% | 50.70% | 66.28% | 77.27% | 73.68% | 17.95% |
| Travel | 51.90% | 66.03% | 51.20% | 71.91% | 58.62% | 76.83% | 12.74% |
| Entertainment | 49.50% | 70.00% | 48.90% | 64.29% | 71.43% | 72.06% | 13.13% |
| Comics | 67.34% | 70.37% | 67.56% | 70.00% | 81.25% | 75.00% | 6.99% |
| Food | 61.60% | 66.46% | 60.64% | 74.65% | 65.62% | 75.00% | 8.86% |
| Tools | 47.50% | 64.96% | 51.00% | 71.43% | 67.71% | 74.31% | 16.66% |
| Communication-Tools | 51.20% | 69.82% | 64.86% | 74.03% | 59.38% | 66.67% | 4.73% |
| Productivity | 62.81% | 66.94% | 62.01% | 62.79% | 58.33% | 72.22% | 0.53% |
| House | 55.87% | 64.11% | 51.66% | 66.67% | 75.00% | 70.00% | 13.34% |
| Social-Video Players | 50.40% | 64.64% | 48.30% | 82.43% | 78.35% | 69.23% | 22.22% |
| Entertainment-Game | 50.10% | 62.89% | 49.80% | 68.00% | 63.16% | 61.29% | 9.89% |
| Business-Finance | 49.60% | 58.67% | 62.33% | 62.12% | 53.85% | 70.59% | 5.32% |
| Education-Game | 45.80% | 70.00% | 51.10% | 74.04% | 62.90% | 69.47% | 13.17% |
| Comics-Game | 48.00% | 70.11% | 49.70% | 75.76% | 77.27% | 81.25% | 22.16% |
| Books-Education | 61.78% | 63.98% | 61.61% | 80.95% | 70.00% | 81.58% | 15.05% |
| Photography-Video Players | 53.00% | 63.23% | 61.27% | 66.27% | 80.00% | 62.90% | 10.56% |
| Overall average | 52.19% | 62.34% | 52.89% | 69.84% | 70.14% | 71.65% | 14.74% |
| \CenterstackFeature | |||||||
|---|---|---|---|---|---|---|---|
| rank | \CenterstackUnique | ||||||
| \CenterstackAverage users | \CenterstackMixed | \CenterstackGame | \CenterstackVideo | ||||
| \CenterstackSocial | \CenterstackEducation | Players | |||||
| 1st | Signers - 9.76 | Unknown - 19.93 | Avg prev. - 7.56 | Unknown - 16.5 | Unknown - 10.83 | Unknown - 10.83 | Avg prev. - 11.32 |
| 2nd | Unknown - 8.93 | Avg prev. - 9.92 | Signers - 6.9 | Apps - 8.6 | Signers - 9.02 | Avg prev. - 8.65 | Unknown - 9.96 |
| 3rd | % apps AM - 5.61 | Signers - 7.11 | Update rate - 6.19 | Signers - 6.7 | Avg prev. - 7.32 | Days - 6.48 | % apps AM - 9.19 |
| 4th | Apps - 5.39 | Update rate - 6.91 | Days - 5.89 | Avg prev. - 6.33 | Apps - 6.97 | Apps - 5.64 | Signers - 8.99 |
| 5th | Update rate - 5.15 | Apps - 5.66 | Apps - 4.67 | Update rate - 5.77 | Update rate - 5.78 | Signers - 5.19 | Days - 6.77 |
| \CenterstackFeature | |||||||
|---|---|---|---|---|---|---|---|
| rank | \CenterstackSports | \CenterstackFinance | \CenterstackNews and | ||||
| \CenterstackBusiness | \CenterstackHealth and | magazines | |||||
| \CenterstackWeather | \CenterstackPersonalization | ||||||
| 1st | Unknown - 8.14 | Update rate - 7.71 | Unknown - 8.92 | Avg prev. - 10.41 | Update rate - 8.25 | Days - 6.88 | Avg prev. - 9.93 |
| 2nd | Update rate - 6.98 | Days - 6.7 | Days - 6.64 | Signers - 9.49 | Avg prev. - 8.21 | Update rate - 6.56 | Unknown - 9.24 |
| 3rd | Days - 6.81 | Unknown - 6.66 | Apps - 6.49 | % apps AM - 8.35 | Unknown - 6.44 | Unknown - 6.23 | Signers - 8.76 |
| 4th | Signers - 6.47 | Avg prev. - 6.08 | Update rate - 6.09 | Days - 7.56 | Days - 6.41 | Avg prev. - 6.23 | % apps AM - 6.87 |
| 5th | Avg prev. - 5.95 | Apps - 5.28 | Signers - 6.04 | Update rate - 6.29 | Signers - 6.09 | Apps - 5.67 | Apps - 5.36 |
| \CenterstackFeature | |||||||
|---|---|---|---|---|---|---|---|
| rank | \CenterstackCommunication | \CenterstackMaps and | |||||
| \CenterstackMedical | \CenterstackBooks and | ||||||
| \CenterstackLifestyle | \CenterstackPhotography | \CenterstackShopping | |||||
| 1st | Signers - 8.54 | Days - 6.62 | Unknown - 8.66 | Avg prev. - 8.07 | Update rate - 8.37 | Unknown - 8.72 | Update rate - 7.9 |
| 2nd | Unknown - 7.61 | Unknown - 6.54 | Avg prev. - 7.82 | Unknown - 8.01 | Signers - 7.44 | Avg prev. - 7.85 | Days - 6.31 |
| 3rd | Avg prev. - 7.37 | Signers - 6.53 | Signers - 7.53 | Update rate - 7.66 | Apps - 6.37 | Signers - 7.33 | Avg prev. - 5.88 |
| 4th | Apps - 6.49 | Avg prev. - 6.31 | Apps - 6.31 | Signers - 7.42 | Avg prev. - 6.34 | Update rate - 5.87 | Apps - 5.19 |
| 5th | Update rate - 5.36 | Update rate - 5.86 | Update rate - 6.29 | Apps - 5.85 | Unknown - 6.29 | Apps - 5.41 | Unknown - 4.74 |
| \CenterstackFeature | |||||||
|---|---|---|---|---|---|---|---|
| rank | \CenterstackMusic and | ||||||
| \CenterstackAuto and | |||||||
| \CenterstackTravel and | |||||||
| \CenterstackEntertainment | \CenterstackComics | \CenterstackFood and | |||||
| \CenterstackTools | drink | ||||||
| 1st | Avg prev. - 7.5 | Unknown - 7.51 | Signers - 7.56 | Days - 7.3 | Unknown - 9.69 | Avg prev. - 7.77 | Signers - 9.37 |
| 2nd | Update rate - 6.65 | Avg prev. - 7.34 | Avg prev. - 7.25 | Update rate - 6.07 | Update rate - 8.18 | Unknown - 7.77 | Unknown - 8.29 |
| 3rd | Days - 6.58 | Update rate - 7.08 | % apps AM - 6.23 | Signers - 5.95 | Signers - 6.72 | Signers - 7.42 | Avg prev. - 8.23 |
| 4th | Unknown - 5.36 | Days - 6.81 | Unknown - 6.07 | Unknown - 5.8 | Avg prev. - 5.87 | Days - 6.77 | Apps - 7.23 |
| 5th | Signers - 5.27 | Signers - 5.88 | Apps - 5.58 | Avg prev. - 5.64 | Apps - 5.63 | Update rate - 6.7 | Update rate - 5.21 |
| \CenterstackFeature | |||||||
|---|---|---|---|---|---|---|---|
| rank | \CenterstackCommunication | ||||||
| \CenterstackProductivity | \CenterstackHouse and | ||||||
| \CenterstackSocial | home | ||||||
| \CenterstackEntertainment | |||||||
| \CenterstackBusiness | |||||||
| \CenterstackEducation | |||||||
| Game | |||||||
| 1st | Signers - 9.67 | Days - 8.92 | Avg prev. - 9.93 | Unknown - 11.69 | Unknown - 8.82 | Update rate - 7.73 | Unknown - 8.87 |
| 2nd | Avg prev. - 7.17 | Avg prev. - 7.61 | Signers - 7.51 | Avg prev. - 11.16 | Signers - 8.57 | Days - 6.97 | Signers - 7.43 |
| 3rd | Unknown - 6.08 | Update rate - 6.94 | Unknown - 6.57 | Apps - 6.76 | Apps - 7.3 | Avg prev. - 6.78 | Update rate - 7.21 |
| 4th | Apps - 5.32 | Signers - 6.31 | Update rate - 5.9 | Signers - 6.22 | Days - 7.07 | Unknown - 5.23 | Apps - 6.68 |
| 5th | Tools - 4.74 | Tools - 4.18 | Apps - 5.49 | Update rate - 4.64 | Game - 6.22 | Apps - 4.82 | Days - 6.09 |
| \CenterstackFeature | ||||
|---|---|---|---|---|
| rank | \CenterstackComics | |||
| \CenterstackBooks and reference | ||||
| \CenterstackPhotography | ||||
| \CenterstackOverall | ||||
| average | ||||
| 1st | Unknown - 12.78 | Avg prev. - 10.27 | Avg prev. - 8.52 | Unknown - 8.18 |
| 2nd | Signers - 7.07 | Unknown - 9.85 | Signers - 7.48 | Avg prev. - 7.51 |
| 3rd | Apps - 6.45 | Days - 7.54 | Unknown - 6.99 | Signers - 7.1 |
| 4th | Avg prev. - 5.9 | Signers - 7.0 | Apps - 5.52 | Update rate - 5.86 |
| 5th | Game - 5.85 | % apps AM - 6.97 | Update rate - 5.48 | Apps - 5.39 |