A Framework for Modeling Polycyclic Aromatic Hydrocarbon Emission in Galaxy Evolution Simulations
Abstract
We present a new methodology for simulating mid-infrared emission from polycyclic aromatic hydrocarbons in galaxy evolution simulations. To do this, we combine theoretical models of PAH emission features as they respond to varying interstellar radiation fields, grain size distributions, and ionization states with a new model for dust evolution in galaxy simulations. We apply these models to idealized arepo galaxy evolution simulations within the smuggle physics framework. We use these simulations to develop numerical experiments investigating the buildup of PAH masses and luminosities in galaxies in idealized analogs of the Milky Way, a dwarf galaxy, and starburst disk. Our main results follow. Galaxies with high specific star formation rates have increased feedback energy per unit mass, and are able to efficiently shatter grains, driving up the fraction of ultra small grains. At the same time, in our model large radiation fields per unit gas density convert aliphatic grains into aromatics. The fraction of dust grains in the form of PAHs () can be understood as a consequence of these processes, and in our model PAHs form primarily from interstellar processing (shattering) of larger grains rather than from the growth of smaller grains. We find that the hardness of the radiation field plays a larger role than variations in the grain size distribution in setting the total integrated PAH luminosities, though cosmological simulations are necessary to fully investigate the complex interplay of processes that drive PAH band luminosities in galaxies. Finally, we highlight feature PAH strength variations, cautioning against the usage of emission templates with constant feature strength ratios.
1 Introduction
The mid-infrared wavelength regime of galaxy spectral energy distributions (SEDs) is dominated by a series of strong emission features at wavelengths . These features, first observed by Gillett et al. (1973) and Merrill et al. (1975), were attributed to vibrational modes of polycyclic aromatic hydrocarbons (PAHs) in the interstellar medium (ISM) of galaxies by Leger & Puget (1984) and Allamandola et al. (1985). In this picture, the emission features originate in ultrasmall dust grains (typically carbon atoms) that are arranged chemically in aromatic rings (Draine & Li, 2001). These PAH molecules stochastically absorb ultraviolet photons in single-photon heating events, become highly excited, and then cool by emitting a series of infrared (IR) photons via vibrational transitions. Here, different types of bending modes in the C-C and C-H molecular skeletons drive the individual emission features between (see Tielens 2008, Armus et al. 2020, and Li 2020 for reviews).
PAH emission is nearly ubiquitous in the spectra of star-forming galaxies. Helou et al. (2000) observed bright PAH emission in a sample of nearby galaxies with the Infrared Space Observatory (ISO; Kessler et al., 1996), while Smith et al. (2007) expanded on this significantly as a part of the Spitzer Infrared Nearby Galaxies Survey (Kennicutt et al., 2003), and investigated PAH emission from nearby galaxies. A key finding from these studies is that PAH emission can constitute as much as of the total infrared luminosity in a galaxy (Smith et al., 2007; Dale et al., 2009; Lai et al., 2020), though the relative feature strengths can vary substantially both within and between sources (Peeters et al., 2004b). Of the individual PAH features, emission at dominates, contributing up to of the total PAH luminosity (Hunt et al., 2010; Wu et al., 2010; Shipley et al., 2013).
The prevalence of PAH emission features in the mid-IR regime of galaxy SEDs coupled with their UV-based heating mechanisms have prompted a number of authors to investigate the utility of PAHs as a tracer of galaxy star formation rates (Peeters et al., 2004a; Bendo et al., 2008; Shipley et al., 2016; Maragkoudakis et al., 2018; Lai et al., 2020; Whitcomb et al., 2020; Evans et al., 2022). Shipley et al. (2016) compiled Spitzer Infrared Spectrograph (IRS) detections of galaxies at and derived a linear relationship between the H-measured star formation rate (SFR) of galaxies and their PAH luminosities. Similarly, the feature, which redshifts into the MIPS filter on Spitzer, has been used in numerous studies to determine the SFR of galaxies (Reddy et al., 2006; Yan et al., 2007; Siana et al., 2009; Wuyts et al., 2011; Rujopakarn et al., 2013). More recent analysis of Spitzer IRS observations by Whitcomb et al. (2022) and Zhang & Ho (2022), as well as WISE photometry by Chown et al. (2021) found that mid-IR PAH features may trace galaxy molecular gas as well.
At the same time, some physical conditions may suppress the PAH luminosities from galaxies (), causing deviations from this linear increase of with galaxy SFR. For example, there is significant observational evidence that the PAH luminosity from galaxies is suppressed in low-metallicity environments (Wu et al., 2006; Smith et al., 2007; Engelbracht et al., 2008; Hao et al., 2009; Hunt et al., 2010; Sandstrom et al., 2010; Shivaei et al., 2017; Aniano et al., 2020; Shivaei et al., 2022). Sandstrom et al. (2010) and Chastenet et al. (2019) presented maps of the Small Magellanic Cloud (SMC) and Large Magellanic Cloud (LMC), demonstrating that PAH mass fractions increase with increasing galaxy metallicity. Aniano et al. (2020) compiled data from nearby galaxies and derived fitting relationships between the PAH mass fraction, and O/H abundances in the ISM. While the origin of such a relationship is unclear, it may result from photodestruction of PAHs in unshielded environments (Voit, 1992; Hunt et al., 2010; Madden et al., 2006), increased erosion via thermal sputtering in a hotter ISM (Hunt et al., 2011), a lack of seed metals to grow into small grains, and/or a lack of seed dust grains that shatter into smaller particles (Seok et al., 2014). Some authors have further argued that the primary physical correlation may be with the radiation field hardness and not metallicity (e.g. Gordon et al., 2008), though it is possible that the smallest grains are able to survive even in harsh radiation environments (Lai et al., 2020).
Similarly, PAH emission is observed to be weaker than otherwise expected (given galaxy SFRs) in the vicinity of AGN (see the recent review by Sajina et al., 2022). This has been observed both in resolved imaging of nearby Seyfert nuclei or low-ionization nuclear emission line regions (LINERs), (e.g. Smith et al., 2007; Diamond-Stanic & Rieke, 2010; Sales et al., 2010), as well as in unresolved observations of galaxies at both low and high-redshift (Rigopoulou et al., 1999; Desai et al., 2007; Farrah et al., 2007; Pope et al., 2008; O’Dowd et al., 2009), though at least for some AGN-hosting galaxies, this trend is unclear (Lai et al., 2022). The putative physical mechanism behind the lack of PAH emission near AGN is radiative destruction of ultra small grains (Voit, 1992; Genzel et al., 1998). Recent JWST observations of HII regions in nearby galaxies have demonstrated an anti-correlation between PAH fraction and ionization parameter, which may be in support of this scenario (Egorov et al., 2022). Other works have suggested shocks as the main destruction mechanism for PAHs near AGN (Zhang & Ho, 2022). At the same time, some studies have suggested that ultraviolet radiation from AGN can actually excite PAH molecules (Howell et al., 2007; Jensen et al., 2017).
From a theoretical standpoint PAHs not only trace the physical properties of galaxies (e.g. Maragkoudakis et al., 2022), but also drive the evolution of the ISM. For example, Bakes & Tielens (1994) determined that these ultra small grains can dominate the photoelectric component to ISM heating in neutral gas, while at the same time PAHs may be an important constituent of interstellar chemical reactions (Lepp & Dalgarno, 1988; Bakes & Tielens, 1998; Weingartner & Draine, 2001). PAHs may be an important catalyst for molecular hydrogen formation as well (Thrower et al., 2012; Foley et al., 2018), and indeed have been detected even in CO dark molecular gas (McGuire et al., 2021).
Since their discovery, two broad approaches have emerged in modeling the emission features of astrophysical PAHs: empirical models, and density functional theory calculations (that are sometimes combined with laboratory measurements). Draine & Li (2001) and Draine & Li (2007) pioneered the development of empirical models for heating of ultrasmall aromatic carbonaceous grains – and their emergent emission features – assuming a Mathis et al. (1983)-like interstellar radiation field. Draine et al. (2021) significantly broadened this model by considering both a diverse range of incident radiation field spectral shapes, as well as bulk variations in the distributions of grain sizes and the ionization state. These models are agnostic about the composition of PAHs themselves, but are designed in the context of reproducing a broader background of observations, including infrared SEDs from galaxies and extinction properties (e.g., Hensley & Draine, 2020). Specifically, the cross sections, width and locations of the PAH bands that are modeled by Draine et al. (2021) are tuned to match astrophysical spectra of galaxies, including the SINGS sources from Smith et al. (2007). In contrast, density functional theory modeling involves computing the theoretical emission spectra for grains of a diverse range of chemical compositions (Bauschlicher et al., 2010; Boersma et al., 2014; Bauschlicher et al., 2018; Mattioda et al., 2020; Kerkeni et al., 2022; Rigopoulou et al., 2021; Vats et al., 2022). These “database” approaches employ fitting techniques in order to deduce the PAH size distributions and ionization fractions from observations (e.g. Maragkoudakis et al., 2022).
With the launch of the JWST in 2021, observational studies of PAHs in galaxies are poised to enter their renaissance – already JWST is revealing the impact of galactic environment on PAH emission in galaxies near and far at unprecedented sensitivity and spatial resolution (e.g. Armus et al., 2022; Chastenet et al., 2022; Dale et al., 2022; Egorov et al., 2022; Evans et al., 2022; Langeroodi & Hjorth, 2022; Lai et al., 2022; U et al., 2022; Chastenet et al., 2023; Sandstrom et al., 2023). What is missing thus far is quantitative methodology for modeling the physical processes that drive the evolution of dust in the interstellar medium in galaxies that span a wide range of physical conditions, and connecting these processes to the emergent PAH emission.
The purpose of this paper is to do just that. In what follows, we develop a model for simulating the mid-infrared emission from PAHs in hydrodynamic galaxy evolution simulations. Our paper is organized as follows: in § 2, we describe our methodology of simulating the evolution of dust on the fly in galaxy evolution simulations, and the coupling of this model with the Draine et al. (2021) theoretical model for the strength of PAH emission from grains in varying ISM physical conditions. In § 3 we introduce a sample of galaxy evolution models that we will use for the purposes of numerical experiments, and describe their physical properties. In § 4, we demonstrate the results of our methodology by simulating the mid-IR SEDs and images of our model galaxies. In § 5, we explore the origin of PAH masses and luminosities in these idealized galaxy evolution simulations. In § 6, we provide discussion, and in § 7 we summarize.
2 Model Implementation
2.1 High-Level Overview and Modeling Philosophy
Our main goal in this paper is to develop a modular framework for simulating PAH emission in galaxy evolution simulations. To do so requires a multi-scale methodology with a large dynamic range of physical processes modeled. While many of the methods that we include as subresolution processes are uncertain in the literature, our aim is to develop this model in a sufficiently parameterized way that new physics can be implemented or updated as the field evolves rapidly during the era of JWST.
The dominant drivers of the PAH spectrum in our model are: (i) the dust grain size distribution; (ii) the intensity and spectrum of the interstellar radiation field (ISRF); and (iii) the ionization fraction of the PAHs. In order to simulate the PAH emission spectrum from galaxies, then, we must model each of these physical processes, and tie them together. To do this, we couple the Draine et al. (2021) model – that describes the emitted PAH spectrum as a function of the grain size distribution, ISRF, and ionization state – with a new generation of hydrodynamic galaxy evolution simulations that explicitly model the formation, growth, and destruction processes of dust with a carefully tracked distribution of sizes. In the following sub-sections, we describe the details of each of these elements in turn.
2.2 Computing the PAH Emission Spectrum with Varying Physical Conditions: Summary of the Draine et al. (2021) Model
We first begin with a summary of the Draine et al. (2021) model for PAH emission in a range of environments: this will set the stage for the subsequent elements of our model. In short, the Draine et al. (2021) model updates that of Draine & Li (2007) in computing the sensitivity of the PAH emission spectrum to the three major physical inputs: the spectrum of the illuminating radiation field, the dust grain size distribution and the PAH ionization state.
The Draine et al. model considers the starlight spectrum from different radiation fields111Formally, these were actually computed twice: once in an unreddened mode, and a second time through a slab of dust with to simulate progressive reddening in dusty clouds., all treated as single-age stellar populations (SSPs): these radiation fields span a diverse range of spectral shapes. In detail, the SSP models are comprised of: Bruzual & Charlot (2003) starburst models ranging in range from Gyr; bpass binary star SSP models (Eldridge et al., 2017; Stanway & Eldridge, 2018) models over the same age ranges, as well as a low metallicity model; and finally an older stellar population akin to the bulge of M31 (Groves et al., 2012). Additionally a modified Mathis et al. (1983) solar neighborhood-like model is included. Because our models explicitly compute the impact of interstellar reddening via a combination of on-the-fly dust evolution models (2.3) as well as full 3D Monte Carlo radiative transfer (2.4), we employ only the unreddened versions of these stellar radiation fields from Draine et al. (2021).
This starlight intensity is parameterized by the rate of energy absorption onto grains given by the dimensionless intensity parameter:
| (1) |
Here, is the energy density of the radiation field, is the orientation-averaged absorption cross section for a standard dust grain (here, the “astrodust” grain with porosity and radius m; Hensley & Draine, 2022), and is the heating rate for the modified Mathis et al. (1983) spectrum (hereafter, the mMMP spectrum) where erg/s. is a dust absorption weighted radiation field energy density, which traces the dust heating effectiveness for a given starlight spectrum, and is normalized to that of the mMMP radiation field: represents a harder radiation field than the mMMP field, and is softer than mMMP. Formally, is computed by:
| (2) |
Draine et al. (2021) explicitly compute the difference in mid-IR features in response to different starlight spectra and intensities. We therefore need to explicitly compute this dimensionless parameter throughout our model galaxies, which we describe in § 2.4.
The PAH emission spectrum is computed by Draine et al. for individual PAH grain sizes, equally spaced log values from log, and a binary ionization state (neutral or ionized). While this is a simplification, this parameterizes the PAH emission spectrum in terms of physical input parameters that modern day galaxy evolution modeling techniques can track.
In the remainder of this section, we describe our methodology for computing the dust content, grain size distribution, and ISRF from hydrodynamic simulations of galaxy evolution.
2.3 Dust Content and Grain Size Distributions
Our dust model is described in detail in Q. Li et al., (in prep), and builds off of the framework developed by McKinnon et al. (2018) and Li et al. (2019). We describe this model, as well as updates to the McKinnon et al. (2018) model here for completeness.
2.3.1 Dust Formation
The first major element in our model is to simulate the evolution of the dust grain size distribution in galaxies. To do this, we introduce a new model for the formation, growth, and destruction of dust grains in highly resolved galaxy evolution simulations. In detail, we couple this dust model with the smuggle galaxy formation physics suite and the arepo hydrodynamics code (both are described in more detail in § 2.5), but in practice the methods that we outline here are generalizable for any galaxy evolution model that considers the evolution of the physical state of the ISM, as well as stellar evolution processes.
Dust is produced through the condensation of metals that are returned to the ISM by evolved stars. Functionally in the models we produce simulated dust particles directly from simulated evolved star particles. We employ dust yields from Schneider et al. (2014) for Asymptotic Giant Branch (AGB) star dust production, and from Nozawa et al. (2010) for supernovae dust production. The initial grain size distribution for dust follows a lognormal size distribution:
| (3) |
where C is a normalization constant and . for dust produced by AGB stars and for SNII, following the work by Nozawa et al. (2007) and Asano et al. (2013). This said, the results presented here are not strongly dependent on the initialized size distributions: due to interstellar processing of the dust grains, they quickly lose their memory of their initial size distributions (the relevant processes are described in more detail in § 2.3.2). We discretize the simulation dust particle sizes into size bins. This choice is arbitrary, though we find that this value results in converged size distributions in our simulations.
In detail, we spawn new simulation dust particles from simulation star particles in a stochastic manner. If a star particle of mass produces a dust mass within a time step , we spawn a new dust particle of mass probabilistically if a randomly drawn number from a uniform distribution between is less than:
| (4) |
This stochastic production of dust particles mirrors the stochastic production star particles that has long been used in galaxy formation simulations (e.g. Springel & Hernquist, 2003) and ensures the total mass of dust spawned matches the integral of the dust production rate over long time periods. We merge dust particles together if the mass of two neighboring particles is smaller than , and split them if they grow to .
The mass of dust produced by evolved stars follows the methodology of Dwek (1998), with updated condensation efficiencies as described in Li et al. (2020). Following Dwek (1998), the dust mass produced by AGB stars with a carbon-to-oxygen mass ratio C/O 1 is expressed as:
| (5) |
where is the condensation efficiency of element for AGB stars. The mass of dust produced by AGB stars with C/O 1 is expressed as
| (6) |
where is the mass of the species in amu. The mass of dust produced by Type II SNe is modeled as
| (7) |
where is the condensation efficiency of element for SNII. Here, we assume a fixed AGB condensation efficiency of (Ferrarotti & Gail, 2006) and (Bianchi & Schneider, 2007). We assume two types of dust particles: silicates and carbonaceous. For a given dust particle in our model, the total carbon mass in the dust particle corresponds to the carbonaceous dust mass, and the remainder to silicate.
2.3.2 Dust Evolution
Dust grains evolve from their initialized size distribution as they undergo growth from accretion, coagulation, thermal sputtering, shattering, and destruction in shocks and star forming regions.
Physical dust particles, with radius , grow via the accretion of metals at a rate (Hirashita & Kuo, 2011):
| (8) |
where the accretion timescale, , is proportional to the size of the grain, and inversely proportional to the gas density, temperature, and metallicity:
| (9) |
where is the metal density, is the gas temperature, and is the sticking coefficient. The growth timescale is limited by the least abundant element required by the grain species following Choban et al. (2022). We adopt () = for silicates (assuming a composition of MgFeSiO4 for silicates; Weingartner & Draine, 2001), and () = for carbonaceous grains. We additionally adopt temperature dependent sticking coefficient following Zhukovska et al. (2016) which drops at higher temperatures (Q.Li et al. in prep.). This has the effect of significantly reducing the growth rates in the warm and dense ISM that is heated by stellar feedback (more on this in § 2.5).
We include two forms of dust destruction: thermal sputtering and, in star-forming regions, supernovae shocks. For thermal sputtering, grains can be eroded by hot electrons (which is especially pertinent in the hot ISM and in hot halos):
| (10) |
where the sputtering timescale, follows the analytic approximation derived by Tsai & Mathews (1995), and is linearly proportional to the grain radius, and inversely proportional to the gas density and temperature. Supernova shocks additionally destroy dust grains via thermal sputtering, where the evolution in the grain size distribution follows the models of dust destruction in supernovae blastwaves by Nozawa et al. (2006) and Asano et al. (2013). The change rate of mass of grains in the th size bin due to thermal sputtering is
| (11) |
Here, is the gas mass, is the rate of supernovae near the dust particle, is the mass of neighboring gas swept by SN shocks (which is derived from Yamasawa et al. 2011), and is the internal density of a dust grain with and for silicate and carbonaceous grains, respectively.
Finally, we consider the impact of grain-grain collisions on the size distribution of dust grains. There are two important effects: dust shattering, which results from high-speed encounters (and transforms large grains into many small grains), and dust coagulation, which results from low-speed encounters (and transforms small grains into large grains). Collision processes are mass conserving, but not number conserving. Following McKinnon et al. (2018) and Li et al. (2021), we model the transformation of grain sizes in collisional encounters by the mass evolution of grain size bin by:
| (12) | |||
as long as the relative velocity between grains is greater than a threshold velocity . Here, the grain sizes are denoted with , is the mass of the grain in bin , and is the resulting mass entering bin due to the collision between the grains in bins and . Jones et al. (1996) suggest a threshold velocity of km s-1 for silicates, and km s-1 for carbonaceous grains. We implement a similar transfer of mass between size bins for dust coagulation, though of course in this situation we only do so if . We follow Hirashita & Yan (2009) in employing a threshold velocity222There is clearly some freedom in computing these shattering rates: in particular, the choice of a threshold velocity where collisional processes transition from coagulation to shattering. While a full exploration of the impact of the threshold velocities on the PAH population is outside the scope of what is computationally feasible here, we note that a similar implementation of dust collisional processes in the simba simulation by Li et al. (2021) of Milky Way-like galaxies in a cosmological simulation results in grain size distributions comparable to a Mathis et al. (1977) “MRN” size distribution, and extinction laws comparable to the Cardelli et al. (1989) Galactic constraints. We have therefore adopted the same threshold velocity here, without any tuning. that is dependent on the grain sizes as well as the material properties of the species, following their Equation 8.
2.3.3 Converting between Aromatics and Aliphates
In our model, all dust grains that are dominated by carbon are considered carbonaceous; else, they are silicates. Within the carbonaceous population, dust grains are subdivided into aromatic hydrocarbons, and aliphatic hydrocarbons. We assume that the former represent PAHs. We do not impose a size cut-off for PAHs, though note that larger PAHs are not effective emitters. We track both aromatics and aliphates, and follow the methodology of Hirashita & Murga (2020) in converting between the two333We note that more recent models by Hensley & Draine (2022) and references therein have advanced a picture of “astrodust+PAHs”, where large grains are aggregated in their properties into astrodust, while nanoparticle aromatic carbonaceous grains are considered PAHs. From the standpoint of the interface between our model and the Draine et al. (2021) model, the treatment of the larger grains is less important than the PAHs themselves. Once ultrasmall carbonaceous grains are aromatized in our model, we consider them PAHs, and they adopt the properties of the PAHs in the Draine et al. (2021) and Hensley & Draine (2022) models..
In short, aromatization (i.e., the conversion from aliphates to aromatics) is assumed to occur due to photoprocessing, and the removal of hydrogen atoms from carbonaceous dust grains (i.e., dehydrogenation; Rau et al., 2019; Hirashita & Murga, 2020)444While the removal of aliphatic side-groups from aromatic rings may also serve as a mechanism for aromatizing carbonaceous grains, we assume that this process is dominated by de-hydrogenization. Future work will explore more detailed models for grain aromatization processes.. This is quantified by the change of the band gap energy, , which can be related to the fraction of hydrogen atoms in the grain, , via eV (Tamor & Wu, 1990; Hirashita & Murga, 2020). Rau et al. (2019) and Hirashita & Murga (2020) compute the timescale for full aromatization (i.e., the time necessary to fully dehydrogenate the grain, from its maximum assumed possible to its minimum assumed value of ; Jones et al. 2013) of:
| (13) |
where is the strength of the interstellar radiation field, and corresponds to the Solar neighborhood555 is related to in Equation 1. We choose to employ two different variables here, however, in order to maintain consistency with other literature works. Hirashita & Murga (2020) compute this fitting formula for the aromatization time via photo-processing by assuming a Mathis et al. (1983) radiation field shape. This represents a minor inconsistency in our modeling, as the local radiation field in galaxies often departs from the Mathis et al. (1983) fiducial shape, and indeed a major aspect of § 2.4 is to explicitly account for these variations when computing the PAH emission spectrum. Nevertheless, we proceed as an on-the-fly calculation of the exact ISRF shape (which requires both knowledge of the stellar spectral shapes, as well as the effects of the absorption and scattering of photons by interstellar dust) is currently computationally intractable in hydrodynamic galaxy evolution simulations. We instead compute the strength of the local interstellar radiation field by computing a nearest neighbor search around each dust particle to get both the location of nearby stars, as well as the dust column density between that star and the dust particle of interest. We compute a mass-to-light ratio for these stars with fsps (Conroy & Wechsler, 2009; Conroy et al., 2009), and assume a Weingartner & Draine (2001) extinction law between the star particle and the dust grain. The incident radiation fields are then summed to compute the local FUV flux. We note that this extinction correction is not fully consistent with the grain size distribution and composition, though is necessary for computational feasibility.
We assume that aromatic grains (i.e., those that we consider to produce the mid-IR PAH features) aliphatize via the accretion of free elements. Using two-phase simulations, Murga et al. (2019) and Hirashita & Murga (2020) find a fitting function for the aliphatization rate in terms of the grain size distribution:
| (14) |
Hirashita & Murga (2020) compute this fitting formula for dense gas, which is defined as cm-3. We therefore implement a threshold density of cm-3 below which aromatic grains cannot aliphatize. This serves as a limiter for the conversion of aromatics to aliphates in diffuse gas in our model.
2.4 Modeling the Interstellar Radiation Field
With these pieces in hand, we now have a model for the evolution of grain size distributions, and in particular, for the aromatic carbonaceous component of the dusty ISM, in place. The next stage is to compute the emission properties of these aromatic hydrocarbons. PAHs are excited by ultraviolet and optical photons, and emit via vibrational transitions as they cool. Because of this, the shape of the ISRF matters significantly. In order to model the ISRF, we employ the publicly available powderday dust radiative transfer package666github.com/dnarayanan/powderday (Narayanan et al., 2021), which employs yt, fsps, and hyperion for grid generation, stellar population synthesis calculations, and Monte Carlo radiative transfer respectively (Turk et al., 2011; Conroy et al., 2009; Robitaille, 2011). We refer the reader to the code paper (Narayanan et al., 2021), as well as the documentation site777powderday.readthedocs.org for details, and here describe the major attributes of powderday that impact our calculations, as well as updates since the Narayanan et al. (2021) code paper that we have implemented in order to enable this work.
We begin by computing the intrinsic stellar spectrum of all of the stars in individual snapshots of our hydrodynamic simulations based on their ages and their metallicities as computed by the galaxy evolution model. The stellar spectra of these stars are computed using fsps (Conroy et al., 2009, 2010; Conroy & Gunn, 2010). We assume the mist stellar isochrones (Choi et al., 2016), and a Kroupa (2002) stellar initial mass function. This light is emitted in an isotropic manner in a Monte Carlo fashion through the interstellar medium of the galaxy. As we will describe in § 2.5 (though in principle these methods are generally applicable to a range of types of galaxy simulations), we conduct our hydrodynamic simulations with the arepo code on a Voronoi mesh. The radiation therefore propagates through this Voronoi mesh, and encounters the dust content and size distribution as computed in § 2.3.
Informed by the grain size distribution in every cell, we compute the local extinction law on a cell-by-cell basis following the methods outlined in Li et al. (2021). In detail, the optical depth at a wavelength can be computed in terms of an extinction efficiency:
| (15) |
where is the extinction efficiency, and is the number density of grains with sizes (we do not assume any subresolution clumping: the density is the number of grains divided by the cell volume). We assume the efficiencies as computed by Draine & Lee (1984) and Laor & Draine (1993) for silicates and carbonaceous grains, respectively, though in future versions of this code we will implement the newly developed “astrodust” size-dependent extinction properties of dust grains (Hensley & Draine, 2022). The wavelength dependent extinction is:
| (16) | |||
Having computed the local extinction law in every cell in the model galaxy, we proceed with the Monte Carlo dust radiative transfer. The direction and frequency of photons are randomly drawn, and the photons are propagated until they either escape the grid, or reach a randomly drawn optical depth drawn from an exponential distribution. Formally, where . Photons can be either scattered or absorbed at this point, depending on the dust albedo. This procedure is iterated upon until the equilibrium dust temperature is converged. Upon convergence, we have the mean interstellar radiation field in every cell in the galaxy at wavelengths longer than .
The Draine et al. (2021) model emission spectra for PAHs are pre-computed per dust grain size for different incident radiation fields and log intensities. Because the radiation fields in any individual cell are not likely to be well-described by any of the individual pre-computed stellar SEDs employed in the Draine et al. (2021) model, we employ a non-negative least squares decomposition. This is akin to treating the Draine et al. (2021) input SEDs as basis functions, and determining the coefficients in front of these basis functions that allow for a linear combination into a cells individual radiation field.
At this point, for every cell we know how the local ISRF can be decomposed into the Draine et al. (2021) basis SEDs, as well as the individual grain size distribution. The final step in this model is to compute the ionization state of the PAHs in every cell. We follow Draine et al. (2021) and Hensley & Draine (2022), and utilize the analytic relationship between grain size and ionization fraction:
| (17) |
In reality the grain ionization state will depend on local conditions, such as the density and incident radiation field. We discuss the model prospects for implementing a more sophisticated model for grain ionization in § 6.
The PAH emission spectrum in each individual cell can now be computed as a summation of the PAH emission spectra per grain size, at a given log, ionization state, and fractional contribution per basis SED incident radiation field. These PAH emission spectra are then added as source terms, and the dust radiative transfer is re-iterated upon, this time including the PAHs. The purpose of this second iteration is to capture any potential attenuation of PAHs in extremely dense environments. Indeed at least some simulations have suggested extreme optical depths in dusty galaxies such as model submillimeter galaxies (Lovell et al., 2022).
Finally, the aggregate SED from model galaxies are computed via ray tracing. Here, the source function is computed at each position in the grid, and then we integrate the equation of radiative transfer along each line of sight at multiple viewing angles surrounding the model galaxy.
2.5 Galaxy Evolution Simulations
We have implemented the aforementioned model into the arepo hydrodynamic code base (Springel, 2010; Weinberger et al., 2020), with the Stars and MUltiphase Gas in GaLaxiEs (smuggle) galaxy formation physics suite enabled (Marinacci et al., 2019). Here, we describe the relevant details, though note that in principle the methods for the emission properties of PAHs described thus far are agnostic to the actual galaxy formation code and implemented physics.
Primordial cooling occurs via two-body collisional processes, recombination, and free-free emission (Katz et al., 1996), as well as Compton cooling off of CMB photons. Metal-enriched gas undergoes metal line cooling, whose rates are computed as a function of temperature and density based on cloudy photoionization calculations (Ferland et al., 2013), as described in Vogelsberger et al. (2013). Low-temperature cooling (T K) can occur via metal line, fine-structure, and molecular cooling processes via a fit to the Hopkins et al. (2018) cloudy cooling tables as presented in Marinacci et al. (2019). Here, gas at densities cm-3 can self-shield, following the Rahmati et al. (2013) parameterization. The self-shielding processes are redshift-dependent: because the simulations presented here are idealized disk galaxies, we adopt the scalings from Table A1 of Rahmati et al. (2013). At the same time, gas can be heated both by cosmic rays, as well as photoelectric processes. Cosmic ray heating follows the density-dependent prescription of Guo & White (2008), while photoelectric heating follows the density, metallicity, and temperature-dependent rates derived by Wolfire et al. (2003). Details for the implementation of both heating rates are given in Equations – of Marinacci et al. (2019).
Star formation occurs in gravitationally bound gas (Hopkins et al., 2013) above a specific density threshold. We set this threshold for our simulations to cm-3. Star formation in this gas occurs probabilistically (Springel & Hernquist, 2003) following a volumetric Kennicutt (1998) relation such that:
| (18) |
where is the star formation efficiency, is the star formation rate, is the gas mass, and is the gas free fall time:
| (19) |
We set the star formation efficiency factor to : Hopkins et al. (2018) demonstrate that the effective star formation efficiency for explicit feedback models such as this are relatively insensitive to this choice (see the review by Vogelsberger et al., 2020). We limit star formation to occur exclusively in molecular gas and compute the molecular gas fraction via the Krumholz et al. (2008, 2009a, 2009b) prescription linking the H2 fraction to the local gas surface density and metallicity.
Once formed, stars return energy to the ISM. The fraction of Type I and II supernovae are computed from each star particle by assuming a Chabrier (2001) stellar initial mass function, though the former also includes a delay time distribution in deriving the number of Ia events (Vogelsberger et al., 2013). The details for mass loss rates, and energy and momentum coupling to the ISM are detailed in Marinacci et al. (2019). Similarly, young stars impart feedback into the nearby ISM via radiation. Here, feedback is included from young star photoionization, radiation pressure, and OB and AGB stellar winds. Taken together, these feedback mechanisms act to both regulate the star formation rates in our model galaxies, as well as impact ISM densities, temperatures, and velocity dispersions that can determine critical dust processes such as growth rates and grain velocities.
| Name | Galaxy Type | Mhalo | |||||
|---|---|---|---|---|---|---|---|
| MW | Milky Way Analog | 12 | |||||
| Sbc | Gas-Rich Starburst | 11 | |||||
| Dwarf | Low Metal Dwarf | 15 |
3 Evolution of Galaxy and Dust Physical Properties
3.1 Galaxy Model Overview
In this paper, we examine the physical and emission properties of PAHs from idealized galaxy evolution simulations. These simulations, while initialized to broadly resemble properties of different galaxy types observed in the local Universe, are not by any means intended to serve as specific analogs to any individual galaxy. Instead, our goal is to simulate a diverse range of physical conditions in order to build a physical foundation for what drives variations in dust grain properties in galaxies, and how that impacts their PAH masses and luminosities. Future work will include bona fide cosmological simulations with realistic evolutionary histories, and detailed comparisons to large samples of galaxies in the JWST era.
3.2 Initial Conditions and Galaxy Models
We set up equilibrium initial conditions for three idealized galaxy models (described shortly) following the technique first described by Springel et al. (2005). Galaxies are initialized with gaseous and stellar disks, an old star bulge, and embedded in a live dark matter halo with a Hernquist (1990) density profile. The disk components are exponential radially, though the stellar disk follows a sech2 vertical profile. The halo concentration and virial radius for a halo of a given mass are motivated by -body cosmological models following Bullock et al. (2001) and Robertson et al. (2006). We follow Hopkins et al. (2011), and initialize model galaxies: a Milky Way analog (MW), a Dwarf galaxy, and a starburst disk (Sbc). These vary not only in mass, but initial stellar and gas fractions. We summarize the initial condition parameters in Table 1.
3.3 Galaxy Physical Property Evolution
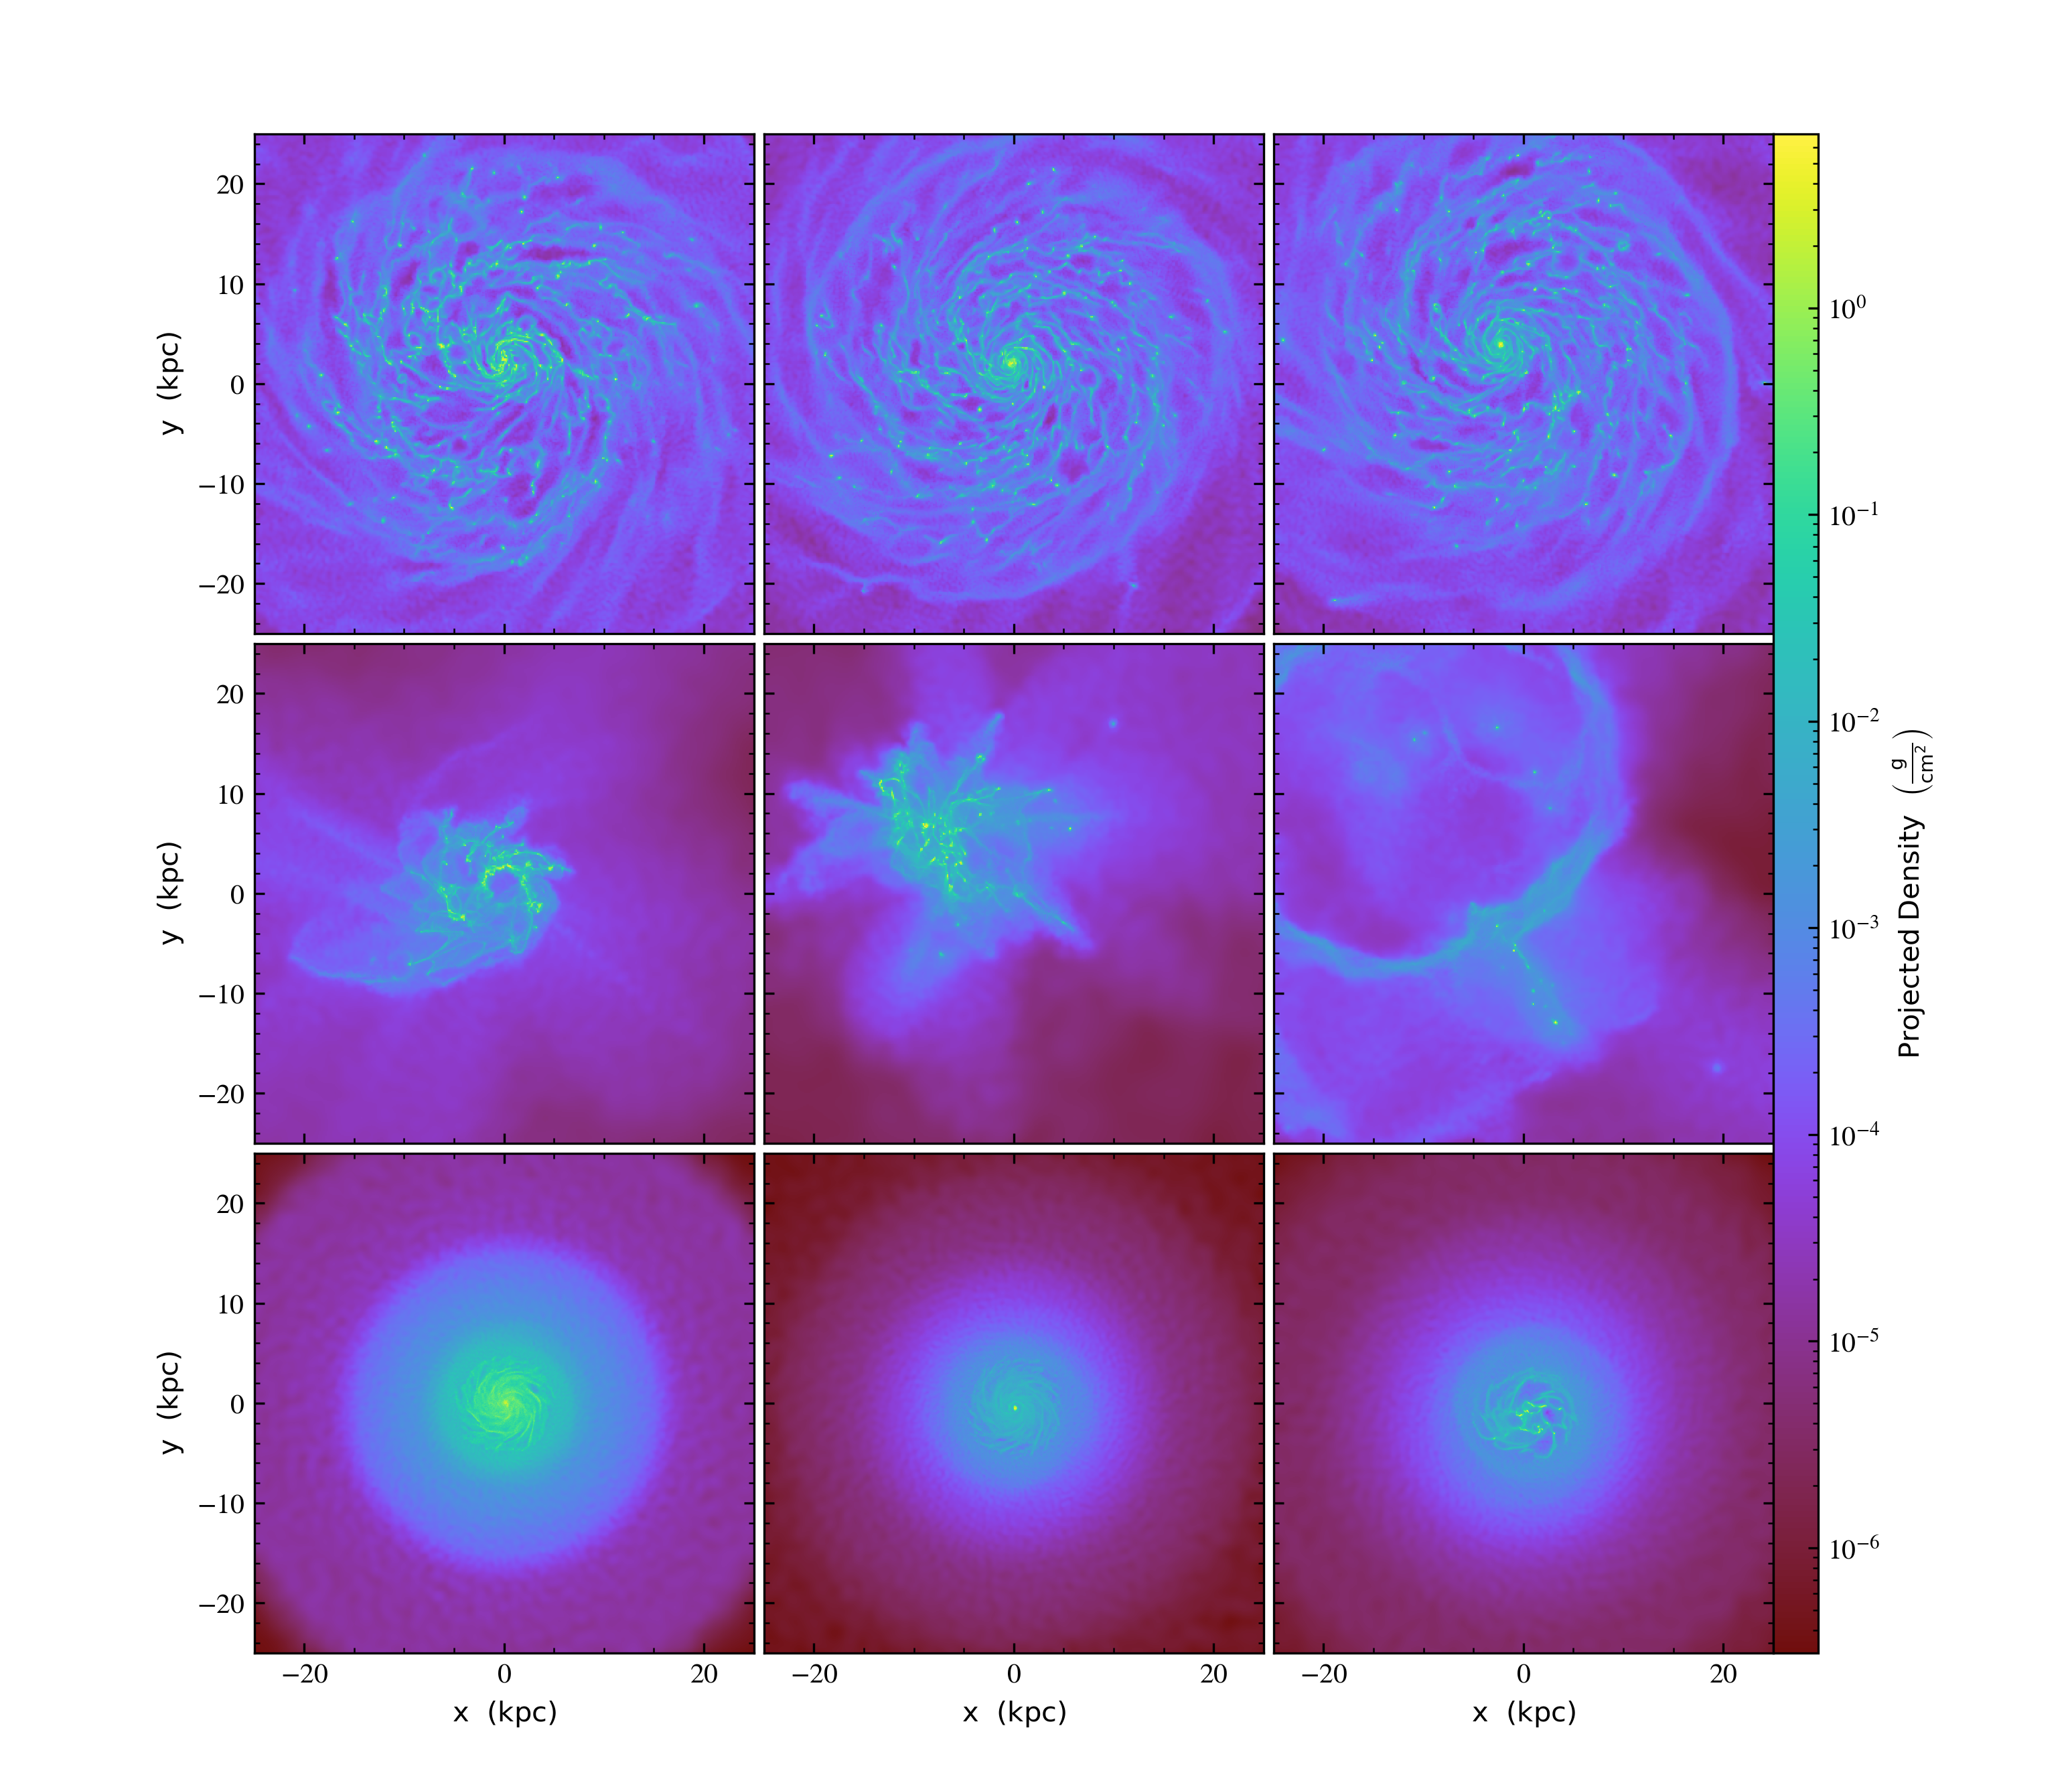
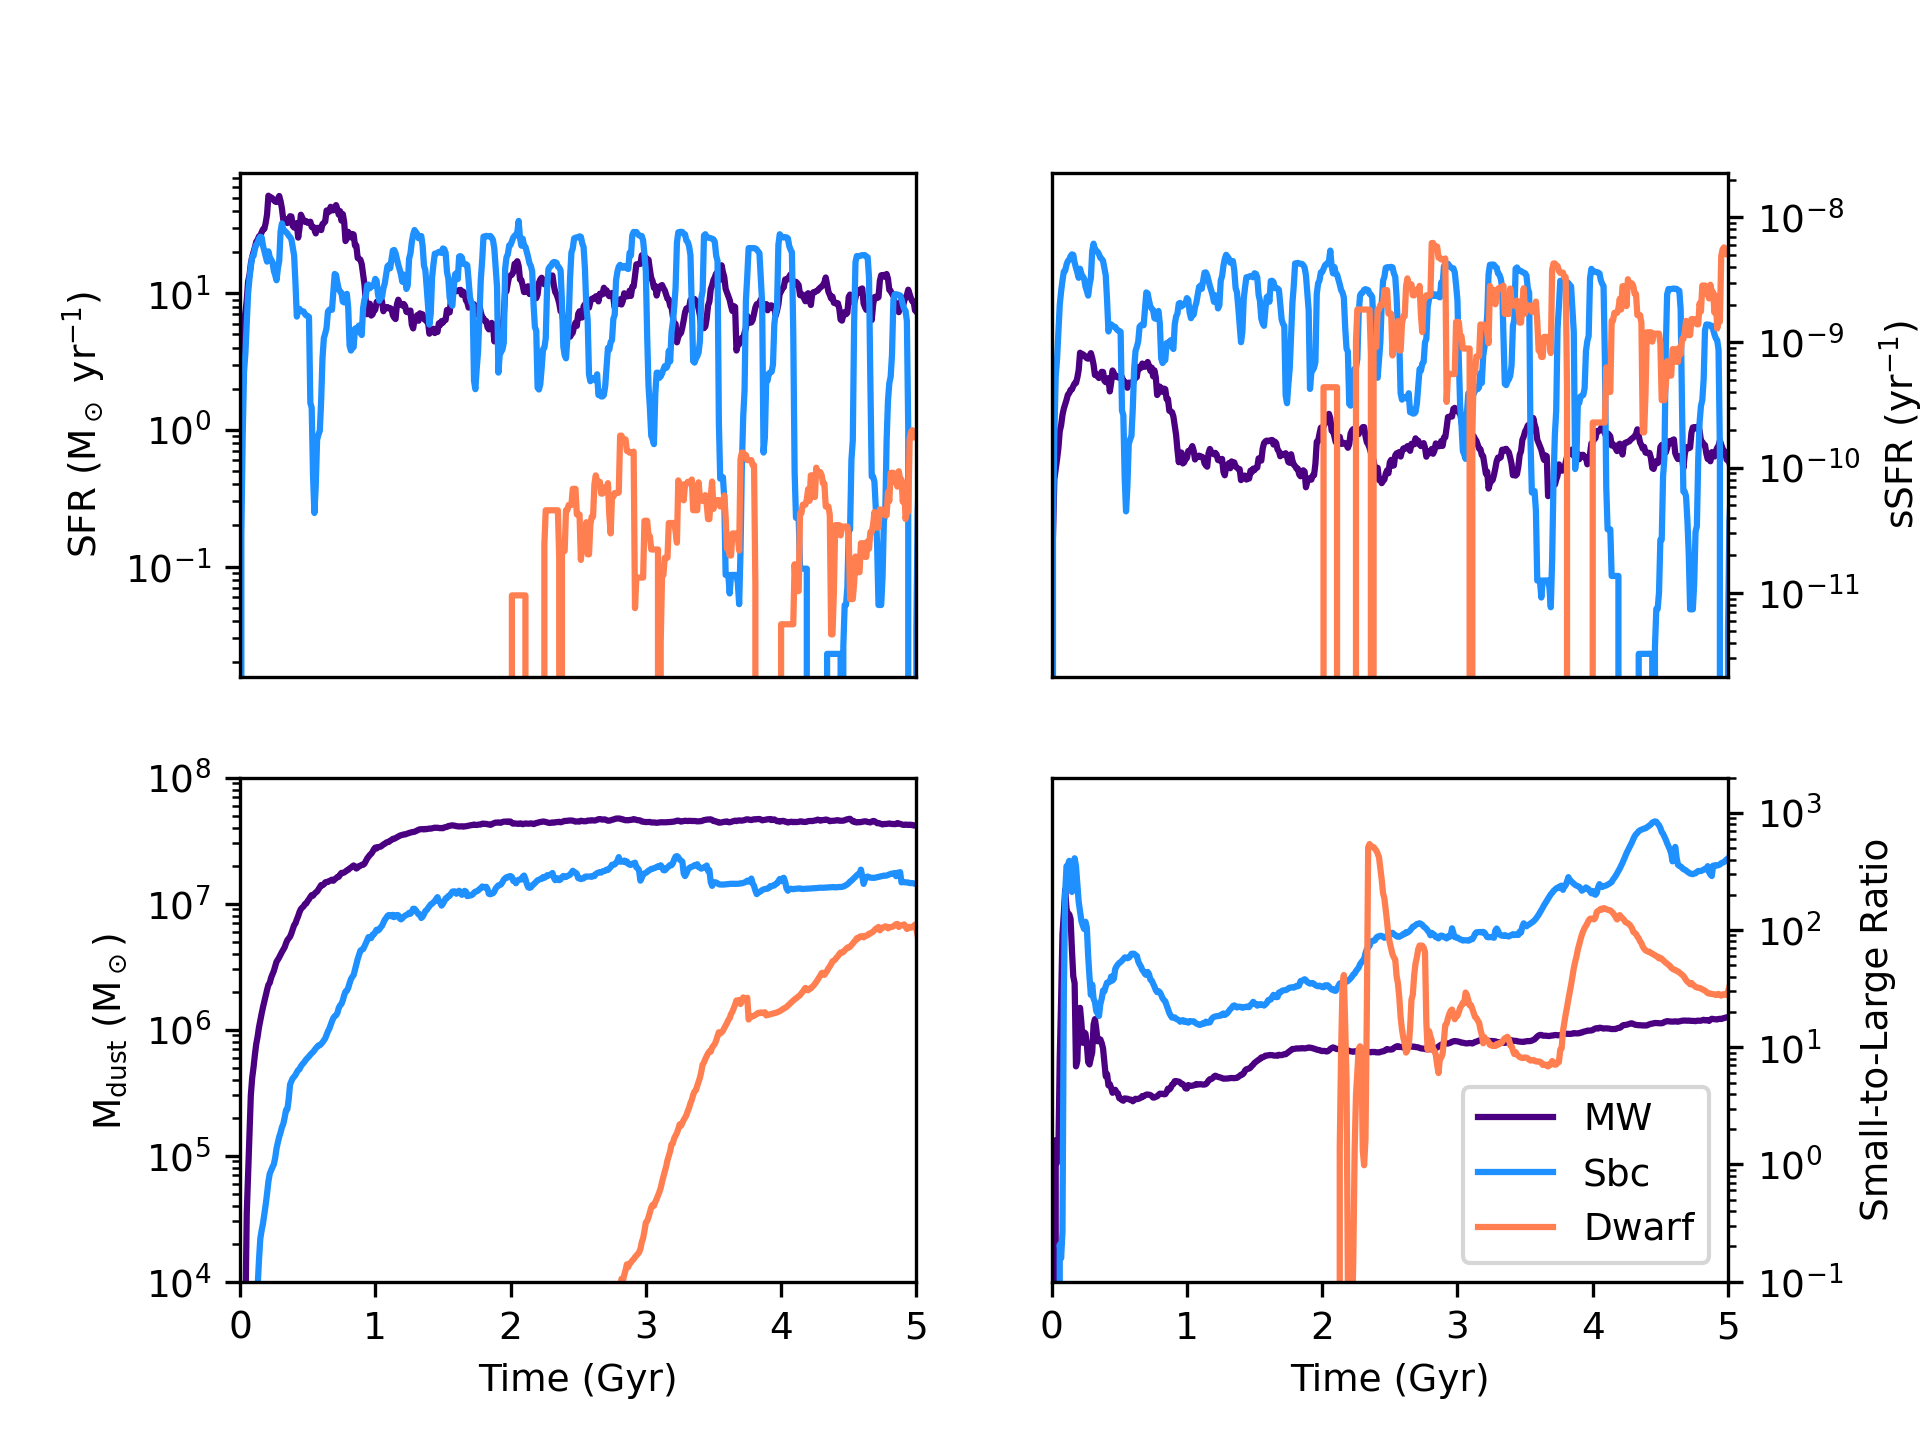
We first orient the reader to the evolution of the galaxy physical properties by showing their gaseous morphologies at various evolutionary points between t=[] Gyr (Figure 1), as well as the evolution of four key physical properties in Figure 2. In particular, we present (clockwise from the top left): the SFR, specific SFR (sSFRSFR/), dust mass and mass ratio of small grains to large grains. We discuss these panels in turn.
The galaxy SFRs are bursty, though oscillate around relatively steady values. This is an effect of the feedback model, which results in relatively self-regulated star formation histories that proceed in a quasi-equilibrium state (Marinacci et al., 2019), and has been extensively documented in other explicit feedback models such as fire (Hopkins et al., 2011, 2018; Gurvich et al., 2022).
In the top right panel of Figure 2, we show the galaxy specific star formation rates (SFR/) for our three idealized galaxy models. While the total star formation rates for the Sbc and MW are significantly greater than the Dwarf galaxy model, we now see that the sSFRs for the Sbc and Dwarf are a factor greater than the MW model. This is due to our choice of parameters in the initial conditions (Table 1): specifically, both the Dwarf and Sbc models are initialized with a significantly higher gas fraction than the MW, and at least as high of a halo concentration. This results in high gas densities, and subsequently increased star formation rates per unit stellar mass in these lower mass systems. As we will discuss throughout the remainder of this paper, this will have an impact on the grain size distributions and PAH properties in these galaxies.
For each model galaxy, the dust masses grow rapidly early on, and eventually stabilize (bottom left of Figure 2). The growth of dust masses owes first to formation in evolved stars, but is then dominated by growth via metal accretion (Li et al., 2019; Whitaker et al., 2021). At the same time, this is balanced by the destruction of dust via thermal sputtering. Because the implemented feedback models regulates star formation in a quasi-equilibrium state, the growth rates remain relatively constant owing to steady metal injection into the ISM. Similarly, the rates of dust destruction also remain relatively constant owing to a lack of rapid variations in the galaxy physical properties (Marinacci et al., 2019). It is important to note that while this is the case for idealized galaxies in a self-regulated model, this sort of quasi-equilibrium evolution in physical properties may not necessarily apply to galaxies evolving in a cosmological context.
Finally, in the bottom right of Figure 2, we show the evolution of the ratio of small grains to large grains for each of our models. This ratio is defined here as the ratio of mass of grains smaller than (the size for a PAH dust grain with carbon atoms) to mass of grains greater than , though the trends are robust against reasonable changes to this fiducial value. The size evolution of dust grains is primarily dictated in our model by the ratio of shattering to coagulation. Shattering processes result in large grains transitioning to smaller grains. Models Sbc and Dwarf have relatively large specific star formation rates compared to model MW, and hence inject more energy per unit mass into the ISM than model MW. The increased velocity in the ISM drives up shattering rates (Equation 12), and increases the small to large ratio. It is these small dust grains that have the potential to emit in the mid-IR, and will be of interest in the remainder of this paper.
4 Demonstration of Methods: PAH Spectra and Images
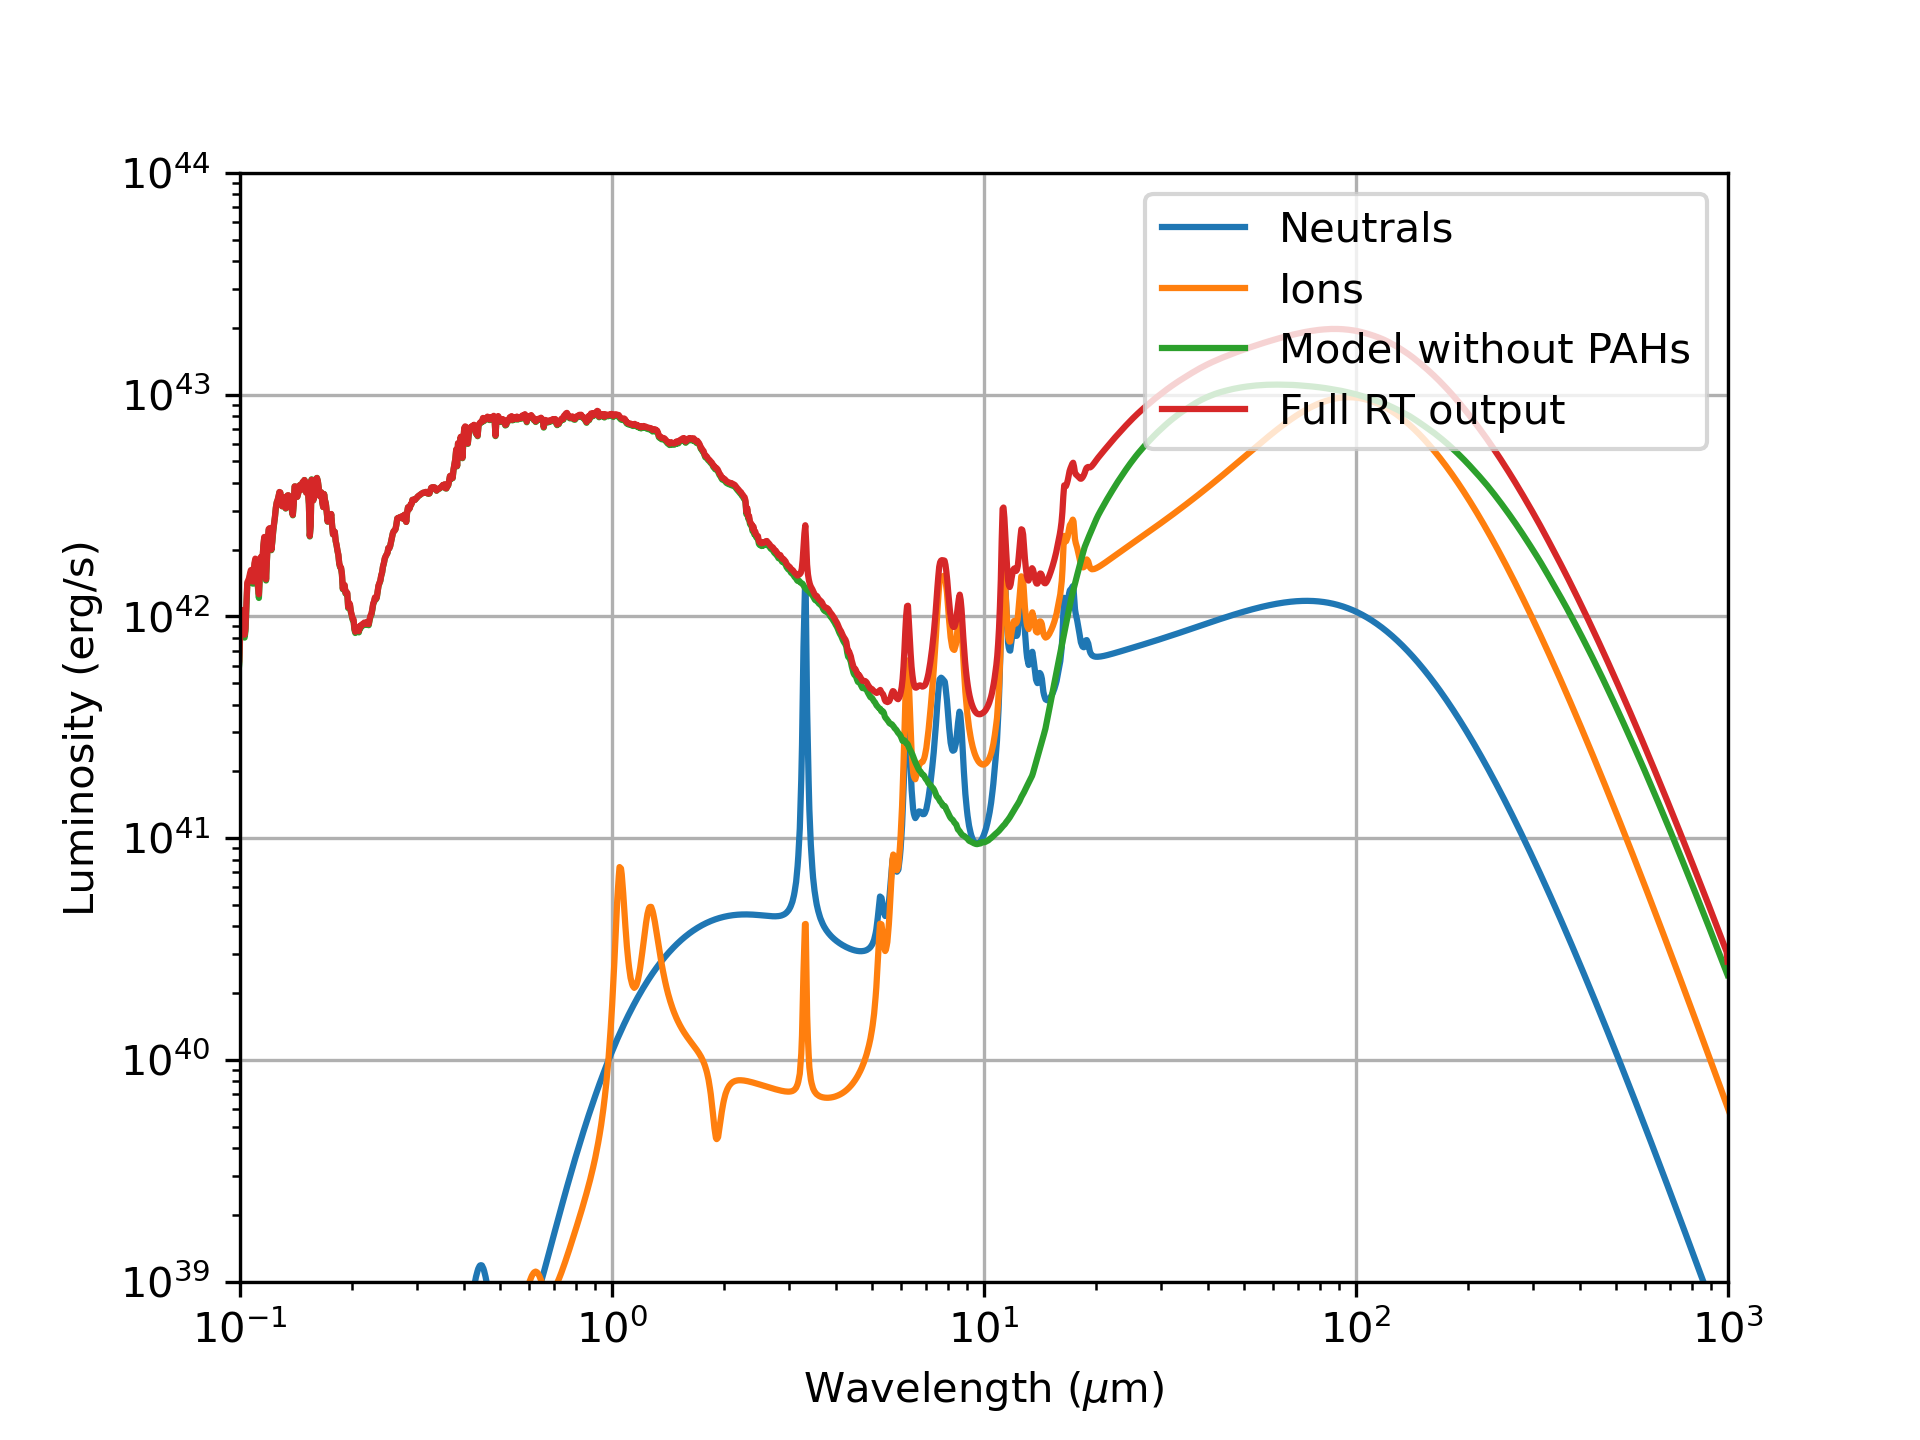
Prior to studying our main results – the origin of PAH masses and luminosities in galaxies – we first demonstrate the capabilities of this new model by presenting a model galaxy SED and integrated PAH surface brightness image in Figure 3. In the top panel of Figure 3, we show the SED at an arbitrary time stamp for model MW, decomposed into the following: the full observed SED, the SED without including our model for PAH emission, and the contribution of ionized and neutral PAHs to the mid-IR spectrum.
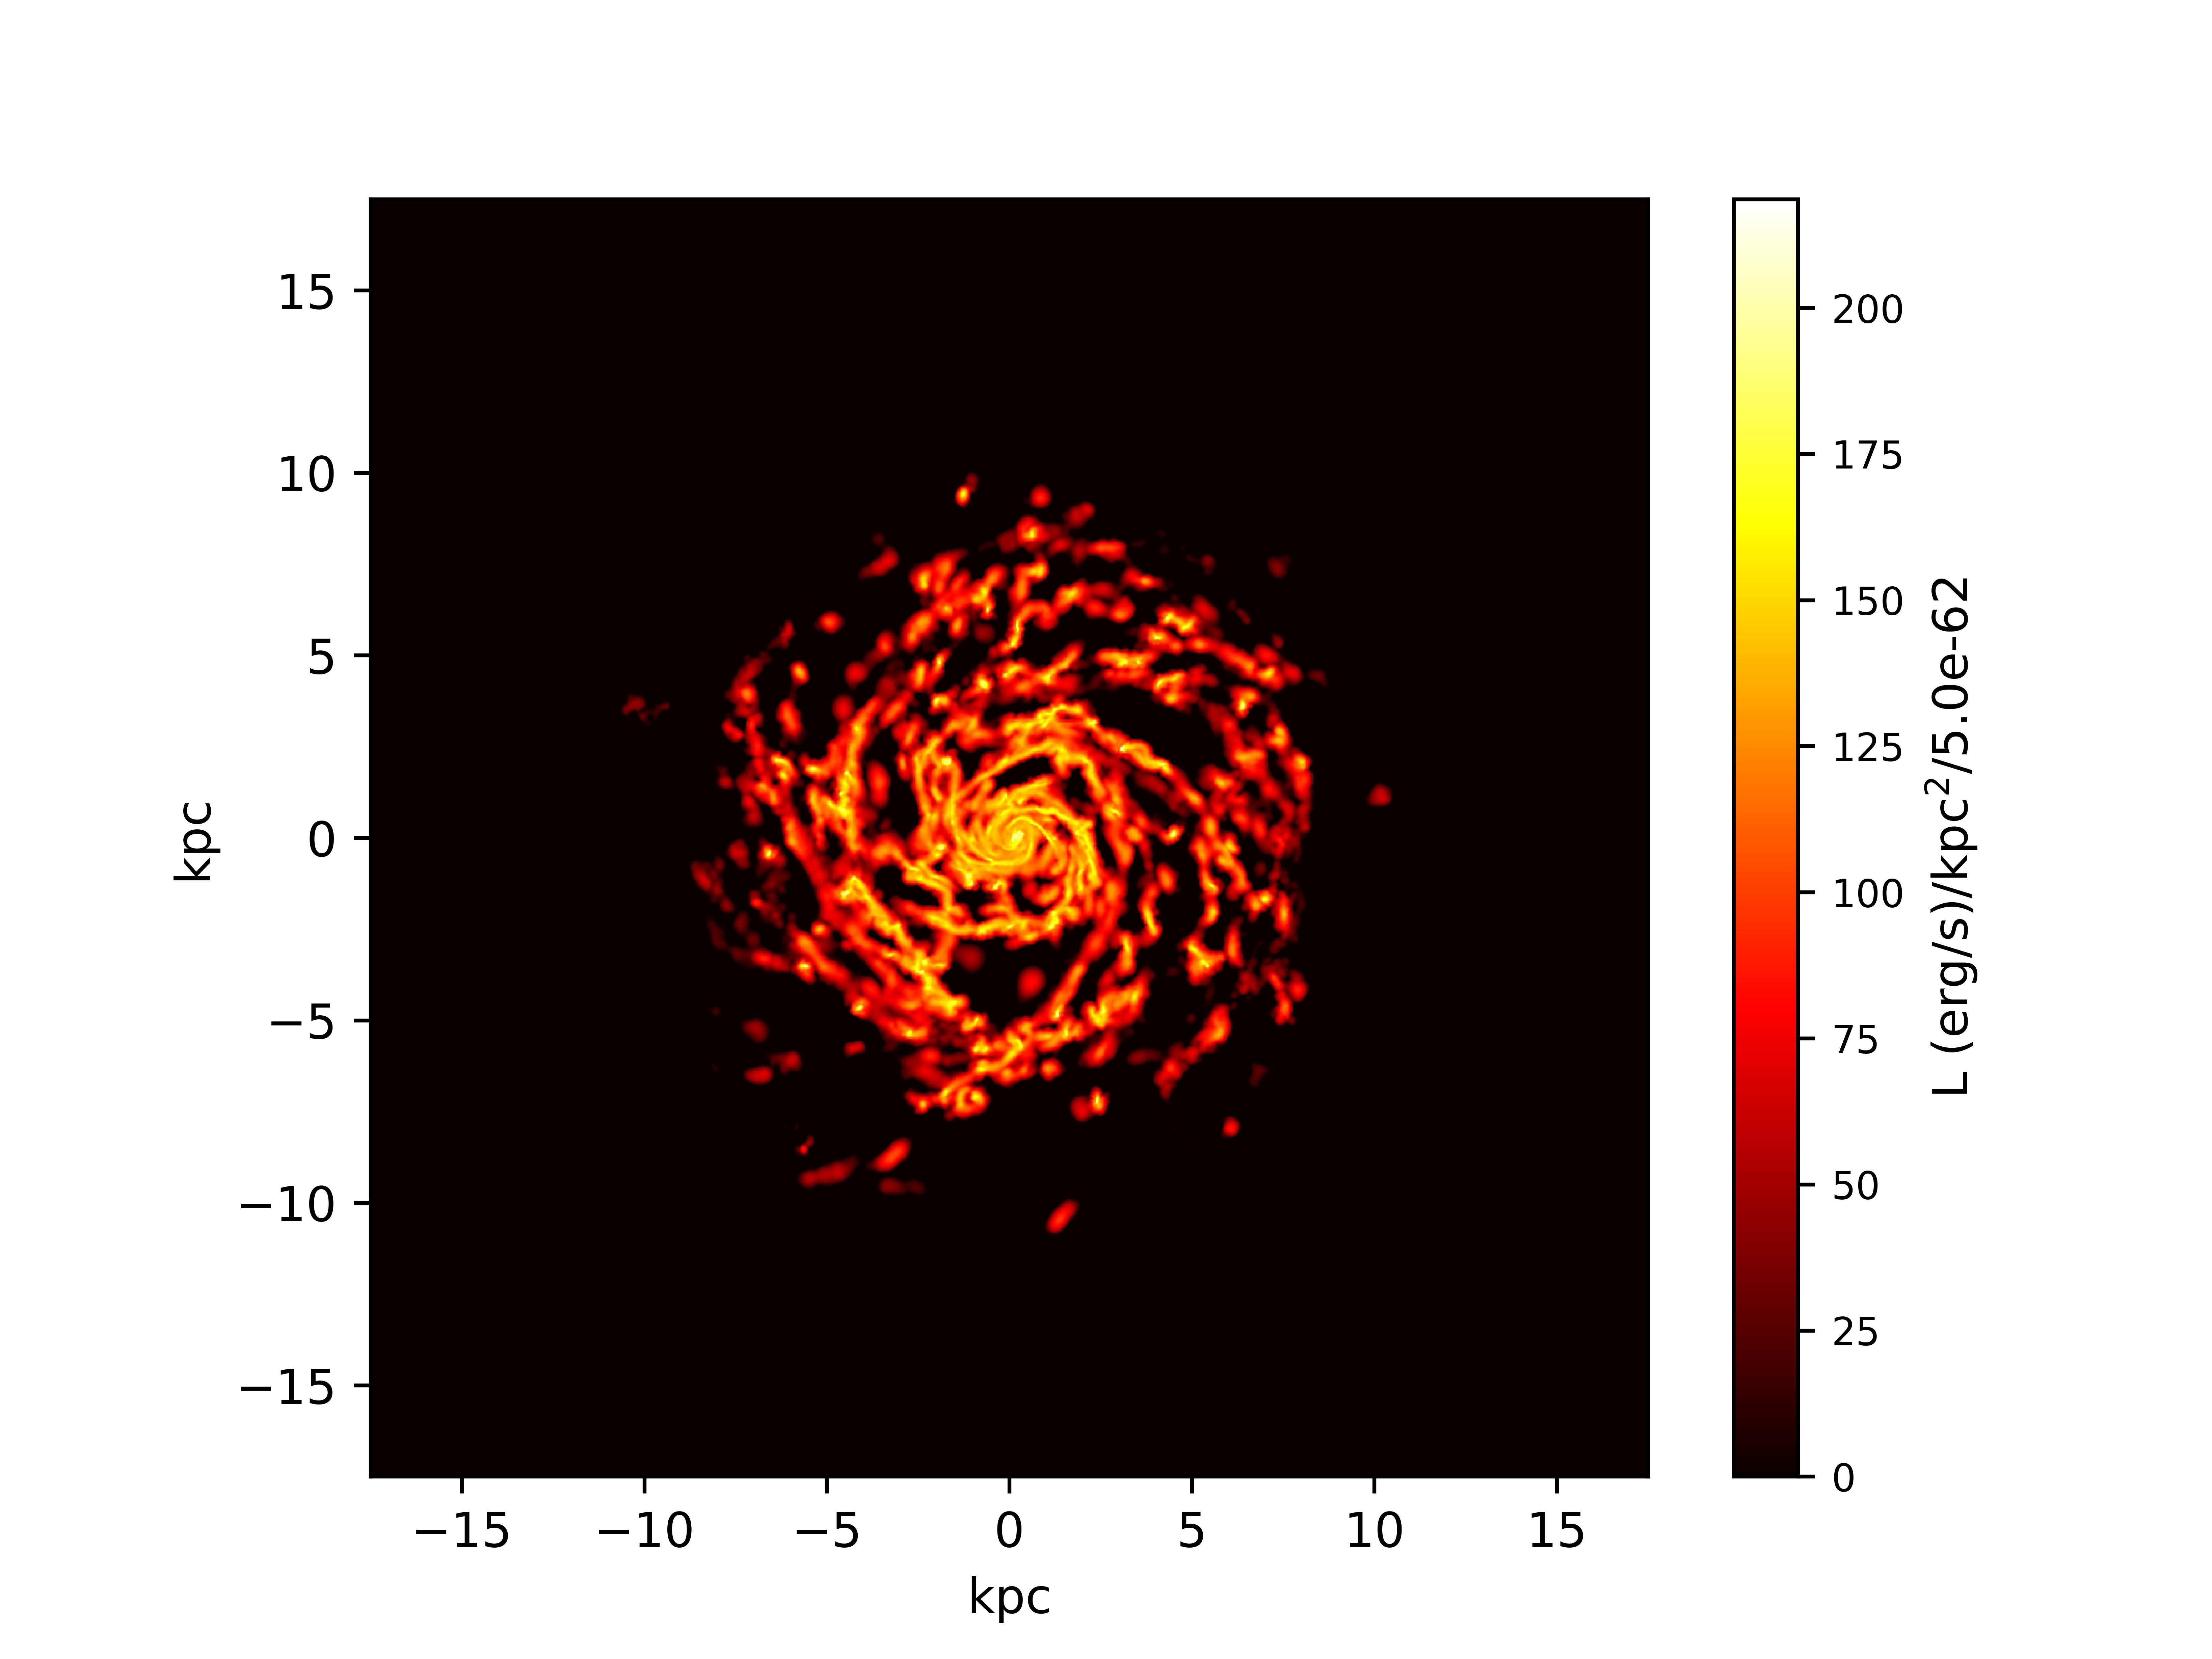
In the bottom panel of Figure 3, we show the PAH surface brightness, integrated over all bands from [] µm for the same galaxy. The variation of PAH surface brightnesses across the galaxy owes to varying radiation field strengths, hardnesses, and dust grain size distributions. While a detailed analysis of the drivers of resolved PAH brightness variations within an individual galaxy model are outside the scope of this work, we study the impact of these processes on the global from our models in § 5.2.
5 PAH Masses and Luminosities in Galaxies
5.1 PAH Masses and Fractions
We begin our analysis by studying the build up of PAH mass in our model idealized galaxy evolution simulations. We focus in particular on the fraction of dust mass that is in the form of PAHs. This is traditionally defined in the literature as:
| (20) |
and is usually defined for PAHs containing carbon atoms (Draine et al., 2007). Hensley & Draine (2022) relate the number of carbon atoms to the PAH size via:
| (21) |
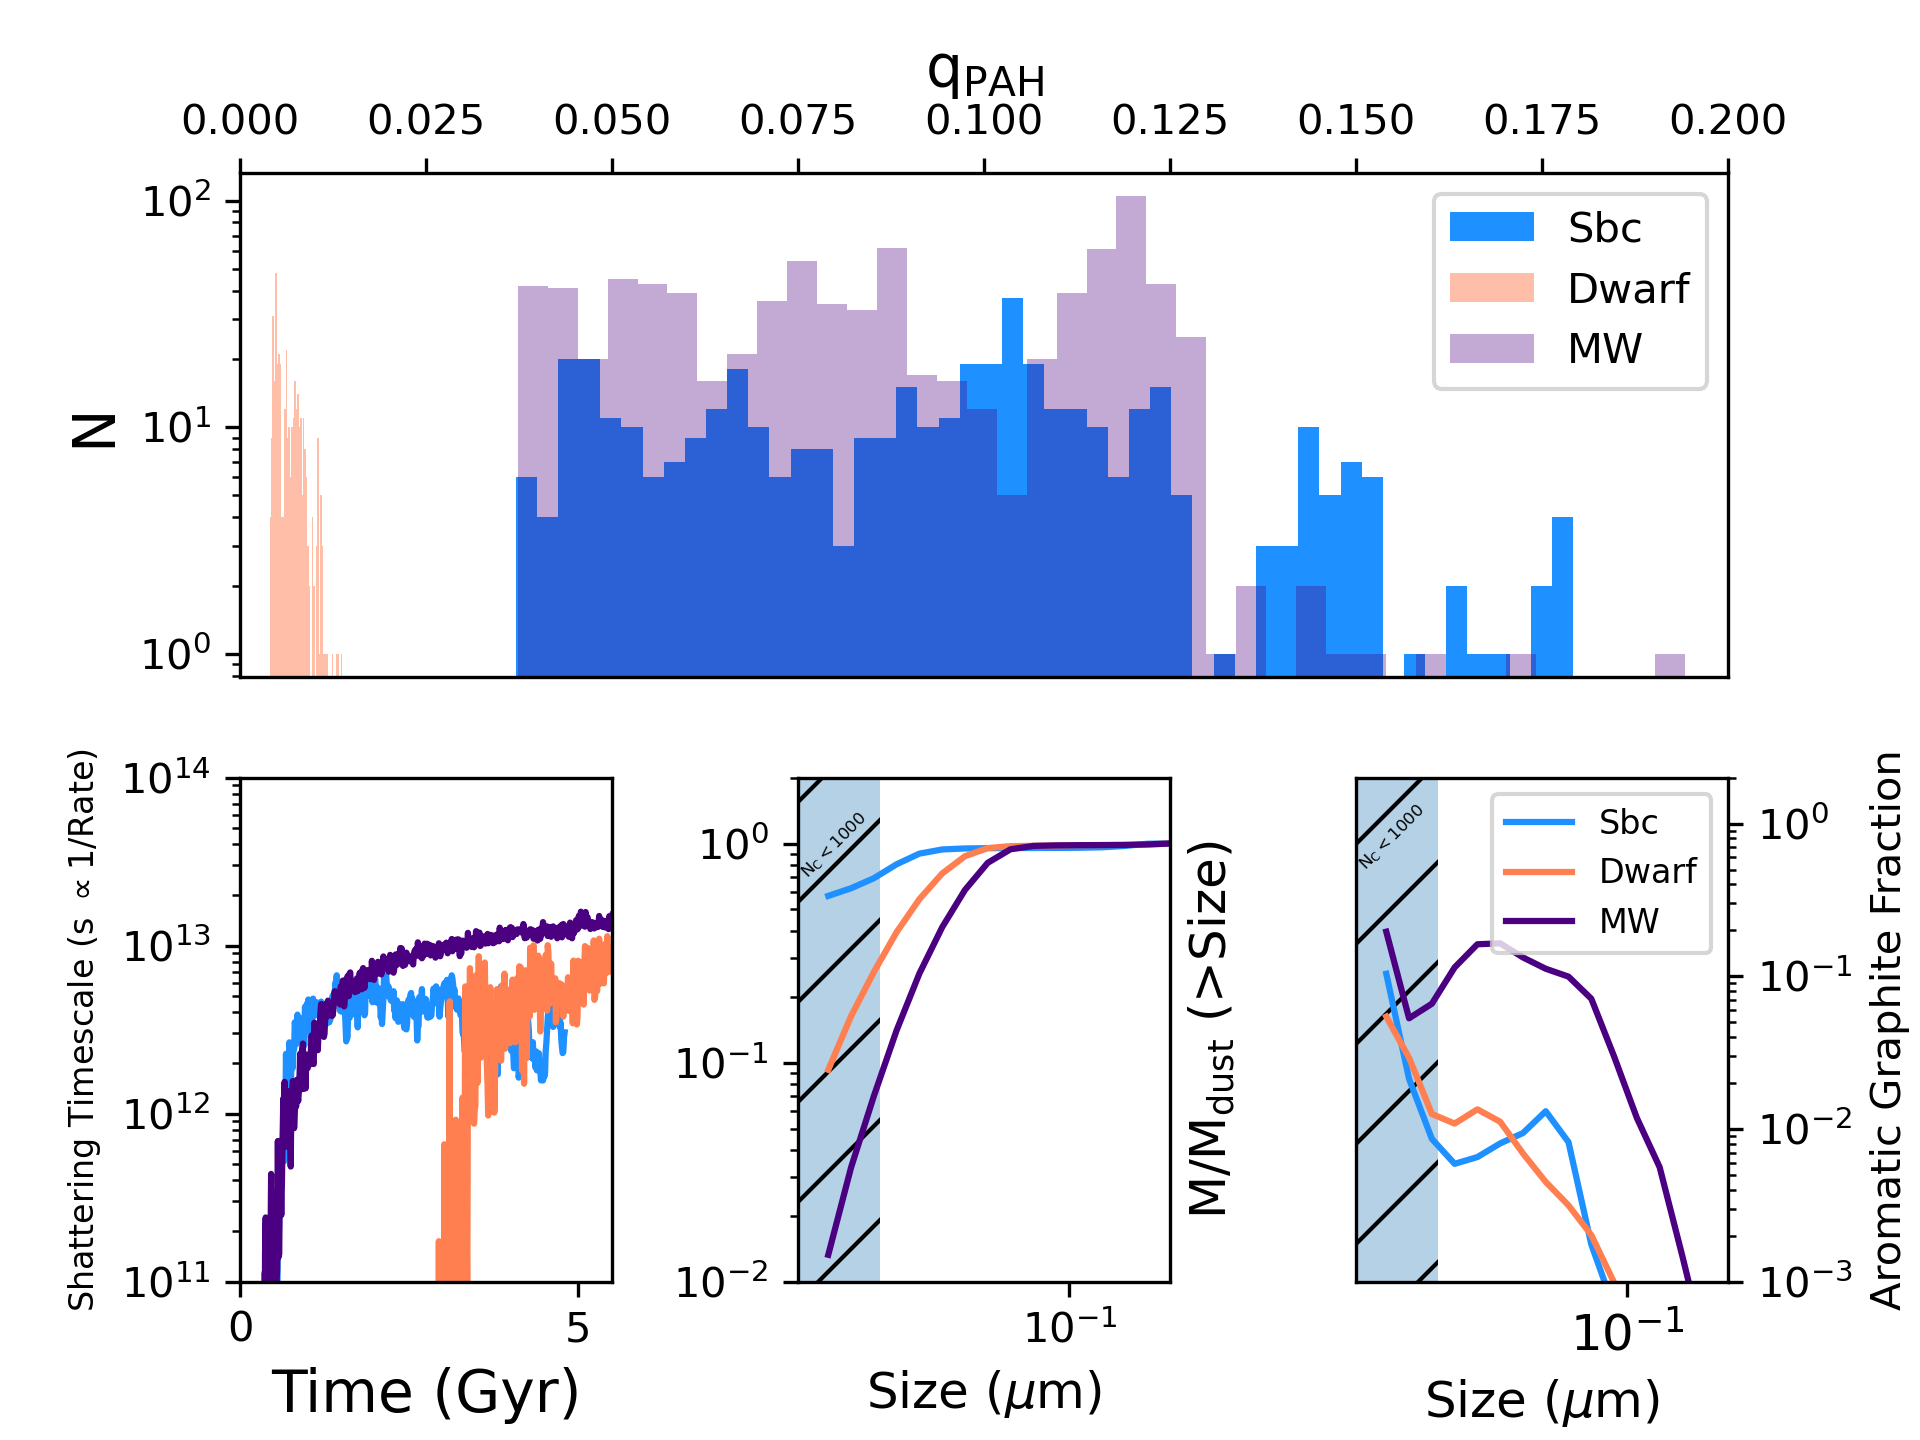
which we adopt here. In the top panel of Figure 4, we show histograms of for our three model galaxies: MW, Dwarf and Sbc. There is generally a trend in which the Dwarf has the lowest values (–), followed by the MW (–), with the Sbc starburst model displaying an extremely broad range, including relatively large values as compared to local galaxies (up to ). For reference, observed constraints of for the SMC and LMC are in the range (Chastenet et al., 2019), while local disk galaxies from the SINGs survey typically exhibit PAH mass fractions (Draine et al., 2007). In what follows, we dissect the PAH mass fractions seen in our model galaxies.
In short, the PAH fraction in our models is dictated by two physical effects: the dust grain size distribution (and in particular, having significant mass in the lowest size bins), and the aromatization of carbonaceous grains. We discuss these processes in turn, and highlight key differences between the idealized galaxy models presented here.
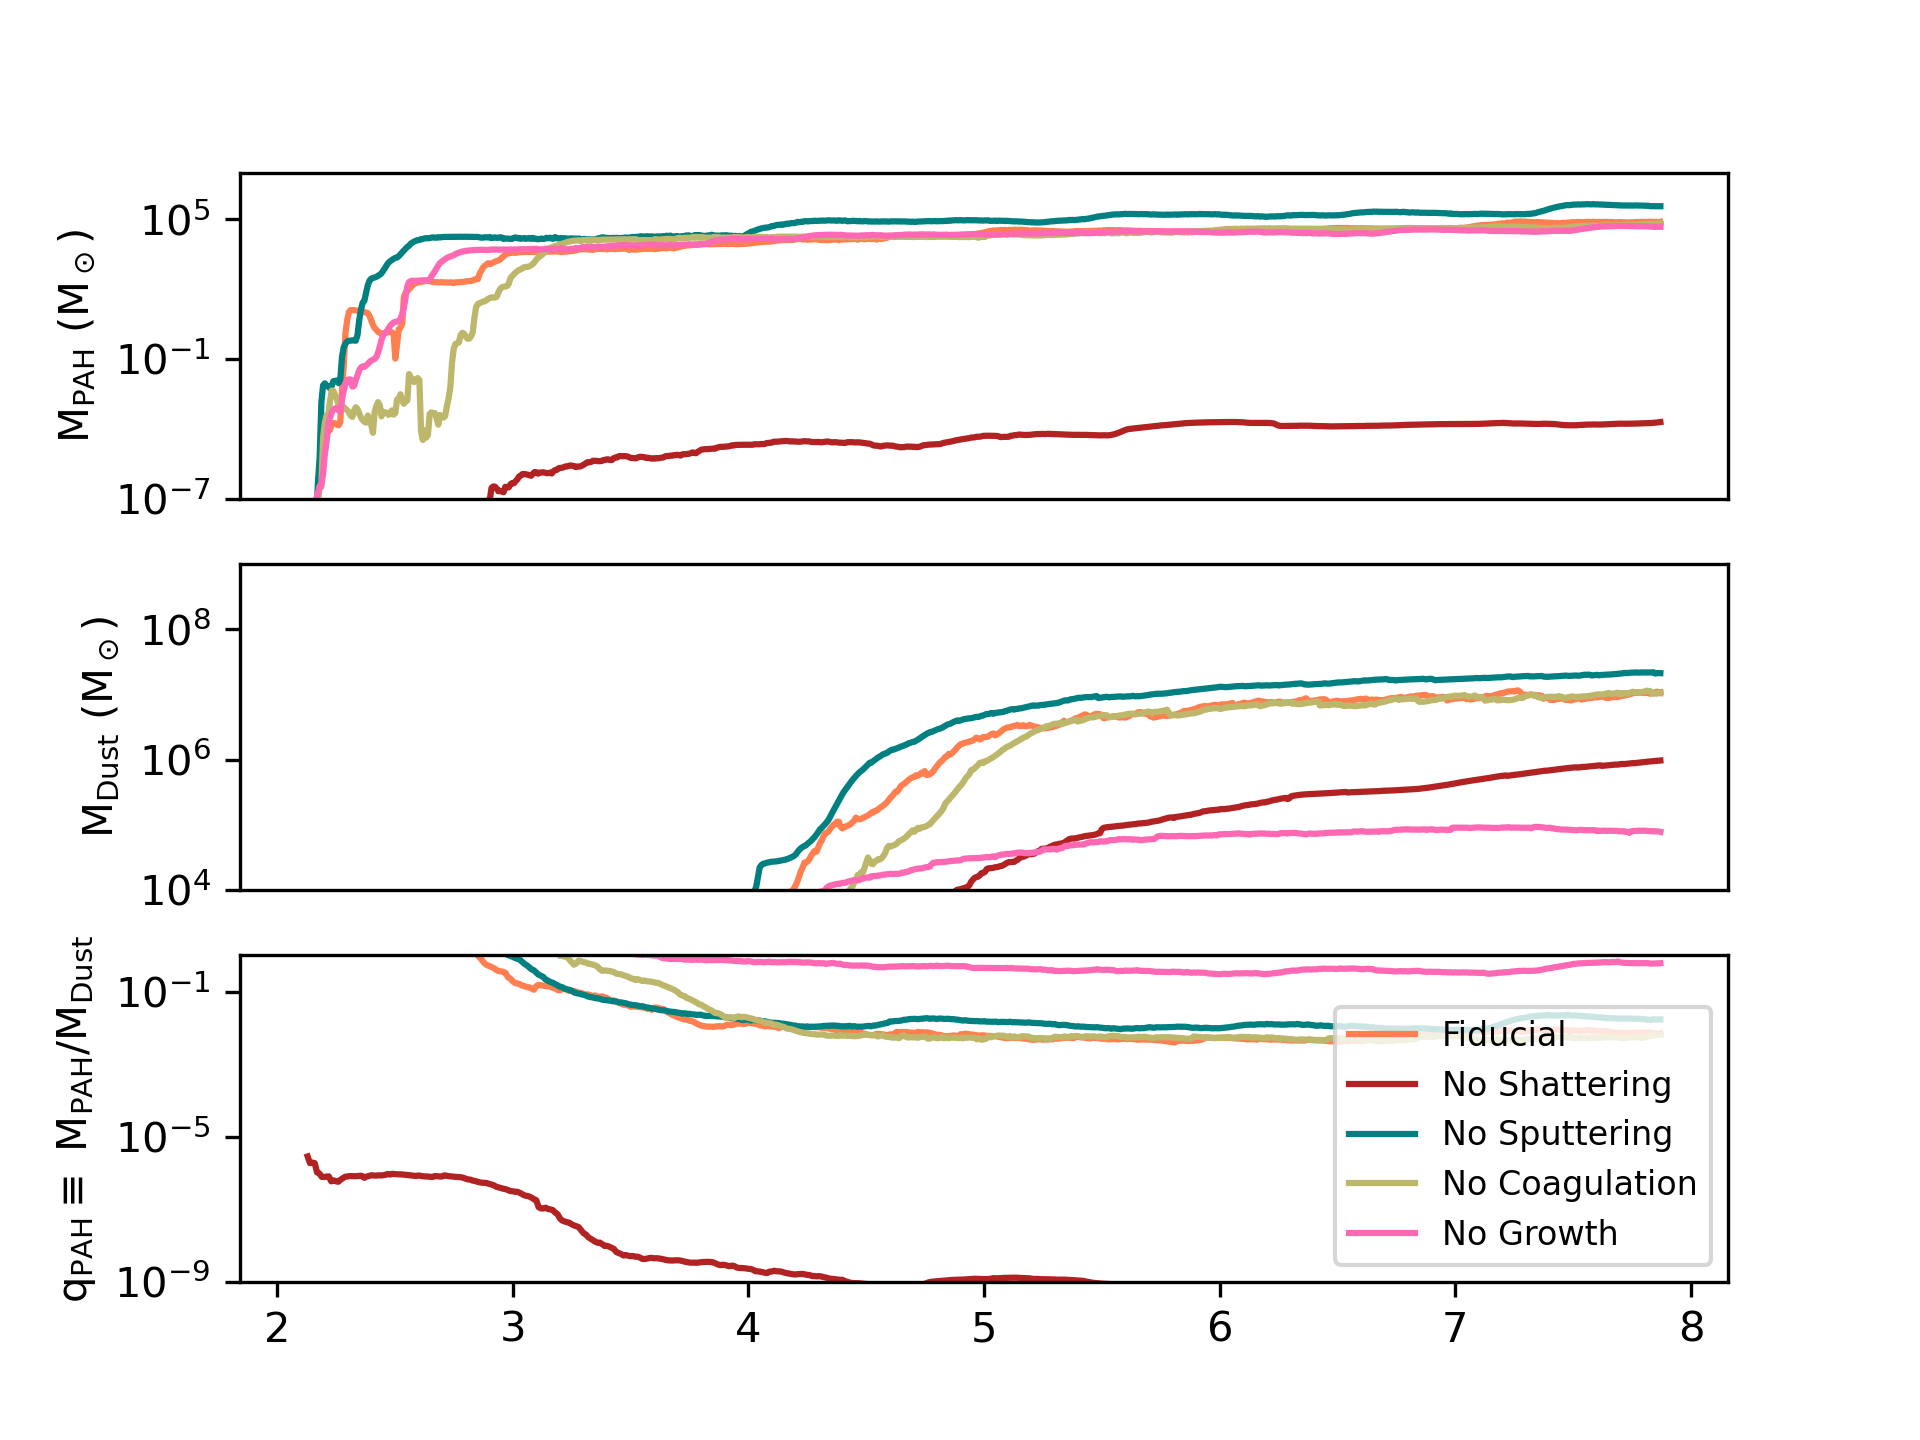
We first begin with an examination of the relevant dust processes in driving PAH masses with a controlled numerical experiment. In Figure 5, we show the time evolution of the dust masses, PAH masses, and ratio of the two () for our fiducial Dwarf model888We chose this model to explore physical variants of the dust model as the run time is the shortest., as well as model variants: runs with shattering turned off, sputtering turned off, coagulation turned off, and growth turned off. The build up of total dust masses are dominated by dust growth. Turning off either dust growth or shattering severely suppresses the total dust mass in the model galaxies (the latter process is due to the need for shattering to create small grains, and the dust growth timescales’ linear dependence on grain sizes; c.f. Equation 9). At the same time, the total PAH masses are dominated almost entirely by grain-grain shattering processes. In principle, PAHs can form in our model from either the growth (via metal accretion) of the smallest grains as they are injected into the ISM from evolved stars, or from the shattering of larger grains. In our model, shattering is by far the most efficient means for transferring dust mass from larger sizes to small grains. As a result, the model values are relatively insensitive to the underlying dust physics aside from two key processes: dust growth in order to set the total dust masses in galaxies, and grain-grain shattering in order to create ultra small grains in the ISM.
We are now in a position to understand the model distributions in the top panel of Figure 4. Recalling the galaxy physical properties presented in Figure 2, our model starburst galaxy (Sbc) has the highest star formation rate per unit galaxy mass, followed by the Dwarf model, with the MW analog exhibiting the lowest sSFR. The ISM velocity dispersions, and hence dust shattering rates, correlate with these sSFRs. In the bottom left panel of Figure 4, we show the shattering timescale (which is inversely related to the shattering rate) of the three model galaxies. The model Sbc has the shortest shattering timescales, followed by the Dwarf, with the MW having the longest timescales. This has a direct impact on the modeled grain size distributions. In the bottom-middle panel of Figure 4, we show the cumulative dust grain size distribution at a fixed time ( Gyr; normalized by the total dust mass) for each of our models, and demarcate the region that would be considered PAHs. Following the shattering rates, the Sbc model has the largest fraction of its dust grains in the smallest size bins, followed by the dwarf model, followed by the MW.
Taken at face value, this seems at odds with the findings in the top panel of Figure 4, which shows a larger average for the MW model than the Dwarf. The key lies in the aromatization of these smallest grains. In the bottom right panel of Figure 4, we show the cumulative aromatic fraction for the three model galaxies in the same size bins. Here, the total SFR is the relevant quantity: the aromatization rate is directly dependent on the incident FUV flux, which increases with the local SFR density for a given dust particle. This drives a larger fraction of the smallest grains for the MW model to convert to PAHs than the Dwarf model, resulting in higher fractional PAH ratios. It is worth noting, however, that additional destruction mechanisms that are not implemented (such as photodestruction) may temper these trends: we discuss this further in § 6.
5.2 Drivers of PAH Luminosities
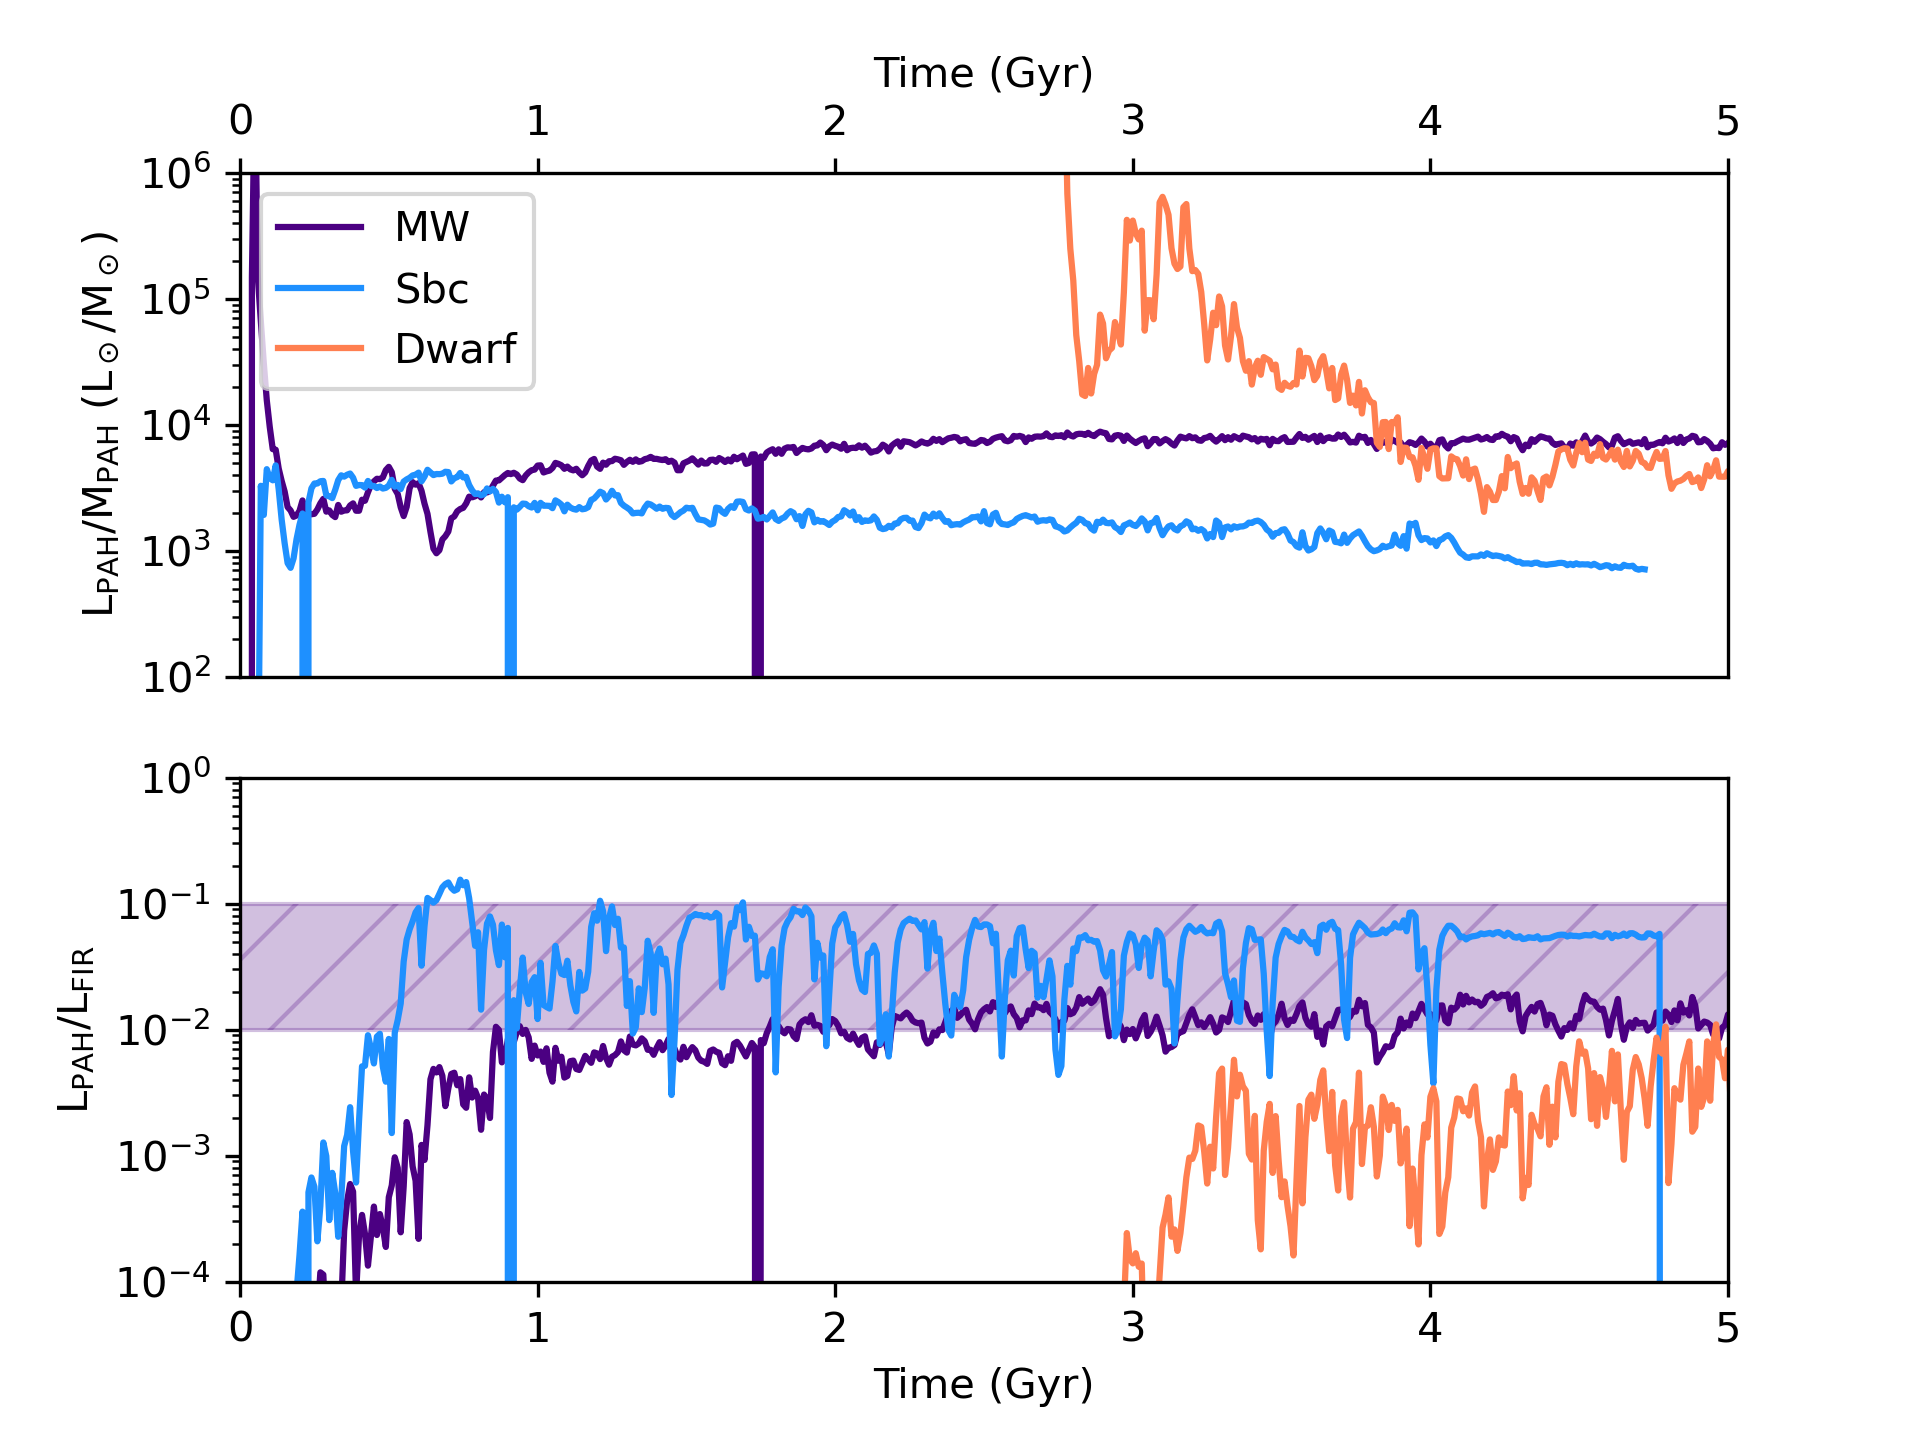
We now turn to the luminosities of PAHs in our simulated galaxies. In Figure 6, we present the time evolution of the bolometric (m) PAH luminosities for each of our model galaxies. We show these both normalized by the total dust mass (top of Figure 6), as well as by the total far infrared (FIR) luminosity in order to compare to observations (bottom of Figure 6).
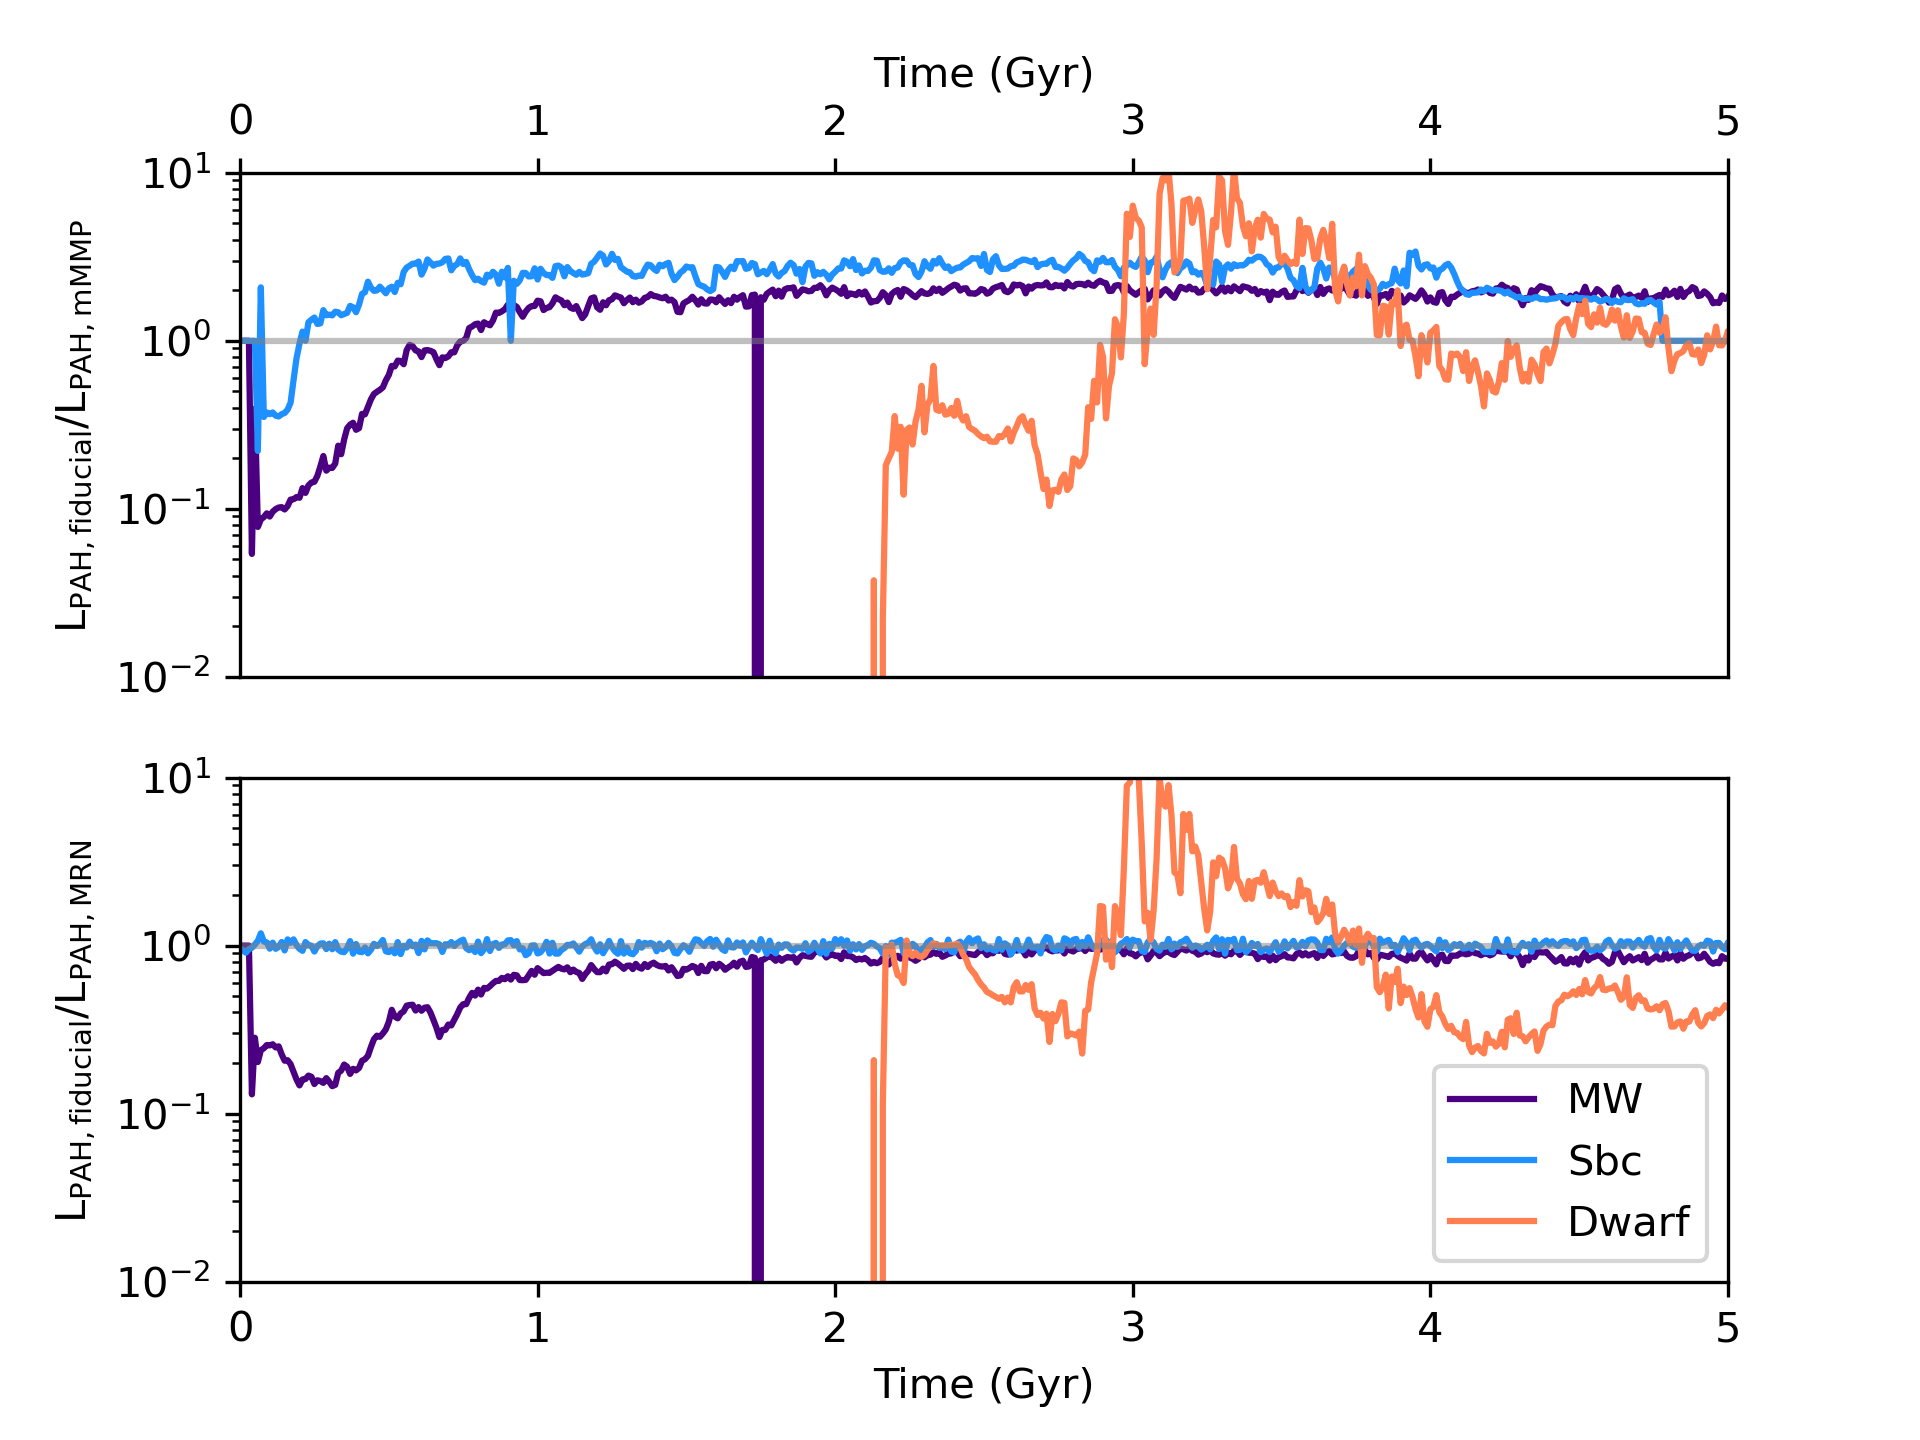
Fundamentally, the PAH spectrum from a galaxy depends on: (i) the total number of PAH dust grains, (ii) the size distribution of those PAH grains, (iii) the hardness of the radiation field, and (iv) the intensity of the radiation field. Variations in between models in Figure 6 are therefore ascribed to either the grain size distribution or properties of the ISRF. In order to disentangle these effects, we run a series of controlled numerical experiments in which we compute the PAH luminosity with powderday by (a) assuming a constant Mathis et al. (1983, mMMP) Solar neighborhood-like interstellar radiation field shape with the same total bolometric luminosity (as modified and distributed by Draine et al., 2021) though allowing the grain sizes to vary spatially as computed in the hydrodynamic galaxy evolution simulation, and by (b) assuming a constant Mathis et al. (1977, MRN) Milky Way-like grain size distribution everywhere, but allowing the ISRF to vary as computed by the stellar population synthesis and dust radiative transfer in powderday. We present the results from these experiments in Figure 7.
When comparing the PAH luminosities from our fiducial model to one in which we assume a constant mMMP solar-neighborhood like spectral shape (Figure 7), we see that the PAH luminosities are larger by factors – in the steady state in our fiducial model for all models. At the same time, when fixing the grain size distribution the models MW and Sbc luminosities are relatively unchanged from the fiducial runs, while the model Dwarf continues to vary dramatically. This may be interpreted, therefore, as the PAH luminosities of the Sbc and MW models as being driven primarily by their radiation fields, while the Dwarf model ascribes comparable importance to the grain size distribution and number of UV photons. In detail, this owes to a harder radiation field in models MW and Sbc than the fiducial mMMP radiation field.
Finally, it is worth highlighting the correspondence between the / ratios with the observed range in the local Universe (Smith et al., 2007), as demonstrated in the bottom panel of Figure 6. The fraction of total infrared luminosity that emerges in the PAH bands is a function of both the fraction of total dust mass that is in the form of PAHs (§ 5.1), as well as the total amount of stellar light that is reprocessed by dust into the infrared. The strong correspondence between our models and observations therefore is a result both of modeled fractions comparable to those observed in the local Universe, as well as reasonable star/dust geometries in our modeled disk galaxies.
5.3 Variations in Individual Feature Strengths
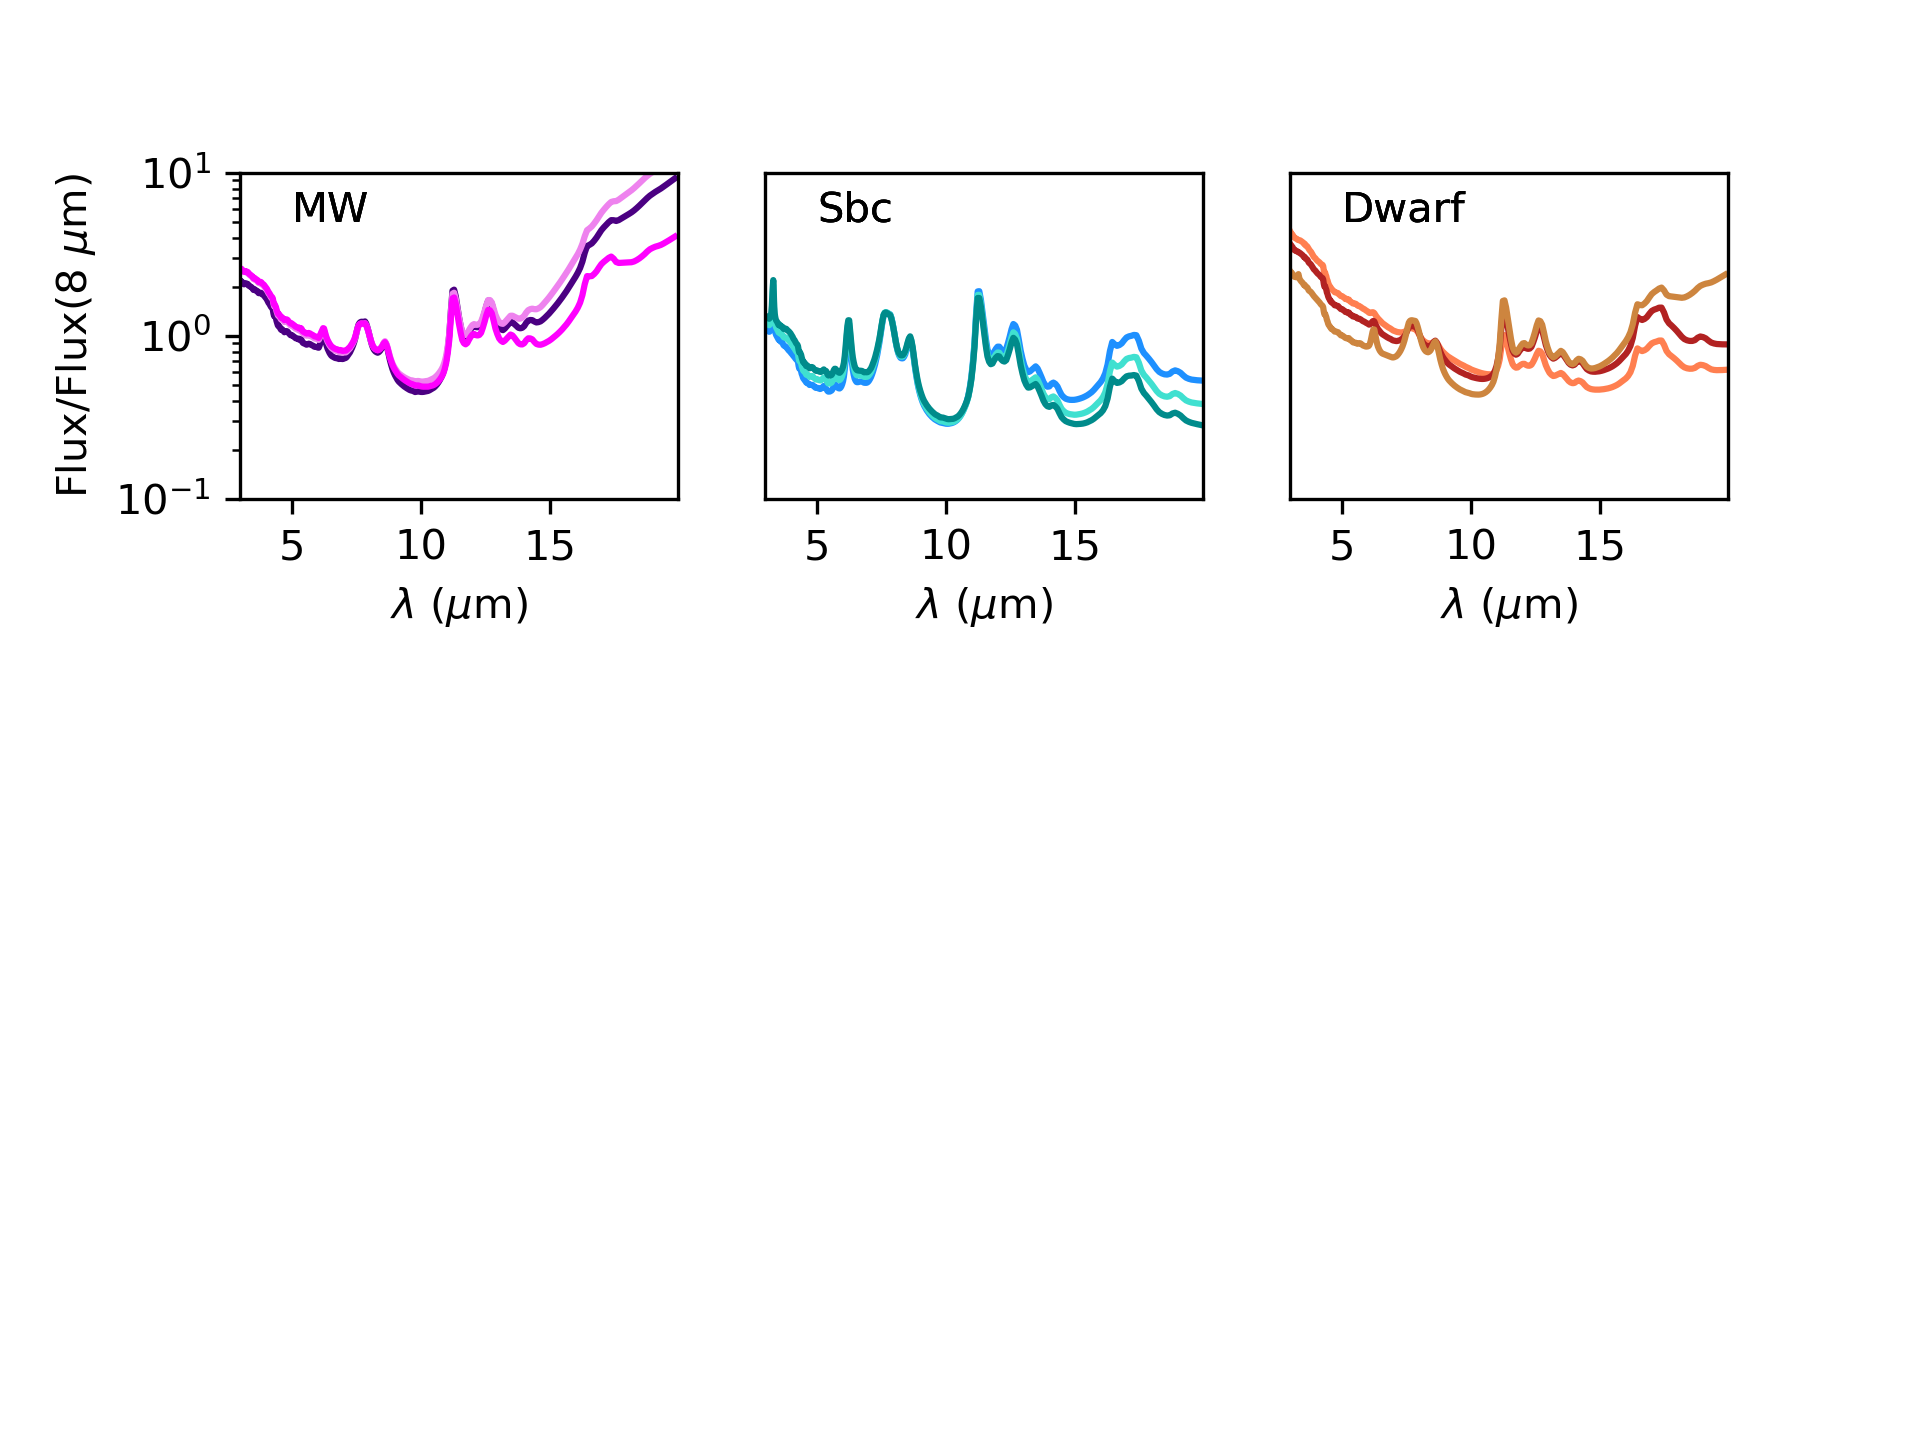
The mid-IR PAH spectrum is composed of a series of individual features between – µm. The strengths of these features vary with interstellar radiation field shape, grain size distribution, and ionization state (Draine et al., 2021). While fitting individual feature strengths is outside the scope of this work, we briefly present an empirical demonstration of the variation of individual features in our model galaxies.
In Figure 8, we show the mid-IR SED for each model galaxy (normalized at µm) for each of our galaxies at individual time stamps. In general, we see significant relative variations in individual features in our model Sbc and Dwarf galaxies, while the model MW tends to maintain a more constant mid-IR SED during its evolution. Referring to Figure 2, this can be understood from the evolution of the physical properties of the galaxies themselves. Model MW maintains a fairly constant star formation history, and consequently a fairly constant grain size distribution due to the self-regulation of star formation and ISM properties as driven by the smuggle feedback model (Marinacci et al., 2019). At the same time, the feedback strength (normalized by the galaxy mass) for the models Sbc and Dwarf are significantly stronger, and drive large variations in the star formation history (and hence ISRF), as well as grain size distribution999As a reminder, in our model the ionization fraction is tied to the dust grain size distribution, and hence the two couple together to drive variations in feature strengths. The main takeaway is that the evolution of feature strengths (and their relative ratios) clearly depends on the evolution of the ISM physical properties within galaxies, and is unlikely to be captured (in, e.g., SED fitting codes) from a set of fixed PAH spectral templates.
6 Discussion
6.1 Relationship to Other Models
In developing a model for PAH emission from hydrodynamic galaxy evolution simulations, we have combined theoretical calculations of the emission features of stochastically heated dust grains (Draine et al., 2021) with a model for the evolution of dust grains with a range of sizes in galaxy simulations (Li et al., 2021, Q. Li et al. in prep.). This is, to our knowledge, the first such model, and it is instructive to place our model into context by discussing both the range of types of galaxy models that include dust, as well as PAH emission models.
The most common types of galaxy simulations include dust as a single-species, single-size passive scalar that is physically tied to the gas in galaxies. This has been performed in hydrodynamic galaxy evolution simulations (e.g., Asano et al., 2013; McKinnon et al., 2016, 2017; Aoyama et al., 2017, 2018; Davé et al., 2019; Hou et al., 2019; Hu et al., 2019; Li et al., 2019; Vogelsberger et al., 2019; Graziani et al., 2020; Esmerian & Gnedin, 2022), as well as semi-analytic models that evolve the physical properties of galaxies in a cosmological context analytically (Popping et al., 2017; Vijayan et al., 2019; Triani et al., 2020, 2021). Choban et al. (2022) increased the sophistication of these single-size models by including species-dependent physical processes.
Modeling a full size spectrum of dust grains in galaxy evolution simulations adds significant computational cost compared to single-size models. At the same time, understanding galaxy grain size distributions, extinction laws, and ultimately PAH abundances and emission, requires an understanding of grain size distribution variations with galaxy physical properties. Hirashita (2015) developed a two-size approximation for a means of modeling grain size evolution, while keeping computational costs reasonable. This two-size model, or extensions that include a full size distribution, has been implemented by a number of groups either on-the-fly in galaxy evolution evolution simulations, or applied in post-processing (Aoyama et al., 2018; Gjergo et al., 2018; McKinnon et al., 2018; Hou et al., 2019; Aoyama et al., 2020; Huang et al., 2021; Li et al., 2021; Romano et al., 2022).
Seok et al. (2014), Hirashita & Murga (2020), Hirashita et al. (2020) and Hirashita (2022) expanded on the aforementioned works, and developed a formulation for modeling silicates, aliphatic, and aromatic carbon species in models with multiple grain size distributions. These authors assumed that the smallest aromatic grains were PAHs, and studied the - relationship in one-zone galaxy models, as well as the time evolution of PAH abundances. Rau et al. (2019) built these methods into a post-processed model of an idealized isolated disk galaxy (akin to those we study here) in order to model the evolution of PAH abundances. Rau et al. (2019) find that the PAH abundances are driven primarily by shattering and dust growth in galaxies. In contrast, Hirashita (2022) utilize one-zone models to hypothesize that PAHs do not undergo significant interstellar processing (i.e., shattering and coagulation), and find in this scenario a favorable match between their models and observed PAH abundances, the dust extinction law, and far infrared SED. Note in the Hirashita (2022) model, PAHs can be formed via normal channels (i.e., growth and grain-grain shattering) though once formed, do not undergo interstellar processing. Our model finds shattering as the dominant physical process in driving PAH abundances, with coagulation and growth of the smallest dust grains formed in stellar ejecta as negligible. In this sense, our interpretation of the origin of PAH abundances is different from that of the Hirashita (2022) one-zone model, though we are not yet in a position to compare against a diverse range of observational constraints such as the observed extinction law or bump strength.
6.2 Open Issues and Caveats
Our multiscale model for computing the PAH emission spectrum in hydrodynamic simulations involves tying together models for dust, radiative transfer, and galaxy simulations over a large dynamic range of scales, each of which has their own inherent assumptions. As a result, our model has, baked into it, a number of open issues and caveats that we discuss in turn here.
First, there is a series of open issues related to the interface between the Draine et al. (2021) model, and our galaxy evolution/radiative transfer simulations. For example, the Draine et al. (2021) model derives the emergent PAH spectrum for a given grain size distribution and ionization state in terms of the incident starlight intensity, described by the dimensionless intensity parameter in Equation 1. As demonstrated by Draine et al. 2021, the emergent PAH spectrum between µm does not vary strongly so long as . In our model, we do not find many situations where . This said, this is potentially a resolution-dependent phenomenon: it may be that by being unable to resolve regions in the immediate vicinity of massive stars, we are missing regions with very large intensity parameters. It is unlikely that galaxy-wide (idealized or cosmological) simulations will be able to achieve this level of resolution in the near future, though this is an area where individual ISM patch simulations may perform well (e.g. Walch et al., 2015; Kim et al., 2020).
Similarly, the Draine et al. (2021) model assumes a carbon-hydrogen (C:H) ratio that evolves with grain size, as is assumed in Draine & Li (2007). Because our galaxy simulations model the chemical composition of dust grains on the fly, this represents an inconsistency between the underlying Draine et al. (2021) dust model and our galaxy simulations.
Second, we turn our attention to the galaxy evolution simulations themselves (independent of the Draine et al. 2021 model). Here, there are four major open issues related to the interface between dust grains and the radiation field. (i) Our computation of the far ultraviolet interstellar radiation field strength when determining aromitization rates is performed on the fly during the galaxy evolution simulations by assuming a Mathis et al. (1983) radiation field spectral shape, and a Weingartner & Draine (2001) dust extinction law between nearby stars and the dust particle of interest. Neither of these are consistent with the true spectral shape101010We remind the reader, however, that the spectral shape for the UV heating of PAH grains is calculated explicitly via D dust radiative transfer, in post-processing. This radiative transfer takes the spatially resolved extinction law as determined by the local grain properties into account. , or dust extinction law. (ii) We do not include the radiative destruction of dust grains. (iii) The dust grains do not (currently) impact the models for radiative feedback in the smuggle simulations (Marinacci et al., 2019). (iv) Our computation of the ionization state of PAHs is parameterized by a relatively simple equation tying the ionization fraction to the grain size distribution (Equation 17). This latter issue can significantly impact our modeled feature strength ratios as for a given grain size distribution and ISRF, ionized and neutral PAHs have different mid-IR spectra (e.g. Figure 3).
All of these issues are solvable via the same technique: by connecting our model with a radiation hydrodynamics solver, we can explicitly compute the impact of the radiation field on dust properties (e.g. McKinnon et al., 2021). While this is outside the scope of the current modeling effort, future models will merge our dust model with the radiation hydrodynamics branches of the smuggle galaxy formation model (e.g. Kannan et al., 2020). We note, however, that the computation of the PAH heating rate will still require post-processing as simulating a sufficiently high spectral resolution in radiation hydrodynamics is currently computationally intractable.
Finally, a major uncertainty in our model lies in the conversion of aromatic carbonaceous grains to aliphatic ones (and vice versa). Ultimately, it is unclear if this is even a dominant part of the PAH lifecycle, and whether carbonaceous grains can convert back and forth. The aliphatization rates that we employ are a subresolution model that derive from calculations by Hirashita & Murga (2020). In developing this, Hirashita & Murga (2020) assume that aliphatization only occurs in dense gas (defined as cm-3), which we adopt without any tuning here. This said, this choice impacts our results: decreasing, or removing this threshold will increase the aliphatization rates and decrease the mass fraction of dust in the form of PAHs (). Similarly, increasing this threshold will have the opposite effect. We have not tuned our model based on this aliphatization rate, though alternative implementations of aromitzation and aliphatization would almost certainly impact our methodology and modeled results. Beyond this, our model assumes that dehydrogenization dominates the aromatization process: the lack of other avenues for aromatization in our model constitutes a major uncertainty.
7 Summary and Outlook
We have developed a new framework for modeling the mid-infrared emission from PAHs in hydrodynamic galaxy evolution simulations. We have done this by combining theoretical single-photon heating models of ultrasmall dust grains with galaxy evolution simulations that simulate the evolution of a size distribution of dust grains on-the-fly, as well as the local radiation field and heating rate. These new simulations account for the variation of PAH feature strengths due to grain size distributions, starlight intensity, and dust composition, and allow us to connect the evolution of galaxy physical properties to the emergent and varying PAH spectrum. We describe this new methodology, as well as the relevant equations in § 2.
We have implemented these methods within the smuggle galaxy
formation physics framework, and simulated idealized disk galaxies
(a Milky Way-like galaxy, a Dwarf, and a Sbc type starburst disk) with
the arepo hydrodynamics code in order to investigate the buildup
of PAH masses and luminosities in galaxies. We describe the smuggle physics in our galaxy simulations in § 2.5, as well as the
particulars of these idealized galaxies that we employ for numerical
experiments in § 3. The evolution of
the relevant physical properties for these galaxies is presented in
Figure 2. We demonstrate an example
model PAH spectrum and image in Figure 3.
Our main results follow:
-
1.
In our model, we allow PAHs to form from both growth of the smallest dust grains, as well as shattering (i.e., interstellar processing) of larger grains. In our model the latter dominates. The key physical processes in driving the formation of ultrasmall aromitized carbonaceous dust grains (i.e., PAHs) are large velocity dispersions in the ISM (in order to drive grain-grain shattering, which pushes the power in the grain size distribution toward small grain sizes), and large radiation fields (in order to convert aliphatic grains into aromatic ones). This is demonstrated in Figures 4 and 5.
-
2.
Increased shattering rates (driven by large ISM velocity dispersions) in galaxies are associated with high specific star formation rate, which translates to increased feedback energy per unit ISM mass. Aromatization driven by UV radiation is accomplished via large global star formation rates.
-
3.
The fraction of total dust mass that is in the form of PAHs () can be understood as a consequence of these processes. We demonstrate the impact of the shattering timescales and aromatic fractions on the modeled from our idealized galaxies in Figure 4. The model starburst has the largest fraction of its dust mass in the form of PAHs (), the Dwarf the least (), and the model MW in the middle ().
-
4.
We find that the dominant driver in PAH luminosities in our models is the hardness of the interstellar radiation field (which translates to the heating rate of PAH dust grains). This is demonstrated in Figures 6 and7. That said, this is likely a result that is specific to these idealized galaxy models, and full cosmological simulations will be necessary to make a general statement of the importance of radiation field hardness over other contributing factors to the PAH luminosity.
In the era of JWST/MIRI, models such as the ones presented here will complement mid-infrared observations of PAHs in galaxies near and far. While this paper has emphasized the development of a new methodology, we caution that many of the subresolution modeling elements are uncertain. Our overarching goal has been to establish a framework for modeling PAH emission in galaxy simulations, with a keen eye toward forthcoming JWST observations as a means to constrain and refine the input physics into this model. As our understanding of PAH physics evolves, individual aspects of this model can be updated.
Acknowledgements
D.N. and JDS express gratitude toward the Aspen Center for Physics which is supported by National Science Foundation grant PHY-1607611, as well as the organizers of the February 2020 meeting “Quenching and Transformation throughout Cosmic Time”, where the idea for this project was borne out of a discussion on a chair lift during a wonderful day on Ajax mountain. D.N. thanks Aaron Evans, Adam Ginsburg, Christopher Lovell, Sidney Lower, Prerak Garg, Casey Papovich, George Privon, Jia Qi, Julia Roman-Duval, Heath Shipley, and Tom Robitaille for helpful conversations. D.N. additionally thanks Bruce Draine for providing early access to the Draine et al. (2021) models. The authors thank Hiroyuki Hirashita both for helpful conversations during the development of this study, as well as for commenting on an advance draft of this paper. JDS gratefully acknowledges support for this project from the Research Corporation for Science Advancement through Cottrell SEED Award No. 27852. It is a rare agency for which “Risky, interdisciplinary, and exploratory projects are strongly encouraged.” The authors thank T.J. Cox, Phil Hopkins, Brant Robertson and Volker Springel for their early work on the initial conditions generator for idealized simulations, employed in this study. D.N., & P.T. acknowledge support from NASA ATP grant 80NSSC22K0716 and HST-AR-16145.001 from the Space Telescope Science Institution for funding this work. P.T. acknowledges support from NSF grant AST-2008490. The Cosmic Dawn Center is funded by the Danish National Research Foundation under grant No. 140. K.S. acknowledges support from NASA ADAP grant 80NSSC21K0851.
References
- Allamandola et al. (1985) Allamandola L. J., Tielens A. G. G. M., Barker J. R., 1985, ApJ, 290, L25
- Aniano et al. (2020) Aniano G., et al., 2020, ApJ, 889, 150
- Aoyama et al. (2017) Aoyama S., Hou K.-C., Shimizu I., Hirashita H., Todoroki K., Choi J.-H., Nagamine K., 2017, MNRAS, 466, 105
- Aoyama et al. (2018) Aoyama S., Hou K.-C., Hirashita H., Nagamine K., Shimizu I., 2018, MNRAS, 478, 4905
- Aoyama et al. (2020) Aoyama S., Hirashita H., Nagamine K., 2020, MNRAS, 491, 3844
- Armus et al. (2020) Armus L., Charmandaris V., Soifer B. T., 2020, Nature Astronomy, 4, 467
- Armus et al. (2022) Armus L., et al., 2022, arXiv/2209.13125, p. arXiv:2209.13125
- Asano et al. (2013) Asano R. S., Takeuchi T. T., Hirashita H., Inoue A. K., 2013, Earth, Planets, and Space, 65, 213
- Bakes & Tielens (1994) Bakes E. L. O., Tielens A. G. G. M., 1994, ApJ, 427, 822
- Bakes & Tielens (1998) Bakes E. L. O., Tielens A. G. G. M., 1998, ApJ, 499, 258
- Bauschlicher et al. (2010) Bauschlicher C. W. J., et al., 2010, ApJS, 189, 341
- Bauschlicher et al. (2018) Bauschlicher C. W., Ricca A., Boersma C., Allamandola L. J., 2018, The Astrophysical Journal Supplement Series, 234, 32
- Bendo et al. (2008) Bendo G. J., et al., 2008, MNRAS, 389, 629
- Bianchi & Schneider (2007) Bianchi S., Schneider R., 2007, MNRAS, 378, 973
- Boersma et al. (2014) Boersma C., et al., 2014, ApJS, 211, 8
- Bruzual & Charlot (2003) Bruzual G., Charlot S., 2003, MNRAS, 344, 1000
- Bullock et al. (2001) Bullock J. S., Kolatt T. S., Sigad Y., Somerville R. S., Kravtsov A. V., Klypin A. A., Primack J. R., Dekel A., 2001, MNRAS, 321, 559
- Cardelli et al. (1989) Cardelli J. A., Clayton G. C., Mathis J. S., 1989, ApJ, 345, 245
- Chabrier (2001) Chabrier G., 2001, ApJ, 554, 1274
- Chastenet et al. (2019) Chastenet J., et al., 2019, ApJ, 876, 62
- Chastenet et al. (2022) Chastenet J., et al., 2022, arXiv/2212.10512, p. arXiv:2212.10512
- Chastenet et al. (2023) Chastenet J., et al., 2023, arXiv/2301.00578, p. arXiv:2301.00578
- Choban et al. (2022) Choban C. R., Kereš D., Hopkins P. F., Sandstrom K. M., Hayward C. C., Faucher-Giguère C.-A., 2022, MNRAS, 514, 4506
- Choi et al. (2016) Choi J., Dotter A., Conroy C., Cantiello M., Paxton B., Johnson B. D., 2016, ApJ, 823, 102
- Chown et al. (2021) Chown R., Li C., Parker L., Wilson C. D., Li N., Gao Y., 2021, MNRAS, 500, 1261
- Conroy & Gunn (2010) Conroy C., Gunn J. E., 2010, ApJ, 712, 833
- Conroy & Wechsler (2009) Conroy C., Wechsler R. H., 2009, ApJ, 696, 620
- Conroy et al. (2009) Conroy C., Gunn J. E., White M., 2009, ApJ, 699, 486
- Conroy et al. (2010) Conroy C., White M., Gunn J. E., 2010, ApJ, 708, 58
- Dale et al. (2009) Dale D. A., et al., 2009, ApJ, 703, 517
- Dale et al. (2022) Dale D. A., et al., 2022, arXiv/2212.00130, p. arXiv:2212.00130
- Davé et al. (2019) Davé R., Anglés-Alcázar D., Narayanan D., Li Q., Rafieferantsoa M. H., Appleby S., 2019, arXiv1901.10203,
- Desai et al. (2007) Desai V., et al., 2007, ApJ, 669, 810
- Diamond-Stanic & Rieke (2010) Diamond-Stanic A. M., Rieke G. H., 2010, ApJ, 724, 140
- Draine & Lee (1984) Draine B. T., Lee H. M., 1984, ApJ, 285, 89
- Draine & Li (2001) Draine B. T., Li A., 2001, ApJ, 551, 807
- Draine & Li (2007) Draine B. T., Li A., 2007, ApJ, 657, 810
- Draine et al. (2007) Draine B. T., et al., 2007, ApJ, 663, 866
- Draine et al. (2021) Draine B. T., Li A., Hensley B. S., Hunt L. K., Sandstrom K., Smith J. D. T., 2021, ApJ, 917, 3
- Dwek (1998) Dwek E., 1998, ApJ, 501, 643
- Egorov et al. (2022) Egorov O. V., et al., 2022, arXiv/2212.09159, p. arXiv:2212.09159
- Eldridge et al. (2017) Eldridge J. J., Stanway E. R., Xiao L., McClelland L. A. S., Taylor G., Ng M., Greis S. M. L., Bray J. C., 2017, PASA, 34, e058
- Engelbracht et al. (2008) Engelbracht C. W., Rieke G. H., Gordon K. D., Smith J. D. T., Werner M. W., Moustakas J., Willmer C. N. A., Vanzi L., 2008, ApJ, 678, 804
- Esmerian & Gnedin (2022) Esmerian C. J., Gnedin N. Y., 2022, arXiv/2208.02277, p. arXiv:2208.02277
- Evans et al. (2022) Evans A. S., et al., 2022, arXiv/2208.14507, p. arXiv:2208.14507
- Farrah et al. (2007) Farrah D., et al., 2007, ApJ, 667, 149
- Ferland et al. (2013) Ferland G. J., et al., 2013, RMXAA, 49, 137
- Ferrarotti & Gail (2006) Ferrarotti A. S., Gail H. P., 2006, A&A, 447, 553
- Foley et al. (2018) Foley N., Cazaux S., Egorov D., Boschman L. M. P. V., Hoekstra R., Schlathölter T., 2018, MNRAS, 479, 649
- Genzel et al. (1998) Genzel R., et al., 1998, ApJ, 498, 579
- Gillett et al. (1973) Gillett F. C., Forrest W. J., Merrill K. M., 1973, ApJ, 183, 87
- Gjergo et al. (2018) Gjergo E., Granato G. L., Murante G., Ragone-Figueroa C., Tornatore L., Borgani S., 2018, MNRAS, 479, 2588
- Gordon et al. (2008) Gordon K. D., Engelbracht C. W., Rieke G. H., Misselt K. A., Smith J. D. T., Kennicutt Robert C. J., 2008, ApJ, 682, 336
- Graziani et al. (2020) Graziani L., Schneider R., Ginolfi M., Hunt L. K., Maio U., Glatzle M., Ciardi B., 2020, MNRAS, 494, 1071
- Groves et al. (2012) Groves B., et al., 2012, MNRAS, 426, 892
- Guo & White (2008) Guo Q., White S. D. M., 2008, MNRAS, 384, 2
- Gurvich et al. (2022) Gurvich A. B., et al., 2022, arXiv/2203.04321, p. arXiv:2203.04321
- Hao et al. (2009) Hao L., Wu Y., Charmandaris V., Spoon H. W. W., Bernard-Salas J., Devost D., Lebouteiller V., Houck J. R., 2009, ApJ, 704, 1159
- Helou et al. (2000) Helou G., Lu N. Y., Werner M. W., Malhotra S., Silbermann N., 2000, ApJ, 532, L21
- Hensley & Draine (2020) Hensley B. S., Draine B. T., 2020, ApJ, 895, 38
- Hensley & Draine (2022) Hensley B. S., Draine B. T., 2022, arXiv/2208.12365, p. arXiv:2208.12365
- Hernquist (1990) Hernquist L., 1990, ApJ, 356, 359
- Hirashita (2015) Hirashita H., 2015, MNRAS, 447, 2937
- Hirashita (2022) Hirashita H., 2022, MNRAS,
- Hirashita & Kuo (2011) Hirashita H., Kuo T.-M., 2011, MNRAS, 416, 1340
- Hirashita & Murga (2020) Hirashita H., Murga M. S., 2020, MNRAS, 492, 3779
- Hirashita & Yan (2009) Hirashita H., Yan H., 2009, MNRAS, 394, 1061
- Hirashita et al. (2020) Hirashita H., Deng W., Murga M. S., 2020, MNRAS, 499, 3046
- Hopkins et al. (2011) Hopkins P. F., Quataert E., Murray N., 2011, MNRAS, 417, 950
- Hopkins et al. (2013) Hopkins P. F., Narayanan D., Murray N., 2013, MNRAS, 432, 2647
- Hopkins et al. (2018) Hopkins P. F., et al., 2018, MNRAS, 480, 800
- Hou et al. (2019) Hou K.-C., Aoyama S., Hirashita H., Nagamine K., Shimizu I., 2019, MNRAS, 485, 1727
- Howell et al. (2007) Howell J. H., et al., 2007, AJ, 134, 2086
- Hu et al. (2019) Hu C.-Y., Zhukovska S., Somerville R. S., Naab T., 2019, MNRAS, 487, 3252
- Huang et al. (2021) Huang Y.-H., Hirashita H., Hsu Y.-H., Lin Y.-T., Nelson D., Cooper A. P., 2021, MNRAS, 501, 1336
- Hunt et al. (2010) Hunt L. K., Thuan T. X., Izotov Y. I., Sauvage M., 2010, ApJ, 712, 164
- Hunt et al. (2011) Hunt L. K., Izotov Y. I., Sauvage M., Thuan T. X., 2011, in Joblin C., Tielens A. G. G. M., eds, EAS Publications Series Vol. 46, EAS Publications Series. pp 143–148, doi:10.1051/eas/1146015
- Jensen et al. (2017) Jensen J. J., et al., 2017, MNRAS, 470, 3071
- Jones et al. (1996) Jones A. P., Tielens A. G. G. M., Hollenbach D. J., 1996, ApJ, 469, 740
- Jones et al. (2013) Jones A. P., Fanciullo L., Köhler M., Verstraete L., Guillet V., Bocchio M., Ysard N., 2013, A&A, 558, A62
- Kannan et al. (2020) Kannan R., Marinacci F., Vogelsberger M., Sales L. V., Torrey P., Springel V., Hernquist L., 2020, MNRAS, 499, 5732
- Katz et al. (1996) Katz N., Weinberg D. H., Hernquist L., 1996, ApJS, 105, 19
- Kennicutt (1998) Kennicutt Jr. R. C., 1998, ARA&A, 36, 189
- Kennicutt et al. (2003) Kennicutt Jr. R. C., et al., 2003, PASP, 115, 928
- Kerkeni et al. (2022) Kerkeni B., García-Bernete I., Rigopoulou D., Tew D. P., Roche P. F., Clary D. C., 2022, MNRAS, 513, 3663
- Kessler et al. (1996) Kessler M. F., et al., 1996, A&A, 315, L27
- Kim et al. (2020) Kim W.-T., Kim C.-G., Ostriker E. C., 2020, ApJ, 898, 35
- Kroupa (2002) Kroupa P., 2002, Science, 295, 82
- Krumholz et al. (2008) Krumholz M. R., McKee C. F., Tumlinson J., 2008, ApJ, 689, 865
- Krumholz et al. (2009a) Krumholz M. R., McKee C. F., Tumlinson J., 2009a, ApJ, 693, 216
- Krumholz et al. (2009b) Krumholz M. R., McKee C. F., Tumlinson J., 2009b, ApJ, 699, 850
- Lai et al. (2020) Lai T. S. Y., Smith J. D. T., Baba S., Spoon H. W. W., Imanishi M., 2020, ApJ, 905, 55
- Lai et al. (2022) Lai T. S. Y., et al., 2022, arXiv/2209.06741, p. arXiv:2209.06741
- Langeroodi & Hjorth (2022) Langeroodi D., Hjorth J., 2022, arXiv/2210.06482, p. arXiv:2210.06482
- Laor & Draine (1993) Laor A., Draine B. T., 1993, ApJ, 402, 441
- Leger & Puget (1984) Leger A., Puget J. L., 1984, A&A, 137, L5
- Lepp & Dalgarno (1988) Lepp S., Dalgarno A., 1988, ApJ, 324, 553
- Li (2020) Li A., 2020, Nature Astronomy, 4, 339
- Li et al. (2019) Li Q., Narayanan D., Davé R., 2019, arXiv e-prints, p. arXiv:1906.09277
- Li et al. (2020) Li Y., Gu M. F., Yajima H., Zhu Q., Maji M., 2020, MNRAS,
- Li et al. (2021) Li Q., Narayanan D., Torrey P., Davé R., Vogelsberger M., 2021, MNRAS, 507, 548
- Lovell et al. (2022) Lovell C. C., Geach J. E., Davé R., Narayanan D., Coppin K. E. K., Li Q., Franco M., Privon G. C., 2022, MNRAS, 515, 3644
- Madden et al. (2006) Madden S. C., Galliano F., Jones A. P., Sauvage M., 2006, A&A, 446, 877
- Maragkoudakis et al. (2018) Maragkoudakis A., Ivkovich N., Peeters E., Stock D. J., Hemachandra D., Tielens A. G. G. M., 2018, MNRAS, 481, 5370
- Maragkoudakis et al. (2022) Maragkoudakis A., Boersma C., Temi P., Bregman J. D., Allamandola L. J., 2022, ApJ, 931, 38
- Marinacci et al. (2019) Marinacci F., Sales L. V., Vogelsberger M., Torrey P., Springel V., 2019, MNRAS, 489, 4233
- Mathis et al. (1977) Mathis J. S., Rumpl W., Nordsieck K. H., 1977, ApJ, 217, 425
- Mathis et al. (1983) Mathis J. S., Mezger P. G., Panagia N., 1983, A&A, 500, 259
- Mattioda et al. (2020) Mattioda A. L., et al., 2020, The Astrophysical Journal Supplement Series, 251, 22
- McGuire et al. (2021) McGuire B. A., et al., 2021, Science, 371, 1265
- McKinnon et al. (2016) McKinnon R., Torrey P., Vogelsberger M., 2016, MNRAS, 457, 3775
- McKinnon et al. (2017) McKinnon R., Torrey P., Vogelsberger M., Hayward C. C., Marinacci F., 2017, MNRAS, 468, 1505
- McKinnon et al. (2018) McKinnon R., Vogelsberger M., Torrey P., Marinacci F., Kannan R., 2018, MNRAS, 478, 2851
- McKinnon et al. (2021) McKinnon R., Kannan R., Vogelsberger M., O’Neil S., Torrey P., Li H., 2021, MNRAS, 502, 1344
- Merrill et al. (1975) Merrill K. M., Soifer B. T., Russell R. W., 1975, ApJ, 200, L37
- Murga et al. (2019) Murga M. S., Varakin V. N., Stolyarov A. V., Wiebe D. S., 2019, Astronomy Reports, 63, 633
- Narayanan et al. (2021) Narayanan D., et al., 2021, ApJS, 252, 12
- Nozawa et al. (2006) Nozawa T., Kozasa T., Habe A., 2006, ApJ, 648, 435
- Nozawa et al. (2007) Nozawa T., Kozasa T., Habe A., Dwek E., Umeda H., Tominaga N., Maeda K., Nomoto K., 2007, ApJ, 666, 955
- Nozawa et al. (2010) Nozawa T., Kozasa T., Tominaga N., Maeda K., Umeda H., Nomoto K., Krause O., 2010, ApJ, 713, 356
- O’Dowd et al. (2009) O’Dowd M. J., et al., 2009, ApJ, 705, 885
- Peeters et al. (2004a) Peeters E., Spoon H. W. W., Tielens A. G. G. M., 2004a, ApJ, 613, 986
- Peeters et al. (2004b) Peeters E., Mattioda A. L., Hudgins D. M., Allamandola L. J., 2004b, ApJ, 617, L65
- Pope et al. (2008) Pope A., et al., 2008, ApJ, 675, 1171
- Popping et al. (2017) Popping G., Somerville R. S., Galametz M., 2017, MNRAS, 471, 3152
- Rahmati et al. (2013) Rahmati A., Pawlik A. H., Raičević M., Schaye J., 2013, MNRAS, 430, 2427
- Rau et al. (2019) Rau S.-J., Hirashita H., Murga M., 2019, MNRAS, 489, 5218
- Reddy et al. (2006) Reddy N. A., Steidel C. C., Fadda D., Yan L., Pettini M., Shapley A. E., Erb D. K., Adelberger K. L., 2006, ApJ, 644, 792
- Rigopoulou et al. (1999) Rigopoulou D., Spoon H. W. W., Genzel R., Lutz D., Moorwood A. F. M., Tran Q. D., 1999, AJ, 118, 2625
- Rigopoulou et al. (2021) Rigopoulou D., et al., 2021, MNRAS, 504, 5287
- Robertson et al. (2006) Robertson B., et al., 2006, ApJ, 641, 21
- Robitaille (2011) Robitaille T. P., 2011, A&A, 536, A79
- Romano et al. (2022) Romano L. E. C., Nagamine K., Hirashita H., 2022, MNRAS, 514, 1441
- Rujopakarn et al. (2013) Rujopakarn W., Rieke G. H., Weiner B. J., Pérez-González P., Rex M., Walth G. L., Kartaltepe J. S., 2013, ApJ, 767, 73
- Sajina et al. (2022) Sajina A., Lacy M., Pope A., 2022, Universe, 8, 356
- Sales et al. (2010) Sales D. A., Pastoriza M. G., Riffel R., 2010, ApJ, 725, 605
- Sandstrom et al. (2010) Sandstrom K. M., Bolatto A. D., Draine B. T., Bot C., Stanimirović S., 2010, ApJ, 715, 701
- Sandstrom et al. (2023) Sandstrom K., et al., 2023, arXiv/2301.00854, p. arXiv:2301.00854
- Schneider et al. (2014) Schneider R., Valiante R., Ventura P., dell’Agli F., Di Criscienzo M., Hirashita H., Kemper F., 2014, MNRAS, 442, 1440
- Seok et al. (2014) Seok J. Y., Hirashita H., Asano R. S., 2014, MNRAS, 439, 2186
- Shipley et al. (2013) Shipley H. V., Papovich C., Rieke G. H., Dey A., Jannuzi B. T., Moustakas J., Weiner B., 2013, ApJ, 769, 75
- Shipley et al. (2016) Shipley H. V., Papovich C., Rieke G. H., Brown M. J. I., Moustakas J., 2016, ApJ, 818, 60
- Shivaei et al. (2017) Shivaei I., et al., 2017, ApJ, 837, 157
- Shivaei et al. (2022) Shivaei I., et al., 2022, MNRAS, 514, 1886
- Siana et al. (2009) Siana B., et al., 2009, ApJ, 698, 1273
- Smith et al. (2007) Smith J. D. T., et al., 2007, ApJ, 656, 770
- Springel (2010) Springel V., 2010, MNRAS, 401, 791
- Springel & Hernquist (2003) Springel V., Hernquist L., 2003, MNRAS, 339, 289
- Springel et al. (2005) Springel V., Di Matteo T., Hernquist L., 2005, MNRAS, 361, 776
- Stanway & Eldridge (2018) Stanway E. R., Eldridge J. J., 2018, MNRAS, 479, 75
- Tamor & Wu (1990) Tamor M. A., Wu C. H., 1990, Journal of Applied Physics, 67, 1007
- Thrower et al. (2012) Thrower J. D., et al., 2012, ApJ, 752, 3
- Tielens (2008) Tielens A. G. G. M., 2008, ARA&A, 46, 289
- Triani et al. (2020) Triani D. P., Sinha M., Croton D. J., Pacifici C., Dwek E., 2020, MNRAS, 493, 2490
- Triani et al. (2021) Triani D. P., Sinha M., Croton D. J., Dwek E., Pacifici C., 2021, MNRAS, 503, 1005
- Tsai & Mathews (1995) Tsai J. C., Mathews W. G., 1995, ApJ, 448, 84
- Turk et al. (2011) Turk M. J., Smith B. D., Oishi J. S., Skory S., Skillman S. W., Abel T., Norman M. L., 2011, ApJS, 192, 9
- U et al. (2022) U V., et al., 2022, arXiv/2209.01210, p. arXiv:2209.01210
- Vats et al. (2022) Vats A., Pathak A., Onaka T., Buragohain M., Sakon I., Endo I., 2022, PASJ, 74, 161
- Vijayan et al. (2019) Vijayan A. P., Clay S. J., Thomas P. A., Yates R. M., Wilkins S. M., Henriques B. M., 2019, MNRAS, 489, 4072
- Vogelsberger et al. (2013) Vogelsberger M., Genel S., Sijacki D., Torrey P., Springel V., Hernquist L., 2013, MNRAS, 436, 3031
- Vogelsberger et al. (2019) Vogelsberger M., McKinnon R., O’Neil S., Marinacci F., Torrey P., Kannan R., 2019, MNRAS, 487, 4870
- Vogelsberger et al. (2020) Vogelsberger M., Marinacci F., Torrey P., Puchwein E., 2020, Nature Reviews Physics, 2, 42
- Voit (1992) Voit G. M., 1992, MNRAS, 258, 841
- Walch et al. (2015) Walch S., et al., 2015, MNRAS, 454, 238
- Weinberger et al. (2020) Weinberger R., Springel V., Pakmor R., 2020, ApJS, 248, 32
- Weingartner & Draine (2001) Weingartner J. C., Draine B. T., 2001, ApJ, 548, 296
- Whitaker et al. (2021) Whitaker K. E., et al., 2021, ApJ, 922, L30
- Whitcomb et al. (2020) Whitcomb C. M., Sandstrom K., Murphy E. J., Linden S., 2020, ApJ, 901, 47
- Whitcomb et al. (2022) Whitcomb C. M., Sandstrom K., Leroy A., Smith J. D. T., 2022, arXiv/2212.00180, p. arXiv:2212.00180
- Wolfire et al. (2003) Wolfire M. G., McKee C. F., Hollenbach D., Tielens A. G. G. M., 2003, ApJ, 587, 278
- Wu et al. (2006) Wu Y., Charmandaris V., Hao L., Brandl B. R., Bernard-Salas J., Spoon H. W. W., Houck J. R., 2006, ApJ, 639, 157
- Wu et al. (2010) Wu Y., et al., 2010, ApJ, 723, 895
- Wuyts et al. (2011) Wuyts S., et al., 2011, ApJ, 738, 106
- Yamasawa et al. (2011) Yamasawa D., Habe A., Kozasa T., Nozawa T., Hirashita H., Umeda H., Nomoto K., 2011, ApJ, 735, 44
- Yan et al. (2007) Yan L., et al., 2007, ApJ, 658, 778
- Zhang & Ho (2022) Zhang L., Ho L. C., 2022, arXiv/2212.05687, p. arXiv:2212.05687
- Zhukovska et al. (2016) Zhukovska S., Dobbs C., Jenkins E. B., Klessen R. S., 2016, ApJ, 831, 147