Redshift Evolution of the Electron Density in the ISM at
Uncovered with JWST/NIRSpec Spectra and Line-Spread Function Determinations
Abstract
We present electron densities in the inter-stellar medium (ISM) of star-forming galaxies at observed by the JWST/NIRSpec GLASS, ERO, and CEERS programs. We carefully evaluate line-spread functions of the NIRSpec instrument as a function of wavelength with the calibration data of a planetary nebula taken onboard, and obtain secure [O ii]3726,3729 doublet fluxes for 14 galaxies at falling on the star-formation main sequence with the NIRSpec high and medium resolution spectra. We thus derive the electron densities of singly-ionized oxygen nebulae with the standard indicator of [O ii] doublet, and find that the electron densities of the galaxies are cm-3 significantly higher than those of low- galaxies at a given stellar mass, star-formation rate (SFR), and specific SFR. Interestingly, typical electron densities of singly ionized nebulae increase from to and , which is approximated by the evolutionary relation of with . Although it is not obvious that the ISM property of is influenced by global galaxy properties, these results may suggest that nebula densities of high- galaxies are generally high due to the compact morphologies of high- galaxies evolving by () for a given stellar (halo) mass whose inverse square corresponds to the evolutionary relation. The evolutionary relation can be explained by a combination of the compact morphology and the reduction of due to the high electron temperature of the high- metal poor nebulae.
1 Introduction
Properties of interstellar medium (ISM) have spectroscopically investigated by many studies using photoionization models (e.g., Nagao et al., 2012; Nakajima & Ouchi, 2014; Feltre et al., 2016; Steidel et al., 2016; Sanders et al., 2016a; Schaerer et al., 2018; Kewley et al., 2019; Harikane et al., 2020; Berg et al., 2021; Umeda et al., 2022; Matsumoto et al., 2022). Particularly, electron densities of H ii regions are one of the key quantities to describe physical states of ISM. The electron density is usually derived from density-sensitive emission-line ratios such as [O ii]3726/[O ii]3729, [S ii]6716/[S ii]6731, and [C iii]1907/[C iii]1909 (e.g., Kewley et al., 2019). Large spectroscopic surveys have found that star-forming galaxies with have values of low-ionization regions (O ii and S ii) increasing from to cm-3 with the redshift in the range of –3 (e.g., Steidel et al., 2014; Shimakawa et al., 2015; Sanders et al., 2016a; Kashino et al., 2017; Davies et al., 2021). Beyond , values had not been investigated due to the lack of high-sensitivity near-infrared spectrographs before the arrival of James Webb Space Telescope (JWST), except for a few suggestions based on doubly-ionized regions such as (C iii– cm-3 at (Jiang et al., 2021) and (O iii cm-3 at (Killi et al., 2023). Recently, using the flux ratio of [O iii]5007 from the JWST/NIRSpec Early Release Observations (ERO; Pontoppidan et al. 2022) and [O iii]88m from ALMA observations, Fujimoto et al. (2022) have reported that a dwarf galaxy, s04590, has a (O iii) value of cm-3.
Although the (O iii or C iii) values are likely to be higher than those of star-forming galaxies (e.g., (O ii cm-3; Davies et al. 2021), we need to discuss the redshift evolution of at similar ionization regions (i.e., O ii and S ii, rather than O iii or C iii). We should also check if values change with other galaxy properties such as or star-formation rate (SFR). In this paper, we aim to measure (O ii) values of high- () star-forming galaxies identified by NIRSpec public surveys. Comparing the values with those of lower- star-forming galaxies, we also investigate the redshift evolution of and the potential dependences on and SFR.
2 Data and Sample
We use JWST/NIRSpec data of the Early Release Observations (ERO; Pontoppidan et al. 2022) taken in the SMACS 0723 lensing cluster field (hereafter ERO data), the GLASS (Treu et al., 2022) survey (hereafter GLASS data), and the CEERS (Finkelstein et al., 2023) survey (hereafter CEERS data). The ERO data were taken with medium resolution () filter-grating pairs of F170LP-G235M and F290LP-G395M covering the wavelength ranges of – and –m, respectively. The total exposure time of the ERO data is 4.86 hr for each filter-grating pair. The GLASS data were taken with high resolution () filter-grating pairs of F100LP-G140H, F170LP-G235H, and F290LP-G395H covering the wavelength ranges of –, – and –m, respectively. The total exposure time of the GLASS data is 4.9 hr for each filter-grating pair. The CEERS data were taken with medium resolution filter-grating pairs of F100LP-G140M, F170LP-G235M, and F290LP-G395M covering the wavelength ranges of –, – and –m, respectively. The total exposure time of the CEERS data is 0.86 hr for each filter-grating pair.
We use spectroscopic data reduced by Nakajima et al. (2023). Nakajima et al. (2023) take the raw data from the MAST archive and conduct level-2 and 3 calibrations, using the JWST Science Calibration Pipeline with the reference file of jwst_1028.pmap whose flux calibration is based on in-flight flat data. In addition to the read-out noise and Poisson noise outputted by the JWST/NIRSpec pipeline, Nakajima et al. (2023) have added standard deviation of the residual background to evaluate the uncertainty of background subtraction. Checking the data, we identify 5, 14, and 55 galaxies at in the ERO, GLASS, and CEERS data, respectively, whose redshifts by simultaneous fitting of the H and [O iii]. We omit galaxies with S/N ratios of the [O ii] doublet less than 10 so that we can obtain galaxies with well-determined . After the selection, we obtain 1, 4, and 11 galaxies from the ERO, GLASS, and CEERS data, respectively. Hereafter we refer to the 16 () galaxies as JWST galaxies.
3 Analysis
| Name | R.A. | Decl. | (O ii) | |||||
|---|---|---|---|---|---|---|---|---|
| deg | deg | cm-3 | km s-1 | yr-1 | ||||
| (1) | (2) | (3) | (4) | (5) | (6) | (7) | (8) | (9) |
| ERO_06355 | 110.8267392 | 7.6651 | 113 | |||||
| GLASS_100001 | 3.6038450 | 7.8737 | 69 | |||||
| GLASS_150029 | 3.5771664 | 4.5837 | 38 | |||||
| GLASS_160133 | 3.5802754 | 4.0150 | 59 | |||||
| CEERS_00397 | 214.8361970 | 6.0005 | 81 | |||||
| CEERS_00403 | 214.8289680 | 5.7609 | 56 | |||||
| CEERS_01019 | 215.0353914 | 8.6791 | 123 | |||||
| CEERS_01173 | 215.1542076 | 4.9957 | ||||||
| CEERS_01374 | 214.9439110 | 4.9999 | 67 | |||||
| CEERS_01401 | 215.2458005 | 5.3749 | 112 | |||||
| CEERS_01539 | 214.9800779 | 4.8841 | ||||||
| CEERS_01605 | 215.0754073 | 4.6309 | 16 | |||||
| CEERS_01658 | 214.9852372 | 4.6038 | 64 | |||||
| CEERS_01677 | 215.1887384 | 5.8670 | 83 |
In this paper, we measure [O ii]3726/[O ii]3729 ratios to obtain (O ii). The separation of the observed wavelengths of the [O ii]3726,3729 doublet is even shorter than the double of the expected FWHM of the grating, which means that the observed [O ii] doublet is not fully deblended even with the grating. To deblend the [O ii] doublet, we should determine emission-line profiles of observed galaxies using line-spread functions (LSFs) of NIRSpec and intrinsic velocity dispersions () of the observed galaxies. Section 3.1 describes how we derive the LSFs, and Section 3.2 explains how we measure .
3.1 Line-Spread Function
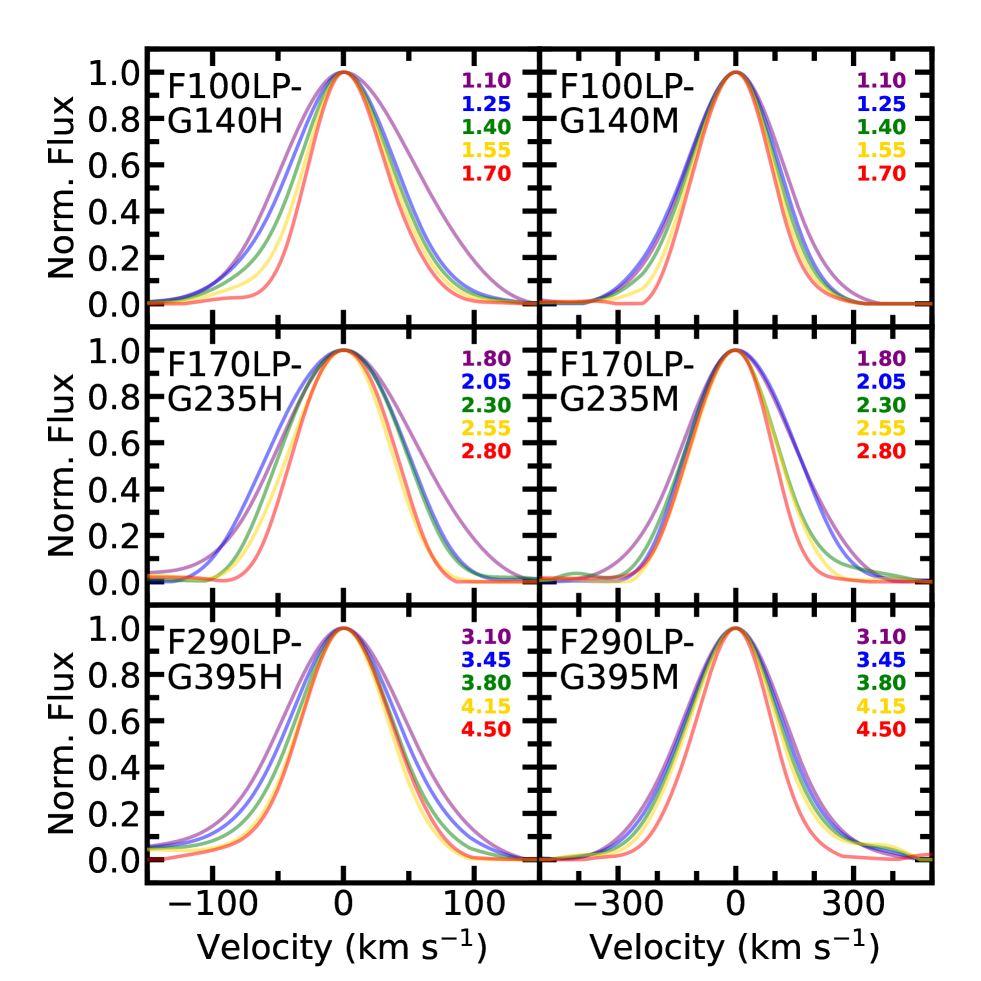
We obtain the LSFs from a planetary nebula (PN), IRAS-05248-7007. NIRSpec spectra of the PN were taken during the commissioning process (proposal ID: 1125). The PN was observed with a slit whose width is 0.2 arcsec, which is the same as those of the MSA shutters. We use the level-3 spectra available at MAST. We choose emission lines with high S/N ratios. We also avoid using emission lines blended with other nearby features. After the selection, we obtain 4, 11, 5 emission lines for the spectra obtained with the filters F100LP, F170LP, and F290LP, respectively. The selected emission lines cover wide wavelength ranges of 1.1–1.7, 1.8–2.8, and 3.1–4.5 m for the filters F100LP, F170LP, and F290LP, respectively. To obtain the LSF at an arbitrary wavelength, we interpolate the LSF profiles.
Figure 1 summarizes LSFs at different wavelengths for each filter-grating pair. The obtained LSFs of F100LP-G140H, F170LP-G235H, F290LP-G395H, F100LP-G140M, F170LP-G235M, and F290LP-G395M have median resolution values of , 2800, 3390, 1160, 1120, and 1080 obtained in wavelength ranges of 1.1–1.7, 1.8–2.8, 3.1–4.5, 1.1–1.7, 1.8–2.8, and 3.1–4.5 m, respectively. These resolution values are –20% larger than those of the nominal resolutions of for the high-resolution gratings and for the medium-resolution gratings. We also confirm that LSFs of each filter-grating pair become narrower (i.e., better resolution) with longer wavelengths, which is also expected by the NIRSpec instrumental team111https://jwst-docs.stsci.edu/jwst-near-infrared-spectrograph/nirspec-instrumentation/nirspec-dispersers-and-filters.
The PN was also observed by VLT/X-shooter with the spectral resolution of (Euclid Collaboration et al. 2023; the spectral properties are available in the Visier atlas222http://vizier.cfa.harvard.edu/viz-bin/VizieR-3?-source=J/A%2bA/674/A172/pn-0-11&-out.max=50&-out.form=HTML%20Table&-out.add=_r&-out.add=_RAJ,_DEJ&-sort=_r&-oc.form=sexa). The observed line widths of the PN are nearly the same as those expected from the spectral resolution of 6500, which suggests that the PN’s bulk motions are not resolved with . This also indicates that NIRSpec cannot resolve the PN’s bulk motions with the NIRSpec spectral resolution of or .
Nevertheless, the PN may have unresolved bulk motions. Given that intrinsic velocity dispersions () of PNe are typically km s-1 (Jacob et al., 2013), we may not be able to measure values of galaxies with km s-1. To put it the other way around, the value of 30 km s-1 does not change the LSF profiles largely, i.e., the accounts for only % and % of the observed velocity dispersion of the PN with the and gratings, respectively.
3.2 Velocity-Dispersion Measurement
To obtain of the observed galaxies, we fit a Gaussian function convolved with the LSF derived in Section 3.1. To obtain with smaller uncertainties, we measure of [O iii]5007, which is the strongest in the observed emission lines. We conduct the fittings to [O iii]4959,5007 simultaneously so that line profiles of the two emission lines are reproduced self-consistently. We fix the flux ratio [O iii]5007/[O iii]4959 to 2.98, which is accurately determined by the Einstein A coefficient (Storey & Zeippen, 2000).
We note that our fitting provides km s-1 for 2 of the 16 JWST galaxies (CEERS_01173 and CEERS_01539). We adopt km s-1 for the 2 JWST galaxies to determine [O ii]-doublet profiles, while true values of the 2 JWST galaxies are likely to be larger than 0 km s-1 and less than that of the PN used for the LSFs (i.e., km s-1; Section 3.1).
3.3 Electron-Density Measurement
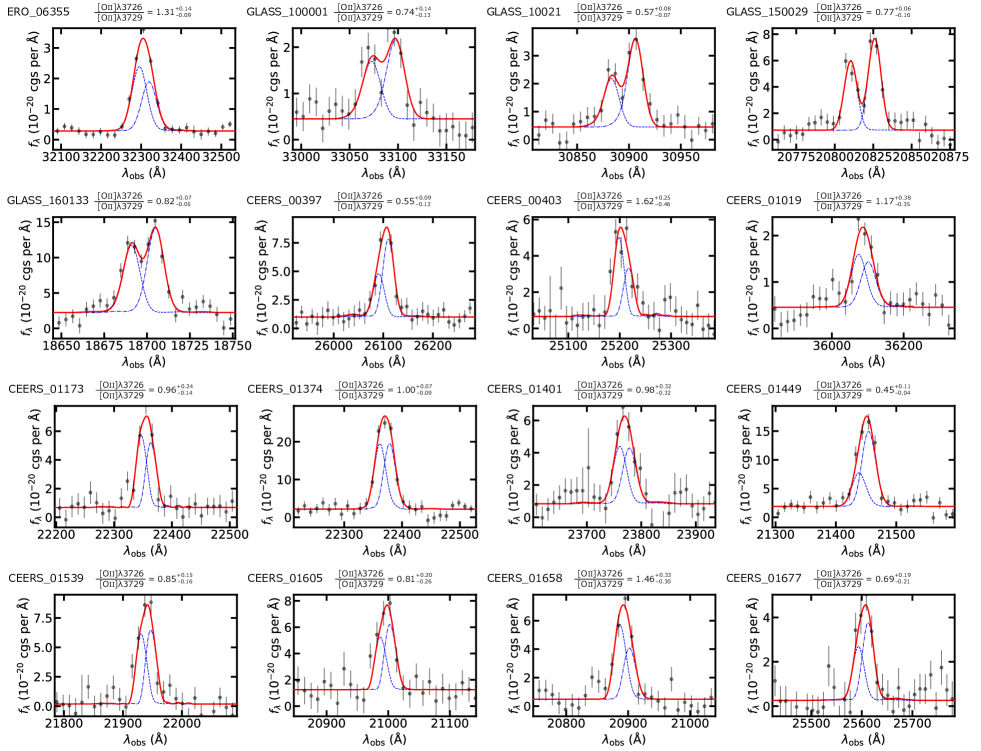
Using the LSF (Section 3.1), we measure fluxes of the [O ii] doublet. We fit 3 Gaussian functions convolved by the LSF to [O ii]3726,3729, and [O iii] simultaneously with the fixed . Figure 2 shows our fitting results. We use PyNeb (Luridiana et al. 2015; v1.1.15) to obtain from the [O ii] doublet. This method provides values consistent with those derived from the updated relation between [O ii]/[O ii] and reported by Sanders et al. (2016a). In ERO_06355, GLASS_150029, GLASS_160133, and CEERS_00397, electron temperatures of 11300, 17600, 14800, and 15200 K, respectively, have been measured from the [O iii] line (Nakajima et al., 2023; Isobe et al., 2023). For these 4 galaxies, we use these temperature values when deriving the values. For the other galaxies, we assume electron temperatures of the JWST galaxies to be 15000 K, which is typical for star-forming dwarf galaxies (e.g., Izotov et al., 2012; Kojima et al., 2020; Isobe et al., 2022; Nakajima et al., 2022). We perform Monte Carlo simulations based on spectral errors to obtain uncertainties of . We note that 2 of the 16 JWST galaxies (GLASS_10021 and CEERS_01449) show unphysical [O ii]/[O ii] ratios, even including the spectral errors into the measurements. Omitting the 2 galaxies, we obtain a final sample consisting of 14 () galaxies. Table 1 lists the derived with the uncertainties.
Since the values based on the observations are slightly lower than those with , we have performed a recovery test for the data by making mock spectra around the [O ii]3726,3729 and [O iii] lines with a typical of 60 km s-1 convolved by the LSFs and noises that match typical S/N ratios of these line fluxes. Conducting line fitting to the mock spectra in the same way as for the scientific data, we have confirmed that our fitting method can reproduce electron density values within at most 3.5% accuracy even for the spectra.
We check that different assumptions of electron temperatures from to 30000 K can change values by at most % from those calculated by the original assumption of K. This systematics of is much smaller than those derived from the spectral errors.
3.4 and SFR
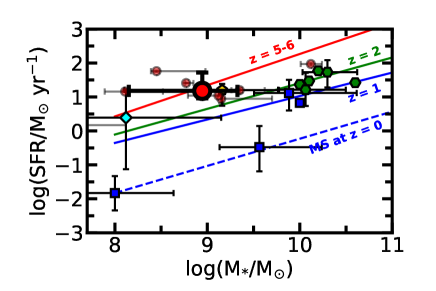
In this paper, we characterize the JWST galaxies with their and SFR values. Seven of the 14 JWST galaxies have JWST/NIRCam photometry at the time of writing. Regarding these 6 galaxies, we use and SFR values derived by Nakajima et al. (2023). Nakajima et al. (2023) derive by conducting SED fitting with prospector (Johnson et al., 2021) assuming the Chabrier (2003) IMF, a flexible star formation history, and the Calzetti et al. (2000) dust extinction law, in a similar manner to Harikane et al. (2023). NIRCam photometries of the JWST galaxies are measured by Source Extractor (Bertin & Arnouts, 1996) as in Harikane et al. (2023). The photometries are corrected for gravitational lensing magnifications modeled by glafic (Oguri, 2010). We then correct the NIRSpec spectra for slit losses by scaling the spectra to match the NIRCam photometries, where the typical correction factor is about 1.3. The SFR values are calculated from slitloss-corrected H luminosities with the NIRCam restframe optical photometry under the assumptions of the Kennicutt (1998) relation and Chabrier (2003) IMF. Figure 3 shows –SFR relations of the JWST galaxies with the NIRCam photometry. The median and SFR values of the JWST galaxies (large red circle) show that the JWST galaxies generally lie on the star-formation main sequence (SFMS) at –6 (Santini et al., 2017).
We estimate of the remaining 7 () JWST galaxies from broadband photometry of HST/ACS F606W, F814W, or HST/WFC3 F125W taken from the CANDELS EGS catalog (Stefanon et al., 2017). We use FLUX_AUTO values based on Source Extractor (Bertin & Arnouts, 1996) as total fluxes. Assuming that the 7 JWST galaxies lie on the SFMS as well as the 7 JWST galaxies with the NIRCam photometry, we adopt empirical relations between and absolute magnitude of restframe 1500 Å () derived at , 5, 6, 7, and 8 (Song et al. 2016; based on the Salpeter 1955 IMF). We choose the - relation and the HST photometry both consistent with the redshift of each JWST galaxy. Note that 3 of the 7 JWST galaxies do not have detection of HST photometry. For these 3 JWST galaxies, we calculate upper limits of based on limiting magnitudes of the HST photometry. For consistency with values derived by Nakajima et al. (2023), we rescale the values from the Salpeter (1955) to Chabrier (2003) IMF by multiplying 0.61 (Madau & Dickinson, 2014). We check that the values based on the HST photometry are consistent with those of Nakajima et al. (2023) within a level. We have propagated errors of the HST photometry and the - relations to the final stellar mass errors. The scatters of the - relations are dex at and dex at , which are smaller than those of our derived stellar mass errors. This indicates that the stellar mass errors are dominated by the HST photometry.
We also calculate SFRs of the 7 JWST galaxies from H luminosities under the assumptions of the Kennicutt (1998) relation and Chabrier (2003) IMF in the same manner as Nakajima et al. (2023). Although we do not correct the H luminosities of these 7 galaxies without the NIRCam photometry for slit losses, the small typical slit-loss correction factor of 1.3 suggests that the slit-loss correction does not change the SFR values much. We summarize the and SFR values in Table 1.
4 Result and Discussion
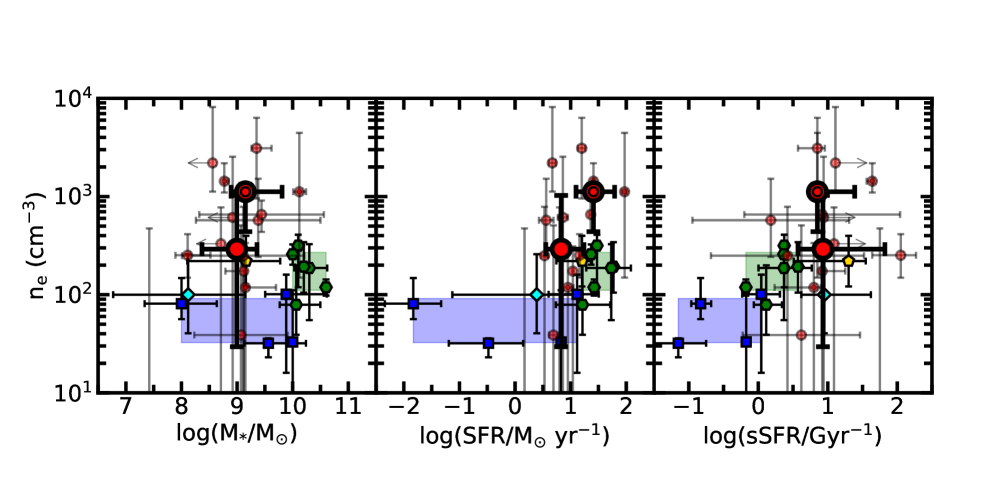
Figure 4 presents – (left), –SFR (center), and –sSFR (right) relations. The small red circles and the small red double circle in Figure 4 represent the properties of each JWST galaxy at –6 and –9, respectively. The large red circles and the large red double circles denote median and 16th-84th percentiles of the properties of the JWST galaxies at –6 and –9, respectively. We find that the median values of the JWST galaxies at –6 and –9 are and cm-3, respectively.
For comparison, we compile median values of SFMS galaxies at –1 (blue square; Berg et al. 2012; Davies et al. 2021; Swinbank et al. 2019) and –3 (green hexagon; [O ii]- or [S ii]-based; Davies et al. 2021; Kaasinen et al. 2017; Kashino et al. 2017; Sanders et al. 2016a; Steidel et al. 2014) whose –SFR relations are shown in Figure 3. We note that we derive the median value of Berg et al. (2012) from the flux ratios of [S ii]6716/[S ii]6731 and of 31 galaxies in Berg et al. (2012). In addition, the median SFR values of Davies et al. (2021) are read from their figures.
It should be noted that values are reported not to be very dependent on (Kashino & Inoue, 2019) but on SFR and sSFR (e.g., Shimakawa et al., 2015; Jiang et al., 2019; Kashino & Inoue, 2019; Davies et al., 2021) at a given redshift. To examine how much the values change with SFR and sSFR, we plot the 16th-84th percentile ranges of the values of the SFMS galaxies at –1 with the blue shaded region and at –3 with the green shaded region, respectively, in Figure 4. The blue shaded region indicates that the dependencies on , SFR, and sSFR in the ranges of –10, –1, and –0, respectively, are folded in the range of –100 cm-3. Note that the sSFR values of the SFMS galaxies at –1 are lower than those of the JWST galaxies. The SFMS galaxies at –3 typically have –300, while the parametric ranges examined are relatively narrow, i.e., –10.5, –2, and –0.5.
To cover higher sSFRs that match those of the JWST galaxies, we also refer to active star-forming galaxies at (cyan diamond; Berg et al. 2022) and –3 (yellow pentagon; Christensen et al. 2012a, b; Sanders et al. 2016b; Gburek et al. 2019)) whose sSFR values are comparable to those of the JWST galaxies (cf. Figure 3). We refer to these galaxies as high sSFR galaxies. The median values of the high sSFR galaxies at and –3 are and cm-3, respectively, both of which are comparable to those of the SFMS galaxies at a given redshift.
The left and center panels of Figure 4 illustrate that the values increase from the –1 to –3 and –9 at a given and SFR. This indicates that evolves with redshift beyond the range that can be explained by the correlation of and SFR. On the other hand, the sSFR distribution of the JWST galaxies does not overlap with that of the SFMS galaxies at –3 as shown in the right panel of Figure 4, which makes it hard to tell if the values evolve with redshift or correlate with sSFR. However, compared with the high sSFR galaxies at (cyan diamond) and –3 (yellow pentagon), the values are likely to increase from the –1 to –3 and –9 at a given sSFR as well. Note that the high sSFR sample consists of 45 galaxies, comparable to those of Davies et al. (2021) in each redshift bin, while the –3 high sSFR sample consists of only 5 galaxies due to the lack of statistical surveys for –3 dwarf galaxies.
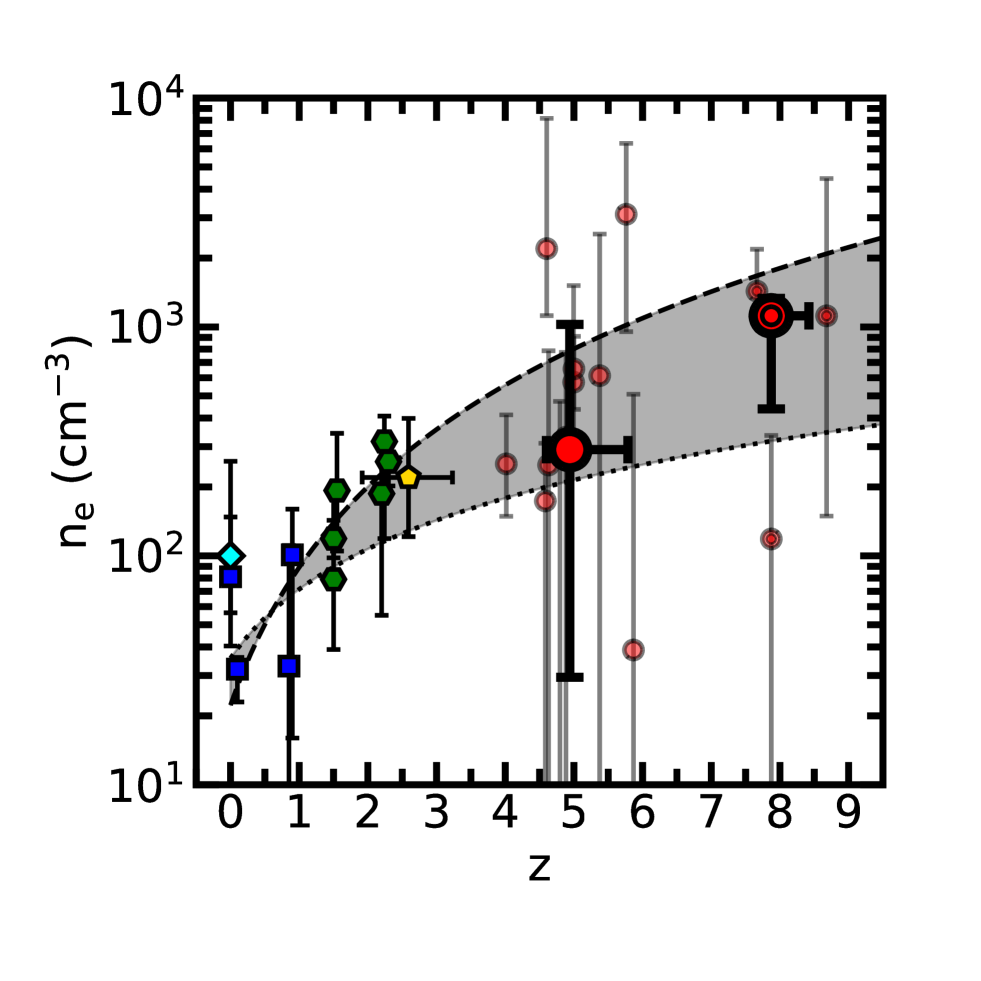
Figure 5 clearly shows that the values typically increase from to –3 and –9. We then investigate the dependence of on by comparing the values of the JWST galaxies with an extrapolation of the increasing trend identified in lower- galaxies. Assuming that the lower- galaxies follow or relation, we fit the 2 functions to the –3 galaxies based on minimization. We find that the JWST galaxies at –9 have median and values (large red circles) falling in the gap between the and relations (gray shaded region), which suggests that galaxies at –9 have an evolutionary relation of with –2.
Although it is not obvious that global galaxy properties impact on the ISM property of , the relation suggests that nebula densities of high- star-forming galaxies are generally high due to the compact morphology, i.e., smaller effective radii and virial radii . Given the size evolutions of (Shibuya et al., 2015; Ono et al., 2023) and (e.g., Mo & White, 2002), stellar- and halo-mass densities are expected to be proportional to and at a given mass, respectively, under the assumption that star-forming galaxies have disks (suggested by their low Sérsic indices; cf. Shibuya et al. 2015; Ono et al. 2023) whose heights are constant. If the stellar-mass and halo-mass densities are proportional to , is approximately proportional to . This suggestion is similar to the conclusion claimed by Davies et al. (2021).
However, the JWST galaxies generally have values slightly lower than those predicted by the evolutionary relation. Although this discrepancy may be explained by the % uncertainty of the electron temperature (Section 3.3), we should think of other factors that can decrease values. One possible explanation is that thermal expansions at higher electron temperatures of high- metal-poor nebulae result in lower values for a given pressure (Kewley et al., 2019). The –2 evolutionary relation of may originate from a combination of the compact morphology and the high electron temperature of high- galaxies. It should be noted that the JWST galaxies have values dex smaller than those of the SFMS galaxies at –3. Since the observed size-mass relation is a positive trend, –3 galaxies with similar to the JWST galaxies may have larger values than the current SFMS samples. This could lead to an even flatter redshift evolution of .
It should also be noted that there is a possibility that the relatively-high S/N criterion for the [O ii] doublet (Section 2) causes a bias towards lower [O iii]5007/[O ii]3727,3729 ratios (O32, hereafter). This potential bias leads to ionization parameters lower (e.g., Kewley & Dopita, 2002), which leads to high evidenced with , where is a hydrogen number density roughly proportional to . However, the JWST galaxies already have a high median O32 value of , which indicates that the JWST galaxies are not biased towards low O32.
5 Summary
We present electron densities of singly-ionized regions (O ii) in the inter-stellar medium (ISM) of star-formation main-sequence galaxies at –9 observed by JWST/NIRSpec ERO, GLASS, and CEERS programs.
Deriving line-spread functions of the NIRSpec instrument from in-flight calibration data, we securely measure [O ii]3726/[O ii]3729 ratios of 14 galaxies at –8.68.
We find that the 14 galaxies have cm-3 significantly higher than those of low- galaxies at a given stellar mass, star-formation rate (SFR), and specific SFR (Figure 4).
We also identify an increase in typical values from to –3 and –9, which is approximated by with –2 (Figure 5).
Although it is not obvious that the ISM property of is influenced by global galaxy properties, the –2 evolutionary relation can be explained by a combination of the compact morphology and the reduction of due to high electron temperatures of high- metal-poor nebulae.
We thank M. Oguri for providing his lens models. We also thank H. Yajima and H. Fukushima for having useful discussions. We are grateful to staff of the James Webb Space Telescope Help Desk for letting us know useful information. This work is based on observations made with the NASA/ESA/CSA James Webb Space Telescope. Some of the data presented in this paper were obtained from the Mikulski Archive for Space Telescopes (MAST) at the Space Telescope Science Institute, which is operated by the Association of Universities for Research in Astronomy, Inc., under NASA contract NAS 5-03127 for JWST. The specific observations analyzed can be accessed via https://doi.org/10.17909/qfxm-y747 (catalog 10.17909/qfxm-y747). These observations are associated with programs 1125, 2736, 1324, and 1345. The authors acknowledge the ERO, GLASS, and CEERS teams led by Klaus M. Pontoppidan, Tommaso Treu, and Steven L. Finkelstein, respectively, for developing their observing programs with a zero-exclusive-access period. This work is based on observations taken by the CANDELS Multi-Cycle Treasury Program with the NASA/ESA HST, which is operated by the Association of Universities for Research in Astronomy, Inc., under NASA contract NAS5-26555. This work was supported by the joint research program of the Institute for Cosmic Ray Research (ICRR), University of Tokyo. Y.I., K.N., and Y.H. are supported by JSPS KAKENHI Grant Nos. 21J20785, 20K22373, and 21K13953, respectively. This paper is supported by World Premier International Research Center Initiative (WPI Initiative), MEXT, Japan, as well as the joint research program of the Institute of Cosmic Ray Research (ICRR), the University of Tokyo. This work is supported by KAKENHI (19H00697, 20H00180, and 21H04467) Grant-in-Aid for Scientific Research (A) through the Japan Society for the Promotion of Science. This research was supported by a grant from the Hayakawa Satio Fund awarded by the Astronomical Society of Japan.
References
- Astropy Collaboration et al. (2013) Astropy Collaboration, Robitaille, T. P., Tollerud, E. J., et al. 2013, A&A, 558, A33, doi: 10.1051/0004-6361/201322068
- Berg et al. (2021) Berg, D. A., Chisholm, J., Erb, D. K., et al. 2021, ApJ, 922, 170, doi: 10.3847/1538-4357/ac141b
- Berg et al. (2012) Berg, D. A., Skillman, E. D., Marble, A. R., et al. 2012, ApJ, 754, 98, doi: 10.1088/0004-637X/754/2/98
- Berg et al. (2022) Berg, D. A., James, B. L., King, T., et al. 2022, ApJS, 261, 31, doi: 10.3847/1538-4365/ac6c03
- Bertin & Arnouts (1996) Bertin, E., & Arnouts, S. 1996, A&AS, 117, 393, doi: 10.1051/aas:1996164
- Calzetti et al. (2000) Calzetti, D., Armus, L., Bohlin, R. C., et al. 2000, ApJ, 533, 682, doi: 10.1086/308692
- Chabrier (2003) Chabrier, G. 2003, PASP, 115, 763, doi: 10.1086/376392
- Chang et al. (2015) Chang, Y.-Y., van der Wel, A., da Cunha, E., & Rix, H.-W. 2015, ApJS, 219, 8, doi: 10.1088/0067-0049/219/1/8
- Christensen et al. (2012a) Christensen, L., Richard, J., Hjorth, J., et al. 2012a, MNRAS, 427, 1953, doi: 10.1111/j.1365-2966.2012.22006.x
- Christensen et al. (2012b) Christensen, L., Laursen, P., Richard, J., et al. 2012b, MNRAS, 427, 1973, doi: 10.1111/j.1365-2966.2012.22007.x
- Davies et al. (2021) Davies, R. L., Förster Schreiber, N. M., Genzel, R., et al. 2021, ApJ, 909, 78, doi: 10.3847/1538-4357/abd551
- Euclid Collaboration et al. (2023) Euclid Collaboration, Paterson, K., Schirmer, M., et al. 2023, A&A, 674, A172, doi: 10.1051/0004-6361/202346252
- Feltre et al. (2016) Feltre, A., Charlot, S., & Gutkin, J. 2016, MNRAS, 456, 3354, doi: 10.1093/mnras/stv2794
- Finkelstein et al. (2023) Finkelstein, S. L., Bagley, M. B., Ferguson, H. C., et al. 2023, ApJ, 946, L13, doi: 10.3847/2041-8213/acade4
- Fujimoto et al. (2022) Fujimoto, S., Ouchi, M., Nakajima, K., et al. 2022, arXiv e-prints, arXiv:2212.06863. https://arxiv.org/abs/2212.06863
- Gburek et al. (2019) Gburek, T., Siana, B., Alavi, A., et al. 2019, ApJ, 887, 168, doi: 10.3847/1538-4357/ab5713
- Harikane et al. (2020) Harikane, Y., Ouchi, M., Inoue, A. K., et al. 2020, ApJ, 896, 93, doi: 10.3847/1538-4357/ab94bd
- Harikane et al. (2023) Harikane, Y., Ouchi, M., Oguri, M., et al. 2023, ApJS, 265, 5, doi: 10.3847/1538-4365/acaaa9
- Isobe et al. (2022) Isobe, Y., Ouchi, M., Suzuki, A., et al. 2022, ApJ, 925, 111, doi: 10.3847/1538-4357/ac3509
- Isobe et al. (2023) Isobe, Y., Ouchi, M., Tominaga, N., et al. 2023, arXiv e-prints, arXiv:2307.00710, doi: 10.48550/arXiv.2307.00710
- Izotov et al. (2012) Izotov, Y. I., Thuan, T. X., & Guseva, N. G. 2012, A&A, 546, A122, doi: 10.1051/0004-6361/201219733
- Jacob et al. (2013) Jacob, R., Schönberner, D., & Steffen, M. 2013, A&A, 558, A78, doi: 10.1051/0004-6361/201321532
- Jiang et al. (2019) Jiang, F., Dekel, A., Freundlich, J., et al. 2019, MNRAS, 487, 5272, doi: 10.1093/mnras/stz1499
- Jiang et al. (2021) Jiang, L., Kashikawa, N., Wang, S., et al. 2021, Nature Astronomy, 5, 256, doi: 10.1038/s41550-020-01275-y
- Johnson et al. (2021) Johnson, B. D., Leja, J., Conroy, C., & Speagle, J. S. 2021, ApJS, 254, 22, doi: 10.3847/1538-4365/abef67
- Kaasinen et al. (2017) Kaasinen, M., Bian, F., Groves, B., Kewley, L. J., & Gupta, A. 2017, MNRAS, 465, 3220, doi: 10.1093/mnras/stw2827
- Kashino & Inoue (2019) Kashino, D., & Inoue, A. K. 2019, MNRAS, 486, 1053, doi: 10.1093/mnras/stz881
- Kashino et al. (2017) Kashino, D., Silverman, J. D., Sanders, D., et al. 2017, ApJ, 835, 88, doi: 10.3847/1538-4357/835/1/88
- Kennicutt (1998) Kennicutt, R. C. 1998, ARA&A, 36, 189, doi: 10.1146/annurev.astro.36.1.189
- Kewley & Dopita (2002) Kewley, L. J., & Dopita, M. A. 2002, ApJS, 142, 35, doi: 10.1086/341326
- Kewley et al. (2019) Kewley, L. J., Nicholls, D. C., Sutherland, R., et al. 2019, ApJ, 880, 16, doi: 10.3847/1538-4357/ab16ed
- Killi et al. (2023) Killi, M., Watson, D., Fujimoto, S., et al. 2023, MNRAS, 521, 2526, doi: 10.1093/mnras/stad687
- Kojima et al. (2020) Kojima, T., Ouchi, M., Rauch, M., et al. 2020, ApJ, 898, 142, doi: 10.3847/1538-4357/aba047
- Luridiana et al. (2015) Luridiana, V., Morisset, C., & Shaw, R. A. 2015, A&A, 573, A42, doi: 10.1051/0004-6361/201323152
- Madau & Dickinson (2014) Madau, P., & Dickinson, M. 2014, ARA&A, 52, 415, doi: 10.1146/annurev-astro-081811-125615
- Matsumoto et al. (2022) Matsumoto, A., Ouchi, M., Nakajima, K., et al. 2022, ApJ, 941, 167, doi: 10.3847/1538-4357/ac9ea1
- Mo & White (2002) Mo, H. J., & White, S. D. M. 2002, MNRAS, 336, 112, doi: 10.1046/j.1365-8711.2002.05723.x
- Nagao et al. (2012) Nagao, T., Maiolino, R., De Breuck, C., et al. 2012, A&A, 542, L34, doi: 10.1051/0004-6361/201219518
- Nakajima & Ouchi (2014) Nakajima, K., & Ouchi, M. 2014, MNRAS, 442, 900, doi: 10.1093/mnras/stu902
- Nakajima et al. (2023) Nakajima, K., Ouchi, M., Isobe, Y., et al. 2023, arXiv e-prints, arXiv:2301.12825, doi: 10.48550/arXiv.2301.12825
- Nakajima et al. (2022) Nakajima, K., Ouchi, M., Xu, Y., et al. 2022, ApJS, 262, 3, doi: 10.3847/1538-4365/ac7710
- Oguri (2010) Oguri, M. 2010, PASJ, 62, 1017, doi: 10.1093/pasj/62.4.1017
- Ono et al. (2023) Ono, Y., Harikane, Y., Ouchi, M., et al. 2023, ApJ, 951, 72, doi: 10.3847/1538-4357/acd44a
- Pontoppidan et al. (2022) Pontoppidan, K. M., Barrientes, J., Blome, C., et al. 2022, ApJ, 936, L14, doi: 10.3847/2041-8213/ac8a4e
- Salpeter (1955) Salpeter, E. E. 1955, ApJ, 121, 161, doi: 10.1086/145971
- Sanders et al. (2016a) Sanders, R. L., Shapley, A. E., Kriek, M., et al. 2016a, ApJ, 816, 23, doi: 10.3847/0004-637X/816/1/23
- Sanders et al. (2016b) —. 2016b, ApJ, 825, L23, doi: 10.3847/2041-8205/825/2/L23
- Santini et al. (2017) Santini, P., Fontana, A., Castellano, M., et al. 2017, ApJ, 847, 76, doi: 10.3847/1538-4357/aa8874
- Schaerer et al. (2018) Schaerer, D., Izotov, Y. I., Nakajima, K., et al. 2018, A&A, 616, L14, doi: 10.1051/0004-6361/201833823
- Shibuya et al. (2015) Shibuya, T., Ouchi, M., & Harikane, Y. 2015, ApJS, 219, doi: 10.1088/0067-0049/219/2/15
- Shimakawa et al. (2015) Shimakawa, R., Kodama, T., Steidel, C. C., et al. 2015, MNRAS, 451, 1284, doi: 10.1093/mnras/stv915
- Song et al. (2016) Song, M., Finkelstein, S. L., Ashby, M. L. N., et al. 2016, ApJ, 825, 5, doi: 10.3847/0004-637X/825/1/5
- Speagle et al. (2014) Speagle, J. S., Steinhardt, C. L., Capak, P. L., & Silverman, J. D. 2014, ApJS, 214, 15, doi: 10.1088/0067-0049/214/2/15
- Stefanon et al. (2017) Stefanon, M., Bouwens, R. J., Labbé, I., et al. 2017, ApJ, 843, 36, doi: 10.3847/1538-4357/aa72d8
- Steidel et al. (2016) Steidel, C. C., Strom, A. L., Pettini, M., et al. 2016, ApJ, 826, 159, doi: 10.3847/0004-637X/826/2/159
- Steidel et al. (2014) Steidel, C. C., Rudie, G. C., Strom, A. L., et al. 2014, ApJ, 795, 165, doi: 10.1088/0004-637X/795/2/165
- Storey & Zeippen (2000) Storey, P. J., & Zeippen, C. J. 2000, MNRAS, 312, 813, doi: 10.1046/j.1365-8711.2000.03184.x
- Swinbank et al. (2019) Swinbank, A. M., Harrison, C. M., Tiley, A. L., et al. 2019, MNRAS, 487, 381, doi: 10.1093/mnras/stz1275
- The Astropy Collaboration (2018) The Astropy Collaboration. 2018, astropy v3.1: a core python package for astronomy, 3.1, Zenodo, Zenodo, doi: 10.5281/zenodo.4080996
- Treu et al. (2022) Treu, T., Roberts-Borsani, G., Bradac, M., et al. 2022, ApJ, 935, 110, doi: 10.3847/1538-4357/ac8158
- Umeda et al. (2022) Umeda, H., Ouchi, M., Nakajima, K., et al. 2022, ApJ, 930, 37, doi: 10.3847/1538-4357/ac602d