SR measurements on Sr2RuO4 under uniaxial stress
Abstract
Muon spin rotation/relaxation (SR) and polar Kerr effect measurements provide evidence for a time-reversal symmetry breaking (TRSB) superconducting state in Sr2RuO4. However, the absence of a cusp in the superconducting transition temperature () vs. stress and the absence of a resolvable specific heat anomaly at TRSB transition temperature () under uniaxial stress challenge a hypothesis of TRSB superconductivity. Recent SR studies under pressure and with disorder indicate that the splitting between and occurs only when the structural tetragonal symmetry is broken. To further test such behavior, we measured through susceptibility measurements, and through SR, under uniaxial stress applied along a lattice direction. We have obtained preliminary evidence for suppression of below , at a rate much higher than the suppression rate of .
I Introduction
Even after nearly 30 years of research, the superconductivity of Sr2RuO4 is a mystery [1]. The greatest conundrum is the evidence that the order parameter combines even parity with time-reversal symmetry breaking. The evidence for even parity comes especially from recent NMR measurements [2, 3, 4], showing a spin-singlet-like susceptibility drop below . Evidence for time-reversal symmetry breaking (TRSB) comes from anomalous switching noise in junctions [5, 6], Kerr rotation [7], and enhanced muon spin relaxation in the superconducting state [8, 9, 10, 11, 12, 13, 14].
In previous muon spin rotation/relaxation (SR) studies of Sr2RuO4, some of the present authors observed that and split under uniaxial stresses applied along a crystallographic direction, thereby supporting a scenario of TRSB superconductivity [13]. Together with the observation that and track each other under hydrostatic stress and also under an introduction of disorder [12], this observation suggests a symmetry-protected even-parity chiral superconducting state, . This order parameter would be surprising because the line node at implies, conventionally, interlayer pairing, while the interlayer interactions in Sr2RuO4 are expected to be weak given the apparent strong two-dimensionality of its electronic structure [15]. Recently, it has been proposed that the superconductivity of Sr2RuO4 could emerge through interorbital interactions [16, 17, 18, 19, 20, 21]. Pairing in these proposals is primarily driven by local interactions (such as Hund’s coupling), evading the need for strong inter-layer coupling and suggesting that chiral -wave superconductivity could be a rather natural order parameter for Sr2RuO4.
So far, the splitting of the transitions under uniaxial stress has been seen only in SR measurements. In contrast with expectations for a chiral state, a second anomaly was not resolved either in heat capacity [22] nor in elastocaloric effect [23] measurements in which uniaxial stress was applied to split and . In addition, the expected cusp in the dependence of on uniaxial stress has not been resolved for either or directions. These contradictory results have led to proposals that TRSB in Sr2RuO4 is finely-tuned with order parameters of the form , [24, 25] or [26, 27], or even might occur only in the vicinity of extended defects [28].
For stress, strongly increases on approach to a van Hove singularity [29], while barely changes [13]. The high sensitivity of the electronic structure to stress complicates the interpretation of the observed splitting of the transitions. In contrast, the electronic band structure is less sensitive to stress applied along axes. Although a weaker dependence on stress is expected, it may be easier to interpret observed effects.
Under the tetragonal lattice symmetry of Sr2RuO4, and are expected to split under shear strain , which has principal axes, for a order parameter. In the limit of small strain, the rates of change and are inversely proportional to the condensation energies associated with each phase transition [13]. Here, we report measurements of both and under uniaxial stress applied along lattice direction. was measured through magnetic susceptibility, and through SR. stress, in addition applying shear strain, also affects the unit cell volume and lattice constant ratio . The effect of these strain components on and was estimated using the elasticity stiffness matrix known from the ultrasound experiments [30] and experimental dependencies of on hydrostatic pressure and uniaxial -axis strain. We obtained preliminary evidence that and split under the uniaxial stress, with the condensation energy associated with the time-reversal symmetry breaking being very small compared to that associated with the superconductivity overall. These are very challenging measurements due to the small size of the signal. We publish a preliminary data set now, because a more authoritative data set might not be possible for some time, mainly due to limited beamtime.
II Experimental design and Results
Single crystals of Sr2RuO4 were grown by a floating zone method [31]. Data from two samples, labeled A and B, are reported. In order to obtain samples of sufficient length for the uniaxial stress apparatus, samples were cut from a rod that grew nearly along a lattice direction. The samples studied here were either cleaved or ground into plates, exposing the interior of the as-grown rod to the muon beam.
Samples were mounted into holders using Stycast 2850 epoxy as shown in Ref. [13]. The epoxy layers were generally 50–100 m thick. Additional steps were taken to improve the chances of reaching high stresses without fracturing the sample. (1) They were cut at a angle with respect to the plane, so that shear stresses in the sample do not align with cleave planes. (2) 10 m-thick titanium foils were affixed to their surfaces with Stycast 1266 for sample B for mechanical reinforcement. (3) The slots in the holder were chamfered, as shown in Fig. 1(b) of Ref. [13], to smooth the interface between the free and clamped portions of the sample. For further details see Refs. [13, 32, 33].
The specific heat of a small piece of the crystal remaining after the cutting of the plates for SR sample A was measured using the thermal relaxation method in a physical property measurement system (PPMS, Quantum Design). The ac susceptibility of the samples prepared for the SR experiments was measured in situ using pairs of concentric coils located behind the samples. The coils were wound on each other, one of which was used as excitation and the other as a pick-up coil. The applied field for the susceptibility measurements was T. For further details, see Ref. [13, 33].
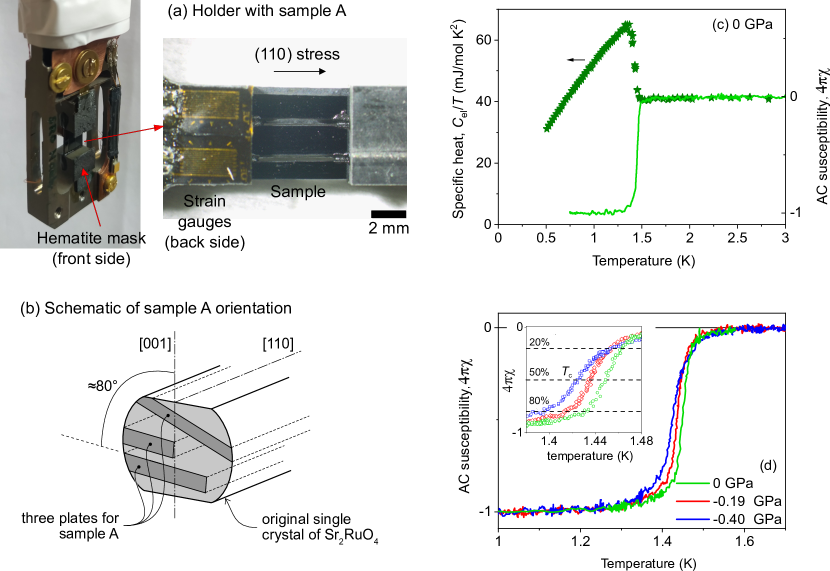
The essential experimental setup was the same as those described in Refs. [13, 32, 33]. The samples are plates thick enough to stop the muon beam, mounted in a holder that facilitates application of force. A photograph of sample A, mounted in the holder, is shown in Fig. 1a. Sample A consists of three plates cut from one single crystal, as shown in panel (b). In panel (c) the temperature dependence of the specific heat measured on a small cut-off is compared with the in situ susceptibility measurements. There is a good agreement between both sets of measurements with the zero stress K of sample A, defined as shown in panel (d). We also performed SR measurements on sample B, which had similar K, with a slightly broader transition width (Fig. 3a). The high , comparable to that of clean-limit Sr2RuO4 [34], and the sharp superconducting transition indicate a high sample quality. The stress values were measured by a set of strain gauges mounted on the uniaxial pressure cell as described in Refs. [13, 32, 33].
In the SR method, spin-polarised muons are implanted into the sample, where each then precesses in its local field. The measured quantity is the decay positron emission asymmetry , which is proportional to the muon spin polarisation at time . In this work, we performed experiments in zero external magnetic field, which was dynamically compensated to fields smaller than 1 T. Asymmetry curves at two temperatures, one above and one well below , are shown in Fig. 2, panels (a–c) for zero force and two applied pressures for sample A and in panels (g, h) for sample B. An increase in the muon spin relaxation rate at low temperatures is observed for all applied pressures, indicating the presence of time-reversal symmetry breaking as seen in previous studies [8, 9, 10, 11, 13, 12]. Following the previously established procedure in Ref. [13], the exponential muon spin relaxation rate at each temperature is obtained by fitting:
| (1) |
is a background constant to account for muons that implant into non-superconducting material such as cryostat walls, and is the sample signal strength. and are determined from weak transverse-field SR measurements as described in Ref. [13] Thus, in the analysis of ZF data is the sole free fitting parameter. Previously, we studied the background relaxation rate by measuring the holder without a sample [13]. We found that within the error bars of the measurements, is temperature-independent. However, the absolute value of the is sensitive to the holder and Hematite mask position.
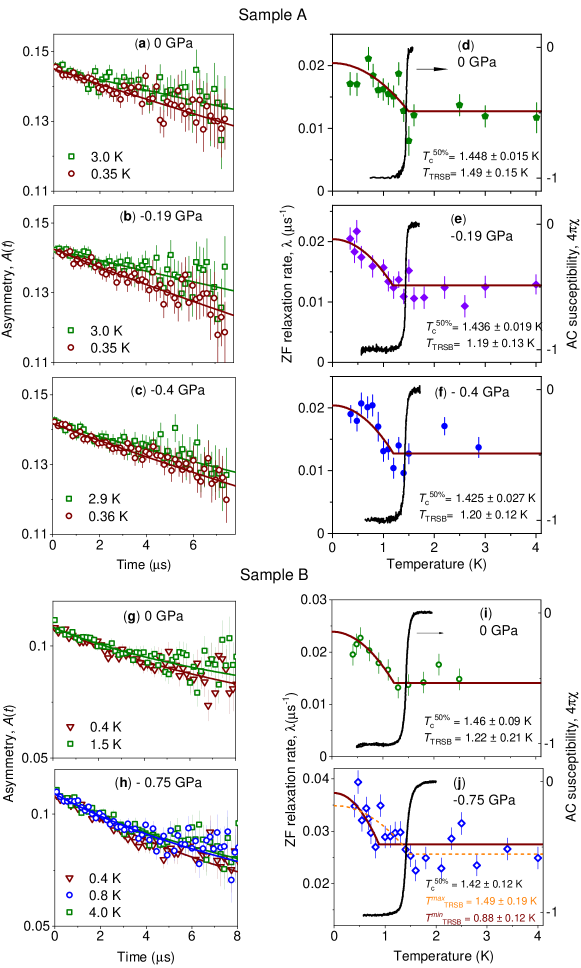
Results for sample A at zero stress and two compressive stresses are shown in Fig. 2, panels (d–f). It is seen that at each stress the muon spin relaxation rate () is enhanced in the superconducting state. To extract , we fit the temperature dependence of at each stress using a phenomenological equation:
| (2) |
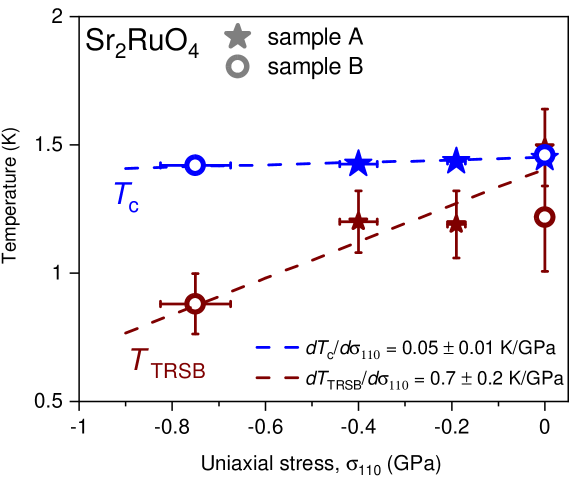
For sample A, the and are taken to be common fitting parameters among all three stresses, while is obtained independently at each stress. This assumption is justified because it is the same sample at each stress and the change in is small. This fit gives K at 0 GPa, K at GPa, and K at GPa. To allow more direct comparison, we also show the data measured at 0 GPa and GPa in one plot without fitted curves in Fig. 3(b).
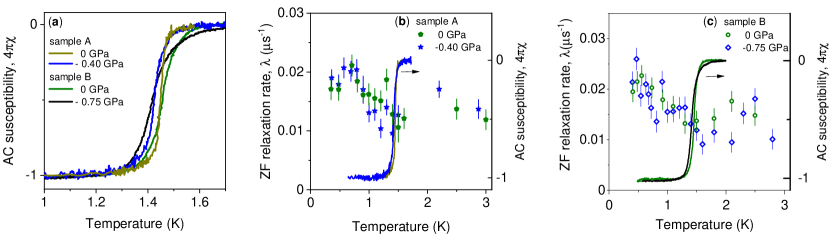
The analysis of the data for sample B, shown in Fig. 2 panels (i, j), with the same model results in K at 0 GPa and K at GPa. The rapid suppression of is consistent with the result from sample A. However, the uncertainties must be considered. For an unknown reason (possibly a shift in the sample and/or the hematite mask position), changed substantially when stress was applied, so we had to make a stress-dependent fitting parameter. The analysis performed in Ref. [13] indicates that is sensitive to the precise sample configuration, which in general, might be modified by the application of force, while , characterizing the strength of spontaneous magnetic fields, is likely set by the defect density – it varies from sample to sample (see Ref. [12] for discussion). So the defect density is unlikely to change with stress. (At first, the measurements under stress were performed. Then the stress was slowly released at 6K, and the zero-stressed measurements were performed.) For a TRSB superconductor, the magnitude of can also depend on the size of the superconducting gaps, and hence it might depend on and values. If is taken to be stress-dependent, we obtain a larger at GPa than at GPa, as shown in panel (j) by the dashed orange curve giving a very high K. This would result in an opposite dependence on stress for sample B compared to sample A, which seems unlikely. To allow more direct comparison, we also show the data for sample B measured at 0 GPa and GPa in one plot without fitted curves in Fig. 3c. The -0.75 GPa curve for sample B was shifted down for better comparison with 0 GPa data.
The resulting experimental phase diagram is shown in Fig. 4. Since there is the discussed uncertainty in the analysis for sample B, the dashed maroon curve represents the upper limit for the slope, which substantially exceeds . However, with the current data, we cannot exclude the possibility that and do not split under stress.
III Discussion
Our measurements show K/GPa , decreases slightly under the compression (Fig. 4). However, uniaxial stress applied along the direction induces not only shear strain, but also a change in the unit cell volume and in the lattice parameter ratio . In an analysis given in the Appendix, these latter two effects are shown to contribute about 0.1 K/GPa. This sets an upper limit on the coupling of to shear strain of 5 K.
Our experimental data show that can be more susceptible to the stress than giving an upper limit for the slope K/GPa (see Fig. 4). However, we cannot rule out the possibility that there is in fact no the stress induced splitting between and . 0.7 K/GPa is much larger than the contribution from non-shear elements of the applied strain, and so would require substantial coupling to the shear strain. It is shown in the Appendix that this corresponds to an upper limit 40 K.
Recently, two independent ultrasound studies of Sr2RuO4 reported a discontinuity in the shear elastic modulus at in accord with expectations for a multicomponent component order parameter [30, 35]. If the order parameter is chiral, with two components related by symmetry ( or ), an Ehrenfest relationship applies:
| (3) |
where is the change in at , and is the heat capacity jump at [30]. We note that the ultrasound experiments are consistent with two-component order parameters that either break or do not break time-reversal symmetry. However, in light of other evidence reviewed in the introduction, we assume that the jump in is associated with time-reversal symmetry breaking.
In Ghosh et al and Benhabib et al, and 0.03 MPa were observed, respectively [30, 35]. (In Benhabib et al, a change in shear sound velocity of 0.2 ppm was reported, indicating a change in of 0.4 ppm.) The reason for the difference is not clear, although the very different frequencies of the measurements (2 versus 169 MHz) are a possible factor. Taking mJ/mol-K [30] in Eq. 3, MPa implies a product of slopes K2, and MPa implies a product of slopes K2. Our data provides an upper limit on of 200 K2. According to Eq. 3, the value is reconcilable with MPa [35], but not MPa [30].
Our data indicate that might be considerably more sensitive to stress than . If the order parameter is symmetry-protected chiral, then the ratio of heat capacity anomalies in the mean field is inverse to the ratio of slopes and (see supplementary information in Ref. [13]). If the order parameter is one with accidental degeneracy then this exact relation no longer holds, but an approximately inverse relationship between condensation energy and slopes is still expected. Our data indicate that could be an order of magnitude larger than , in which case the second heat capacity anomaly could be below the resolution limit set in Ref. [22].
Several factors affect the ratio of slopes and . For chiral states such as the slopes depend on the anisotropy of the Fermi surface taking part in superconductivity. In the case of multiorbital superconductivity of Sr2RuO4 with complex Fermi surface, the calculation of the slopes is rather challenging and requires further studies. Qualitatively, a possible explanation for a large and the related small heat capacity anomaly at is that breaking time-reversal symmetry causes only a narrow node to be filled in. Recent calculations of the specific heat for various accidentally degenerate superconducting orders indicate that a better agreement between experimental data can be obtained for , with -indicates an -wave state with accidental nodes, compared to other orders [36].
In conclusion, our data set an upper limit on the dependence of on shear strain . This upper limit is compatible with GPa, as reported in Ref. [35], but not with GPa reported in Ref. [30]. Further studies under a uniaxial stress using SR and other experimental techniques are needed to refine the obtained results.
IV Appendix
IV.1 Analysis of the applied strain
In the experiment, we apply stress, which results in orthorhombic distortion of the lattice and affects the unit cell parameters. In general, the applied stresses () coupled to strains () by the elasticity stiffness matrix for tetragonal crystal symmetry:
where i = x, y, z, xz, zy, and xy. The shear strain in the main text is connected to the xy strain by . Using the measured elastic constants from Ref. [30], we get:
where the values are given in GPa. Inverting the matrix we get the relationship between strains and stresses:
The experimental value for the slope of under hydrostatic pressure is K/GPa and under uniaxial -axis strain K/GPa, where denotes uniaxial stress along the -axis, hydrostatic stress, where other components are zero.
IV.2 Derivation of , and
To estimate the effect of the stress on in the limit of small deformations one can decompose the effect of hydrostatic pressure and -axis stress into individual components. To obtain the derivatives under hydrostatic pressure and -axis stress we have used the stain-stress matrix:
| (A1) |
| (A2) |
Inverting the equations we get:
| (A3) |
| (A4) |
IV.3 Effect of the volume change and tetragonal distortions
The effect of the hydrostatic pressure and the -axis stress on can also be decomposed on the fractional volume change of the unit cell , and the fraction of the a volume-preserving tetragonal distortion .
| (A5) |
Thus, for the effect of the volume change we have: K.
| (A6) |
| (A7) |
Thus, for the effect of the tetragonal distortion we have: K. Both values a very similar to the estimated one in Ref. [37].
IV.4 Approximations for the stress
For the (110) stress we considered two different approximations. i) In the case of an anisotropic metal one can assume that [29]. ii) For the other limiting case, one assumes that the applied stress along the directions results in stress components: , and . To discriminate between these two possibilities we compared the experimental value of the Young’s modulus along the direction of GPa with the one obtained within these two approximations using the strain-stress matrix. For that, we need to express the change in the length of the diagonal over the changes of the -axis and the angle between and (shear strain) . For zero stress: and under the stress: . For the small deformations and . Thus, one get:
| (A8) |
Finally, for case i) assuming compression we get: , hence GPa. For case ii) we have: , hence GPa. The second value of GPa is very close to the experimental GPa. Thus, for the further estimations, we adopted ii) as our approximation. In this case using Eq. A3 and A4 we have:
| (A9) |
| (A10) |
Alternatively, the effect of the stress can be decomposed on the fractional volume change of the unit cell , and the fraction of the volume-preserving tetragonal distortion . Using Eq. A5 and A6 we have:
| (A11) |
in a good agreement with Eq. A10.
Hence, the expected change in due to shear strain is K for the measured K/GPa. Finally, we assumed that the contribution to unrelated to the shear strain is 0.109 K/GPa (the same as for ). Therefore, we neglect this small correction in the analysis of .
ACKNOWLEDGMENTS
The work was performed at the Swiss Muon Source (SS), Paul Scherrer Institute (PSI, Switzerland). The work of V.G. was supported by DFG GR 4667/1. The work of A.R. was supported by the Swiss National Foundation through the Ambizione grant number No. 186043. The work is supported by JSPS KAKENHI (Nos. JP18K04715, JP21H01033, JP22H01168, and JP22K19093), by JSPS Core-to-Core Program (No. JPJSCCA20170002), and by a JST-Mirai Program (No. JPMJMI18A3). K.I. acknowledges the support from JSPS Overseas Research Fellowships. R.S. and H-H.K acknowledges the support from DFG SFB 1143 (project ID, 247310070)) and the Würzburg-Dresden Cluster of Excellence on Complexity and Topology in Quantum Matter-ct.qmat (EXC 2147, Project ID 390858490).
References
- Maeno et al. [1994] Y. Maeno, H. Hashimoto, K. Yoshida, S. Nishizaki, T. Fujita, J. G. Bednorz, and F. Lichtenberg, Superconductivity in a layered perovskite without copper, Nature 372, 532 (1994).
- Pustogow et al. [2019] A. Pustogow, Y. K. Luo, A. Chronister, Y.-S. Su, D. A. Sokolov, F. Jerzembeck, A. P. Mackenzie, C. W. Hicks, N. Kikugawa, S. Raghu, E. D. Bauer, and S. E. Brown, Constraints on the superconducting order parameter in Sr2RuO4 from oxygen-17 nuclear magnetic resonance, Nature 574, 72 (2019).
- Ishida et al. [2020] K. Ishida, M. Manago, K. Kinjo, and Y. Maeno, Reduction of the 17-o knight shift in the superconducting state and the heat-up effect by nmr pulses on Sr2RuO4, J. Phys. Soc. Japan 89, 034712 (2020).
- Chronister et al. [2021] A. Chronister, A. Pustogow, N. Kikugawa, D. A. Sokolov, F. Jerzembeck, C. W. Hicks, A. P. Mackenzie, E. D. Bauer, and S. E. Brown, Evidence for even parity unconventional superconductivity in Sr2RuO4, Proc. Nat. Acad. Sci. USA 118, e2025313118 (2021).
- Anwar et al. [2013] M. S. Anwar, T. Nakamura, S. Yonezawa, M. Yakabe, R. Ishiguro, H. Takayanagi, and Y. Maeno, Anomalous switching in Nb/Ru/Sr2RuO4 topological junctions by chiral domain wall motion, Sci. Reports 3, 2480 (2013).
- Nakamura et al. [2012] T. Nakamura, T. Sumi, S. Yonezawa, T. Terashima, M. Sigrist, H. Kaneyasu, and Y. Maeno, Essential configuration of Pb/Ru/Sr2RuO4 junctions exhibiting anomalous superconducting interference, J. Phys. Soc. Japan 81, 064708 (2012).
- Xia et al. [2006] J. Xia, Y. Maeno, P. T. Beyersdorf, M. M. Fejer, and A. Kapitulnik, High resolution polar kerr effect measurements of Sr2RuO4: Evidence for broken time-reversal symmetry in the superconducting state, Phys. Rev. Lett. 97, 167002 (2006).
- Luke et al. [1998] G. M. Luke, Y. Fudamoto, K. M. Kojima, M. I. Larkin, J. Merrin, B. Nachumi, Y. J. Uemura, Y. Maeno, Z. Q. Mao, Y. Mori, H. Nakamura, and M. Sigrist, Time-reversal symmetrybreaking superconductivity in Sr2RuO4, Nature 394, 558 (1998).
- Luke et al. [2000] G. Luke, Y. Fudamoto, K. Kojima, M. Larkin, B. Nachumi, Y. Uemura, J. Sonier, Y. Maeno, Z. Mao, Y. Mori, and D. Agterberg, Unconventional superconductivity in Sr2RuO4, Physica B 289-290, 373 (2000).
- T. Shiroka et al. [2012] T. T. Shiroka, R. Fittipaldi, M. Cuoco, R. De Renzi, Y. Maeno, R. J. Lycett, S. Ramos, E. M. Forgan, C. Baines, A. Rost, V. Granata, and A. Vecchione, sr studies of superconductivity in eutectically grown mixed ruthenates, Phys. Rev. B. 85, 134527 (2012).
- Higemoto et al. [2016] W. Higemoto, Y. Aoki, and D. E. MacLaughlin, Spin and time-reversal symmetries of superconducting electron pairs probed by the muon spin rotation and relaxation technique, Journal of the Physical Society of Japan 85, 091007 (2016).
- Grinenko et al. [2021a] V. Grinenko, D. Das, B. Zinkl, N. Kikugawa, Y. Maeno, C. W. Hicks, H.-H. Klauss, M. Sigrist, and R. Khasanov, Unsplit superconducting and time reversal symmetry breaking transitions in Sr2RuO4 under hydrostatic pressure and disorder, Nat. Comm. 12, 3920 (2021a).
- Grinenko et al. [2021b] V. Grinenko, S. Ghosh, R. Sarkar, J.-C. Orain, A. Nikitin, M. Elender, D. Das, Z. Guguchia, F. Brückner, M. E. Barber, J. Park, N. Kikugawa, D. A. Sokolov, J. Bobowski, T. Miyoshi, Y. Maeno, A. P. Mackenzie, H. Luetkens, C. W. Hicks, and H.-H. Klauss, Split superconducting and time-reversal symmetry-breaking transitions in Sr2RuO4 under stress, Nat. Physics 17, 748 (2021b).
- Huddart et al. [2021] B. Huddart, I. Onuorah, M. Isah, P. Bonfa,́ S. Blundell, S. Clark, R. De Renzi, and T. Lancaster, Intrinsic nature of spontaneous magnetic fields in superconductors with time-reversal symmetry breaking, Phys. Rev. Lett. 127, 237002 (2021).
- Bergemann et al. [2003] C. Bergemann, A. P. Mackenzie, S. R. Julian, D. Forsythe, and E. Ohmichi, Quasi-two-dimensional fermi liquid properties of the unconventional superconductor Sr2RuO4, Advances in Physics 52, 639 (2003).
- Suh et al. [2020] H.-G. Suh, H. Menke, P. M. R. Brydon, C. Timm, A. Ramires, and D. F. Agterberg, Stabilizing even-parity chiral superconductivity in Sr2RuO4, Phys. Rev. Res. 2, 032023(R) (2020).
- Clepkens et al. [2021] J. Clepkens, A. W. Lindquist, and H.-Y. Kee, Shadowed triplet pairings in hund’s metals with spin-orbit coupling, Phys. Rev. Res. 3, 013001 (2021).
- Gingras et al. [2019] O. Gingras, R. Nourafkan, A.-M. S. Tremblay, and M. Côté, Superconducting symmetries of Sr2RuO4 from first-principles electronic structure, Phys. Rev. Lett. 123, 217005 (2019).
- Käser et al. [2022] S. Käser, H. U. Strand, N. Wentzell, A. Georges, O. Parcollet, and P. Hansmann, Interorbital singlet pairing in Sr2RuO4: a hund’s superconductor, Phys. Rev. B 105, 155101 (2022).
- Beck et al. [2021] S. Beck, A. Hampel, M. Zingl, C. Timm, and A. Ramires, The effects of strain in multi-orbital superconductors: the case of Sr2RuO4, arXiv preprint arXiv:2111.13506 (2021).
- Rømer et al. [2022] A. T. Rømer, T. A. Maier, A. Kreisel, P. J. Hirschfeld, and B. M. Andersen, Leading superconducting instabilities in three-dimensional models for Sr2RuO4, Phys. Rev. Research 4, 033011 (2022).
- Li et al. [2021] Y.-S. Li, N. Kikugawa, D. A. Sokolov, F. Jerzembeck, A. S. Gibbs, Y. Maeno, C. W. Hicks, J. Schmalian, M. Nicklas, and A. P. Mackenzie, High-sensitivity heat-capacity measurements on Sr2RuO4 under uniaxial pressure, Proc. Nat. Acad. Sci. USA 118, e2020492118 (2021).
- Li et al. [2022] Y.-S. Li, M. Garst, J. Schmalian, S. Ghosh, N. Kikugawa, D. A. Sokolov, C. W. Hicks, F. Jerzembeck, M. S. Ikeda, Z. Hu, B. J. Ramshaw, A. W. Rost, M. Nicklas, and A. P. Mackenzie, Elastocaloric determination of the phase diagram of Sr2RuO4, Nature 607, 276–280 (2022).
- Rømer et al. [2019] A. T. Rømer, D. D. Scherer, I. M. Eremin, P. J. Hirschfeld, and B. M. Andersen, Knight shift and leading superconducting instability from spin fluctuations in Sr2RuO4, Phys. Rev. Lett. 123, 247001 (2019).
- Rømer et al. [2021] A. T. Rømer, P. J. Hirschfeld, and B. M. Andersen, Superconducting state of Sr2RuO4 in the presence of longer-range coulomb interactions, Phys. Rev. B 104, 064507 (2021).
- Kivelson et al. [2020] S. A. Kivelson, A. C. Yuan, B. Ramshaw, and R. Thomale, A proposal for reconciling diverse experiments on the superconducting state in Sr2RuO4, npj Quantum Materials 5, 43 (2020).
- Wagner et al. [2021] G. Wagner, H. S. Røising, F. Flicker, and S. H. Simon, A microscopic ginzburg-landau theory and singlet ordering in Sr2RuO4, Phys. Rev. B 104, 134506 (2021).
- Willa et al. [2021] R. Willa, M. Hecker, R. M. Fernandes, and J. Schmalian, Inhomogeneous time-reversal symmetry breaking in Sr2RuO4, Phys. Rev. B 104, 024511 (2021).
- Hicks et al. [2014] C. W. Hicks, D. O. Brodsky, E. A. Yelland, A. S. Gibbs, J. A. N. Bruin, M. E. Barber, S. D. Edkins, K. Nishimura, S. Yonezawa, Y. Maeno, and M. A. P., Strong increase of tc of Sr2RuO4 under both tensile and compressive strain, Science 344, 283 (2014).
- Ghosh et al. [2021] S. Ghosh, A. Shekhter, F. Jerzembeck, N. Kikugawa, D. A. Sokolov, M. Brando, A. P. Mackenzie, C. W. Hicks, and B. J. Ramshaw, Thermodynamic evidence for a two-component superconducting order parameter in Sr2RuO4, Nat. Physics 17, 199 (2021).
- Bobowski et al. [2019] J. S. Bobowski, N. Kikugawa, T. Miyoshi, H. Suwa, H.-S. Xu, S. Yonezawa, D. A. Sokolov, A. P. Mackenzie, and Y. Maeno, Improved single-crystal growth of Sr2RuO4, Condens. Matter. 4, 6 (2019).
- Ghosh et al. [2020] S. Ghosh, F. Bruc̈kner, A. Nikitin, V. Grinenko, M. Elender, A. P. Mackenzie, H. Luetkens, H.-H. Klauss, and C. W. Hicks, Piezoelectric-driven uniaxial pressure cell for muon spin relaxation and neutron scattering experiments, Review of Scientific Instruments 91, 103902 (2020).
- Ghosh [2021] S. Ghosh, Manipulation of time reversal symmetry breaking superconductivity in Sr2RuO4 by uniaxial pressure, Technische Universität Dresden (2021).
- Kikugawa et al. [2004] N. Kikugawa, A. P. Mackenzie, C. Bergemann, R. A. Borzi, S. A. Grigera, and Y. Maeno, Rigid-band shift of the fermi level in the strongly correlated metal: Sr2-yLayRuO4, Phys. Rev. B 70, 060508(R) (2004).
- Benhabib et al. [2021] S. Benhabib, C. Lupien, I. Paul, L. Berges, M. Dion, M. Nardone, A. Zitouni, Z. Q. Mao, Y. Maeno, A. Georges, L. Taillefer, and C. Proust, Ultrasound evidence for a two-component superconducting order parameter in Sr2RuO4, Nature physics 17, 194 (2021).
- Røising et al. [2022] H. S. Røising, G. Wagner, M. Roig, A. T. Rømer, and B. M. Andersen, Heat capacity double transitions in time-reversal symmetry broken superconductors, Phys. Rev. B 106, 174518 (2022).
- Jerzembeck et al. [2022] F. Jerzembeck, H. S. Røising, A. Steppke, H. Rosner, D. A. Sokolov, N. Kikugawa, T. Scaffidi, S. H. Simon, A. P. Mackenzie, and C. W. Hicks, The superconductivity of Sr2RuO4 under -axis uniaxial stress, Nat Commun 13, 4596 (2022).