Competition between self-assembly and phase separation governs high-temperature condensation of a DNA liquid
Abstract
In many biopolymer solutions, attractive interactions that stabilize finite-sized clusters at low concentrations also promote phase separation at high concentrations. Here we study a model biopolymer system that exhibits the opposite behavior: Self-assembly of DNA oligonucleotides into finite-sized, stoichiometric clusters, known as “DNA nanostars”, tends to inhibit phase separation of the oligonucleotides at high temperatures. We use microfluidics-based experiments to map the phase behavior of DNA nanostars at high concentrations of divalent cations, revealing a novel phase transition in which the oligonucleotides condense upon increasing temperature. We then show that a theoretical model of competition between self-assembly and phase separation quantitatively predicts changes in experimental phase diagrams arising from DNA sequence perturbations. Our results point to a general mechanism by which self-assembly shapes phase boundaries in complex biopolymer solutions.
Biopolymers can assemble into higher-order structures via a wide variety of mechanisms, including aggregation [1], physical gelation [2], and phase separation [3]. Given the recently recognized role of phase separation in regulating a host of biological processes in vivo [4], it is important to understand how these mechanisms influence one another, for example through coupled gelation and phase separation of prion-like domains [5] or via phase separation-accelerated assembly of pathological fibrils [6, 7], viral capsids [8, 9], and other biological structures [10, 11].
One important scenario is the interplay between liquid–liquid phase separation (LLPS) and the self-assembly of finite-sized clusters, commonly referred to as oligomers, in the dilute phase. In simple fluids, the tendency for atoms and small molecules to form clusters at low concentrations is directly related to the critical temperature for condensation [12]. This relationship, which is typically quantified using virial coefficients, has been shown to hold for molecular fluids [12], colloidal particles [13], and globular proteins [14, 15] interacting via potentials that are effectively pairwise in nature.
However, in solutions of disordered polypeptides and nucleic acids with greater conformational heterogeneity, the relationship between oligomerization and phase separation may not be as simple. Recent examples include cases in which disordered polypeptides are clustered to a greater extent in the dilute phase than anticipated on the basis of simple fluids [16, 17], as well as cases in which the formation of protein oligomers in the dilute phase tends to oppose their phase separation into ribonucleic condensates [18]. Theoretical and experimental studies have also suggested that the assembly of stoichiometric oligomers can modulate phase boundaries by hiding binding interfaces that would otherwise contribute to LLPS [19, 20, 21, 22]. However, experimental systems in which these ideas can be tested via de novo design of biopolymers and directly compared with theoretical predictions are lacking.
To address this gap, we present a model DNA-based system to systematically explore the interplay between phase separation and oligomer self-assembly. A crucial advantage of our experimental system is the ability to control the oligomer stability systematically via sequence design, enabling direct comparisons with the predictions of theoretical models. We first show that DNA solutions that self-assemble into “nanostars” [23, 24]—stoichiometric oligomers with tunable free energies of formation—can undergo a novel phase transition at high MgCl2 concentrations, in which the DNA solution condenses upon increasing temperature. We then introduce a microfluidics-based method to infer the phase boundaries of the phase-separated solution. Finally, using a combination of theory and experiment, we show that this phase behavior is a consequence of competition between nanostar self-assembly and LLPS of disassembled DNA strands. We discuss how this mechanism is distinct from that of thermosensitive polymer solutions with lower critical solution temperatures (LCSTs).
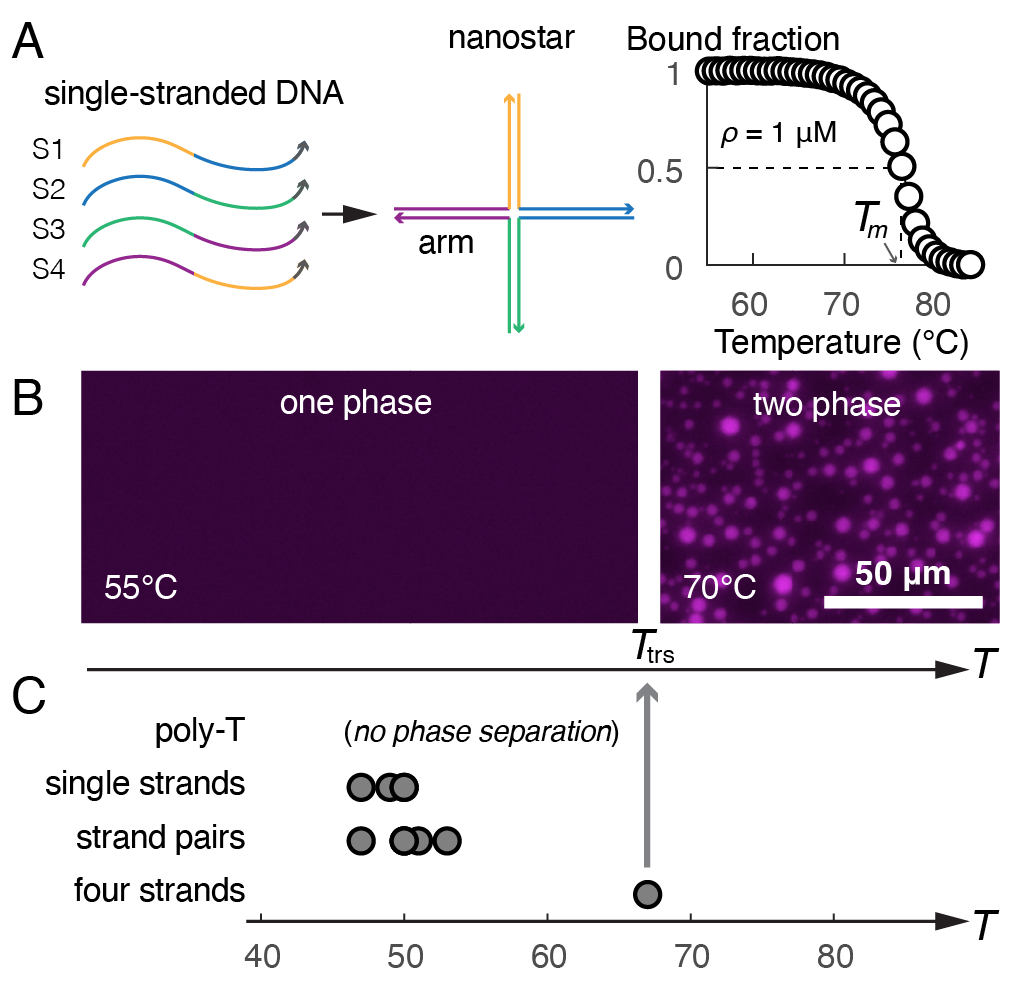
We study a mixture of four distinct DNA sequences that self-assemble into four-arm nanostars [23, 24] in a solution containing Mg2+ counter ions. Each arm consists of a 20-base-pair double helix joining two strands of the four-strand nanostar (Fig. 1a and Table S1 in the Supplementary Material [25]). In dilute solution, nanostars assemble upon cooling (Fig. 1a). Yet at higher DNA concentrations, we unexpectedly find that the solution phase-separates upon heating (Fig. 1b), leading to the formation of coexisting dense and dilute phases that are enriched and depleted in DNA, respectively. Condensation occurs at a transition temperature, , in a solution with DNA, which is near to the melting temperature, , of the nanostars in dilute solution. Importantly, this phase transition takes place consistently whether the sample is heated or cooled, indicating that we are measuring the equilibrium phase behavior of the solution [25].
To understand the determinants of this previously unreported phase transition, we vary the cations, DNA sequences, and stoichiometry of the solution. We find that condensation requires a relatively high concentration of ions ( [25]), and that exchanging for a monovalent cation prevents phase separation completely. However, the phase behavior cannot be explained solely by the counter ion identity and concentration. First, poly-T sequences of the same length remain in a single phase across the entire temperature range that we probe () (Fig. 1) [25]. This striking sequence dependence contrasts with the sequence-independent counter ion-induced condensation of higher valent polyamines like spermine and spemidine [26, 27]. The fact that in our system also implies that DNA base-pairing occurs with high probability in the temperature range where condensation occurs. These features suggest that phase separation in our system is driven by a combination of cation-dependent and base-pairing interactions. Second, we find that depends strongly on the stoichiometry of the solution. Solutions comprising either single strands (S1–S4 in Fig. 1a) or 50%-50% mixtures of strand pairs, all of which have nearly the same overall G/C content as the stoichiometric four-strand nanostar solution, phase-separate at temperatures approximately lower than the nanostar solution (Fig. 1c). These observations suggest that the phase boundary is influenced by the ability of the strands to self-assemble when mixed in stoichiometric proportion.
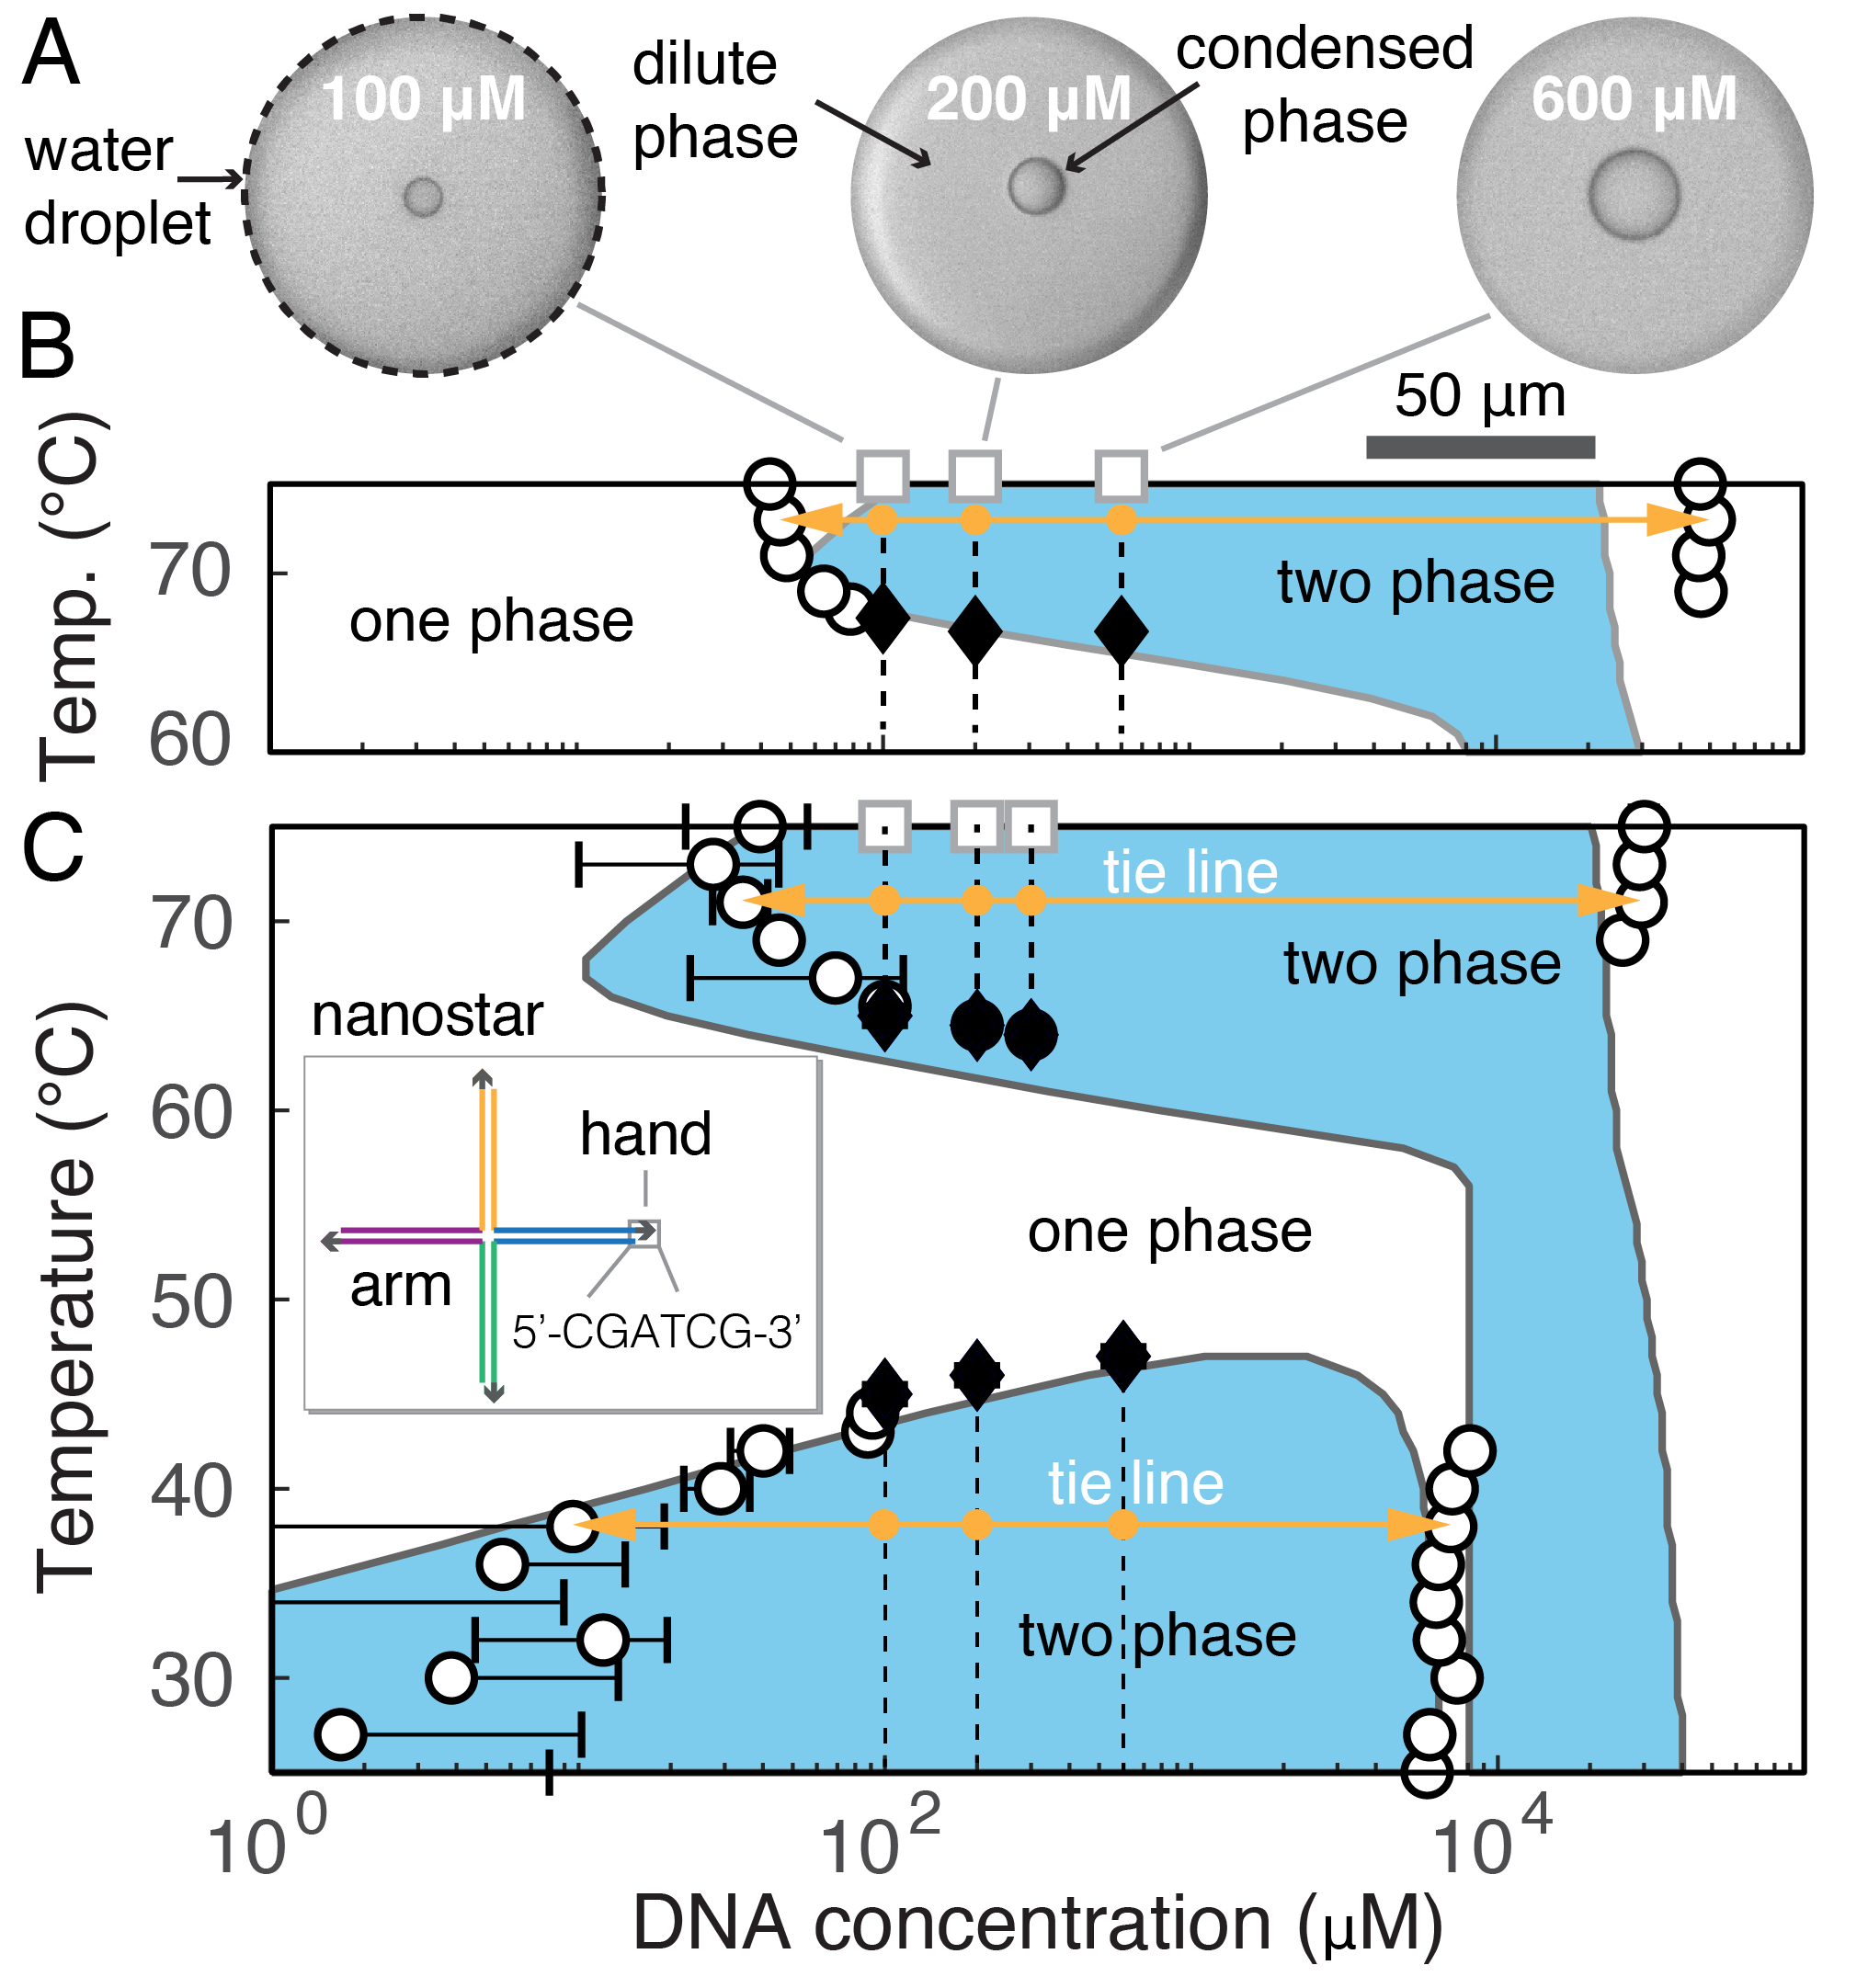
We next introduce a microfluidics-based platform to determine the concentrations of coexisting dilute and condensed phases 111While this manuscript was in preparation, a similar method for computing LLPS phase boundaries via microfluidics was reported in Ref. [45]. We create monodisperse water droplets in oil, which are filled with a user-specified concentration of DNA in 100 mM MgCl2/1xTE, and image them in a sealed capillary [29, 30]. After letting the droplets equilibrate at a given temperature, we measure the condensate and droplet volumes using image analysis to determine the condensate volume fraction [25]. At equilibrium, the condensed phase forms a single spherical droplet in an emulsion droplet of known total DNA concentration (Fig. 2a). By measuring the radii of dozens of condensed-phase droplets at three different total concentrations at the same temperature, we can infer the bulk-phase concentrations on the binodal by applying the lever rule, , where and are the unknown concentrations of the condensed and vapor phases, respectively, is the measured condensed-phase volume fraction, and is the total DNA concentration in the emulsion droplet. In practice, we find that the condensed-phase volume fractions in the phase-separated regions are not linear functions of the total DNA concentration [25], as expected for a single-component solution. We hypothesize that this non-linearity is a consequence of length polydispersity arising from a combination of prematurely truncated DNA strands and imperfectly assembled nanostars [23]. We therefore account for the known strand-length polydispersity in our system [25] to infer the complete binodals (circles in Fig. 2b). We also directly observe the transition temperatures at which each total concentration intersects the dilute arm of the binodal (diamonds in Fig. 2b). In this way, we can map the complete phase diagram of the four-strand mixture.
We further validate our microfluidics-based method by mapping the complete phase diagram of the well-studied variety of nanostars with self-complementary “hand-shaking” sequences (Fig. 2c). In this system, a 6-base palindromic hand-shaking sequence is appended to the end of each strand, resulting in a dangling end that can hybridize with another such sequence on a different assembled nanostar (inset of Fig. 2c). These hand-shaking interactions cause assembled nanostars to phase-separate below an upper critical solution temperature (UCST) of approximately 45∘C. The resulting low-temperature phase diagram is consistent with prior studies of DNA nanostar LLPS under different salt conditions [23, 24, 31], in which UCST-like phase separation has been rationalized in terms of a “patchy-particle” model of assembled nanostars as rigid, colloidal particles [32, 33]. Importantly, adding hand-shaking sequences does not measurably affect the novel high-temperature phase transition. The fact that the low and high-temperature phase transitions are essentially orthogonal to one another suggests that the high-temperature condensed phase does not comprise assembled nanostars. Consistent with this hypothesis, we find that the DNA concentration of the high-temperature condensed phase is approximately five times greater () than that of the well-studied low-temperature condensed phase of assembled nanostars () [32, 33] (Fig. 2c), suggesting that the higher-concentration condensed phase associated with high-temperature condensation resembles a polymer melt of disassembled DNA strands [34].
Taken together, our observations suggest that the high-temperature phase transition that we observe arises from a competition between nanostar assembly and LLPS of disassembled DNA strands. Specifically, we propose that a combination of base-pairing and divalent counter-ion mediated interactions provide the driving force for phase separation at high temperatures. However, lowering the temperature favors the self-assembly of discrete nanostars due to strong, complementary base-pairing interactions. Nanostar self-assembly reduces the concentration of disassembled strands that can undergo phase separation, leading to a transition from two phases to one phase at a temperature slightly below the nanostar melting temperature .
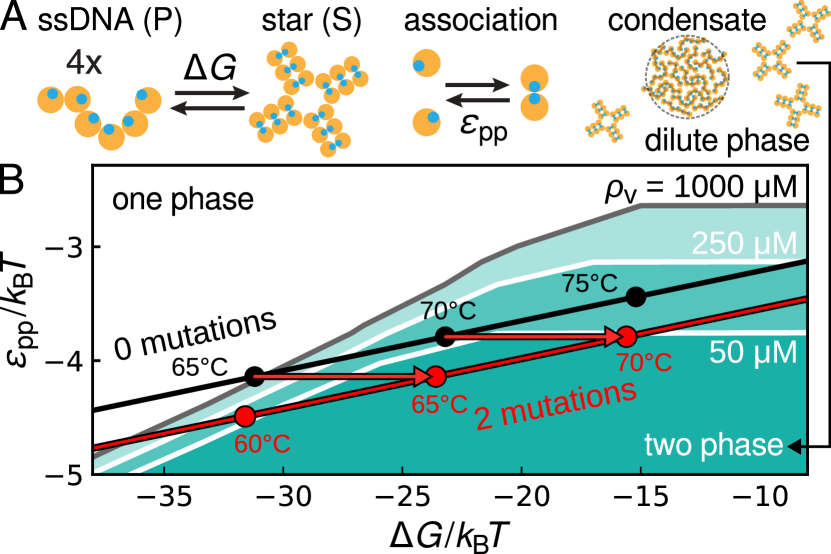
To formalize this hypothesis, we introduce a mean-field theoretical model based on statistical associating fluid theory [35] in combination with a two-state model of nanostar formation (Fig. 3a). We treat single-stranded DNA (ssDNA) as freely jointed chains of blobs, each representing an approximately 7-nucleotide-long Kuhn-segment with excluded volume [36, 37]. Each blob can associate reversibly with at most one other blob with association free energy . Nanostar self-assembly follows a two-state model,
| (1) |
where P represents a disassembled strand, S indicates an assembled nanostar, accounts for the nanostar stoichiometry, and is the free energy of nanostar formation. Eq. (1) implies that ssDNA exclusively exists in either a disassembled state or as part of a fully assembled nanostar. When in the S state, ssDNA is considered to be fully associated and is thus not allowed to engage in further interactions. Hand-shaking sequence blobs, which are included to allow us to model the UCST of assembled nanostars (Fig. 2c), are the exception to this rule when they are present in the system; see [25]. With these ingredients, we write down a mean-field free-energy density and calculate phase coexistence by satisfying chemical equilibrium as well as equal chemical potentials and pressures among coexisting phases [38]. As anticipated, this model predicts that the high-temperature phase boundary is primarily determined by the parameters and in nanostar solutions both with and without hand-shaking sequences. We therefore summarize the predicted high-temperature phase behavior in Fig. 3b, which shows whether a solution with a prescribed total DNA concentration forms one or two phases as a function of and . (See [38] for a detailed description of this modeling approach).
We next determine how the interaction parameters depend on temperature in a particular DNA system. Since these parameters derive from the same base-pairing and counter-ion-dependent interactions, we assume that and are linearly related, such that represents a sum of associative interactions and a temperature-independent entropic penalty for nanostar formation. Moreover, both of these free energies are expected to be approximately linear functions of temperature [39]. Within these physically motivated assumptions, we find that our model can reproduce the high-temperature binodal (Fig. 2b,c) while also predicting satisfactory agreement with the nanostar in dilute solution. The resulting temperature-dependence of and (black curve in Fig. 3b) is also compatible with the hybridization free-energy predictions of NUPACK [40]. Finally, we determine the hand-shaking interaction parameter from NUPACK to predict the UCST in systems with hand-shaking sequences (Fig. 2c). (See [25] for a detailed analysis of our parameterization approach.)
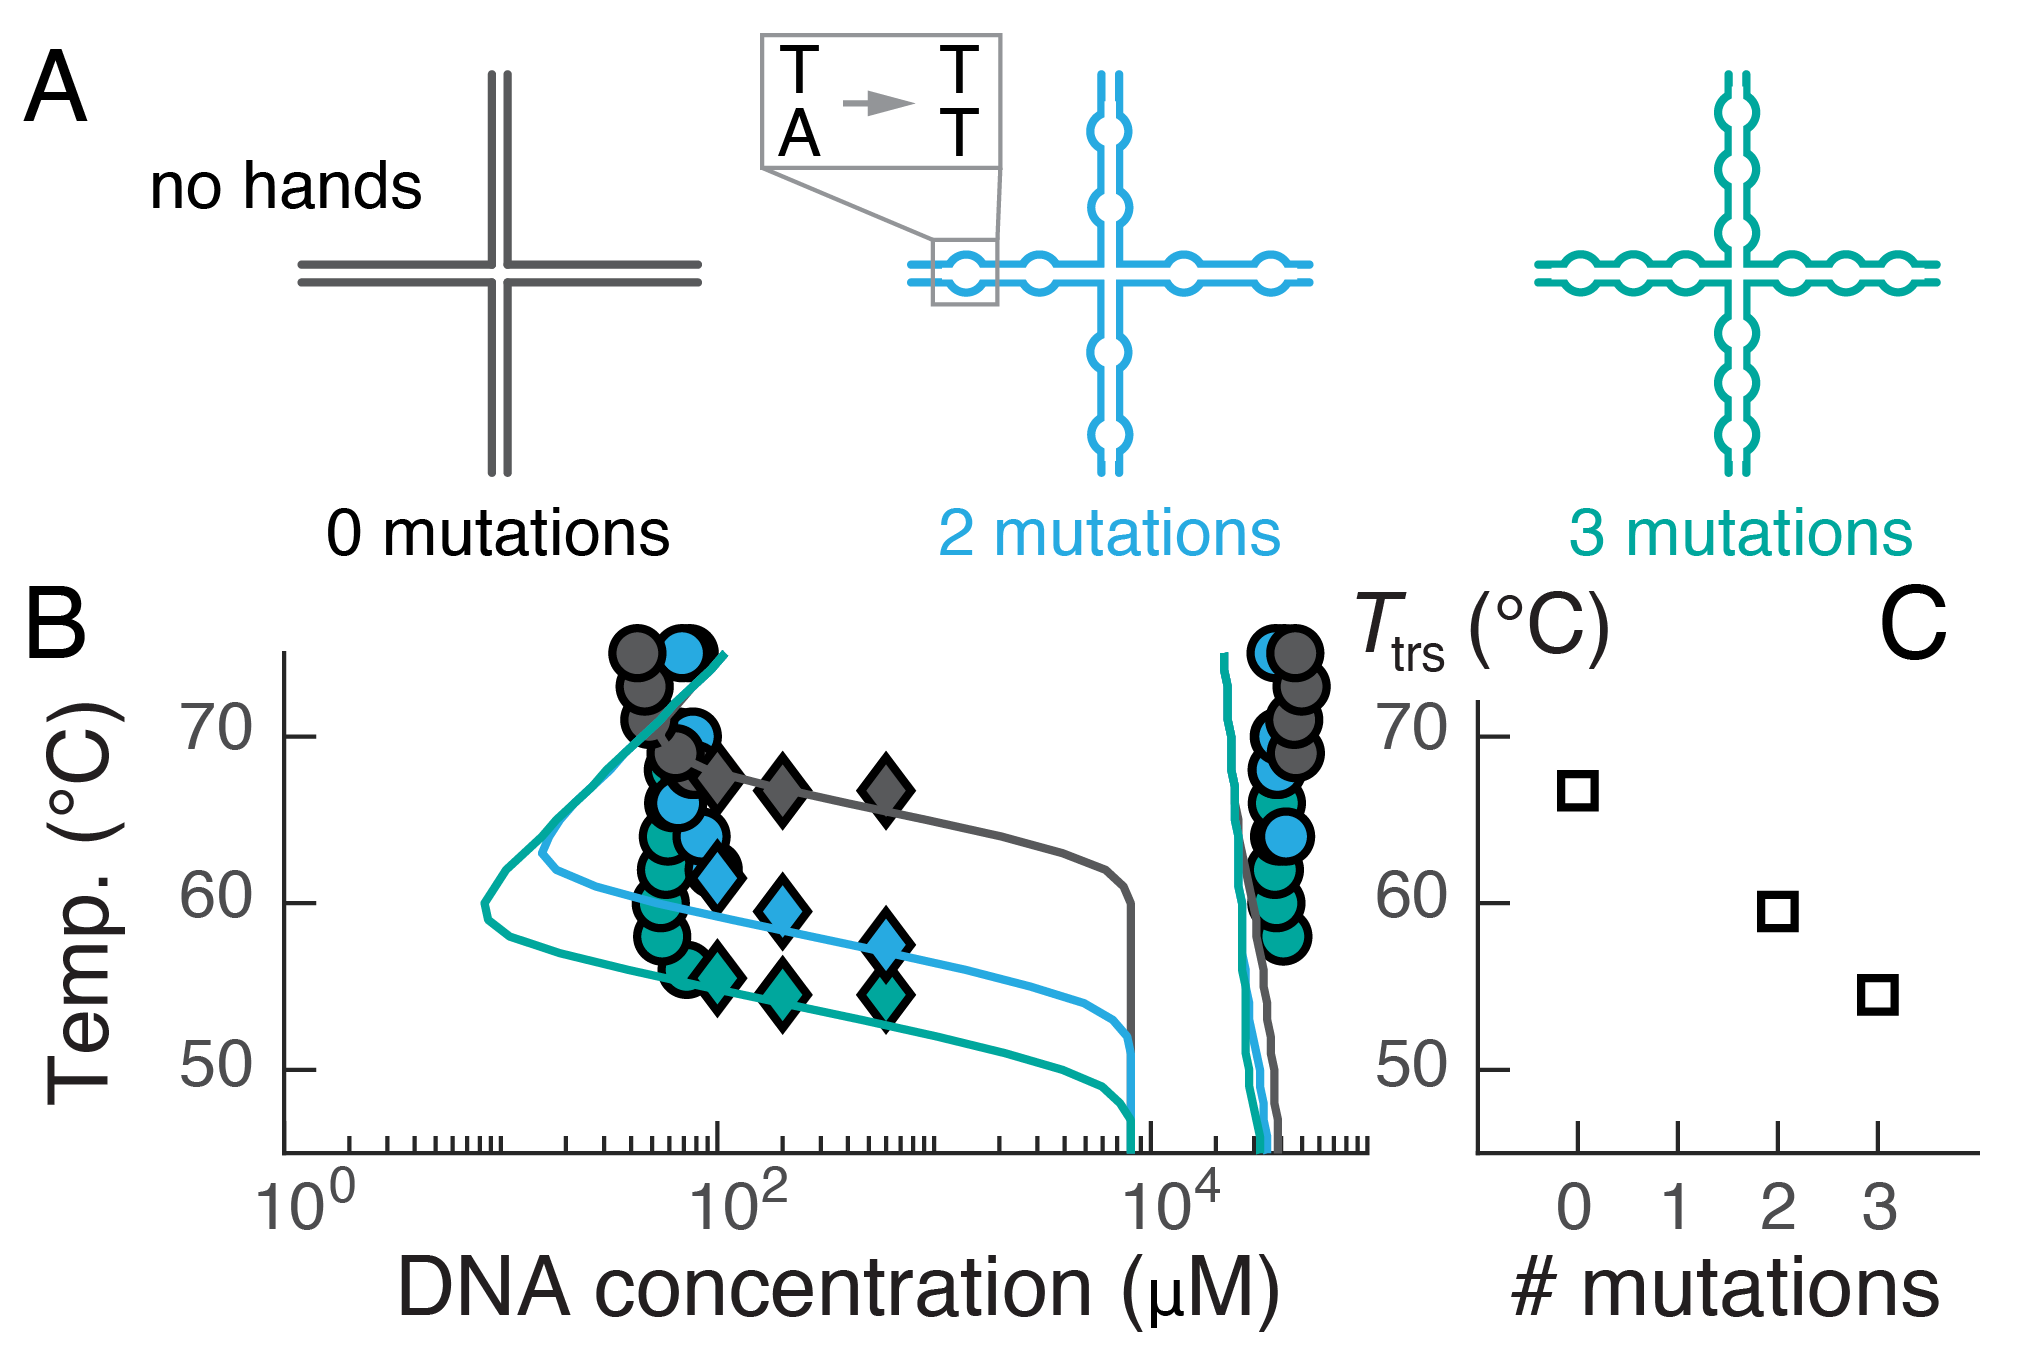
To test the predictive capabilities of our model, we exploit our ability to tune the nanostar stability via sequence design. We systematically destabilize nanostars (without hand-shaking sequences) by introducing point mutations into the arms, which lead to “bulges” [39] when assembled (Fig. 4a). increases linearly with the number of mutations per arm, ,
| (2) |
where the free-energy penalty per mutation is [25]. Importantly, these mutations do not affect the G/C content of the sequences, and thus have a negligible effect on the associative interactions, , between ssDNA blobs. As a result, the temperature-parameterization curve, , of mutated nanostars is shifted to the right (red arrows) in Fig. 3b. We therefore predict that the transition temperatures for high-temperature phase separation will be systematically shifted as well.
Mapping the phase diagrams of these nanostar variants using our microfluidics-based platform reveals good agreement with the predictions of our theoretical model (Fig. 4b). We obtain additional theoretical insight by considering the relevant limit of stable nanostars (; Fig. 3a), which leads to an approximate linear relation for the phase boundary [25],
| (3) |
where is the inverse temperature, is the excluded volume of an assembled nanostar, and the polymer volume fraction in the condensed phase, , is a constant determined by . Together with Eq. (2) and the assumed linear dependence of and on temperature, Eq. (3) predicts that decreases linearly with the number of mutations, . This nontrivial prediction of our theory is validated by the experimentally measured transition temperatures (Fig. 4c), which vary by despite the minimal changes to the DNA sequences. By contrast, varying the strand lengths by a factor of two has a relatively small effect on the transition temperature, in line with the predictions of our model [25].
In summary, we have reported a novel phase transition in which a DNA solution phase-separates upon heating. Using a combination of experiments and theoretical modeling, we have demonstrated that we can control the phase boundary by tuning the stability of individual DNA nanostars, whose self-assembly opposes phase separation. Importantly, we have shown that this mechanism is extremely sensitive to the DNA sequences and stoichiometry. This sensitivity distinguishes our proposed mechanism from canonical lower critical solution temperature (LCST) behavior, in which effective attractive interactions among polymers that arise from cation and solvent entropic effects drive condensation at high temperatures [34]. While canonical LCST behavior can account for the temperature and cation-dependence of the phase boundary, it does not predict the systematic dependence of the phase boundary on G/C content-preserving point mutations (Fig. 4). A second distinguishing feature of our model is that it predicts a shift in the composition of the dilute phase from mostly ssDNA to mostly assembled nanostars as the temperature is lowered [38]; this prediction could be tested in future experiments.
In fact, our model [38] and related works [19, 41] do not predict the existence of an LCST at all when self-assembly competes with LLPS. More specifically, our model predicts that the high-temperature coexistence region extends to low temperatures at very high DNA concentrations. This feature appears because the excluded volume assigned to the nanostar is greater than that of its constituent ssDNA polymers, which is necessary to reproduce the disparate concentrations of the low-temperature (assembled nanostar-dominated) and high-temperature (disassembled strand-dominated) condensed phases when hand-shaking sequences are present (Fig. 2c). While we are unable to investigate this region of the phase diagram experimentally, and it is possible that the two-state approximation, Eq. (1), is insufficient under these conditions, this uncertainty does not affect our central results.
We expect that the mechanism that we describe here may apply more broadly in more complex systems where the formation of stable oligomers effectively conceals the attractive interactions that drive LLPS. Given numerous examples of oligomer-forming protein and RNA species identified in intracellular ribonucleic condensates [22, 42], it is conceivable that this mechanism plays a role in modulating phase behavior in vivo. We note that the ability of divalent cations to condense nucleic acids at high temperatures, with unexpectedly strong sequence-dependent effects, has been observed in RNA solutions as well [43], suggesting that similar mechanisms may be at play. Our proposed mechanism is also related to the competition between intra- and intermolecular base-pairing that gives rise to re-entrant phase behavior in RNA solutions [44], whereby strong intramolecular base-pairing reduces the concentration of strands that are available for phase separation. Overall, we anticipate that the microfluidics platform and coarse-grained modeling approach described here might generate useful insights across this broad class of biopolymer systems.
References
- Knowles et al. [2014] T. P. Knowles, M. Vendruscolo, and C. M. Dobson, Nat. Rev. Mol. Cell Biol. 15, 384 (2014).
- Jain and Vale [2017] A. Jain and R. D. Vale, Nature 546, 243 (2017).
- Shin and Brangwynne [2017] Y. Shin and C. P. Brangwynne, Science 357, eaaf4382 (2017).
- Hyman et al. [2014] A. A. Hyman, C. A. Weber, and F. Jülicher, Annu. Rev. Cell Dev. Biol. 30, 39 (2014).
- Li et al. [2012] P. Li, S. Banjade, H.-C. Cheng, S. Kim, B. Chen, L. Guo, M. Llaguno, J. V. Hollingsworth, D. S. King, S. F. Banani, et al., Nature 483, 336 (2012).
- Lipiński et al. [2022] W. P. Lipiński, B. S. Visser, I. Robu, M. A. Fakhree, S. Lindhoud, M. M. Claessens, and E. Spruijt, Sci. Adv. 8, eabq6495 (2022).
- Weber et al. [2019] C. Weber, T. Michaels, and L. Mahadevan, Elife 8, e42315 (2019).
- Guseva et al. [2020] S. Guseva, S. Milles, M. R. Jensen, N. Salvi, J.-P. Kleman, D. Maurin, R. W. Ruigrok, and M. Blackledge, Sci. Adv. 6, eaaz7095 (2020).
- Hagan and Mohajerani [2023] M. F. Hagan and F. Mohajerani, PLoS Comput. Biol. 19, e1010652 (2023).
- McDonald et al. [2020] N. A. McDonald, R. D. Fetter, and K. Shen, Nature 588, 454 (2020).
- McCall et al. [2018] P. M. McCall, S. Srivastava, S. L. Perry, D. R. Kovar, M. L. Gardel, and M. V. Tirrell, Biophys. J. 114, 1636 (2018).
- McQuarrie [1976] D. A. McQuarrie, Statistical Mechanics (Harper Collins, New York, 1976).
- Vliegenthart and Lekkerkerker [2000] G. Vliegenthart and H. N. Lekkerkerker, J. Chem. Phys. 112, 5364 (2000).
- Thomson et al. [1987] J. A. Thomson, P. Schurtenberger, G. M. Thurston, and G. B. Benedek, Proc. Natl. Acad. Sci. U.S.A. 84, 7079 (1987).
- Neal et al. [1998] B. Neal, D. Asthagiri, and A. Lenhoff, Biophys. J. 75, 2469 (1998).
- Kar et al. [2022] M. Kar, F. Dar, T. Welsh, L. Vogel, R. Kuhnemuth, A. Majumdar, G. Krainer, T. Franzmann, S. Alberti, C. Seidel, et al., Proc. Natl. Acad. Sci. U.S.A. 119, e2202222119 (2022).
- Lan et al. [2022] C. Lan, J. Kim, S. Ulferts, F. Aprile-Garcia, A. Anandamurugan, R. Grosse, R. Sawarkar, A. Reinhardt, and T. Hugel, bioRxiv 10.1101/2022.08.01.502196 (2022).
- Seim et al. [2022] I. Seim, A. E. Posey, W. T. Snead, B. M. Stormo, D. Klotsa, R. V. Pappu, and A. S. Gladfelter, Proc. Natl. Acad. Sci. U.S.A. 119, e2120799119 (2022).
- Reinhardt et al. [2011] A. Reinhardt, A. J. Williamson, J. P. Doye, J. Carrete, L. M. Varela, and A. A. Louis, J. Chem. Phys. 134 (2011).
- Rovigatti et al. [2013] L. Rovigatti, J. M. Tavares, and F. Sciortino, Phys. Rev. Lett. 111, 168302 (2013).
- Jacobs et al. [2014] W. M. Jacobs, D. W. Oxtoby, and D. Frenkel, J. Chem. Phys. 140, 05B626_1 (2014).
- Sanders et al. [2020] D. W. Sanders, N. Kedersha, D. S. Lee, A. R. Strom, V. Drake, J. A. Riback, D. Bracha, J. M. Eeftens, A. Iwanicki, A. Wang, et al., Cell 181, 306 (2020).
- Biffi et al. [2013] S. Biffi, R. Cerbino, F. Bomboi, E. M. Paraboschi, R. Asselta, F. Sciortino, and T. Bellini, Proc. Natl. Acad. Sci. U.S.A. 110, 15633 (2013).
- Jeon et al. [2018] B.-j. Jeon, D. T. Nguyen, G. R. Abraham, N. Conrad, D. K. Fygenson, and O. A. Saleh, Soft Matter 14, 7009 (2018).
- [25] See the attached supplementary material.
- Braunlin et al. [1982] W. Braunlin, T. Strick, and M. Record Jr, Biopolymers 21, 1301 (1982).
- Raspaud et al. [1998] E. Raspaud, M. O. De La Cruz, J.-L. Sikorav, and F. Livolant, Biophys. J. 74, 381 (1998).
- Note [1] While this manuscript was in preparation, a similar method for computing LLPS phase boundaries via microfluidics was reported in Ref. [45].
- Mcdonald et al. [2000] J. C. Mcdonald, D. C. Duffy, J. R. Anderson, D. T. Chiu, H. Wu, O. J. Schueller, and G. M. Whitesides, Electrophoresis 21, 27 (2000).
- Hensley et al. [2022] A. Hensley, W. M. Jacobs, and W. B. Rogers, Proc. Natl. Acad. Sci. U.S.A. 119, e2114050118 (2022).
- Conrad et al. [2022] N. Conrad, G. Chang, D. K. Fygenson, and O. A. Saleh, J. Chem. Phys. 157, 234203 (2022).
- Rovigatti et al. [2014] L. Rovigatti, F. Bomboi, and F. Sciortino, J. Chem. Phys. 140, 154903 (2014).
- Locatelli et al. [2017] E. Locatelli, P. H. Handle, C. N. Likos, F. Sciortino, and L. Rovigatti, ACS Nano 11, 2094 (2017).
- Rubinstein and Colby [2003] M. Rubinstein and R. H. Colby, Polymer Physics (Oxford University Press, New York, 2003).
- Chapman et al. [1989] W. Chapman, K. Gubbins, G. Jackson, and M. Radosz, Fluid Ph. Equilibria 52, 31 (1989).
- Chi et al. [2013] Q. Chi, G. Wang, and J. Jiang, Phys. A: Stat. Mech. Appl. 392, 1072 (2013).
- Murphy et al. [2004] M. Murphy, I. Rasnik, W. Cheng, T. M. Lohman, and T. Ha, Biophys. J. 86, 2530 (2004).
- Li et al. [2023] T. Li, W. B. Rogers, and W. M. Jacobs, arXiv preprint arXiv:2306.13198 (2023).
- SantaLucia Jr [1998] J. SantaLucia Jr, Proc. Natl. Acad. Sci. U.S.A. 95, 1460 (1998).
- Fornace et al. [2020] M. E. Fornace, N. J. Porubsky, and N. A. Pierce, ACS Synth. Biol. 9, 2665 (2020).
- Bartolucci et al. [2021] G. Bartolucci, O. Adame-Arana, X. Zhao, and C. A. Weber, Biophys. J. 120, 4682 (2021).
- Guillén-Boixet et al. [2020] J. Guillén-Boixet, A. Kopach, A. S. Holehouse, S. Wittmann, M. Jahnel, R. Schlüßler, K. Kim, I. R. Trussina, J. Wang, D. Mateju, et al., Cell 181, 346 (2020).
- Wadsworth et al. [2022] G. M. Wadsworth, W. J. Zahurancik, X. Zeng, P. Pullara, L. B. Lai, V. Sidharthan, R. V. Pappu, V. Gopalan, and P. R. Banerjee, bioRxiv 10.1101/2022.10.17.512593 (2022).
- Kimchi et al. [2023] O. Kimchi, E. M. King, and M. P. Brenner, Nat. Commun. 14, 332 (2023).
- Villois et al. [2022] A. Villois, U. Capasso Palmiero, P. Mathur, G. Perone, T. Schneider, L. Li, M. Salvalaglio, A. deMello, S. Stavrakis, and P. Arosio, Small 18, 2202606 (2022).