Takeout and Delivery: Erasing the Dusty Signature of Late-stage Terrestrial Planet Formation
Abstract
The formation of planets like Earth is expected to conclude with a series of late-stage giant impacts that generate warm dusty debris, the most anticipated visible signpost of terrestrial planet formation in progress. While there is now evidence that Earth-sized terrestrial planets orbit a significant fraction of solar-type stars, the anticipated dusty debris signature of their formation is rarely detected. Here we discuss several ways in which our current ideas about terrestrial planet formation imply transport mechanisms capable of erasing the anticipated debris signature. A tenuous gas disk may be regenerated via “takeout” (i.e., the liberation of planetary atmospheres in giant impacts) or “delivery” (i.e., by asteroids and comets flung into the terrestrial planet region) at a level sufficient to remove the warm debris. The powerful stellar wind from a young star can also act, its delivered wind momentum producing a drag that removes warm debris. If such processes are efficient, terrestrial planets may assemble inconspicuously, with little publicity and hoopla accompanying their birth. Alternatively, the rarity of warm excesses may imply that terrestrial planets typically form very early, emerging fully formed from the nebular phase without undergoing late-stage giant impacts. In either case, the observable signposts of terrestrial planet formation appear more challenging to detect than previously assumed. We discuss observational tests of these ideas.
1 Introduction
The “classical” picture of terrestrial planet formation begins with the formation of km-sized or larger planetesimals within a primordial gaseous disk around a solar-type star (e.g., Lissauer, 1987; Wetherill & Stewart, 1993; Weidenschilling et al., 1997; Chambers & Wetherill, 1998; Goldreich et al., 2004; Kenyon & Bromley, 2006; Raymond et al., 2014). The planetesimals collide and merge into lunar- to Mars-sized protoplanets, which interact gravitationally once the gaseous disk dissipates, leading to collisions, mergers, and ever-larger protoplanets (e.g., Iwasaki et al., 2001, 2002; Kominami & Ida, 2002, 2004). Over the first 50–100 Myr,“giant impacts” among the few remaining protoplanets—as in the moon-forming collision at 30–50 Myr in the Solar System (e.g., Canup et al., 2021, and references therein)—build the final set of terrestrial planets (e.g., Lammer et al., 2021). Throughout this phase, giant impacts and collisions among remaining planetesimals are expected to generate significant debris in the form of cm-sized and smaller particles. The infrared emission from this warm debris, which is expected to be bright and readily detectable, is the most anticipated visible signpost of ongoing terrestrial planet formation (e.g., Kenyon & Bromley, 2002, 2004; Raymond et al., 2011, 2012; Genda et al., 2015).
In Kenyon et al. (2016), we described how this picture leads to a current conundrum: although planets like Earth and Venus are believed to occur commonly around mature solar-type stars based on estimates from transit surveys (e.g., % occurrence rate; Petigura et al., 2013; Burke et al., 2015; Bryson et al., 2021), the warm excesses expected to accompany their formation (e.g., Kenyon & Bromley, 2004; Genda et al., 2015; Kenyon & Bromley, 2016; Kobayashi et al., 2019) are detected only rarely, in %–3% of young solar-type stars. The discrepancy can be resolved if terrestrial planets are not as common as currently estimated. Alternatively, terrestrial planet formation may work differently than we think, with planets completing their formation on much shorter timescales than in our current picture, while they are embedded in the primordial gaseous disk. A more prosaic possibility is that there are unexamined processes that remove the dusty debris signature of late-stage terrestrial planet formation.
Here we explore two possible dust removal mechanisms: gas drag and stellar wind drag. As described in Kenyon et al. (2016), if the inner regions of planetary systems evolve so that they end up possessing tenuous gas reservoirs at the epoch of final terrestrial planet assembly, at a level of of the minimum mass Solar nebula (MMSN), the gas can remove the dusty debris associated with terrestrial planet formation through a combination of aerodynamic drag and radiation pressure (see also Takeuchi & Artymowicz, 2001; Krumholz et al., 2020). A MMSN column density of 0.02 within 2 au corresponds to a gas mass of 0.01 (equivalent to 43 Earth oceans).
Several possible pathways to such tenuous gas disks emerge naturally from our current picture of terrestrial planet formation. Gaseous planetary atmospheres, primordial or secondary, might be liberated through giant impacts, the tragic loss of planetary atmospheres a boon to the removal of the planet’s formation signature. Alternatively, gas may be brought in by evaporating icy comets and asteroids that have been scattered into the terrestrial planet region. Stellar wind drag is another possible dust removal mechanism, in which dust grains in the terrestrial planet region are dragged into the central star through interactions with a high velocity stellar wind (e.g., Burns et al., 1979; Plavchan et al., 2005; Klacka, 2013; Spalding & Adams, 2020). While this mechanism is unimportant for dust around solar-type stars at Gyr ages and is weaker at large orbital distances, it can be a much more potent dust removal mechanism at the small orbital radii associated with terrestrial planet formation and at the enhanced wind mass loss rates thought to characterize young stars (ages Myr).
In Section 2, we recap the predicted dusty signature that is predicted to accompany late terrestrial planet formation and the current observational limits. We then describe the gas reservoirs that are expected to be liberated from planetary atmospheres by giant impacts (Section 3) and delivered to inner solar systems by asteroids and comets (Section 4). Section 5 describes the possible role of stellar wind drag in removing collisional debris from the terrestrial planet region. These ideas and future directions are discussed in Section 6 and summarized in Section 7.
2 Predicted IR Excesses and Observational Limits
To establish the conditions required for a detectable IR excess from solid material at 1 au, we follow Kenyon et al. (2016). Spitzer observations at 16–24 (8–12 ) are sufficient to detect solid material at = 1 au with a temperature 300 K and a fractional luminosity (), where is the thermal luminosity of the solids, is the luminosity of the central star, and is the cross-sectional area of the solids. For a given sensitivity at 16–24 , hotter (colder) dust is harder (easier) to detect (see Figure 1 of Kenyon et al., 2016).
Although 24 excesses are fairly common among nearby solar-type stars with ages of 10–100 Myr, 8–16 excesses are rare (e.g., Stauffer et al., 2005; Silverstone et al., 2006; Currie et al., 2007; Rhee et al., 2008; Dahm & Carpenter, 2009; Carpenter et al., 2009b, a; Melis et al., 2010; Stauffer et al., 2010; Chen et al., 2011; Beichman et al., 2011; Smith et al., 2011; Zuckerman et al., 2011; Luhman & Mamajek, 2012; Ribas et al., 2012; Urban et al., 2012; Zuckerman et al., 2012; Jackson & Wyatt, 2012; Kennedy & Wyatt, 2012, 2013; Ballering et al., 2013; Cloutier et al., 2014; Matthews et al., 2014; Vican & Schneider, 2014; Patel et al., 2014; Ishihara et al., 2017; Melis et al., 2021; Moór et al., 2021). As discussed in Kenyon et al. (2016), the great majority of 24 excess sources lack excess emission at shorter wavelengths, implying that they arise from cold material with a dust temperature 150 K. The high (low) frequency of cold (warm) dust from short wavelength Spitzer and WISE studies is consistent with the 25% frequency of cold excesses among solar-type stars derived from other Spitzer and Herschel programs (e.g., Bryden et al., 2009; Eiroa et al., 2013; Sibthorpe et al., 2018; Matrà et al., 2018; Najita et al., 2022, and references therein). Thus, we conclude that the warm excesses associated with solar-type stars with ages 10–100 Myr are rare.
Converting an observational limit on fractional luminosity into an estimate of the total mass of solids requires an adopted size distribution as a function of particle radius , . In a simple system, where all solids have the same binding energy and the collision velocity is just large enough to catastrophically fragment particles, (Kenyon & Bromley, 2020). The mass is then , where is the mass density of a particle and is the radius of the largest particle. Setting = 300 km, = 3 , and , the ensemble of solids has a total cross-sectional area and a total mass g 0.7 lunar masses.
Systems with a size-dependent binding energy have wavy size distributions that are somewhat steeper than (e.g., Campo Bagatin et al., 1994; O’Brien & Greenberg, 2003; Kobayashi & Tanaka, 2010; Wyatt et al., 2011). Adopting the bulk properties of basalt (Benz & Asphaug, 1999), a collision velocity large enough to catastrophically fragment 300 km planetesimals, and a collisional cascade in equilibrium from 300 km to 1 (e.g., Wyatt et al., 2011; Kenyon & Bromley, 2020), the mass is 65% smaller than estimated above: g (0.5 lunar masses). Although different choices for the bulk properties of solids and the collision velocity result in somewhat different masses, 0.2–1 lunar masses in solids is sufficient to generate the cross-sectional area, , required for material with at 1 au.
These estimates are consistent with solid mass and dust luminosity estimates derived in numerical calculations of the giant impact phase (e.g., Kenyon & Bromley, 2004; Jackson & Wyatt, 2012; Genda et al., 2015; Kenyon & Bromley, 2016; Kobayashi et al., 2019). In these simulations, collisions of lunar-mass to Mars-mass protoplanets usually generate larger merged objects and ejected fragments with radii of 100–1000 km and total masses of 1–2 lunar masses. As protoplanets grow into larger and larger planets, the fragments generate a collisional cascade with a detectable infrared excess at 16–24 and a dust luminosity, , throughout the 10–100 Myr phase of rocky planet building.
During the collisional cascade, high velocity collisions gradually grind down larger solids into smaller solids, which are ejected from the system by stellar radiation pressure (e.g., Wyatt, 2008; Kobayashi & Löhne, 2014; Matthews et al., 2014; Kenyon & Bromley, 2016; Kobayashi et al., 2019; Marino, 2022). In the standard kinetic model, the evolution time for the cascade is roughly equivalent to the time required for a collision between the two largest particles in the swarm, which depends on the distance from the central star, the radius of the largest solid involved in the cascade, and the mass in solids with radii (e.g., Wyatt & Dent, 2002; Dominik & Decin, 2003; Wyatt, 2008; Krivov et al., 2008; Kenyon & Bromley, 2017; Krivov & Wyatt, 2021). If the solids reside in an annulus with a radial width that is larger than the radial excursion of a typical solid, , where is the orbital eccentricity, the time scale to remove the largest particles in the cascade is , where is the orbital period and is the surface density of solids at a distance from the host star (e.g., Kenyon & Bromley, 2017, and references therein). In this expression, the term encodes the dependence of the time scale on the collision velocity and the binding energy of the largest solids (for other approaches, see Bottke et al. (2005), Kobayashi & Tanaka (2010), and Kennedy & Wyatt (2010)). Defining as the center-of-mass collision velocity and as the collision energy required to remove half the mass of a pair of colliding planetesimals and disperse it to infinity, is a function of the ratio (Kenyon & Bromley, 2017). When high velocity collisions just shatter the largest objects ( 8), . Factor of three larger velocities yields (see Fig. 2 of Kenyon & Bromley, 2017).
Adopting , the lifetime of the cascade is
| (1) |
As a result, the debris produced by giant impacts is expected to remain bright and observable for an extended period of time, in the absence of removal mechanisms other than collisions and stellar radiation pressure. When 0.5–3, the collision time in eq. 1 is similar to the lifetime of detectable warm dust in numerical calculations (Kenyon & Bromley, 2004; Raymond et al., 2011; Genda et al., 2015; Kenyon & Bromley, 2016). In Fig. 6 of Genda et al. (2015), the 24 flux from the debris of giant impacts equals or exceeds the flux from the central star (and the detection limit for Spitzer at 16-24 ) for 100 Myr. Although the bright pulse of emission generated in a single giant impact lasts for only a few Myr, the broad pedestal of excess emission produced by dust from the ensemble of giant impacts persists for 100 Myr. Similarly, calculations described in Kenyon & Bromley (2004, 2016) have dust luminosities for evolution times 100 Myr. The rarity of infrared excess emission detections at short wavelengths (e.g., at 16 ) demonstrates that such warm debris is rare.
3 Gas from Liberated Planetary Atmospheres
3.1 Primordial Atmospheres
Solar System formation models suggest that terrestrial planet formation was well underway during the protosolar nebular phase. Planets like Earth and Venus may have acquired a significant fraction of their mass (perhaps %) prior to the dissipation of the nebula (Walsh & Morbidelli, 2011; O’Brien et al., 2014; Raymond et al., 2014; Lammer et al., 2021), a perspective that is supported by some interpretations of meteoritic data (Boyet & Carlson, 2005; Yu & Jacobsen, 2011). Terrestrial planets that acquire a significant mass while the nebular gas disk is present are expected to capture tenuous primordial atmospheres whose mass depends on the nebular density (e.g., Rafikov, 2006). A protoplanet with mass could acquire an atmosphere that is % of the planet’s mass (Lammer et al., 2020a). A lower-mass protoplanet with 0.1–0.3 may acquire an atmosphere that is 0.01% to 1% of the planet’s mass (Ginzburg et al., 2016; Lammer et al., 2020a). These atmospheres are similar to the 0.001–0.01 needed for aerodynamic drag to remove dusty debris from the terrestrial planet region (Section 1).
As the nebula dissipates, the planetary atmosphere adjusts to the declining external pressure from the nebula and the increasing exposure to direct irradiation by the host star. Planets orbiting close to their stars are more likely than planets at larger distances to lose some or all of their primordial atmosphere before the giant impact phase commences.
Theory suggests that low mass planets ( 5–10 ) orbiting within au lose a significant fraction, perhaps all, of their atmospheres through photoevaporation (Owen & Wu, 2013; Lopez & Fortney, 2014; Jin et al., 2014; Owen & Wu, 2016, 2017; Jin & Mordasini, 2018; Mordasini, 2020; Venturini et al., 2020) or core-powered mass loss (Ginzburg et al., 2016, 2018; Gupta & Schlichting, 2019). EUV/X-ray photoevaporation is particularly efficient in reducing planetary atmospheres at orbital radii au, with the transformation occurring on a timescale 100 Myr (Owen & Wu, 2013). Core-powered mass loss operates over longer ( Gyr) timescales (Ginzburg et al., 2018). Planetesimal impacts remove atmospheres on even longer timescales. Among planets with orbital periods 30 days, observations provide strong support for the ‘radius’ or ‘evaporation’ valley predicted from these studies111For an alternative approach to the radius valley, see Lee & Connors (2021). (e.g., Fulton et al., 2017; Van Eylen et al., 2018; Fulton & Petigura, 2018; Hardegree-Ullman et al., 2020; Petigura, 2020). Better statistics for the planetary mass–radius relation at 0.2–0.6 au would test these theories in greater detail (e.g., Rogers et al., 2021).
Beyond 0.5–0.6 au, planets have a better chance of retaining their primordial atmospheres. At these larger distances, photoevaporation and core-driven mass loss are less effective (e.g., Mordasini, 2020). Planetesimal impacts—which may remove or add material to the planet’s atmosphere—then become more important (Wyatt et al., 2020; Kegerreis et al., 2020b, a). Although the relative importance of these processes among exoplanets is uncertain, abundance analyses of Venus and Earth provide some clues. Detailed models for the atmospheric evolution of Earth (Venus) conclude that protoplanets with masses exceeding 0.5–0.6 ( 0.85–0.9 ) retain their primordial atmospheres following the dissipation of the disk, while those with lower masses do not (e.g., Lammer et al., 2020a).
3.2 Secondary Atmospheres
Whether they retain any portion of their primordial atmospheres, terrestrial planets can also generate secondary atmospheres through outgassing. Recently formed terrestrial planets are expected to possess significant magma oceans, involving part or all of the silicate mantle (e.g., Urey, 1955; Elkins-Tanton, 2008; Elkins-Tanton et al., 2011; Elkins-Tanton, 2012; Lammer et al., 2018). Melting is induced by heating from multiple processes: the decay of short-lived radiogenic isotopes (e.g., 26Al; Neumann et al., 2014), the conversion of gravitational potential energy into heat when the core and mantle decouple (e.g., Rubie et al., 2015), and kinetic energy from protoplanet impacts (e.g., Tonks & Melosh, 1993; Elkins-Tanton et al., 2004; Monteux & Arkani-Hamed, 2014; Manske et al., 2021). As magma oceans solidify, they are expected to expel copious amounts of gas. Some portion of the gaseous atmosphere is then expected to be ejected in the giant impacts that build the final masses of terrestrial planets.
Estimates from the literature aimed at explaining the known properties of Solar System planets predict that a planet can outgas 70%–100% of its initial carbon and water into the atmosphere (Elkins-Tanton, 2008; Hamano et al., 2013; Erkaev et al., 2014; Lichtenegger et al., 2016; Odert et al., 2018; Massol et al., 2016; Lammer et al., 2018, and references therein). We can consider in a more general way the volatiles available to terrestrial planets as they are assembled, independent of how the assembly works in detail. The volatile budget of the solids from which planets form establishes an upper envelope for the reservoir available for a regenerated gaseous atmosphere. The water abundance of the bulk silicate Earth, 0.6%–3.6% by weight (e.g., Daly et al., 2021), lies between that of carbonaceous chondrites (2%–13% by weight; Alexander et al., 2012; Marty et al., 2016; McCubbin & Barnes, 2019; Shimizu et al., 2021; Alexander, 2022) and that of enstatite and ordinary chondrites (0.1%–0.5% by weight; Piani et al., 2018; Piani & Marrocchi, 2018; Piani et al., 2020; Bates et al., 2021; King et al., 2021).
Taking a conservative approach, if Earth formed from material that was 1% volatile by weight, and the volatiles are completely outgassed, as in some of the detailed models above, the mass of the secondary atmosphere would be similar to the gas reservoir needed to remove the debris signature (Section 1). If carbonaceous chondrite-like materials contribute significantly to the planet’s mass budget, the volatile budget could be significantly larger. Given the likely importance of inward pebble drift and pebble accretion in building terrestrial planet cores (Lammer et al., 2020a, b), it seems plausible that volatile-rich carbonaceous chondrites could contribute a significant fraction of a terrestrial planet’s mass (Alexander, 2022).
3.3 Giant Impacts
Collisions between protoplanets and planets will liberate some or all of the outgassed atmospheres (primordial and/or secondary; e.g., Ahrens, 1993; Genda & Abe, 2003; Schlichting et al., 2015; Inamdar & Schlichting, 2015; Yalinewich & Schlichting, 2019; Kegerreis et al., 2020b, a; Biersteker & Schlichting, 2019, 2021), regenerating a gaseous disk. As a concrete example, we imagine starting with a 0.5 planet that experiences 5 successive giant impacts with protoplanets, each of which has a mass 0.1 . For simplicity, we assume no primordial atmosphere and that the volatiles in the planet and protoplanets have been completely outgassed into their atmospheres. Following the discussion in Inamdar & Schlichting (2015), we assume that each impact removes the atmosphere of the impactor completely. The fraction of the planet’s atmosphere that is removed depends on the quantity , where and are the velocity and mass of the impactor, is the planet’s escape velocity, and is the planet’s mass. Assuming and the fraction of the planet’s atmosphere that is removed is as long as the mass of the planet’s atmosphere is much less than the mass of its core (Inamdar & Schlichting, 2015).
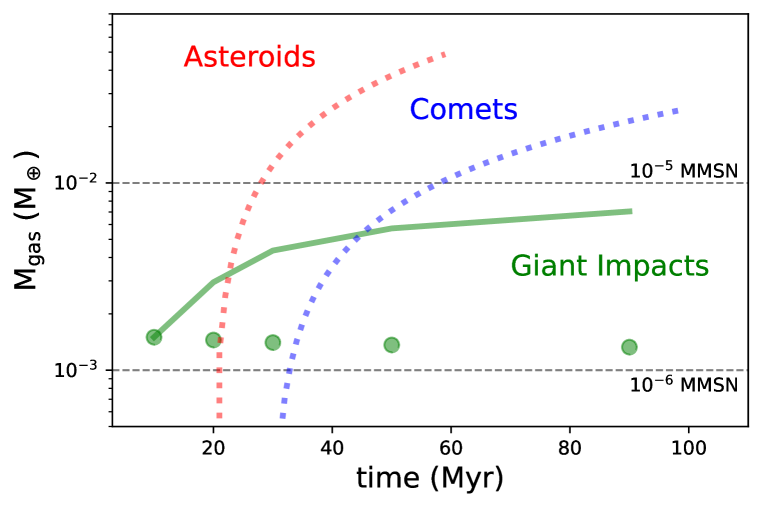
The successive collisions build up a tenuous gaseous disk. If all of the colliding bodies have a volatile fraction of 1% by mass, each giant impact contributes of gas from the impactor and to of gas lost from the planet’s atmosphere; the amount declines with successive impacts as the planet’s atmosphere is depleted. Each impact ejects of gas from the planet and impactor (Figure 1, green points), and the total gas mass liberated after 5 impacts is (Figure 1, green line). By regenerating a gaseous inner disk through outgassing and giant impacts, the gas is available exactly when needed to remove the dust signature generated by the same giant impacts.
The liberated gas is comparable to the mass needed to remove the expected debris signature (Kenyon et al., 2016). To estimate the removal time, we assume the gas extends from 0.5 au to 2–3 au, orbits the central star at the local circular velocity, and has a radial surface density distribution . The central star has a mass = 1 and luminosity = 1 . As in Kenyon et al. (2016), we combine the approaches of Weidenschilling (1977) and Takeuchi & Artymowicz (2001) and solve for the radial and azimuthal velocity of particles relative to the gas. Our approach assumes a vertical scale height , a gas temperature , and other parameters appropriate for a gaseous disk (see also Adachi et al., 1976; Kenyon & Hartmann, 1987; Chiang & Goldreich, 1997; Takeuchi & Artymowicz, 2001; Rafikov, 2004; Chiang & Youdin, 2010; Armitage, 2013; Youdin & Kenyon, 2013). Additional details are available in Appendix A.2 of Kenyon et al. (2016). Other choices for the exponents in the relations for , , and would have a modest impact on the results.
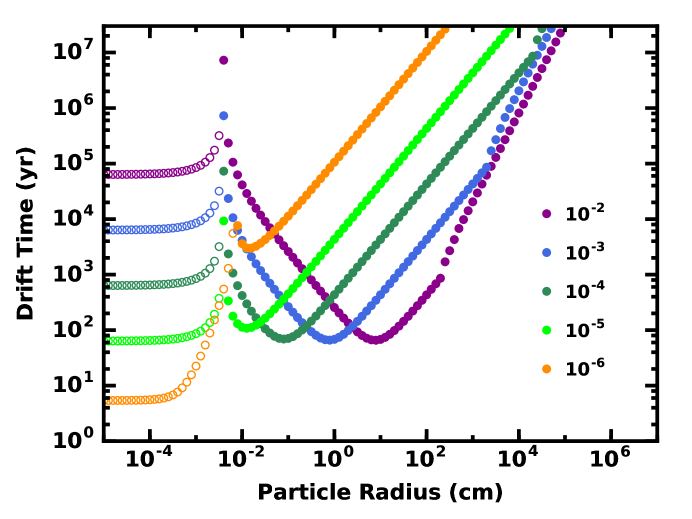
Figure 2 shows the drift time for solids of different sizes at 1 au in gaseous reservoirs with a range of masses. Larger solids drift inward toward the star under gas drag (solid symbols) while radiation pressure drives small, weakly coupled particles outward, where they become colder (open symbols). For solids that produce an IR excess (size ), the drift times are short ( yr) for gaseous reservoirs at the level of MMSN (e.g., Weidenschilling, 1977; Rafikov, 2004; Kenyon et al., 2016). Thus, for the amount of gas liberated in the first collision in the example above ( MMSN), the particles that produce an IR excess would have a drift time yr. If all of the gas liberated in each impact survives until the end of the giant impact phase, the cumulative reservoir (of or MMSN) would take years to remove the debris signature from the final impact. In either case, the accompanying debris signature would be removed on a time scale that is a small fraction of the lifetime of the giant impact phase ( Myr).
Although a rigorous assessment of the removal time requires more detailed calculations of the long-term evolution of gas liberated from planets and the associated radial drift from gas drag and radiation pressure, these estimates assume a fairly conservative volatile fraction of 1% by mass for the planet-building material. Carbonaeceous chondrites have volatile fractions that are as much as times larger (e.g., Alexander, 2022; Piani et al., 2020). If the planets and protoplanets form from more volatile rich material, the regenerated gas mass is correspondingly larger. In our model, more massive regenerated gas disks have longer radial drift times (Fig. 2); however, the drift times are still very short compared to the 100 Myr lifetime of the giant impact phase.
4 Gas Delivery by Comets and Asteroids
In contrast to the above self-reliant pathway, in which giant planet impacts contribute the volatiles needed to remove their own debris signatures, volatiles may also be delivered to the terrestrial zone by other mechanisms (e.g., Greenberg & Nolan, 1989; Morbidelli et al., 2000; Vokrouhlický & Farinella, 2000; Raymond et al., 2004; O’Brien et al., 2014). For example, volatile-rich planetesimals scattered from beyond several au into the terrestrial zone may outgas and/or evaporate, and occasionally bombard terrestrial planets. While this mechanism is often invoked to transport water and organic molecules to terrestrial planet surfaces, the difficulty of hitting a planet implies that if this mechanism is successful, a much larger reservoir of volatiles is delivered to replenish a gaseous inner disk.
Comets. Taking the Solar System as a guide, we consider a specific example scenario in which comets deliver water to Earth. The mass in comets that impact Earth is
| (2) |
where is the total mass in comets sent to the inner Solar System, is the probability that the comet will hit Earth on a single orbital passage, and is the number of times the comet orbits the inner Solar System before it is destroyed or scattered away.
The collision probability is very small. As described by Sinclair et al. (2020), comets entering the inner Solar System will generally have velocities when they reach 1 au, where is the orbital velocity of the Earth (see also Schlichting et al., 2012; O’Brien et al., 2018; Brunini & López, 2018; Martin & Livio, 2021). The velocity of the comet relative to Earth is depending on whether the comet encounters Earth at pericenter or far from pericenter. These relative velocities correspond to an effective area for capture of where is the physical cross-sectional area of Earth (), and is its escape speed. Because Earth’s escape speed is 11 , there is no significant gravitational focusing for comets, given their typical relative velocity of The Earth’s effective area is tiny compared to the size of the inner Solar System, resulting in a collision probability of .
As a result, if comets deliver some fraction of an ocean of water to Earth, they also deliver a much larger mass of volatiles to the inner Solar System. We can estimate the total mass in volatiles delivered to the inner Solar System using equation 2, the above estimate for , and an estimate for from the literature. Sinclair et al. (2020) estimate that comets deliver oceans to Earth, equivalent to a total mass if comets have a volatile fraction of . This estimate implies that the combination
| (3) |
or if That is, comets with a total mass orbit within the inner Solar System an average of times each, which is equivalent to an effective mass of of comets each making one pass through the inner Solar System.
We can estimate the volatiles lost by the orbiting bodies using Solar System comets as a guide. If each comet has a mass (in gas and dust) and outgasses of volatiles per passage, the effective mass of corresponds to comet passages that release a total of in volatiles. If each comet has the mass of Comet Halley (g in gas and dust) and outgasses g of volatiles in one passage (as estimated for comet Halley’s appearance in 1910; Hughes, 1985), the orbiting comets would release a total of 0.02 in volatiles (i.e., Earth oceans MMSN) into the inner Solar System (see also Thomas & Keller, 1991; Jewitt & Matthews, 1999; Lisse, 2002).
Similarly, we can estimate , the total mass in comets sent to the inner Solar System, by estimating from a consideration of the lifetimes of the Jupiter Family Comets (JFCs). The orbital properties of JFCs today suggest they have active lifetimes of 12,000 yr (Levison & Duncan, 1997). For a typical JFC orbital period of 6 yr, JFCs experience returns to the inner Solar System (Weissman et al., 2020, and references therein). Since comets lose 5–20 m of surface volatiles per orbit (e.g., Huebner et al., 1986; Marboeuf et al., 2016) and a Halley-like comet will lose 50% of its mass in the first 20% of these passes (Hughes, 1985), comets should strike the Earth within the first few 100 orbits to deliver most of their mass to Earth. If , , a small fraction of the original reservoir of 10–20 from which JFC comets originate.
These orbiting bodies can live as active comets for orbits, evaporating and shrinking away. If all of the evaporates and , the comets deliver in volatiles ( MMSN) to the inner Solar System, comparable to the mass needed to remove the dusty debris signature of terrestrial planet formation (Figure 1, dotted blue line). If comets contribute more than of Earth’s oceans, they would deliver even more gas into the inner Solar System. If some fraction of comets are ejected before they can fully dispense their volatiles, comets would contribute less gas.
Asteroids. In lieu of comets as the source of Earth’s water, Morbidelli et al. (2000) estimate that the asteroid belt beyond 2.5 au could have delivered more than an ocean of water to Earth (see also Vokrouhlický & Farinella, 2000). In their simulation, which assumes an initial reservoir of in asteroids located beyond 2.5 au, the formation of Jupiter disrupts the asteroids, sending some fraction inward to smaller radii. Each asteroid has a probability of of colliding with Earth. As a result, of asteroids impact Earth, delivering of water, if the asteroids have the volatile fraction of carbonaceous chondrites (10%).
The excited asteroids would deliver much more water to the inner Solar System, as can be inferred from the reported results. Figure 1 of Morbidelli et al. (2000) indicates that a fraction 10–15% of all asteroids are deflected onto orbits with perihelia au. If the asteroids maintain these orbits long enough to completely outgas their volatiles, they would deliver a total mass of in volatiles to small radii, more than that needed to remove dusty debris signatures (Figure 1, dotted red line). Their contribution to the gas budget would be reduced if the asteroids are ejected dynamically before they can evaporate or if they become inactive asteroids before releasing all of their volatiles.
Timing. While both comets and asteroids can deliver a significant mass of gas to the inner Solar System, the timing of the delivery depends on the dynamical instabilities that trigger their journey. For comets, the gas is likely to have been delivered at about the right time to sweep away the debris signature of Earth’s formation. In the Nice model, the dynamical instability involving the giant planets that led to the bombardment of the inner Solar System began sometime in the first 100 Myr (Nesvorný et al., 2018), similar to the timescale for the Moon-forming impact, i.e., the last major impact in forming the Earth (Canup et al., 2021).
For asteroids, the situation depends on how the scattering occurs. If the formation of a gas giant like Jupiter launches the asteroids (e.g., Morbidelli et al., 2000; Vokrouhlický & Farinella, 2000), the gas is likely to be delivered too early to be helpful in erasing the signature of terrestrial planet formation. Gas giant formation likely occurs at Myr, when a primordial gas disk is present, much earlier than the Moon-forming impact is thought to have occurred. The timing would work out better with asteroid belts that are instead destabilized by the formation of lower mass ice giants (e.g., Neptunes) that form and migrate on a longer timescale. The time scale for clearing an orbit is related to the local orbital period, i.e., (Tremaine, 1993; Margot, 2015), or 30 Myr for a Neptune-mass planet at 4 au.
Applicability Beyond the Solar System. While the above examples are based on scenarios for our own Solar System, similar events may have occurred in the histories of other planetary systems, given the known properties of protoplanetary disks and mature exoplanets. Firstly, the initial cometary reservoirs of other stars are likely to be similar. At Myr, T Tauri stars are surrounded by dust disks 10s of au in size with median dust masses of their stellar mass (e.g., Villenave et al., 2021; Manara et al., 2022) or 20 for a star. Both theory and the demographics of debris disks suggest that protoplanetary disks form planetesimals with modest efficiency % (e.g., Simon et al., 2016; Li et al., 2018; Abod et al., 2019; Carrera et al., 2020; Klahr & Schreiber, 2020; Gole et al., 2020; Rucska & Wadsley, 2021; Najita et al., 2022). As a result, it seems quite plausible that a large fraction of protoplanetary disks have reservoirs of in planetesimals at distances of tens of au. If giant planets are also present in these disks and undergo migration, a small fraction of these solids may eventually be delivered into the inner, terrestrial planet regions of the system.
Indeed, a large fraction of stars like the Sun are known to harbor giant planets at outer Solar System distances. Microlensing studies imply an average of 0.8 planets per star for planets at orbital distances 1–15 au (Suzuki et al., 2016; Poleski et al., 2021). Microlensing observations also point to a large population of planets in the 5–60 mass range that either orbit stars at Neptune-like or Uranus-like distances (i.e., beyond au) or are free-floating, with about 3 times as many 10 planets beyond 10 au as at 0.1–10 au (Poleski et al., 2021; Gould et al., 2022). The above results are consistent with all stars having 1–2 Neptune-mass planets at 5–30 au. Because the escape velocity of a Neptune is 20–25 and the orbital velocity at 10 au is 13 , a Neptune-mass planet is sufficient to scatter icy planetesimals into the inner planetary system. Because all stars have one or more Neptunes, this mechanism for delivering volatiles to the inner Solar System could be generic.
Models of the growth and migration of giant planets find that as they rapidly grow in mass (and migrate) during the rapid gas accretion phase, they destabilize the orbits of nearby planetesimals, which are scattered into eccentric orbits that deliver water to the inner few au of planetary systems (Raymond & Izidoro, 2017; Ronnet et al., 2018). Dynamical interactions between multiple (neighboring) giant planets would also deliver volatiles to inner planetary systems. The broad distribution of orbital eccentricity among the known exoplanets suggests that such instabilities are common in the histories of other planetary systems (Chatterjee et al., 2008; Ford & Rasio, 2008; Jurić & Tremaine, 2008). The much higher eccentricities of exoplanets compared to the Solar System planets imply that they experienced more dramatic instabilities (Raymond et al., 2010).
Thus, a tenuous gas disk can be acquired via “takeout” (i.e., the liberation of planetary atmospheres in giant impacts) or “delivery” (i.e., by asteroids and comets launched into the terrestrial planet region) at a sufficient level to remove the dusty debris signature of terrestrial planet formation. While larger solids will migrate under gas drag into the star, smaller solids will migrate to the outer edge of the gas disk ( au; Figure 2), thereby removing the warm excess signature of terrestrial planet formation. The strong stellar winds that are expected to accompany young stars offer an additional dust removal pathway via stellar wind drag.
5 Stellar Wind Drag
Throughout the giant impact phase (10–100 Myr), the local environment within the terrestrial zone is severe. Compared to the Sun, young solar-type stars have large magnetic fields ( 3–5 kG; Johns-Krull, 2007; Yang et al., 2008; Johnstone et al., 2014; Vidotto, 2021) and short rotational periods ( 2–8 days; Hartmann et al., 1986; Herbst et al., 2001, 2007; Johnstone et al., 2015; Vidotto, 2021), which power substantial mass loss rates ( ; Cohen & Drake, 2014; Ó Fionnagáin & Vidotto, 2018; Vidotto, 2021) and considerable X-ray and EUV luminosities (; ; Tu et al., 2015; Johnstone et al., 2021; Vidotto, 2021). As described by Vidotto 2021, there are few direct observations of stars in the 10–100 Myr age, although multiple lines of evidence point to the possibility of large wind mass loss rates, with a range of .
To estimate the importance of the stellar wind on small solids during the giant impact phase, we adopt typical values for young solar-type stars, a mass loss rate ( ) and a wind velocity 500 (see also Chen et al., 2005a, b, 2006). Compared to the current Sun, the wind velocity is the same, but the mass loss rate is 1000 times larger. In the absence of gas within a circumstellar disk, the stellar wind induces radial drift of small particles (e.g., Burns et al., 1979). In a frame of reference moving with an orbiting particle, radiation and the wind from the central star oppose the particle’s motion, dragging the particle inward. For a central star with 1 , the time scale for radiation (Poynting-Robertson; PR) drag on particles with bulk density = 3 is
| (4) |
For particles smaller than 1–2 , radiation pressure dominates PR drag and ejects particles from the planetary system on the local dynamical time.
For 1 and larger particles orbiting the Sun, wind drag is a factor of 5 times smaller than PR drag, (Burns et al., 1979). However, for a young star with a factor of 100–1000 times larger mass loss rate, wind drag is a factor of 100-1000 times more effective than for the Sun (e.g., see also Plavchan et al., 2005; Chen et al., 2005a, b, 2006; Spalding, 2018; Spalding & Adams, 2020). For a 1 cm particle orbiting at 1 au around a 10 Myr-old solar-type star with a mass loss rate of , the time scale for wind drag is then yr, and the wind drags micron-sized particles into the central star on a decade time scale.
In a somewhat different approach from Burns et al. (1979), Spalding (2018) and Spalding & Adams (2020) consider radial drift through a magnetic stellar wind from a rapidly-rotating young star (see also Plavchan et al., 2005, 2009; Klacka, 2013). The radial drift time scale is similar:
| (5) |
For a typical mass loss rate throughout the giant impact phase, , the drift time for a 1 cm particle at 1 au is then similar to the yr estimate from the relations in Burns et al. (1979).
For the wind to be an effective removal mechanism, particles must drift radially inward more rapidly than they collide with other particles. Within a swarm of solids undergoing a collisional cascade at 1 au during the giant impact phase, gravitational interactions and physical collisions deflect solids and spread them radially inward and outward (e.g., Goldreich & Tremaine, 1978, 1982; Hornung et al., 1985; Shu & Stewart, 1985; Stewart & Ida, 2000). Among particles with radius , physical collisions with other particles of radius completely destroy the particle; collisions with much smaller particles yield a modest amount of debris (e.g., Wyatt et al., 2007; Wyatt, 2008; Kenyon & Bromley, 2016, 2017). The time scale for physical collisions to grind solids to dust that can be removed by radiation pressure is typically smaller than the time scale for radial expansion. Thus, effective wind removal requires , where is the collision time.
To estimate an appropriate , we consider the rate of physical collisions between a particle with radius and all other particles222Although smaller particles can catastrophically fragment particles with radius , including these collisions decreases the removal time by an amount, 10% to 50%, that depends on the bulk properties of the solids and the collision velocities. To avoid additional free parameters, we avoid this complication for this first exploration of relative removal times. with radii . For any particle in the swarm, the collision rate with all other solids is , where n is the number density, is the physical cross-section, and is the relative velocity of the solids. For collisions between a particle with radius and other particles with radius , we write , where is the total number of particles with radius and is the volume. We substitute for and for an annulus of solids with width and vertical scale height at a distance from the central star. As additional approximations, , , and , where () is orbital eccentricity (inclination) and () is the angular frequency (orbital period). Finally, we adopt a standard power-law size distribution, for small particles. The required surface area of the swarm is then , where we assume that the smallest particle in the swarm has 1 , consistent with radiation pressure removing smaller particles. Setting yields a simple expression for the collision rate, . Defining the collision time as ,
| (6) |
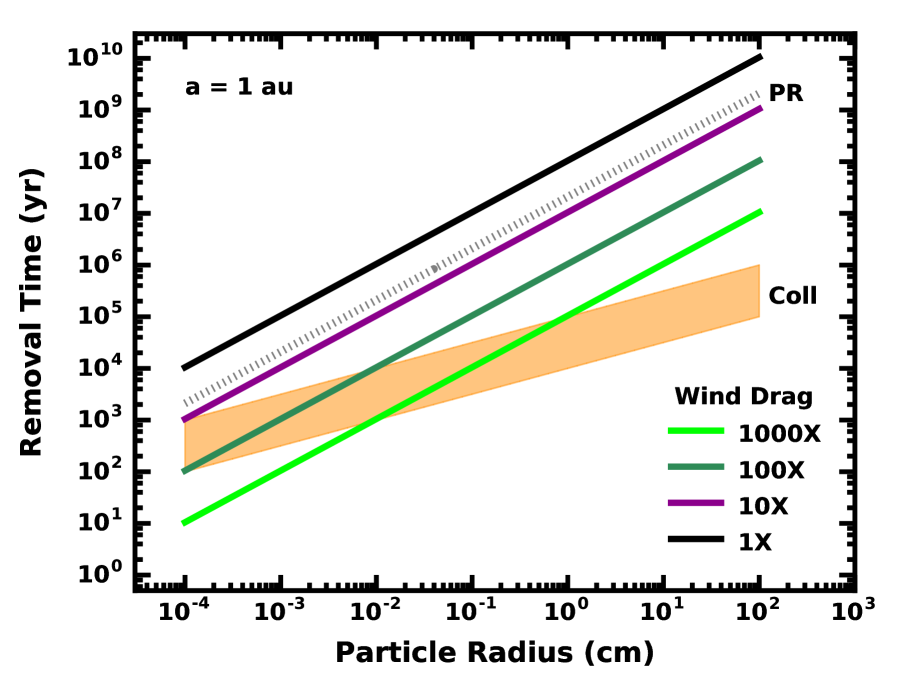
Fig. 3 illustrates the variation of and with particle radius at 1 au for = (orange band) and a range of stellar mass loss rates, 1–1000 times the current mass loss rate of the Sun (black, purple, dark green, and light green lines). As a reference, the dotted line is the PR drag time scale. Collision times for small particles in a system with are much shorter than . Poynting-Robertson drag is ineffective at removing small particles from a collisional cascade around a solar-type star with (e.g., Wyatt et al., 2011, see below). For the current Sun, the time scale for solar wind drag is roughly five times longer than (e.g., Fig. 11 of Burns et al., 1979). Thus, a wind with the current Sun’s mass loss rate cannot remove small particles from a collisional cascade. When the central star has a higher mass loss rate, , the wind is more effective at removing small particles than PR drag. However, the collision time remains shorter than the drag time for all particle sizes. As the stellar mass loss rate increases to , becomes comparable to for small particles, 1–10 . For the largest stellar mass loss rates, , the drift time scale for 1–100 particles is shorter than the collision time. At these high mass loss rates, the smallest particles drift through the wind before colliding with any other similarly-sized particle in the swarm.
If collisional cascades in the terrestrial zone generate wavy size distributions (e.g., Campo Bagatin et al., 1994; O’Brien & Greenberg, 2003; Wyatt et al., 2011; Kenyon & Bromley, 2016, 2020), then the orange band in Fig. 3 would have a wavy shape, with minima in the removal time where the size distribution has maxima. For rocky solids with the bulk properties of basalt (e.g., Benz & Asphaug, 1999), the wave amplitude is a factor of 10 at 1-100 and damps quickly at larger radii (e.g., Figs. 4–5 of Kenyon & Bromley, 2016). In Fig. 3, the removal time for collisions would then be a factor of 10 smaller at 1 , a factor of 10 larger at 10 , and roughly the same at 100 . Relative to the example in Fig. 3 with a very powerful stellar wind (1000 times the solar wind), collisions would compete with wind-induced drift for 1–3 particles. However, the wind would dominate removal at 3–100 . Deriving the size distribution of a collisional cascade in the presence of a powerful stellar wind requires a more detailed calculation that is beyond the scope of the present effort.
To estimate the impact of wind drag on the IR excess, we consider a simple model for the removal of 1-100 particles. For simplicity, we ignore the effect of a wavy size distribution. Without solar wind removal and in an equilibrium collisional cascade, the production and removal rates of small particles from collisions is = constant (e.g., Wyatt et al., 2011; Kenyon & Bromley, 2016), where () is the number (mass) of particles with radius . We adopt a wind removal rate, . Combining the two relations, . In a system with , the wind removes solids faster than the collisional cascade.
In Fig. 3 with at 100 for and a wind with , ; at 1 (1 cm), the wind mass loss rate is 10 (0.1) times the steady-state mass loss rate from the collisional cascade. With these mass loss rates from wind removal, the number density of particles at 1 , 10 , and 100 is 0.10, 0.33, and 0.5 times the number density in the equilibrium cascade. The total cross-sectional area of small particles is then a factor of 5 smaller. Using the same approach, the reduction in IR excess for a system with is a factor of 50. In a solar-type star with a large mass loss rate, radial drift from the stellar wind significantly reduces the IR excess from a collisional cascade.
While this analysis demonstrates the effectiveness of radial drift in removing an IR excess at 1 au, it is important for collisions to dominate at 10–20 au where 25% of solar-type stars are known to have bright IR excesses (e.g., Carpenter et al., 2009b; Bryden et al., 2009; Sibthorpe et al., 2018, and references therein). If solids at 10–20 au have the same physical properties as those at 1 au, the drift time scale, , grows more rapidly than the collision time scale, . Extrapolating Fig. 3 to 30–40 au, the time scales for drift and collisions are roughly equal for particles sizes 3–5 when and .
At large , the lower bulk densities of icy particles yield shorter time scales for both removal mechanisms: and . For the solar wind, observations suggest a roughly constant wind speed and a particle density (e.g., Bagenal et al., 2016; Khabarova et al., 2018). Compared to 1 au, the drift time then varies only with and : .
In a collisional cascade, two factors modify at large : (i) the sizes of the largest objects involved in the cascade and (ii) the ratio of the collision energy to the binding energy, which is encoded in (Kenyon & Bromley, 2016). At 30–40 au, collision velocities (energies) are a factor of 6 (36) smaller than at 1 au for similar orbital eccentricities. Binding energies of small solids are a factor of 20–300 smaller (e.g., Leinhardt & Stewart, 2012; Schlichting et al., 2013), which results in 0.25–1.1 (see Fig. 2 of Kenyon & Bromley, 2017). With smaller collision energies, large solids that were collisionally disrupted at 1 au are ‘safe’; only somewhat smaller particles take part in the collisional cascade, and 30–100 km instead of 300 km. With , time scales for a collisional cascade with icy particles at 30–40 au are then a factor of 3–50 times shorter than those with rocky particles. Combined with the variation of with , the collision time scales for 1 and larger icy particles at 30–40 au are always shorter than the time scales for radial drift within a stellar wind, even at the largest mass loss rates. Thus, if radial drift is important at 1 au, it should have little impact on small solids at much larger , consistent with the more common appearance of IR excesses at larger orbital distances.
6 Discussion
As described in the previous sections, the warm dusty debris signature that is expected to accompany the formation of terrestrial planets may not be robust. Processes that are central to our current picture of the assembly and evolution of terrestrial planets—early planetary atmospheres and giant impacts (Section 3), water delivery by asteroids and comets (Section 4)—can potentially regenerate a tenuous gaseous disk that removes the dusty debris via gas drag. In addition, drag from the strong stellar winds expected from young stars (10-100 Myr old) can also efficiently remove dusty debris (Section 5).
These processes may help account for the puzzling rarity of warm debris signatures at the expected epoch of terrestrial planet formation, despite the % inferred occurrence rate of terrestrial planets orbiting mature solar-type stars. Because the strengths of gas drag and stellar wind drag are expected to vary from system to system—stellar wind drag depends on the wind mass loss rate, which can vary widely, and gas drag depends on how much of a gas disk is regenerated—the small fraction of systems with a detectable excess may simply reflect the fraction in which these mechanisms do not operate efficiently, i.e., they have weak stellar winds or did not regenerate a significant gas disk.
6.1 Photoevaporative Disk Wind
While our simple estimates point to the potential impact of gas drag and stellar wind drag on debris signatures, understanding their true impact requires detailed modeling that takes into account additional processes. In particular, a photoevaporative disk wind driven by stellar X-ray and UV (XUV) irradiation (e.g., Ercolano & Pascucci, 2017; Nakatani et al., 2018a, b) may deplete a regenerated gas disk, reducing its effectiveness. Developed to understand the evolution of much younger T Tauri stars surrounded by high-mass hydrogen-rich disks, the theories generally predict winds driven from distances beyond a few au. Irradiation heats the disk surface to a temperature , and the atmosphere becomes unbound beyond the gravitational radius
| (7) |
where is the sound speed, and the mean particle weight where is the mass of hydrogen, and the correction factor is (Liffman, 2003). Thus, gas in the terrestrial planet region is more tightly bound, and more difficult to remove photoevaporatively, than gas at larger distances. In addition, both high gas temperatures ( K) and low mean particle weights () are needed to remove gas from the terrestrial planet region. Such high temperatures typically require EUV irradiation, in contrast to the K temperatures more typical of FUV irradiated disks (e.g., Gorti et al., 2009). Low mean particle weights would be characteristic of hydrogen-rich gas but not gas rich in water vapor.
The impact of disk winds on a regenerated gas disk is difficult to estimate, because empirical wind mass loss rates are poorly known for stars of any age, and the predictions of disk wind theories are generally unverified observationally. In addition, because they depend on XUV fluxes, photoevaporative disk wind mass loss rates are also likely to vary greatly even among stars of similar age. Approximately solar-mass stars in the age range 10-100 Myr are estimated to have XUV fluxes that range from T Tauri luminosities to values times lower ( erg s-1), a consequence of both age and differing initial stellar rotation rates (Tu et al., 2015).
Nevertheless, we can explore a few possibilities. For example, in the study by Picogna et al. (2019), which explored photoevaporative disk wind mass loss rate as a function of X-ray luminosity, the total mass loss rate, integrated over all disk radii, is for erg s-1. Although most of the mass loss will occur at (eq. 7) and beyond, if % of the total mass loss originates within 1 au, it would take years to remove 0.001 of gas from the inner au, a short interval compared to the drift removal time for the dust (Figure 2). If the mass loss rate is 10 times lower, the drift rate is comparable to the gas removal time, and the gas released in giant impacts could plausibly persist long enough to remove the debris signature from a given giant impact.
Importantly, these models assume a hydrogen-rich gas disk, whereas regenerated gas disks may be greatly enhanced in elements heavier than hydrogen, with a corresponding increase in and . For example, if the gas disk originates as water vapor that is subsequently dissociated, and au if and K. A metal-rich composition will also affect the cooling of the gas, with lower temperatures increasing . Larger values of will better shield the terrestrial planet region from photoevaporation and extend the time available to remove the warm excess. Models tuned to the conditions in regenerated disks surrounding 10–100 Myr old stars would be very welcome.
Thus, although there are many uncertainties, it seems plausible that photoevaporative disk winds could compromise gas drag as a dust removal mechanism at high Luckily, if stellar XUV is efficient in reducing the effect of gas drag, the stellar wind associated with the same XUV activity can potentially step in to remove dusty debris via stellar wind drag. Given the multiple processes that are potentially involved, the range in as a function of age and initial conditions, and the timing of terrestrial planet formation, more detailed calculations are needed to understand which processes dominate under what conditions, and the circumstances under which dust removal, by gas drag and stellar wind drag, is effective.
6.2 Quick and/or Neat?
The above discussion illustrates how gas drag and stellar wind drag can potentially act to remove the expected dusty signature from giant impacts and account for the surprising lack of warm excesses that are expected to characterize late-stage terrestrial planet formation. If processes like these are effective, terrestrial planets may form in the traditional way, via giant impacts, but leave little observational trace of these events (a tidy or “neat” planet formation scenario).
An alternative interpretation of the rarity of warm excesses is that terrestrial planets emerge fully formed from the nebular phase and only rarely undergo late-stage giant impacts (a “quick” formation scenario). Possible motivation for the latter scenario comes from the bimodal size distribution of close in planets (the radius valley at au), which is interpreted as evidence that planets are commonly born with gaseous envelopes that are eroded by stellar irradiation and core-powered mass loss, to a greater or lesser extent, depending on their initial envelope mass as well as planet mass and orbital distance (e.g., Owen & Wu, 2013; Lopez & Fortney, 2014; Jin et al., 2014; Owen & Wu, 2016; Ginzburg et al., 2016; Owen & Wu, 2017; Ginzburg et al., 2018; Jin & Mordasini, 2018; Gupta & Schlichting, 2019; Mordasini, 2020; Venturini et al., 2020; Rogers et al., 2021). In this picture, multi- planets must clearly form quickly (perhaps via pebble accretion), before the dissipation of the protoplanetary disk, i.e., within the first few Myr. The ability of these planets to reach masses above quickly at distances au suggests that planets forming at au may also acquire all of their mass in the nebular phase, emerging fully formed, with no need for late-stage giant impacts (e.g., Mordasini, 2020; Venturini et al., 2020).
In the Solar System, evidence for the moon-forming impact (e.g., Asphaug et al., 2021; Canup et al., 2021, and references therein) and analyses of elemental abundances in Venus, Earth, and Mars (e.g., Lammer et al., 2021, 2022, and references therein) provide strong incentive for the role of giant impacts in the evolution of at least one planetary system. However, this evolutionary history may be rare if most planetary systems form their terrestrial planets early, in the nebular phase.
6.3 Future Observations
Future work on exoplanet demographics and work that explores the plausibility of dust removal mechanisms can help us understand whether planetary systems form their terrestrial planets primarily “quickly” or “neatly.”
Gas reservoirs. If late-stage giant impacts are a common feature of terrestrial planet formation but the debris they produce is swept away by gas drag, we expect to see tenuous gas reservoirs around 10–100 Myr old stars. Residual gas disks are generally assumed to be absent based on the lack of detected stellar accretion signatures and in situ gas detections. But it is difficult to rule out gas at a very low level. Stellar accretion rate measurements are not commonly available below i.e., below 0.1%–1% of the accretion rates typical of classical T Tauri stars (e.g., Riviere-Marichalar et al., 2015). In terms of gas detections, a recent study using the UV transitions of H2 to search for residual gas around Myr old stars detected of hot H2 ( K) within 1 au of TWA7 (Flagg et al., 2021). Just the tip of the iceberg, the hot H2 is expected to be accompanied by a much larger mass of cool and/or atomic gas, perhaps a total column density of g cm-2, similar to the column density needed for efficient dust removal via gas drag. Further studies along these lines would be of great interest. Given the low column densities of the replenished gas disks, they are likely to be best probed with atomic diagnostics. If they arise from secondary atmospheres or are delivered by comets and asteroids, they will be enriched in volatiles (e.g., water) rather than dominated by hydrogen, suggesting searches for atomic oxygen line emission.
Stellar Winds of Young Stars. The major challenge in understanding the efficiency of stellar wind drag is the current uncertainty in the mass loss rates of young stars (e.g., Cranmer & Saar, 2011; Cohen & Drake, 2014; Fichtinger et al., 2017; Ó Fionnagáin & Vidotto, 2018; Güdel, 2020; Vidotto, 2021, and references therein). With few direct measures of mass loss rates for 10–100 Myr old stars, published estimates are based on observations of older stars (0.1–1 Gyr) and models that match the evolution of measured rotation rates and proxies of coronal activity. Future direct measurements of mass loss rates for stars with ages of 10–100 Myr would be extremely valuable. Fortunately, indirect evidence for stellar wind drag may be found in the combined X-ray/IR demographics of young stars (e.g., Plavchan et al., 2005; Chen et al., 2005a, b, 2009; Plavchan et al., 2009; Sierchio et al., 2010). Although sample sizes remain modest, some analyses suggest that young stars with large (small) X-ray luminosities are less (more) likely to have IR emission from a warm debris disk at distances of a 2–3 au from the central star, a relation that is expected if stellar winds associated with stellar activity act to remove dust signatures. Augmenting these studies with more recent X-ray data from Chandra and the results of IR surveys with WISE (e.g., Kuchner et al., 2016) and Herschel (e.g., Eiroa et al., 2013; Sibthorpe et al., 2018) might enable a cleaner test of a correlation between X-ray emission (a possible proxy for the stellar mass loss rate) and IR excess emission.
Terrestrial Planet Atmospheres and Moons. If terrestrial planets with masses 1–2 at au form quickly and emerge from the nebular phase fully assembled, they will have primordial gaseous envelopes with masses 1% to 10% of the mass of the planet (e.g., Mordasini et al., 2012; Mordasini, 2020). Although various processes can remove primordial atmospheres with masses 0.01 (e.g., Wyatt et al., 2020; Kegerreis et al., 2020b, a; Lammer et al., 2021, and references therein), the most massive envelopes may survive giant impacts and evaporation. If this dichotomy is borne out by detailed calculations, we expect ensembles of 1–2 planets at 1 au distances to consist of a mixture of planets with negligible atmospheres and those with puffy atmospheres, similar to the situation found for sub-Neptunes and super-Earths at smaller orbital distances. Future searches for exoplanetary moons may uncover valuable clues as to whether late-stage giant impacts play a significant role in terrestrial planet formation. If the presence of large moons (like that of Earth) is a signpost of late-stage giant impacts, the incidence rate of moons associated with terrestrial exoplanets can reveal the rarity or commonality of this formation pathway.
7 Summary and Conclusions
Giant impacts are a central theme in the story of terrestrial planet origins. They play an important role in our ideas about how terrestrial planets gather their mass and in the expectation that a dusty debris signature announces the final stages of planetary assembly. As described here, giant impacts also figure prominently in our ideas about how planets acquire (or lose) their atmospheres and oceans, but it is perhaps less appreciated how the loss of planetary atmospheres can also regenerate enough of a gas disk to compromise our ability to detect the expected dusty debris signature of terrestrial planet formation.
Similarly, impacts by comets and asteroids are often invoked to account for the origin of Earth’s oceans. Because the Earth is a small impact target, scenarios that deliver appreciable water to Earth would also launch many more non-Earth-impacting bodies into the inner Solar System and regenerate a tenuous gaseous disk. In either case, a regenerated gas disk, whether achieved by “takeout” (by giant impacts liberating planetary atmospheres) or “delivery” (by evaporating comets and asteroids), is plausibly hefty enough to whisk away dusty debris via gas drag and erase the anticipated debris signature of terrestrial planet formation.
The regenerated gas disk may be subject to photoevaporation by energetic XUV radiation from the central star, potentially reducing its efficacy in removing the dusty debris. However, the strong stellar wind that will accompany the XUV radiation offers an alternative pathway to remove the dusty debris signature of terrestrial planet formation: stellar wind drag. The major uncertainty associated with stellar wind drag is the relatively poorly measured stellar wind mass loss rates at ages of 10-100 Myr.
Thus, both gas drag and stellar wind drag provide pathways by which the anticipated debris signature of terrestrial planet formation can be erased. These processes may resolve the conundrum of why terrestrial planets like Earth and Venus are found to occur relatively commonly around Sun-like stars, but the warm dust debris signatures that are expected to accompany their formation are rarely detected.
This conundrum might also be resolved in a different way. The size distribution of close-in planets may suggest that terrestrial planet formation departs significantly from the “classical” picture, with planets forming completely in the nebular phase and late-stage giant impacts playing little or no role. If this is the dominant pathway for terrestrial planet formation, the primordial disk may obscure the assembly process, making it challenging to detect and study. Thus, both the availability of multiple pathways to erase the anticipated debris signature of terrestrial planet formation, as well as the alternative possibility of very early terrestrial planet formation, suggest that the observable signposts of terrestrial planets may be more subtle and more challenging to detect than previously believed.
Exploring these ideas requires more detailed models that track the transport of gas between planets, comets, asteroids, and a regenerated gas disk, including important additional processes such as photoevaporation and other gas removal mechanisms. Valuable insights can come from new observations, e.g., measurements of stellar wind mass loss rates and confirmation of the presence and longevity of tenuous regenerated gaseous reservoirs. Studies along these lines may find evidence for dust removal mechanisms in action. In parallel, future studies of the mass-size distribution of terrestrial planets and the presence or absence of large moons can also reveal whether terrestrial planets primarily form early, in the presence of a gas disk, and whether giant impacts play a significant role in their formation history.
References
- Abod et al. (2019) Abod, C. P., Simon, J. B., Li, R., et al. 2019, ApJ, 883, 192, doi: 10.3847/1538-4357/ab40a3
- Adachi et al. (1976) Adachi, I., Hayashi, C., & Nakazawa, K. 1976, Progress of Theoretical Physics, 56, 1756
- Ahrens (1993) Ahrens, T. J. 1993, Annual Review of Earth and Planetary Sciences, 21, 525, doi: 10.1146/annurev.ea.21.050193.002521
- Alexander (2022) Alexander, C. M. O. 2022, Geochim. Cosmochim. Acta, 318, 428, doi: 10.1016/j.gca.2021.12.012
- Alexander et al. (2012) Alexander, C. M. O., Bowden, R., Fogel, M. L., et al. 2012, Science, 337, 721, doi: 10.1126/science.1223474
- Armitage (2013) Armitage, P. J. 2013, Astrophysics of Planet Formation (Cambridge University Press, Cambridge, UK)
- Asphaug et al. (2021) Asphaug, E., Emsenhuber, A., Cambioni, S., Gabriel, T. S. J., & Schwartz, S. R. 2021, \psj, 2, 200, doi: 10.3847/PSJ/ac19b2
- Bagenal et al. (2016) Bagenal, F., Horányi, M., McComas, D. J., et al. 2016, Science, 351, aad9045, doi: 10.1126/science.aad9045
- Ballering et al. (2013) Ballering, N. P., Rieke, G. H., Su, K. Y. L., & Montiel, E. 2013, ApJ, 775, 55, doi: 10.1088/0004-637X/775/1/55
- Bates et al. (2021) Bates, H. C., Donaldson Hanna, K. L., King, A. J., Bowles, N. E., & Russell, S. S. 2021, Journal of Geophysical Research (Planets), 126, e06827, doi: 10.1029/2021JE006827
- Beichman et al. (2011) Beichman, C. A., Lisse, C. M., Tanner, A. M., et al. 2011, ApJ, 743, 85, doi: 10.1088/0004-637X/743/1/85
- Benz & Asphaug (1999) Benz, W., & Asphaug, E. 1999, Icarus, 142, 5, doi: 10.1006/icar.1999.6204
- Biersteker & Schlichting (2019) Biersteker, J. B., & Schlichting, H. E. 2019, MNRAS, 485, 4454, doi: 10.1093/mnras/stz738
- Biersteker & Schlichting (2021) —. 2021, MNRAS, 501, 587, doi: 10.1093/mnras/staa3614
- Bottke et al. (2005) Bottke, W. F., Durda, D. D., Nesvorný, D., et al. 2005, Icarus, 179, 63, doi: 10.1016/j.icarus.2005.05.017
- Boyet & Carlson (2005) Boyet, M., & Carlson, R. W. 2005, Science, 309, 576, doi: 10.1126/science.1113634
- Brunini & López (2018) Brunini, A., & López, M. C. 2018, MNRAS, 479, 1392, doi: 10.1093/mnras/sty1458
- Bryden et al. (2009) Bryden, G., Beichman, C. A., Carpenter, J. M., et al. 2009, ApJ, 705, 1226, doi: 10.1088/0004-637X/705/2/1226
- Bryson et al. (2021) Bryson, S., Kunimoto, M., Kopparapu, R. K., et al. 2021, AJ, 161, 36, doi: 10.3847/1538-3881/abc418
- Burke et al. (2015) Burke, C. J., Christiansen, J. L., Mullally, F., et al. 2015, ApJ, 809, 8, doi: 10.1088/0004-637X/809/1/8
- Burns et al. (1979) Burns, J. A., Lamy, P. L., & Soter, S. 1979, Icarus, 40, 1, doi: 10.1016/0019-1035(79)90050-2
- Campo Bagatin et al. (1994) Campo Bagatin, A., Cellino, A., Davis, D. R., Farinella, P., & Paolicchi, P. 1994, Planet. Space Sci., 42, 1079
- Canup et al. (2021) Canup, R. M., Righter, K., Dauphas, N., et al. 2021, arXiv e-prints, arXiv:2103.02045. https://arxiv.org/abs/2103.02045
- Carpenter et al. (2009a) Carpenter, J. M., Mamajek, E. E., Hillenbrand, L. A., & Meyer, M. R. 2009a, ApJ, 705, 1646, doi: 10.1088/0004-637X/705/2/1646
- Carpenter et al. (2009b) Carpenter, J. M., Bouwman, J., Mamajek, E. E., et al. 2009b, ApJS, 181, 197, doi: 10.1088/0067-0049/181/1/197
- Carrera et al. (2020) Carrera, D., Simon, J. B., Li, R., Kretke, K. A., & Klahr, H. 2020, arXiv e-prints, arXiv:2008.01727. https://arxiv.org/abs/2008.01727
- Chambers & Wetherill (1998) Chambers, J. E., & Wetherill, G. W. 1998, Icarus, 136, 304
- Chatterjee et al. (2008) Chatterjee, S., Ford, E. B., Matsumura, S., & Rasio, F. A. 2008, ApJ, 686, 580, doi: 10.1086/590227
- Chen et al. (2005a) Chen, C. H., Jura, M., Gordon, K. D., & Blaylock, M. 2005a, ApJ, 623, 493, doi: 10.1086/428607
- Chen et al. (2011) Chen, C. H., Mamajek, E. E., Bitner, M. A., et al. 2011, ApJ, 738, 122, doi: 10.1088/0004-637X/738/2/122
- Chen et al. (2009) Chen, C. H., Sheehan, P., Watson, D. M., Manoj, P., & Najita, J. R. 2009, ApJ, 701, 1367, doi: 10.1088/0004-637X/701/2/1367
- Chen et al. (2005b) Chen, C. H., Patten, B. M., Werner, M. W., et al. 2005b, ApJ, 634, 1372, doi: 10.1086/497124
- Chen et al. (2006) Chen, C. H., Sargent, B. A., Bohac, C., et al. 2006, ApJS, 166, 351, doi: 10.1086/505751
- Chiang & Youdin (2010) Chiang, E., & Youdin, A. N. 2010, Annual Review of Earth and Planetary Sciences, 38, 493, doi: 10.1146/annurev-earth-040809-152513
- Chiang & Goldreich (1997) Chiang, E. I., & Goldreich, P. 1997, ApJ, 490, 368, doi: 10.1086/304869
- Cloutier et al. (2014) Cloutier, R., Currie, T., Rieke, G. H., et al. 2014, ApJ, 796, 127, doi: 10.1088/0004-637X/796/2/127
- Cohen & Drake (2014) Cohen, O., & Drake, J. J. 2014, ApJ, 783, 55, doi: 10.1088/0004-637X/783/1/55
- Cranmer & Saar (2011) Cranmer, S. R., & Saar, S. H. 2011, ApJ, 741, 54, doi: 10.1088/0004-637X/741/1/54
- Currie et al. (2007) Currie, T., Kenyon, S. J., Rieke, G., Balog, Z., & Bromley, B. C. 2007, ApJ, 663, L105, doi: 10.1086/520509
- Dahm & Carpenter (2009) Dahm, S. E., & Carpenter, J. M. 2009, AJ, 137, 4024, doi: 10.1088/0004-6256/137/4/4024
- Daly et al. (2021) Daly, L., Lee, M. R., Hallis, L. J., et al. 2021, Nature Astronomy, 5, 1275, doi: 10.1038/s41550-021-01487-w
- Dominik & Decin (2003) Dominik, C., & Decin, G. 2003, ApJ, 598, 626, doi: 10.1086/379169
- Eiroa et al. (2013) Eiroa, C., Marshall, J. P., Mora, A., et al. 2013, A&A, 555, A11, doi: 10.1051/0004-6361/201321050
- Elkins-Tanton (2008) Elkins-Tanton, L. T. 2008, Earth and Planetary Science Letters, 271, 181, doi: 10.1016/j.epsl.2008.03.062
- Elkins-Tanton (2012) —. 2012, Annual Review of Earth and Planetary Sciences, 40, 113, doi: 10.1146/annurev-earth-042711-105503
- Elkins-Tanton et al. (2011) Elkins-Tanton, L. T., Burgess, S., & Yin, Q.-Z. 2011, Earth and Planetary Science Letters, 304, 326, doi: 10.1016/j.epsl.2011.02.004
- Elkins-Tanton et al. (2004) Elkins-Tanton, L. T., Hager, B. H., & Grove, T. L. 2004, Earth and Planetary Science Letters, 222, 17, doi: 10.1016/j.epsl.2004.02.017
- Ercolano & Pascucci (2017) Ercolano, B., & Pascucci, I. 2017, Royal Society Open Science, 4, 170114, doi: 10.1098/rsos.170114
- Erkaev et al. (2014) Erkaev, N. V., Lammer, H., Elkins-Tanton, L. T., et al. 2014, Planet. Space Sci., 98, 106, doi: 10.1016/j.pss.2013.09.008
- Fichtinger et al. (2017) Fichtinger, B., Güdel, M., Mutel, R. L., et al. 2017, A&A, 599, A127, doi: 10.1051/0004-6361/201629886
- Flagg et al. (2021) Flagg, L., Johns-Krull, C. M., France, K., et al. 2021, ApJ, 921, 86, doi: 10.3847/1538-4357/ac1d4c
- Ford & Rasio (2008) Ford, E. B., & Rasio, F. A. 2008, ApJ, 686, 621, doi: 10.1086/590926
- Fulton & Petigura (2018) Fulton, B. J., & Petigura, E. A. 2018, AJ, 156, 264, doi: 10.3847/1538-3881/aae828
- Fulton et al. (2017) Fulton, B. J., Petigura, E. A., Howard, A. W., et al. 2017, AJ, 154, 109, doi: 10.3847/1538-3881/aa80eb
- Genda & Abe (2003) Genda, H., & Abe, Y. 2003, Icarus, 164, 149, doi: 10.1016/S0019-1035(03)00101-5
- Genda et al. (2015) Genda, H., Kobayashi, H., & Kokubo, E. 2015, ApJ, 810, 136, doi: 10.1088/0004-637X/810/2/136
- Ginzburg et al. (2016) Ginzburg, S., Schlichting, H. E., & Sari, R. 2016, ApJ, 825, 29, doi: 10.3847/0004-637X/825/1/29
- Ginzburg et al. (2018) —. 2018, MNRAS, 476, 759, doi: 10.1093/mnras/sty290
- Goldreich et al. (2004) Goldreich, P., Lithwick, Y., & Sari, R. 2004, ARA&A, 42, 549
- Goldreich & Tremaine (1982) Goldreich, P., & Tremaine, S. 1982, ARA&A, 20, 249, doi: 10.1146/annurev.aa.20.090182.001341
- Goldreich & Tremaine (1978) Goldreich, P., & Tremaine, S. D. 1978, Icarus, 34, 227
- Gole et al. (2020) Gole, D. A., Simon, J. B., Li, R., Youdin, A. N., & Armitage, P. J. 2020, ApJ, 904, 132, doi: 10.3847/1538-4357/abc334
- Gorti et al. (2009) Gorti, U., Dullemond, C. P., & Hollenbach, D. 2009, ApJ, 705, 1237, doi: 10.1088/0004-637X/705/2/1237
- Gould et al. (2022) Gould, A., Jung, Y. K., Hwang, K.-H., et al. 2022, arXiv e-prints, arXiv:2204.03269. https://arxiv.org/abs/2204.03269
- Greenberg & Nolan (1989) Greenberg, R., & Nolan, M. C. 1989, in Asteroids II, ed. R. P. Binzel, T. Gehrels, & M. S. Matthews (University of Arizona Press, Tucson, AZ), 778–801. http://adsabs.harvard.edu/cgi-bin/nph-bib_query?bibcode=greenberg:delivery&db_key=AST
- Güdel (2020) Güdel, M. 2020, Space Sci. Rev., 216, 143, doi: 10.1007/s11214-020-00773-9
- Gupta & Schlichting (2019) Gupta, A., & Schlichting, H. E. 2019, MNRAS, 487, 24, doi: 10.1093/mnras/stz1230
- Hamano et al. (2013) Hamano, K., Abe, Y., & Genda, H. 2013, Nature, 497, 607, doi: 10.1038/nature12163
- Hardegree-Ullman et al. (2020) Hardegree-Ullman, K. K., Zink, J. K., Christiansen, J. L., et al. 2020, ApJS, 247, 28, doi: 10.3847/1538-4365/ab7230
- Hartmann et al. (1986) Hartmann, L., Hewett, R., Stahler, S., & Mathieu, R. D. 1986, ApJ, 309, 275, doi: 10.1086/164599
- Herbst et al. (2001) Herbst, W., Bailer-Jones, C. A. L., & Mundt, R. 2001, ApJ, 554, L197, doi: 10.1086/321706
- Herbst et al. (2007) Herbst, W., Eislöffel, J., Mundt, R., & Scholz, A. 2007, in Protostars and Planets V, ed. B. Reipurth, D. Jewitt, & K. Keil, 297. https://arxiv.org/abs/astro-ph/0603673
- Hornung et al. (1985) Hornung, P., Pellat, R., & Barge, P. 1985, Icarus, 64, 295, doi: 10.1016/0019-1035(85)90205-2
- Huebner et al. (1986) Huebner, W. F., Keller, H. U., Wilhelm, K., et al. 1986, in ESA Special Publication, Vol. 250, ESLAB Symposium on the Exploration of Halley’s Comet, ed. B. Battrick, E. J. Rolfe, & R. Reinhard, 363–364
- Hughes (1985) Hughes, D. W. 1985, MNRAS, 213, 103, doi: 10.1093/mnras/213.1.103
- Inamdar & Schlichting (2015) Inamdar, N. K., & Schlichting, H. E. 2015, MNRAS, 448, 1751, doi: 10.1093/mnras/stv030
- Ishihara et al. (2017) Ishihara, D., Takeuchi, N., Kobayashi, H., et al. 2017, A&A, 601, A72, doi: 10.1051/0004-6361/201526215
- Iwasaki et al. (2002) Iwasaki, K., Emori, H., Nakazawa, K., & Tanaka, H. 2002, PASJ, 54, 471, doi: 10.1093/pasj/54.3.471
- Iwasaki et al. (2001) Iwasaki, K., Tanaka, H., Nakazawa, K., & Hiroyuki, E. 2001, PASJ, 53, 321, doi: 10.1093/pasj/53.2.321
- Jackson & Wyatt (2012) Jackson, A. P., & Wyatt, M. C. 2012, MNRAS, 425, 657, doi: 10.1111/j.1365-2966.2012.21546.x
- Jewitt & Matthews (1999) Jewitt, D., & Matthews, H. 1999, AJ, 117, 1056, doi: 10.1086/300743
- Jin & Mordasini (2018) Jin, S., & Mordasini, C. 2018, ApJ, 853, 163, doi: 10.3847/1538-4357/aa9f1e
- Jin et al. (2014) Jin, S., Mordasini, C., Parmentier, V., et al. 2014, ApJ, 795, 65, doi: 10.1088/0004-637X/795/1/65
- Johns-Krull (2007) Johns-Krull, C. M. 2007, ApJ, 664, 975, doi: 10.1086/519017
- Johnstone et al. (2021) Johnstone, C. P., Bartel, M., & Güdel, M. 2021, A&A, 649, A96, doi: 10.1051/0004-6361/202038407
- Johnstone et al. (2015) Johnstone, C. P., Güdel, M., Brott, I., & Lüftinger, T. 2015, A&A, 577, A28, doi: 10.1051/0004-6361/201425301
- Johnstone et al. (2014) Johnstone, C. P., Jardine, M., Gregory, S. G., Donati, J. F., & Hussain, G. 2014, MNRAS, 437, 3202, doi: 10.1093/mnras/stt2107
- Jurić & Tremaine (2008) Jurić, M., & Tremaine, S. 2008, ApJ, 686, 603, doi: 10.1086/590047
- Kegerreis et al. (2020a) Kegerreis, J. A., Eke, V. R., Catling, D. C., et al. 2020a, ApJ, 901, L31, doi: 10.3847/2041-8213/abb5fb
- Kegerreis et al. (2020b) Kegerreis, J. A., Eke, V. R., Massey, R. J., & Teodoro, L. F. A. 2020b, ApJ, 897, 161, doi: 10.3847/1538-4357/ab9810
- Kennedy & Wyatt (2010) Kennedy, G. M., & Wyatt, M. C. 2010, MNRAS, 405, 1253, doi: 10.1111/j.1365-2966.2010.16528.x
- Kennedy & Wyatt (2012) —. 2012, MNRAS, 426, 91, doi: 10.1111/j.1365-2966.2012.21621.x
- Kennedy & Wyatt (2013) —. 2013, MNRAS, 433, 2334, doi: 10.1093/mnras/stt900
- Kenyon & Bromley (2002) Kenyon, S. J., & Bromley, B. C. 2002, ApJ, 577, L35, doi: 10.1086/344084
- Kenyon & Bromley (2004) —. 2004, ApJ, 602, L133, doi: 10.1086/382693
- Kenyon & Bromley (2006) —. 2006, AJ, 131, 1837, doi: 10.1086/499807
- Kenyon & Bromley (2016) —. 2016, ApJ, 817, 51. https://arxiv.org/abs/1512.01273
- Kenyon & Bromley (2017) —. 2017, ApJ, 839, 38, doi: 10.3847/1538-4357/aa6982
- Kenyon & Bromley (2020) —. 2020, The Planetary Science Journal, 1, 40, doi: 10.3847/PSJ/aba8a9
- Kenyon & Hartmann (1987) Kenyon, S. J., & Hartmann, L. 1987, ApJ, 323, 714, doi: 10.1086/165866
- Kenyon et al. (2016) Kenyon, S. J., Najita, J. R., & Bromley, B. C. 2016, ApJ, 831, 8, doi: 10.3847/0004-637X/831/1/8
- Khabarova et al. (2018) Khabarova, O. V., Obridko, V. N., Kislov, R. A., et al. 2018, Plasma Physics Reports, 44, 840, doi: 10.1134/S1063780X18090064
- King et al. (2021) King, A. J., Schofield, P. F., & Russell, S. S. 2021, Geochim. Cosmochim. Acta, 298, 167, doi: 10.1016/j.gca.2021.02.011
- Klahr & Schreiber (2020) Klahr, H., & Schreiber, A. 2020, ApJ, 901, 54, doi: 10.3847/1538-4357/abac58
- Klacka (2013) Klacka, J. 2013, MNRAS, 436, 2785, doi: 10.1093/mnras/stt1774
- Kobayashi et al. (2019) Kobayashi, H., Isoya, K., & Sato, Y. 2019, ApJ, 887, 226, doi: 10.3847/1538-4357/ab5307
- Kobayashi & Löhne (2014) Kobayashi, H., & Löhne, T. 2014, MNRAS, 442, 3266, doi: 10.1093/mnras/stu1073
- Kobayashi & Tanaka (2010) Kobayashi, H., & Tanaka, H. 2010, Icarus, 206, 735, doi: 10.1016/j.icarus.2009.10.004
- Kominami & Ida (2002) Kominami, J., & Ida, S. 2002, Icarus, 157, 43
- Kominami & Ida (2004) —. 2004, Icarus, 167, 231
- Krivov et al. (2008) Krivov, A. V., Müller, S., Löhne, T., & Mutschke, H. 2008, ApJ, 687, 608, doi: 10.1086/591507
- Krivov & Wyatt (2021) Krivov, A. V., & Wyatt, M. C. 2021, MNRAS, 500, 718, doi: 10.1093/mnras/staa2385
- Krumholz et al. (2020) Krumholz, M. R., Ireland, M. J., & Kratter, K. M. 2020, MNRAS, 498, 3023, doi: 10.1093/mnras/staa2546
- Kuchner et al. (2016) Kuchner, M. J., Silverberg, S. M., Bans, A. S., et al. 2016, ApJ, 830, 84, doi: 10.3847/0004-637X/830/2/84
- Lammer et al. (2021) Lammer, H., Brasser, R., Johansen, A., Scherf, M., & Leitzinger, M. 2021, Space Sci. Rev., 217, 7, doi: 10.1007/s11214-020-00778-4
- Lammer et al. (2018) Lammer, H., Zerkle, A. L., Gebauer, S., et al. 2018, A&A Rev., 26, 2, doi: 10.1007/s00159-018-0108-y
- Lammer et al. (2020a) Lammer, H., Leitzinger, M., Scherf, M., et al. 2020a, Icarus, 339, 113551, doi: 10.1016/j.icarus.2019.113551
- Lammer et al. (2020b) Lammer, H., Scherf, M., Kurokawa, H., et al. 2020b, Space Sci. Rev., 216, 74, doi: 10.1007/s11214-020-00701-x
- Lammer et al. (2022) Lammer, H., Scherf, M., Ito, Y., et al. 2022, Space Sci. Rev., 218, 15, doi: 10.1007/s11214-022-00876-5
- Lee & Connors (2021) Lee, E. J., & Connors, N. J. 2021, ApJ, 908, 32, doi: 10.3847/1538-4357/abd6c7
- Leinhardt & Stewart (2012) Leinhardt, Z. M., & Stewart, S. T. 2012, ApJ, 745, 79, doi: 10.1088/0004-637X/745/1/79
- Levison & Duncan (1997) Levison, H. F., & Duncan, M. J. 1997, Icarus, 127, 13
- Li et al. (2018) Li, R., Youdin, A. N., & Simon, J. B. 2018, ApJ, 862, 14, doi: 10.3847/1538-4357/aaca99
- Lichtenegger et al. (2016) Lichtenegger, H. I. M., Kislyakova, K. G., Odert, P., et al. 2016, Journal of Geophysical Research (Space Physics), 121, 4718, doi: 10.1002/2015JA022226
- Liffman (2003) Liffman, K. 2003, PASA, 20, 337, doi: 10.1071/AS03019
- Lissauer (1987) Lissauer, J. J. 1987, Icarus, 69, 249, doi: 10.1016/0019-1035(87)90104-7
- Lisse (2002) Lisse, C. 2002, Earth Moon and Planets, 90, 497, doi: 10.1023/A:1021519408600
- Lopez & Fortney (2014) Lopez, E. D., & Fortney, J. J. 2014, ApJ, 792, 1, doi: 10.1088/0004-637X/792/1/1
- Luhman & Mamajek (2012) Luhman, K. L., & Mamajek, E. E. 2012, ApJ, 758, 31, doi: 10.1088/0004-637X/758/1/31
- Manara et al. (2022) Manara, C. F., Ansdell, M., Rosotti, G. P., et al. 2022, arXiv e-prints, arXiv:2203.09930. https://arxiv.org/abs/2203.09930
- Manske et al. (2021) Manske, L., Marchi, S., Plesa, A.-C., & Wünnemann, K. 2021, Icarus, 357, 114128, doi: 10.1016/j.icarus.2020.114128
- Marboeuf et al. (2016) Marboeuf, U., Bonsor, A., & Augereau, J. C. 2016, Planet. Space Sci., 133, 47, doi: 10.1016/j.pss.2016.03.014
- Margot (2015) Margot, J.-L. 2015, AJ, 150, 185, doi: 10.1088/0004-6256/150/6/185
- Marino (2022) Marino, S. 2022, arXiv e-prints, arXiv:2202.03053. https://arxiv.org/abs/2202.03053
- Martin & Livio (2021) Martin, R. G., & Livio, M. 2021, MNRAS, 506, L6, doi: 10.1093/mnrasl/slab062
- Marty et al. (2016) Marty, B., Avice, G., Sano, Y., et al. 2016, Earth and Planetary Science Letters, 441, 91, doi: 10.1016/j.epsl.2016.02.031
- Massol et al. (2016) Massol, H., Hamano, K., Tian, F., et al. 2016, Space Sci. Rev., 205, 153, doi: 10.1007/s11214-016-0280-1
- Matrà et al. (2018) Matrà, L., Marino, S., Kennedy, G. M., et al. 2018, ApJ, 859, 72, doi: 10.3847/1538-4357/aabcc4
- Matthews et al. (2014) Matthews, B. C., Krivov, A. V., Wyatt, M. C., Bryden, G., & Eiroa, C. 2014, in Protostars and Planet VI, ed. Beuther, H., Klessen, R. S., Dullemond, C. P., & Henning, T. (The University of Arizona Press, Tucson, AZ), 521–544
- McCubbin & Barnes (2019) McCubbin, F. M., & Barnes, J. J. 2019, Earth and Planetary Science Letters, 526, 115771, doi: 10.1016/j.epsl.2019.115771
- Melis et al. (2021) Melis, C., Olofsson, J., Song, I., et al. 2021, ApJ, 923, 90, doi: 10.3847/1538-4357/ac2603
- Melis et al. (2010) Melis, C., Zuckerman, B., Rhee, J. H., & Song, I. 2010, ApJ, 717, L57, doi: 10.1088/2041-8205/717/1/L57
- Monteux & Arkani-Hamed (2014) Monteux, J., & Arkani-Hamed, J. 2014, Journal of Geophysical Research (Planets), 119, 480, doi: 10.1002/2013JE004587
- Moór et al. (2021) Moór, A., Ábrahám, P., Szabó, G., et al. 2021, ApJ, 910, 27, doi: 10.3847/1538-4357/abdc26
- Morbidelli et al. (2000) Morbidelli, A., Chambers, J., Lunine, J. I., et al. 2000, Meteoritics and Planetary Science, 35, 1309
- Mordasini (2020) Mordasini, C. 2020, A&A, 638, A52, doi: 10.1051/0004-6361/201935541
- Mordasini et al. (2012) Mordasini, C., Alibert, Y., Georgy, C., et al. 2012, A&A, 547, A112, doi: 10.1051/0004-6361/201118464
- Najita et al. (2022) Najita, J. R., Kenyon, S. J., & Bromley, B. C. 2022, ApJ, 925, 45, doi: 10.3847/1538-4357/ac37b6
- Nakatani et al. (2018a) Nakatani, R., Hosokawa, T., Yoshida, N., Nomura, H., & Kuiper, R. 2018a, ApJ, 857, 57, doi: 10.3847/1538-4357/aab70b
- Nakatani et al. (2018b) —. 2018b, ApJ, 865, 75, doi: 10.3847/1538-4357/aad9fd
- Nesvorný et al. (2018) Nesvorný, D., Vokrouhlický, D., Bottke, W. F., & Levison, H. F. 2018, Nature Astronomy, 2, 878, doi: 10.1038/s41550-018-0564-3
- Neumann et al. (2014) Neumann, W., Breuer, D., & Spohn, T. 2014, Earth and Planetary Science Letters, 395, 267, doi: 10.1016/j.epsl.2014.03.033
- Ó Fionnagáin & Vidotto (2018) Ó Fionnagáin, D., & Vidotto, A. A. 2018, MNRAS, 476, 2465, doi: 10.1093/mnras/sty394
- O’Brien & Greenberg (2003) O’Brien, D. P., & Greenberg, R. 2003, Icarus, 164, 334
- O’Brien et al. (2018) O’Brien, D. P., Izidoro, A., Jacobson, S. A., Raymond, S. N., & Rubie, D. C. 2018, Space Sci. Rev., 214, 47, doi: 10.1007/s11214-018-0475-8
- O’Brien et al. (2014) O’Brien, D. P., Walsh, K. J., Morbidelli, A., Raymond, S. N., & Mandell, A. M. 2014, Icarus, 239, 74, doi: 10.1016/j.icarus.2014.05.009
- Odert et al. (2018) Odert, P., Lammer, H., Erkaev, N. V., et al. 2018, Icarus, 307, 327, doi: 10.1016/j.icarus.2017.10.031
- Owen & Wu (2013) Owen, J. E., & Wu, Y. 2013, ApJ, 775, 105, doi: 10.1088/0004-637X/775/2/105
- Owen & Wu (2016) —. 2016, ApJ, 817, 107, doi: 10.3847/0004-637X/817/2/107
- Owen & Wu (2017) —. 2017, ApJ, 847, 29, doi: 10.3847/1538-4357/aa890a
- Patel et al. (2014) Patel, R. I., Metchev, S. A., & Heinze, A. 2014, ApJS, 212, 10, doi: 10.1088/0067-0049/212/1/10
- Petigura (2020) Petigura, E. A. 2020, AJ, 160, 89, doi: 10.3847/1538-3881/ab9fff
- Petigura et al. (2013) Petigura, E. A., Howard, A. W., & Marcy, G. W. 2013, Proceedings of the National Academy of Science, 110, 19273. https://arxiv.org/abs/1311.6806
- Piani & Marrocchi (2018) Piani, L., & Marrocchi, Y. 2018, Earth and Planetary Science Letters, 504, 64, doi: 10.1016/j.epsl.2018.09.031
- Piani et al. (2020) Piani, L., Marrocchi, Y., Rigaudier, T., et al. 2020, Science, 369, 1110, doi: 10.1126/science.aba1948
- Piani et al. (2018) Piani, L., Yurimoto, H., & Remusat, L. 2018, Nature Astronomy, 2, 317, doi: 10.1038/s41550-018-0413-4
- Picogna et al. (2019) Picogna, G., Ercolano, B., Owen, J. E., & Weber, M. L. 2019, MNRAS, 487, 691, doi: 10.1093/mnras/stz1166
- Plavchan et al. (2005) Plavchan, P., Jura, M., & Lipscy, S. J. 2005, ApJ, 631, 1161, doi: 10.1086/432568
- Plavchan et al. (2009) Plavchan, P., Werner, M. W., Chen, C. H., et al. 2009, ApJ, 698, 1068, doi: 10.1088/0004-637X/698/2/1068
- Poleski et al. (2021) Poleski, R., Skowron, J., Mróz, P., et al. 2021, Acta Astron., 71, 1, doi: 10.32023/0001-5237/71.1.1
- Rafikov (2004) Rafikov, R. R. 2004, AJ, 128, 1348, doi: 10.1086/423216
- Rafikov (2006) —. 2006, ApJ, 648, 666, doi: 10.1086/505695
- Raymond et al. (2010) Raymond, S. N., Armitage, P. J., & Gorelick, N. 2010, ApJ, 711, 772, doi: 10.1088/0004-637X/711/2/772
- Raymond & Izidoro (2017) Raymond, S. N., & Izidoro, A. 2017, Icarus, 297, 134, doi: 10.1016/j.icarus.2017.06.030
- Raymond et al. (2014) Raymond, S. N., Kokubo, E., Morbidelli, A., Morishima, R., & Walsh, K. J. 2014, in Protostars and Planets VI, ed. H. Beuther, R. S. Klessen, C. P. Dullemond, & T. Henning, 595, doi: 10.2458/azu_uapress_9780816531240-ch026
- Raymond et al. (2004) Raymond, S. N., Quinn, T., & Lunine, J. I. 2004, Icarus, 168, 1, doi: 10.1016/j.icarus.2003.11.019
- Raymond et al. (2011) Raymond, S. N., Armitage, P. J., Moro-Martín, A., et al. 2011, A&A, 530, A62, doi: 10.1051/0004-6361/201116456
- Raymond et al. (2012) —. 2012, A&A, 541, A11, doi: 10.1051/0004-6361/201117049
- Rhee et al. (2008) Rhee, J. H., Song, I., & Zuckerman, B. 2008, ApJ, 675, 777, doi: 10.1086/524935
- Ribas et al. (2012) Ribas, Á., Merín, B., Ardila, D. R., & Bouy, H. 2012, A&A, 541, A38, doi: 10.1051/0004-6361/201118306
- Riviere-Marichalar et al. (2015) Riviere-Marichalar, P., Elliott, P., Rebollido, I., et al. 2015, A&A, 584, A22, doi: 10.1051/0004-6361/201526584
- Rogers et al. (2021) Rogers, J. G., Gupta, A., Owen, J. E., & Schlichting, H. E. 2021, MNRAS, 508, 5886, doi: 10.1093/mnras/stab2897
- Ronnet et al. (2018) Ronnet, T., Mousis, O., Vernazza, P., Lunine, J. I., & Crida, A. 2018, AJ, 155, 224, doi: 10.3847/1538-3881/aabcc7
- Rubie et al. (2015) Rubie, D. C., Jacobson, S. A., Morbidelli, A., et al. 2015, Icarus, 248, 89, doi: 10.1016/j.icarus.2014.10.015
- Rucska & Wadsley (2021) Rucska, J. J., & Wadsley, J. W. 2021, MNRAS, 500, 520, doi: 10.1093/mnras/staa3295
- Schlichting et al. (2013) Schlichting, H. E., Fuentes, C. I., & Trilling, D. E. 2013, AJ, 146, 36, doi: 10.1088/0004-6256/146/2/36
- Schlichting et al. (2015) Schlichting, H. E., Sari, R., & Yalinewich, A. 2015, Icarus, 247, 81, doi: 10.1016/j.icarus.2014.09.053
- Schlichting et al. (2012) Schlichting, H. E., Warren, P. H., & Yin, Q.-Z. 2012, ApJ, 752, 8, doi: 10.1088/0004-637X/752/1/8
- Shimizu et al. (2021) Shimizu, K., Alexander, C. M. O., Hauri, E. H., et al. 2021, Geochim. Cosmochim. Acta, 301, 230, doi: 10.1016/j.gca.2021.03.005
- Shu & Stewart (1985) Shu, F. H., & Stewart, G. R. 1985, Icarus, 62, 360, doi: 10.1016/0019-1035(85)90181-2
- Sibthorpe et al. (2018) Sibthorpe, B., Kennedy, G. M., Wyatt, M. C., et al. 2018, MNRAS, 475, 3046, doi: 10.1093/mnras/stx3188
- Sierchio et al. (2010) Sierchio, J. M., Rieke, G. H., Su, K. Y. L., et al. 2010, ApJ, 712, 1421, doi: 10.1088/0004-637X/712/2/1421
- Silverstone et al. (2006) Silverstone, M. D., Meyer, M. R., Mamajek, E. E., et al. 2006, ApJ, 639, 1138, doi: 10.1086/499418
- Simon et al. (2016) Simon, J. B., Armitage, P. J., Li, R., & Youdin, A. N. 2016, ApJ, 822, 55, doi: 10.3847/0004-637X/822/1/55
- Sinclair et al. (2020) Sinclair, C. A., Wyatt, M. C., Morbidelli, A., & Nesvorný, D. 2020, MNRAS, 499, 5334, doi: 10.1093/mnras/staa3210
- Smith et al. (2011) Smith, R., Jeffries, R. D., & Oliveira, J. M. 2011, MNRAS, 411, 2186, doi: 10.1111/j.1365-2966.2010.17835.x
- Spalding (2018) Spalding, C. 2018, ApJ, 869, L17, doi: 10.3847/2041-8213/aaf478
- Spalding & Adams (2020) Spalding, C., & Adams, F. C. 2020, \psj, 1, 7, doi: 10.3847/PSJ/ab781f
- Stauffer et al. (2005) Stauffer, J. R., Rebull, L. M., Carpenter, J., et al. 2005, AJ, 130, 1834, doi: 10.1086/444420
- Stauffer et al. (2010) Stauffer, J. R., Rebull, L. M., James, D., et al. 2010, ApJ, 719, 1859, doi: 10.1088/0004-637X/719/2/1859
- Stewart & Ida (2000) Stewart, G. R., & Ida, S. 2000, Icarus, 143, 28
- Suzuki et al. (2016) Suzuki, D., Bennett, D. P., Sumi, T., et al. 2016, ApJ, 833, 145, doi: 10.3847/1538-4357/833/2/145
- Takeuchi & Artymowicz (2001) Takeuchi, T., & Artymowicz, P. 2001, ApJ, 557, 990, doi: 10.1086/322252
- Thomas & Keller (1991) Thomas, N., & Keller, H. U. 1991, A&A, 249, 258
- Tonks & Melosh (1993) Tonks, W. B., & Melosh, H. J. 1993, J. Geophys. Res., 98, 5319, doi: 10.1029/92JE02726
- Tremaine (1993) Tremaine, S. 1993, in Astronomical Society of the Pacific Conference Series, Vol. 36, Planets Around Pulsars, ed. J. A. Phillips, S. E. Thorsett, & S. R. Kulkarni, 335–344
- Tu et al. (2015) Tu, L., Johnstone, C. P., Güdel, M., & Lammer, H. 2015, A&A, 577, L3, doi: 10.1051/0004-6361/201526146
- Urban et al. (2012) Urban, L. E., Rieke, G., Su, K., & Trilling, D. E. 2012, ApJ, 750, 98, doi: 10.1088/0004-637X/750/2/98
- Urey (1955) Urey, H. C. 1955, Proceedings of the National Academy of Science, 41, 127, doi: 10.1073/pnas.41.3.127
- Van Eylen et al. (2018) Van Eylen, V., Agentoft, C., Lundkvist, M. S., et al. 2018, MNRAS, 479, 4786, doi: 10.1093/mnras/sty1783
- Venturini et al. (2020) Venturini, J., Guilera, O. M., Haldemann, J., Ronco, M. P., & Mordasini, C. 2020, A&A, 643, L1, doi: 10.1051/0004-6361/202039141
- Vican & Schneider (2014) Vican, L., & Schneider, A. 2014, ApJ, 780, 154, doi: 10.1088/0004-637X/780/2/154
- Vidotto (2021) Vidotto, A. A. 2021, Living Reviews in Solar Physics, 18, 3, doi: 10.1007/s41116-021-00029-w
- Villenave et al. (2021) Villenave, M., Ménard, F., Dent, W. R. F., et al. 2021, A&A, 653, A46, doi: 10.1051/0004-6361/202140496
- Vokrouhlický & Farinella (2000) Vokrouhlický, D., & Farinella, P. 2000, Nature, 407, 606
- Walsh & Morbidelli (2011) Walsh, K. J., & Morbidelli, A. 2011, A&A, 526, A126, doi: 10.1051/0004-6361/201015277
- Weidenschilling (1977) Weidenschilling, S. J. 1977, MNRAS, 180, 57
- Weidenschilling et al. (1997) Weidenschilling, S. J., Spaute, D., Davis, D. R., Marzari, F., & Ohtsuki, K. 1997, Icarus, 128, 429, doi: 10.1006/icar.1997.5747
- Weissman et al. (2020) Weissman, P., Morbidelli, A., Davidsson, B., & Blum, J. 2020, Space Sci. Rev., 216, 6, doi: 10.1007/s11214-019-0625-7
- Wetherill & Stewart (1993) Wetherill, G. W., & Stewart, G. R. 1993, Icarus, 106, 190, doi: 10.1006/icar.1993.1166
- Wyatt (2008) Wyatt, M. C. 2008, ARA&A, 46, 339, doi: 10.1146/annurev.astro.45.051806.110525
- Wyatt et al. (2011) Wyatt, M. C., Clarke, C. J., & Booth, M. 2011, Celestial Mechanics and Dynamical Astronomy, 111, 1, doi: 10.1007/s10569-011-9345-3
- Wyatt & Dent (2002) Wyatt, M. C., & Dent, W. R. F. 2002, MNRAS, 334, 589, doi: 10.1046/j.1365-8711.2002.05533.x
- Wyatt et al. (2020) Wyatt, M. C., Kral, Q., & Sinclair, C. A. 2020, MNRAS, 491, 782, doi: 10.1093/mnras/stz3052
- Wyatt et al. (2007) Wyatt, M. C., Smith, R., Greaves, J. S., et al. 2007, ApJ, 658, 569, doi: 10.1086/510999
- Yalinewich & Schlichting (2019) Yalinewich, A., & Schlichting, H. 2019, MNRAS, 486, 2780, doi: 10.1093/mnras/stz1049
- Yang et al. (2008) Yang, H., Johns-Krull, C. M., & Valenti, J. A. 2008, AJ, 136, 2286, doi: 10.1088/0004-6256/136/6/2286
- Youdin & Kenyon (2013) Youdin, A. N., & Kenyon, S. J. 2013, in Planets, Stars and Stellar Systems. Volume 3: Solar and Stellar Planetary Systems, ed. T. D. Oswalt, L. M. French, & P. Kalas (Dordrecht: Springer Science & Business Media), 1, doi: 10.1007/978-94-007-5606-9_1
- Yu & Jacobsen (2011) Yu, G., & Jacobsen, S. B. 2011, Proceedings of the National Academy of Science, 108, 17604, doi: 10.1073/pnas.1108544108
- Zuckerman et al. (2012) Zuckerman, B., Melis, C., Rhee, J. H., Schneider, A., & Song, I. 2012, ApJ, 752, 58, doi: 10.1088/0004-637X/752/1/58
- Zuckerman et al. (2011) Zuckerman, B., Rhee, J. H., Song, I., & Bessell, M. S. 2011, ApJ, 732, 61, doi: 10.1088/0004-637X/732/2/61