Evolution of the spectral lineshape at the magnetic transition in Sr2IrO4 and Sr3Ir2O7
Abstract
Sr2IrO4 and Sr3Ir2O7 form two families of spin-orbit Mott insulators with quite different charge gaps and an antiferromagnetic (AF) ground state. This offers a unique opportunity to study the impact of long-range magnetic order in Mott insulators. It appears to play a different role in the two families, as there is almost no change of the resistivity at the magnetic transition in Sr2IrO4 and a large one in Sr3Ir2O7. We use angle-resolved photoemission to study the evolution of the spectral lineshape through the magnetic transition. We use Ru and La substitutions to tune and discriminate changes due to temperature from those due to magnetic order. We evidence a shift and a transfer of spectral weight in the gap at in Sr3Ir2O7, which is absent in Sr2IrO4. We assign this behavior to a significantly larger coherent contribution to the spectral lineshape in Sr3Ir2O7, which evolves strongly at . On the contrary, the Sr2IrO4 lineshape is dominated by the incoherent part, which is insensitive to . We compare these findings to theoretical expections of the Slater vs Mott antiferromagnetism within Dynamical Mean Field Theory.

I Introduction
The motion of one hole in an antiferromagnetic (AF) background is a central problem for many correlated systems, among which high temperature cuprate superconductors remain a hallmark. As moving one hole necessarily breaks some AF bonds, the charge and spin sectors become intimately intricated. The relative energy scale for charges are of the order of the charge gap , set by Coulomb repulsion U in a Mott insulator, independently of the magnetic order. AF order usually sets in at a lower temperature, depending on magnetic couplings J. Most treatments of the metal-insulator transition (MIT) are implicitely deep in the Mott insulating state and neglect the role of magnetic order. This is typically relevant for cuprates where U>>J. However, when the two energy scales become similar, closer to the MIT, the interplay between the two degrees of freedom may become quite complex Hao et al. (2019); Fratino et al. (2017). The role of AF long-range order on the MIT has been treated with DMFT theory in ref. Camjayi et al., 2006 and predicts the coexistence of Mott-like and Slater-like excitations. To our knowledge, this has never been directly compared to experiments.
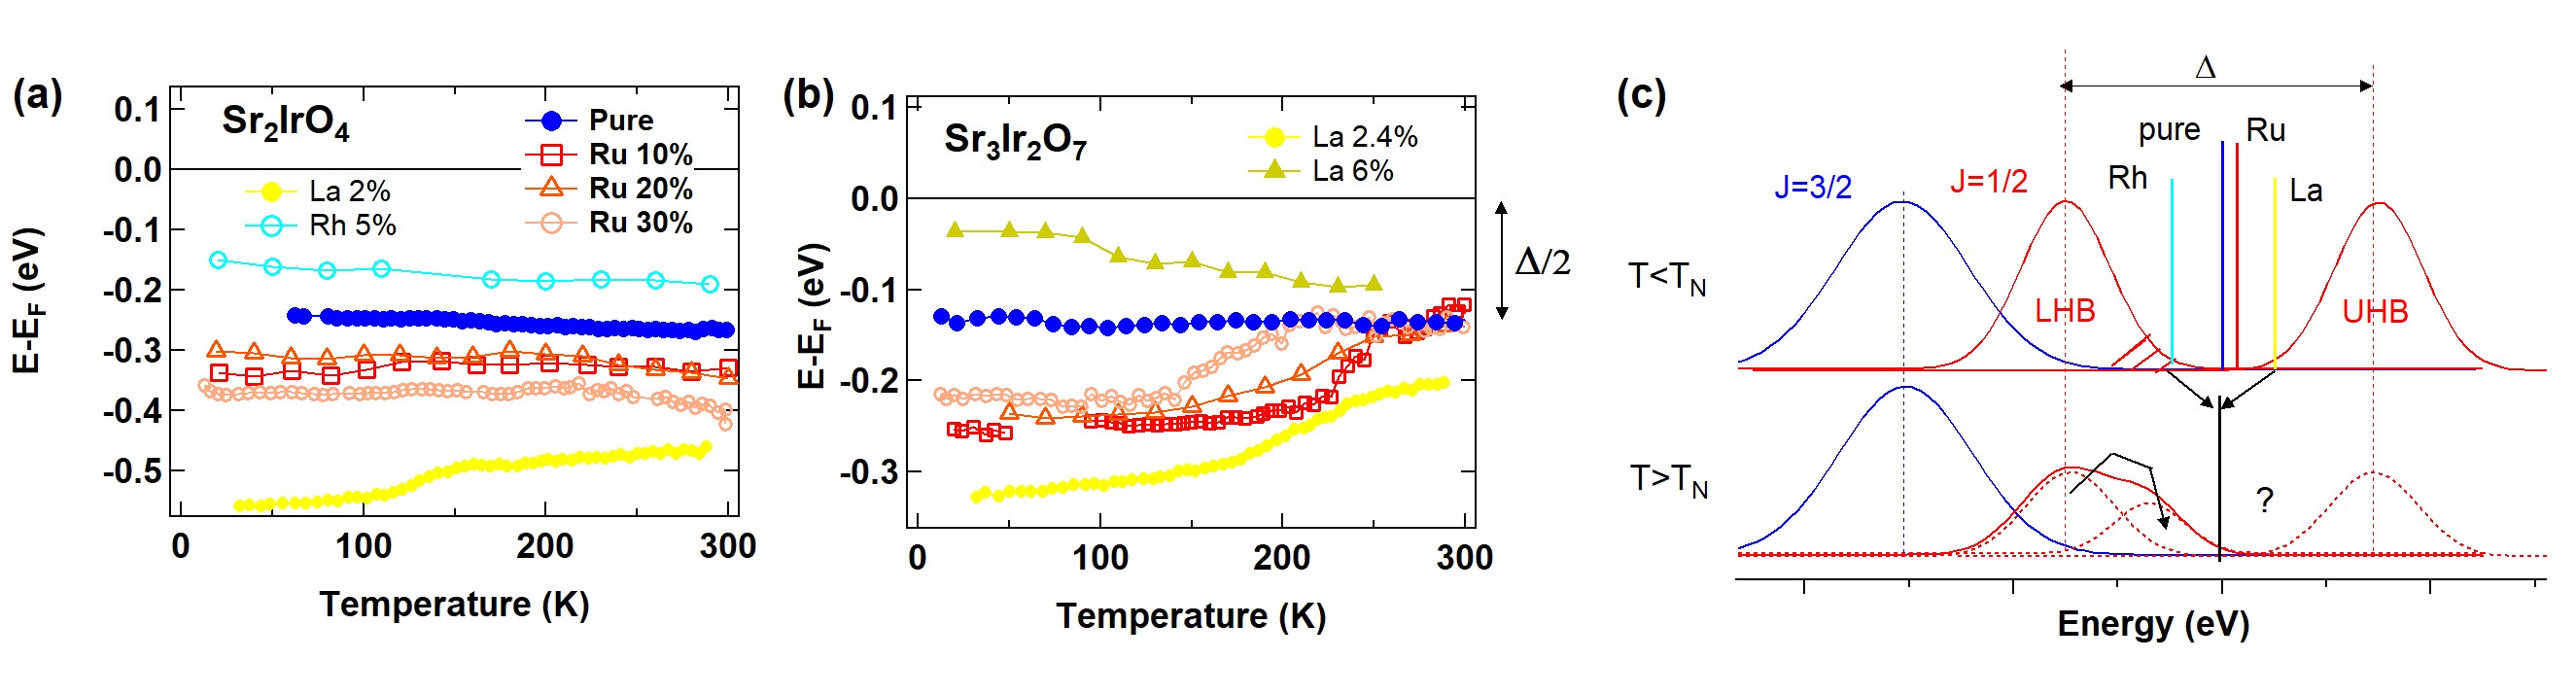
Iridates offer a unique opportunity to carry over this comparison by tuning (, J) parameters. Indeed, the first two members of the Ruddlesden-Popper perovskite serie, Sr2IrO4 and Sr3Ir2O7, have quite significantly different charge gaps at low temperatures, but similar magnetic transition temperature TN. The two families can essentially be understood Kim et al. (2008) as built from two filled J3/2 bands and a half-filled J1/2 band, which is split by the electronic correlation opening a gap (see sketch in Fig. 1a, J is the effective angular momentum). The Mott nature of the insulating state in Sr2IrO4 was supported by cluster-DMFT calculationsMartins et al. (2018). Sr2IrO4 is built from single IrO2 layers, stacked with SrO layers, and was estimated by optical spectroscopy Moon et al. (2008), STM Battisti et al. (2017); Zhao et al. (2019); Sun et al. (2021) and ARPES using a small electron doping to visualize the whole gap Brouet et al. (2015). For the bilayer version Sr3Ir2O7, the gap is smaller Moon et al. (2008); Okada et al. (2013); Zhao et al. (2021); Brouet et al. (2018). The different in the two families is essentially understood from the different effective dimensionality of the structure, leading to larger bandwidth for the bilayer compared to single layer Moon et al. (2008). There are also some more subtle differences in the electronic structures. For example, interactions within the bilayer bands in Sr3Ir2O7 leads to a non-interacting semi-metallic electronic structure with an indirect gap of 0.05eV de la Torre et al. (2014), which is simply enlarged by correlations Brouet et al. (2018); sup .
The two compounds display slight differences also in the AF magnetic structure. In Sr2IrO4 a transition takes place at TN=240K to a canted in-plane AF state, where RIXS measured Heisenberg-like magnon dispersion over 0.2eV, characterized by J=0.06eV between first neighbors Kim et al. (2012a). In Sr3Ir2O7, the magnetic transition at TN=280K gives rise to an AF order with moments along the c-axis Dhital et al. (2013). The magnetic interaction have similar order of magnitude (J=0.09eV), but the magnon dispersion is characterized by a large gap of 0.07eV due to pseudodipolar interactions in this geometry Kim et al. (2012b).
On one hand, the two compounds display insulating behavior in transport measurements above TN, up to more than 600KKorneta et al. (2010); Cao et al. (2002). This suggests that correlations, including short-range magnetic correlations, which persist above TNChen et al. (2015); Zhao et al. (2019), are responsible for the insulating properties, rather than the magnetic order. On the other hand, there is a rather strong temperature evolution in optical spectroscopy, characterized by weight appearing in the gap at high temperatures Moon et al. (2009); Ahn et al. (2016); Xu et al. (2020), indicative of bad metal properties. As the evolution is smooth and the transition temperature relatively high, it is difficult to disentangle the role of temperature and magnetic transition. These were tentatively attributed to the temperature dependence of polaronic excitations Sohn et al. (2014), but never fully clarified. More recently, Song et al. used Ru doping, which decreases TN, to correlate a transfer of spectral weight with TN in Sr3Ir2O7 Song et al. (2018). Another optical study in Rh-doped Sr2IrO4 observed a transfer of spectral weight to a mid-infrared peak, which was interpreted as a spin-polaron feature from a one band Hubbard model Xu et al. (2020). From a different viewpoint, STM favors an inhomogeneous picture, where in-gap states are observed near dopants Battisti et al. (2017); Wang et al. (2019) or defects Okada et al. (2013) and may lead to a percolative-like MIT Sun et al. (2021). Angle-resolved photoemission could in principle go further by resolving the gapped structure in k-space. Its lineshape could help understand the nature of coherent and incoherent excitations and the possible emergence of in-gap states. However, there are few ARPES data available as a function of temperature and only for Sr3Ir2O7, either pure King et al. (2013) or doped with La Affeldt et al. (2017) or 30% Ru Song et al. (2018).
In this paper, we study systematically the evolution of the ARPES lineshape through TN in Sr2IrO4 and Sr3Ir2O7 and use La Ge et al. (2011); Hogan et al. (2015) and Ru Dhital et al. (2014); Yuan et al. (2015); Calder et al. (2015) substitutions to tune TN. La substitutes out-of-plane for Sr (we define x as Sr1-xLax) and induces electron doping. This leads to the reduction of the magnetic order, which vanishes around x=0.04 Ge et al. (2011); Hogan et al. (2015). On the contrary, Ru substitutes in-plane for Ir (Ir1-xRux) and, although Ru has one less electron than Ir, it seems there is an electronic phase separation at early dopings, so that Ru dilutes the magnetic state rather than dopes it Dhital et al. (2014); Yuan et al. (2015); Calder et al. (2015); Brouet et al. (2021). A high concentration around x=0.35 is required to suppress the magnetic order and induce a metallic state.
We shall qualitatively compare our results with reference theoretical results obtained by Dynamical Mean Field Theory on the doped Hubbard Model. A detailed quantitative comparison with iridates would require employing more realistic material approaches, which can include short ranged spacial correlations (e.g. the cluster extension of DMFT), spin-orbit coupling, multi-bands effects and possibly weakly correlated bands within the ab-initio framework. However such studies, which demand future developments Martins et al. (2018); Moutenet et al. (2018); Zhang et al. (2013); Jeong et al. (2020), are beyond the scope of this paper which focus on the general properties of the antiferromagnetic Slater to Mott crossover. We shall consider two different interaction regimes: the rather weakly correlated one (= 1.7), which is dominated by the Slater AF mechanism, and the strongly correlated one (= 4), dominated by the Mott localization mechanism. We shall show that as a matter of facts many physical properties of Sr3Ir2O7 can be described with the former Slater regime, while the Sr2IrO4 well fits the latter Mott regime. This is especially true for transport, but also for the ARPES spectral lines, provided we make some assumption on features related to the chemical substitution and disorder, which can broaden the spectra and affect the Fermi level position. Our experimental-theoretical comparison shows that Ir-based oxides can provide a unique platform to study non-trivial correlation phenomena, like the evolution from weak to strong correlation, the interplay of Slater magnetism and Mott localization and the effects of doping, temperature and disorder.
II Methods
Single crystals of Sr2IrO4 and Sr3Ir2O7 were grown by a standard flux growth technique. High-purity powders of SrCO3 (99.995%), IrO2 (99%), RuO2 (99.9%) were dried, weighed, and mixed in a glove box under argon with SrCl2 (99.5%) flux. The mixture was loaded into a platinum crucible covered with a platinum tip, under ambient atmosphere, and heated in a muffle furnace. For Sr2IrO4, we used ratios 2:1:10, heated up to 1300 ∘ C and then slowly cooled down at a rate of 10∘ C/h to 800∘ C. For Sr3Ir2O7, we used ratios 3:2:5, heated at a rate of 190∘ C/h up to 1100∘ C for 6 hours and then slowly cooled down at a rate of 10∘ C/h to 600∘ C, at which temperature the furnace was turned off. Deionized water was used to dissolve the SrCl2 flux and extract the single crystals. The crystals were platelets with larger dimensions between 0.3 and 2 mm, and with the smallest dimension along the [001] direction. The exact composition of each studied sample has been determined via energy-dispersive X-ray spectroscopy (EDS) measurements in several spots of the surface of several crystals from the same batch. The structure was further refined by x-ray diffraction. The results for nine samples of Sr3(Ir1-xRux)2O7 with x in the 0-0.78 range are given as supplementary material.
ARPES experiments were carried out at the CASSIOPEE beamline of SOLEIL synchrotron, with a SCIENTA R-4000 analyser, 100 eV photon energy and an overall resolution better than 15meV.
DMFT calculations where performed on the Hubbard Model, the reference playground to study correlated phenomena Georges et al. (1996). The model has the typical semi-circular density of states of bandwith , which fixes the energy unit throughout the paper. The DMFT is implemented by means of the continuous time diagrammatic Quantum Monte Carlo Gull et al. (2011). Spectra are obtained via analytic continuation of the one particle propagator performed by the Maximum entropy method Levy et al. (2017). DMFT allows to unbiasedly access the paramagnetic insulating and metallic states, as well as the ordered antiferromagnetic insulatorCamjayi et al. (2006); Fratino et al. (2017). Here we shall study how these states evolve and compete upon doping the system with holes.
III Resistivity behavior
A clear indication of the different role of the magnetic transition in the two families is already evident in the evolution of resistivities plotted in Fig. 1. The arrows indicate TN, as determined from magnetic measurements (by SQUID in Sr2IrO4 and neutrons in Sr3Ir2O7 Dhital et al. (2014); Hogan et al. (2016); sup ). There is almost no change in Sr2IrO4 at TN, while there is a clear anomaly in Sr3Ir2O7 leading to a more conducting state in the paramagnetic regime.
The resistivity does not follow a simple activated behavior on the full temperature range. Fitting to an activated law between 100 and 200K gives a gap of the same order of magnitude in the two systems, 60meV. This is much smaller than the gap previously evaluated. It can be understood as the smallest energy distance between the tail of the peaks (see Fig. 1a). This emphasizes the importance of in-gapped low energy states in these systems, but also that limited information on the evolution of can be extracted from resistivities alone.
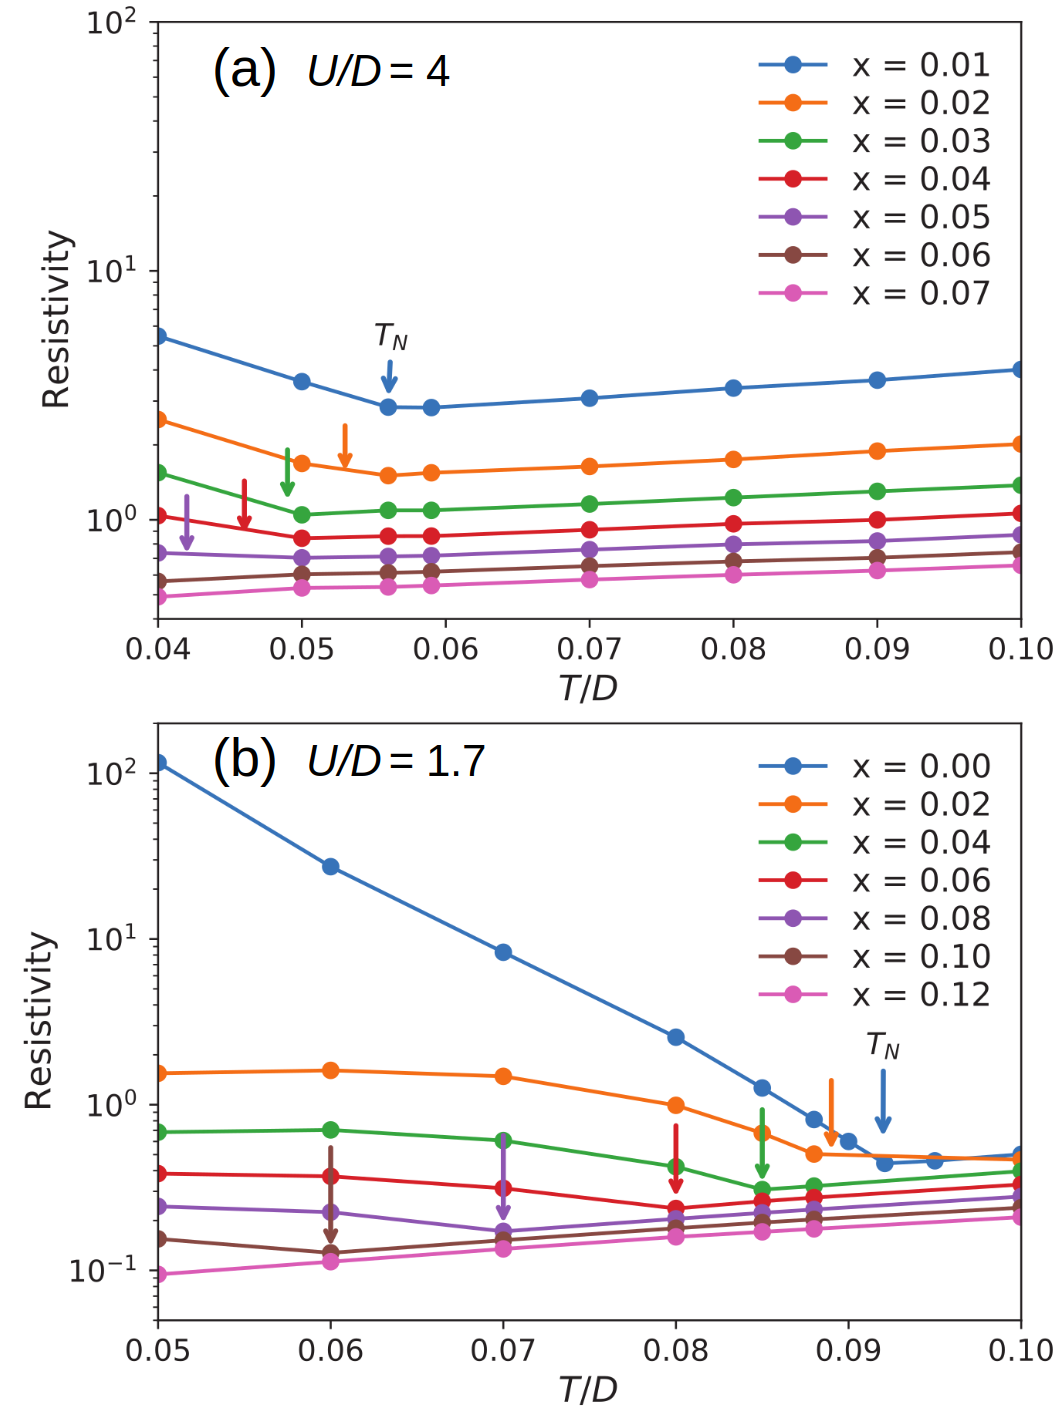
This qualitative behavior is in good agreement with what is expected within a Slater-to-Mott antiferromagnetic crossover. To show this point, we plot in Fig. 2 the resistivity vs temperature obtained by DMFT for two values of the interactions strength, (panel a), which is deep in the strongly correlated Mott regime, and (panel b), which is in the weakly correlated regime. The system is lightly doped, up to .
These theoretical curves display a qualitative behavior in line with what is observed in the experimental curves described above in Fig. 1. Namely, in the correlated regime, alike to Sr2IrO4, the resistivity vs curve is rather flat and does not display any anomaly in correspondence to the antiferromagnetic transition temperature . In sharp contrast, the weakly correlated regime looks like Sr3Ir2O7, clearly displaying an anomaly in the curve in line with . These features disappear at higher doping level in the absence of magnetic transition.
In tracing the comparison between these experimental and theoretical resistivity curves, some caveats must be taken into consideration. In the strongly correlated regime , the system immediately becomes metallic upon doping, though the metallic character is very weak (for example, the absolute value of the resistivity on a doped state curve for is an order of magnitude higher than the resistivity of the weakly correlated case). In a real material, such a state would likely display insulating-like properties. Disorder, not taken into account in our theory, can play an important role and localize a small number of carriers. This was observed for instance in Rh-doped Sr2IrO4 Louat et al. (2018). Overall, our theory-experiment comparison enforces the interpretation that Sr2IrO4 is deep in the Mott state, while in Sr3Ir2O7, both correlation and Slater antiferromagnetism play a key role.
IV Overview of ARPES lineshapes
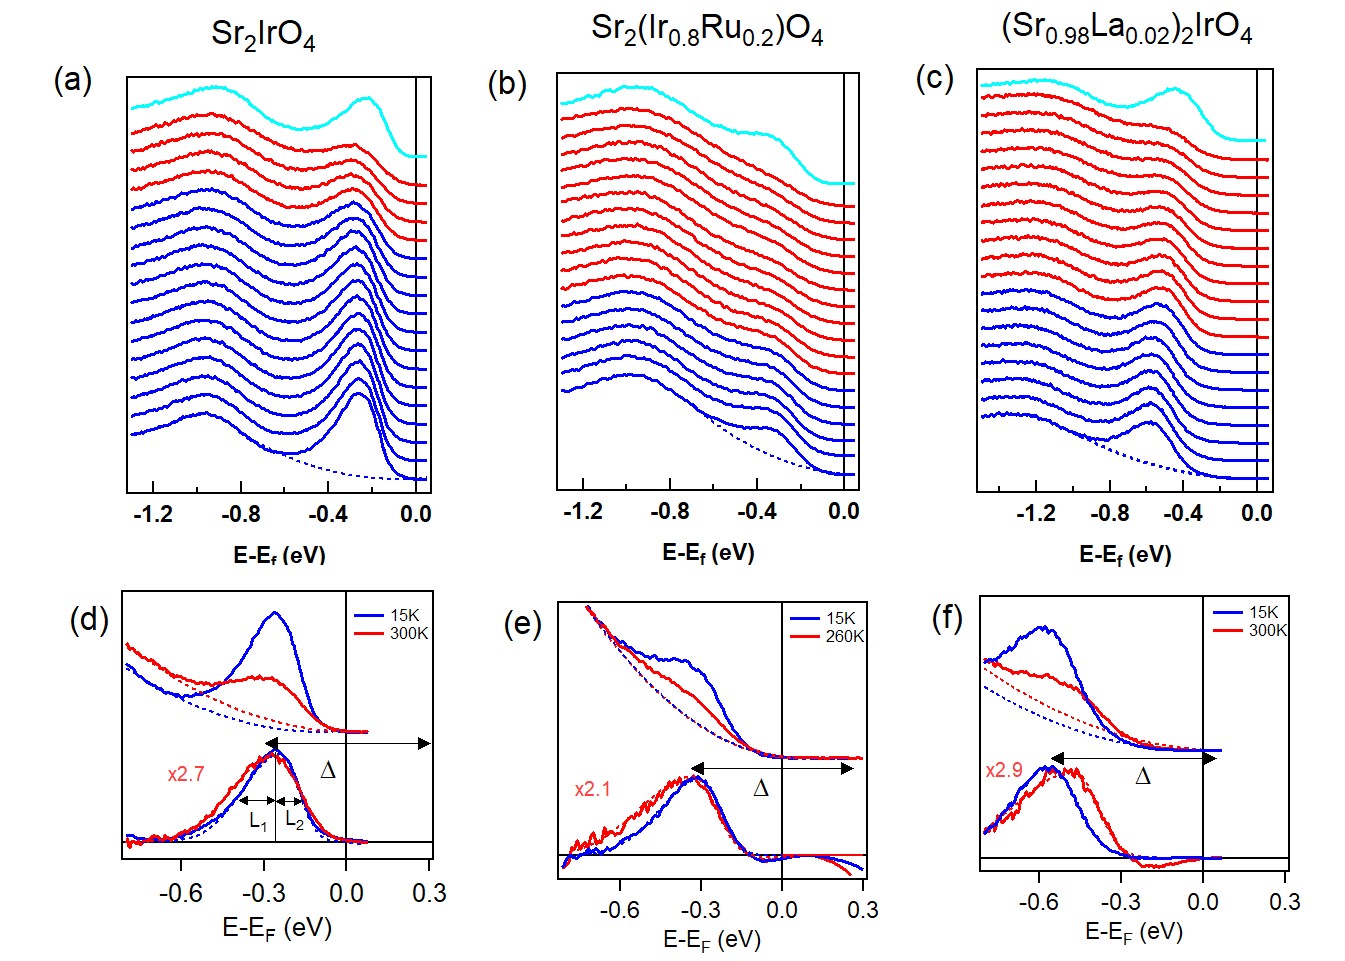
Fig. 3 and 4 present ARPES Energy Distribution Curves (EDC) as a function of temperature taken at the top of the J1/2 band, located at the X point of the reciprocal space (see supplementary material sup for a sketch of the electronic structure). The position of the magnetic transition is indicated by the change of line color (blue to red). In each family, we examine three cases : pristine compound (TN=240K for Sr2IrO4 and 280K for Sr3Ir2O7), doped with 20% Ru (TN=150K and 180K respectively) and with a few percent La [TN=200K (2% Sr2IrO4) and 130K (2.4% Sr3Ir2O7)]. More dopings are presented in supplementary information, these ones illustrate the universality of the behavior. Two bands can be observed in each EDC, J1/2 around -0.2/-0.3 eV binding energies and J3/2 around -0.8/-1eV Brouet et al. (2015, 2018). At the bottom of Fig. 3 and 4, we show superimposed spectra at low and high temperatures. To isolate the shape of the J1/2 peak, we subtract a parabolic baseline (bottom, see supplementary material sup for more details). The spectra are scaled to their total area. The high temperature spectra is magnified by the indicated number to better compare the lineshapes.
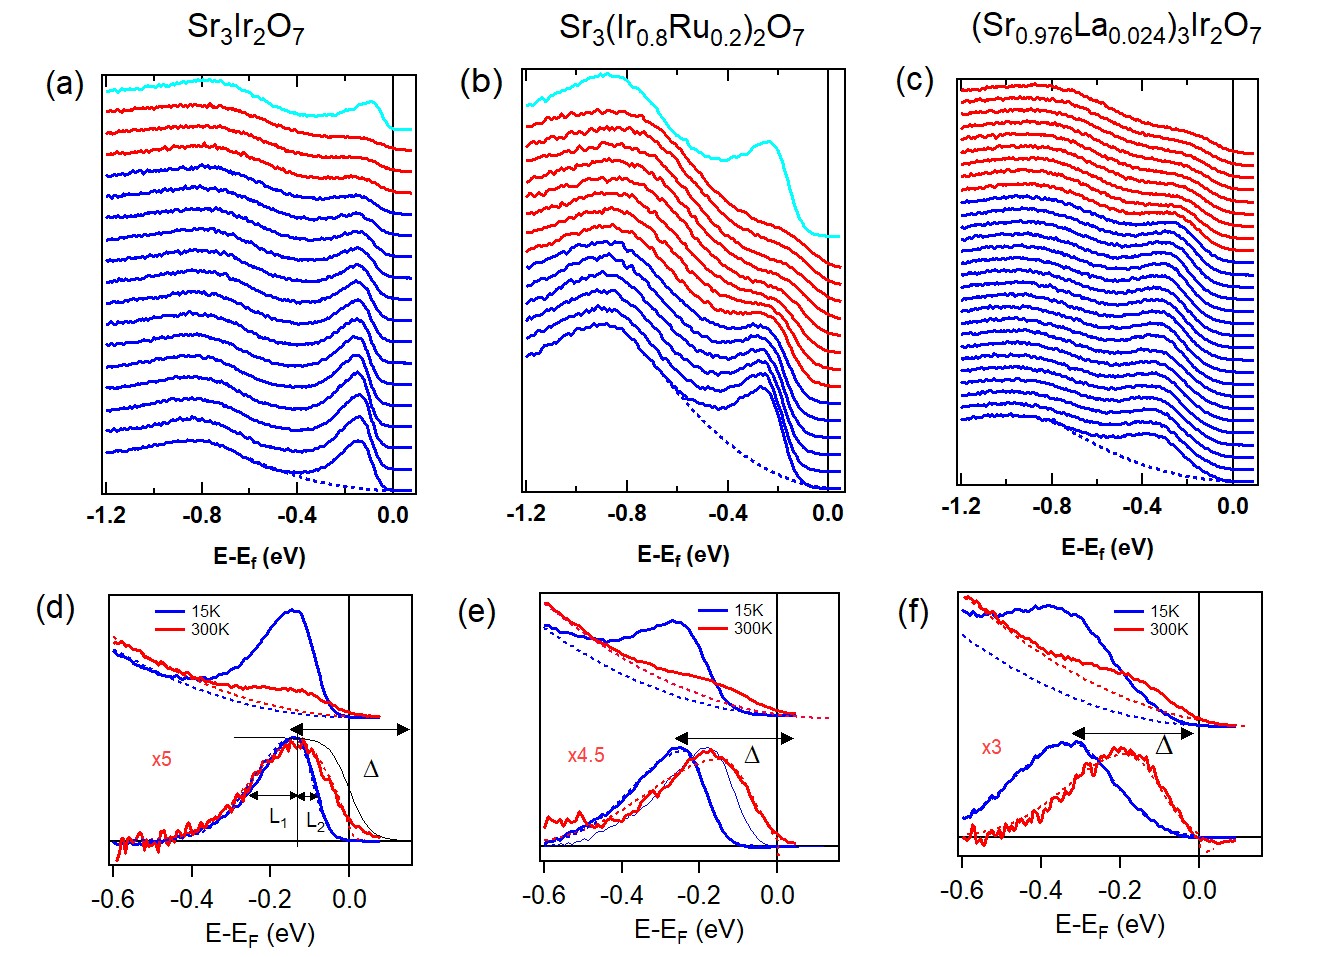
For the pure compounds, a gap opens up in J1/2 at X. The Fermi level is roughly in the middle of the gap estimated by STM and optics for the undoped systems. The peaks are quite broad (0.2eV at half maximum for Sr2IrO4 (Fig. 3d) and 0.15eV for Sr3Ir2O7 (Fig. 4d) and the distance between the tail of the peaks will be significantly smaller than the peak to peak positions, in agreement with the smaller gap dominating the resistivity, as indicate in Fig. 1a. For a quasiparticle (QP) excitation, the ARPES lineshape should be lorentzian-like with a width given by the QP inverse lifetime. However, the peak here is rather gaussian-like, asymmetric and much broader than what would be expected for a QP. This situation is common to many insulating oxides, as cuprates Kim et al. (2002) or manganites Dessau et al. (1998). This suggests a composite nature of the line, where the spectrum is the envelope of a distribution of excitations. A possible origin is the formation of polarons Perfetti et al. (2001); Dessau et al. (1998); Shen et al. (2004), as was actually proposed to explain the ARPES linewidth in Sr3Ir2O7 King et al. (2013). In this case, the shape of the peak is fixed by the strength of electron-phonon coupling, asymmetric for low couplings and gaussian for higher ones. As there is no obvious reason why the electron-phonon coupling should be different in Sr2IrO4 and Sr3Ir2O7, this picture does not explain easily the much more asymmetric lineshape of Sr3Ir2O7. Also, we will see that the lineshape changes at TN, whereas no strong evolution of the electron-phonon coupling would a priori be expected there. Indeed, Raman experiments, which are sensitive to the phonon renormalization due to pseudospin-lattice coupling, do not evidence large changes at TNGretarsson et al. (2017).
When the samples are lightly doped, the gap essentially does not change (as will be justified later), but the Fermi level moves inside the gap, as a result of filling of the first available states. In Sr2IrO4 (Fig. 3), there is no big change of the lineshape between high and low temperatures, except for a slight broadening on both sides. In particular, there is no sudden shift at TN, implying that the gap does not suddenly close. The J1/2 peak intensity however is strongly supressed at high temperature. This effect is only partially reversible and it is difficult to disentangle the role of the temperature increase and of TN in this intensity loss.
On the contrary, in pure Sr3Ir2O7, there is a clear deformation of the spectrum, which extends towards (see Fig. 4). The leading edge shifts up by 50meV, but remains away from . A comparison with a Fermi-Dirac distribution at 300K (black line) suggests a remaining "pseudogap" of 50meV in Fig.4d. Nevertheless, some residual density appears at , which is consistent with a bad metallic character. The peak maximum itself has not moved significantly, ruling out a sudden collapse of the gap at TN. This comparison implies that the difference between the two systems is more complex than a gap simply closing in one case and not the other. It seems rather related to a transfer of weight in the gap for Sr3Ir2O7 that is not present for Sr2IrO4. In doped Sr3Ir2O7, there is in addition a clear shift of the spectra towards , both for J1/2 and J3/2, bringing weight at the edge of . As J3/2 should not be affected by a gap closure in J1/2, this behavior suggests a shift of inside the gap. To compare the lineshape, we shift the low temperature spectra to the high temperature one for 20% Ru (thin blue line, shifted up by 70meV). This reveals a similar change of the lineshape as for the pure, with a characteristic extension of the spectrum towards . The comparaison is more difficult for the La case, where the low temperature spectrum is broader than the other ones, especially towards . This is probably due to some distribution in La content, which hides the intrinsic lineshape at low temperatures.
V Change at
We now study how these temperature evolutions correlate with the magnetic transition. The magnetic transition is quite broad in doped iridates, probably proceeding through some phase separated region Dhital et al. (2014). For Sr2IrO4, we define by the onset of the ferromagnetic signal in SQUID measurements sup . This is not possible for Sr3Ir2O7, where this signal is very weak, and we rely on neutrons scattering performed in Ru Dhital et al. (2014) and La Hogan et al. (2015) doped Sr3Ir2O7. We define two temperatures limiting the magnetic transition, where magnetic Bragg peaks appear, and where their intensity saturates. Experimentally, it is this latter value that corresponds to the anomaly of resistivity, reported as TN on Figure 1. To characterize the temperature dependence of the lineshape, we fit spectra at each temperature to an asymmetric gaussian, as shown in Fig. 3d and 4d. This emphasizes the key evolution we have described and limits the number of parameters (more examples of fits are shown in the supplementary material sup ).
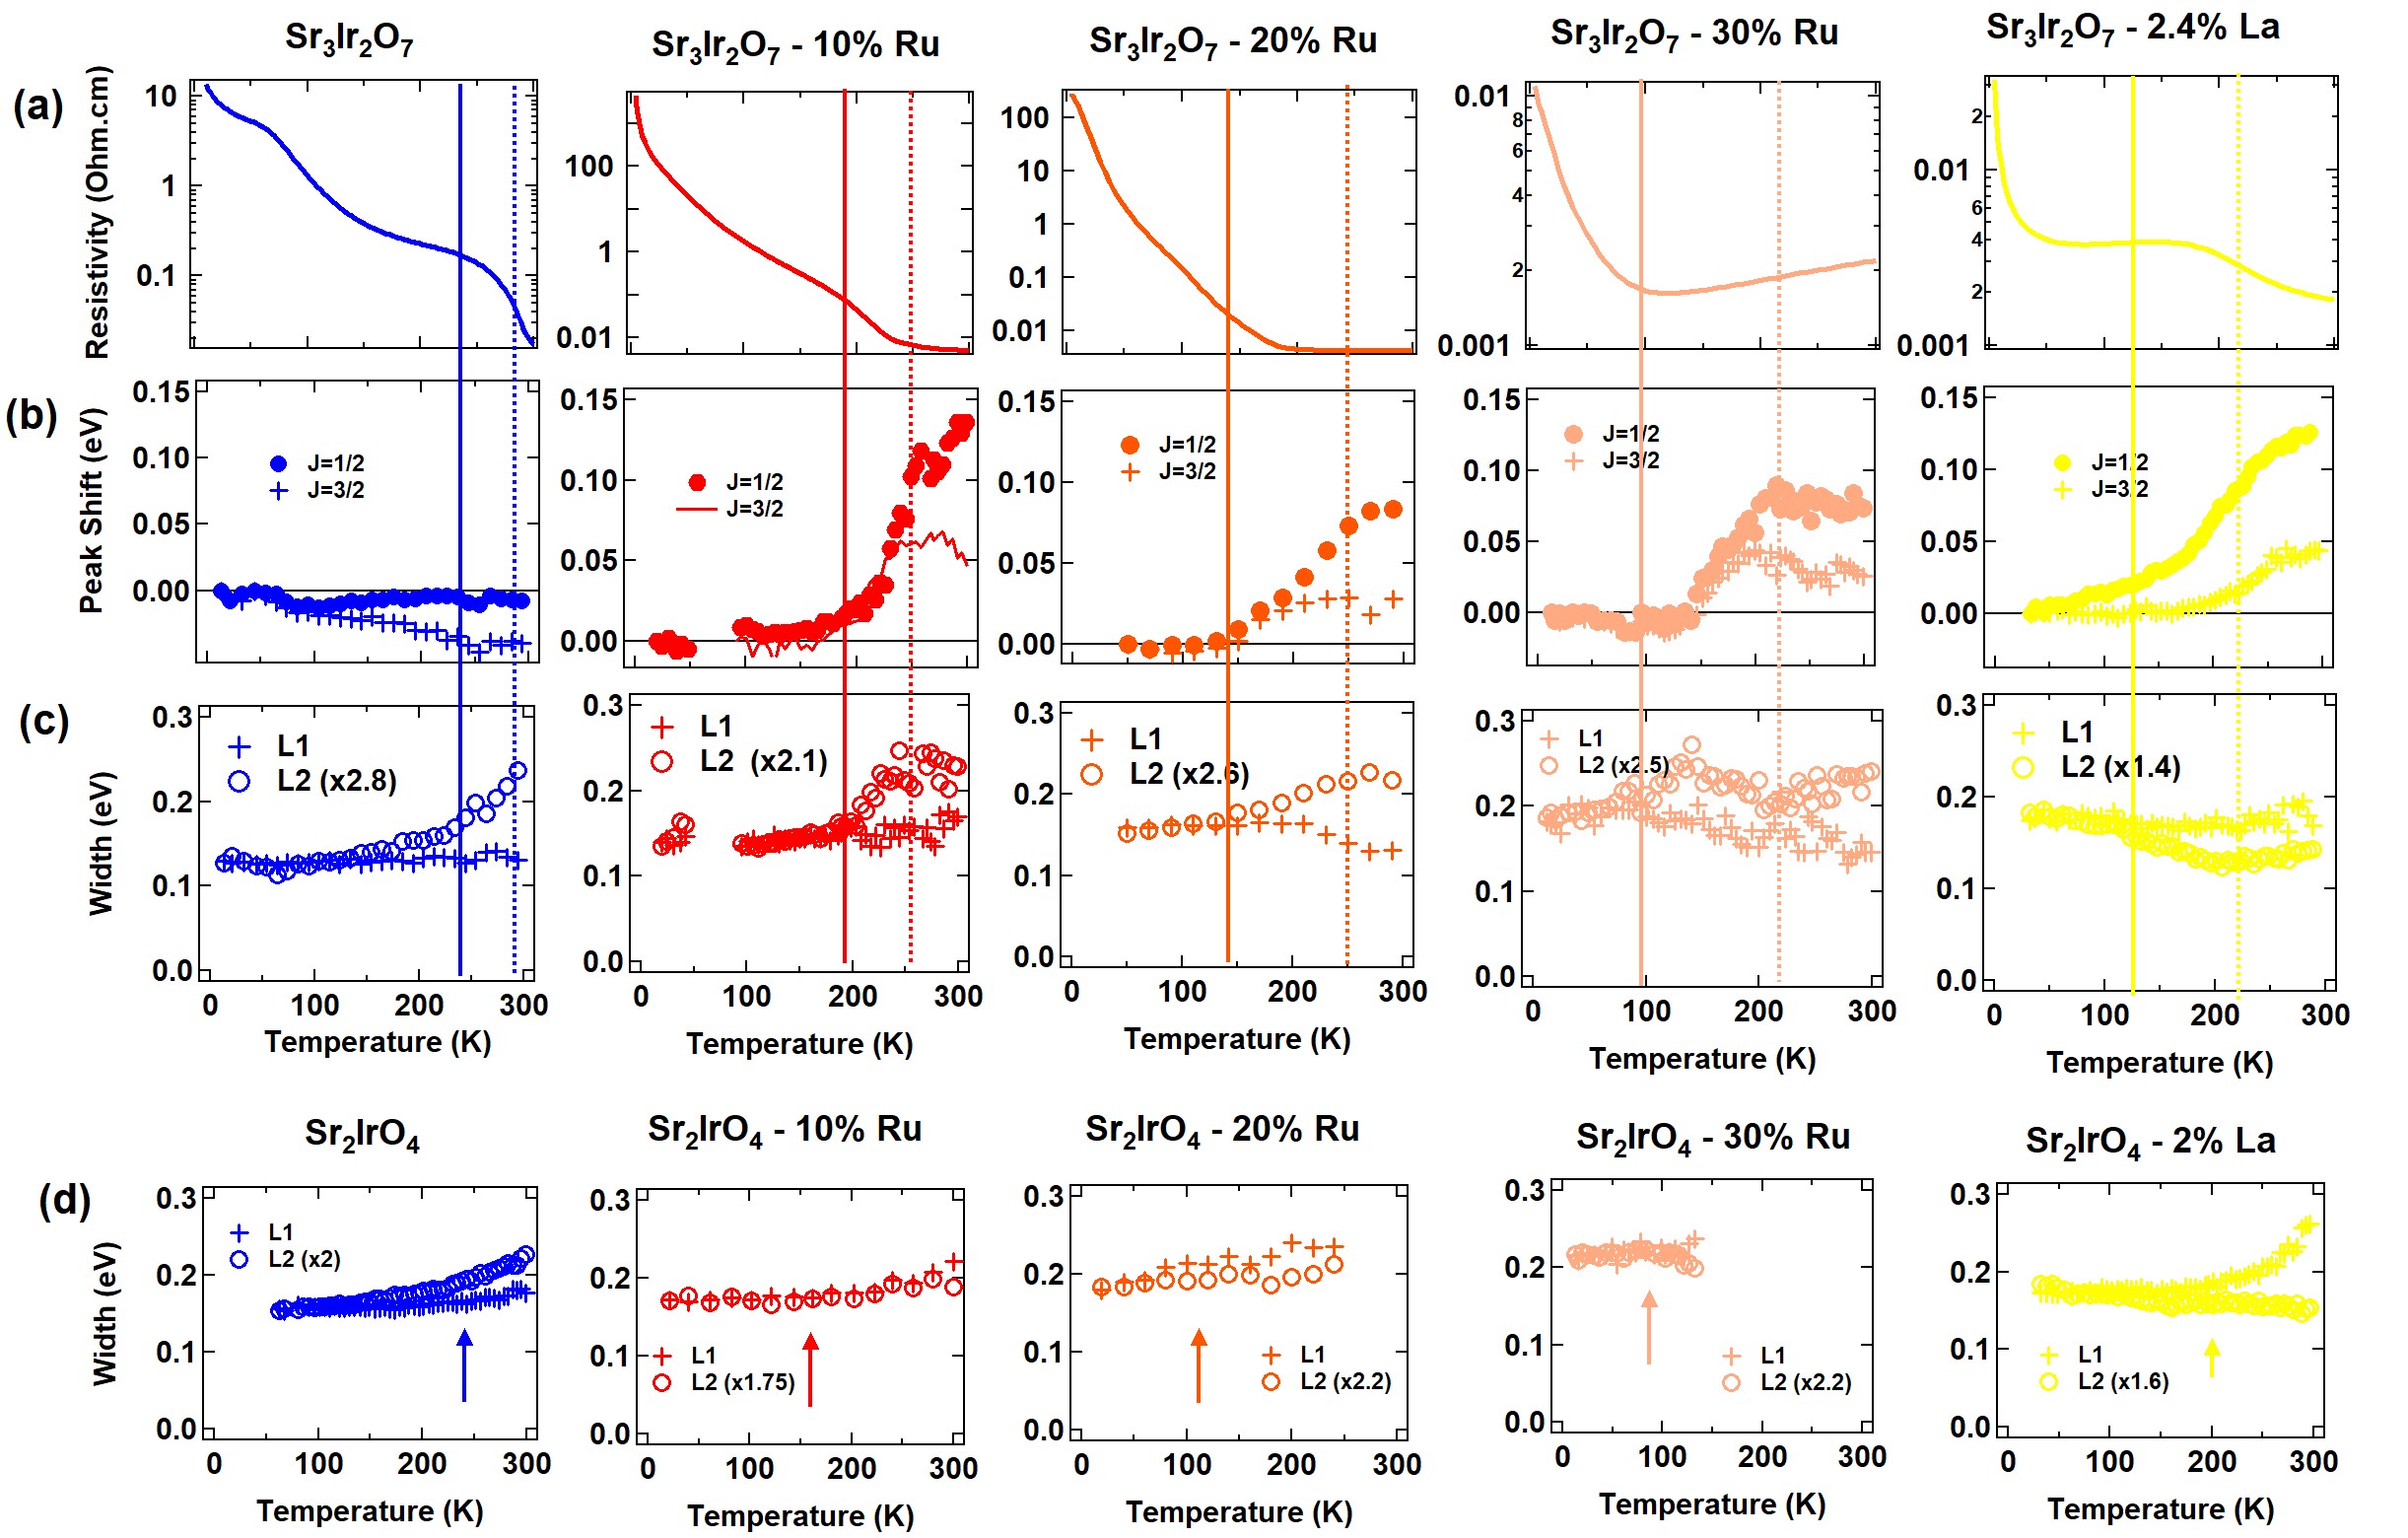
We first focus on Sr3Ir2O7 where there are clear changes. In Fig. 5a, we observe that the change in resistivity starts at (solid line) and evoluates until roughly (dotted line). Similarly, the shift of the peak position of J1/2 at X, shown in Fig. 5b, is precisely tied to the magnetic transition, it starts at and saturates above . We compare it to the shift of J3/2 observed at (details are given in supplementary sup ) and find that it exhibits a very similar temperature evolution, although smaller by a factor 2. This suggests that the shift is at least partly due to a motion of in the gap and not simply to a change in the energy scales and .
Interestingly, the lineshape also changes at the magnetic transition. In Fig. 5(c), we present the two widths of the asymmetric gaussian, (towards high binding energies) and (towards ), scaled to the low temperature value. We find that they are roughly constant below , but increases above , strongly diverging from , which remains constant or even decreases. This is in agreement with the evolution described in Fig. 4, where only the low energy side of the peak changes at high temperature. This however further demonstrates that this evolution is triggered by magnetic ordering. A first possibility would be that this reflects a distribution of positions arising above . As we have seen that the transition is quite inhomogeneous, it has to be considered. However, a narrower lineshape would then be expected again, when the sample has fully transited, contrary to our observation (the linewidth saturates but remains broad above ). Therefore, although disorder certainly plays a role, it cannot explain the broadening above . We then assume that spectral weight is transferred in the gap, deforming the lineshape towards .
This behavior (both the shift and the spectral evolution) is intrinsic to Sr3Ir2O7. In Fig. 5(d), we give a similar view of the evolution of the widths in Sr2IrO4 (we could not fit reliably the widths at high temperature for high Ru dopings, the spectral weight becoming too small to be separated from the background). They do not point to a systematic change of lineshape at . The width broadens moderately with increasing temperature, but it is sometimes that is largest (La doped) or (pure) or they remain similar (Ru doped), with no clear anomaly through .
In Fig. 6(a-b), we summarize the evolution of the J1/2 position in the two families. For Sr2IrO4, there is no particular shift at TN. In the case of La, we observe a small shift with temperature, but it is not happening at (200K in this case) and it could be due to the formation of defect states in the gap moving to a new position. Indeed, it is not completely reversible (see Fig. 3c). For completeness, we add the case of a small hole doping of Sr2IrO4, obtained by 5% Rh Louat et al. (2018) (TN=170K), which confirms the absence of shift at in Sr2IrO4 family.
For Sr3Ir2O7, the shift is significant for all doped compounds and Fig. 6(b) further reveals that all peaks seem to converge to the position of the pure at high temperature, independently of the doping. For the pure compound at low temperature, this position is well understood as corresponding to a Fermi level in the middle of the Mott gap, at /2. This convergence then means that the Fermi level is fixed at /2 at high temperatures, for all dopings. This also implies that there remains a Mott-like energy scale above TN for both families.
Fig. 6(c) summarizes our understanding of the evolution. At low temperatures, the position of the Fermi level is fixed by the doping. It is either near the middle of the gap (pure compound), at the tail of UHB for electron doping (La case) or LHB for hole doping (Rh case). For more disordered situations (Ru case), it is found at intermediate position. Above , the Mott-like gap is not closing suddenly, neither for Sr2IrO4, nor for Sr3Ir2O7. There is a remaining LHB at /2 in both cases, which still dominates the spectral weight. However, spectral weight is transferred in the gap, in a much more pronounced way for Sr3Ir2O7 than Sr2IrO4, and this transfer starts and stops over the width of the magnetic transition. This transfer fixes the position of the Fermi level at the center of the energy scale, overruling the previous disorder/doping dependent position and producing a shift of the spectra in doped cases. By comparison, the absence of shift in Sr2IrO4 appears as a sensitive sign that there is no significant change of the in-gap structure.
To distinguish the "filling" of the Mott gap, from a "closure", we add the case of a higher La doping of 6% in Sr3Ir2O7, where the metallic state is realized de la Torre et al. (2014); Brouet et al. (2018) (dark yellow triangles in Fig. 6(b)). Clearly, the peak is much closer from at low temperatures in this metallic compound. We will further show in Fig. 8 that the lineshape is also completely different, with a narrow peak.
VI Discussion
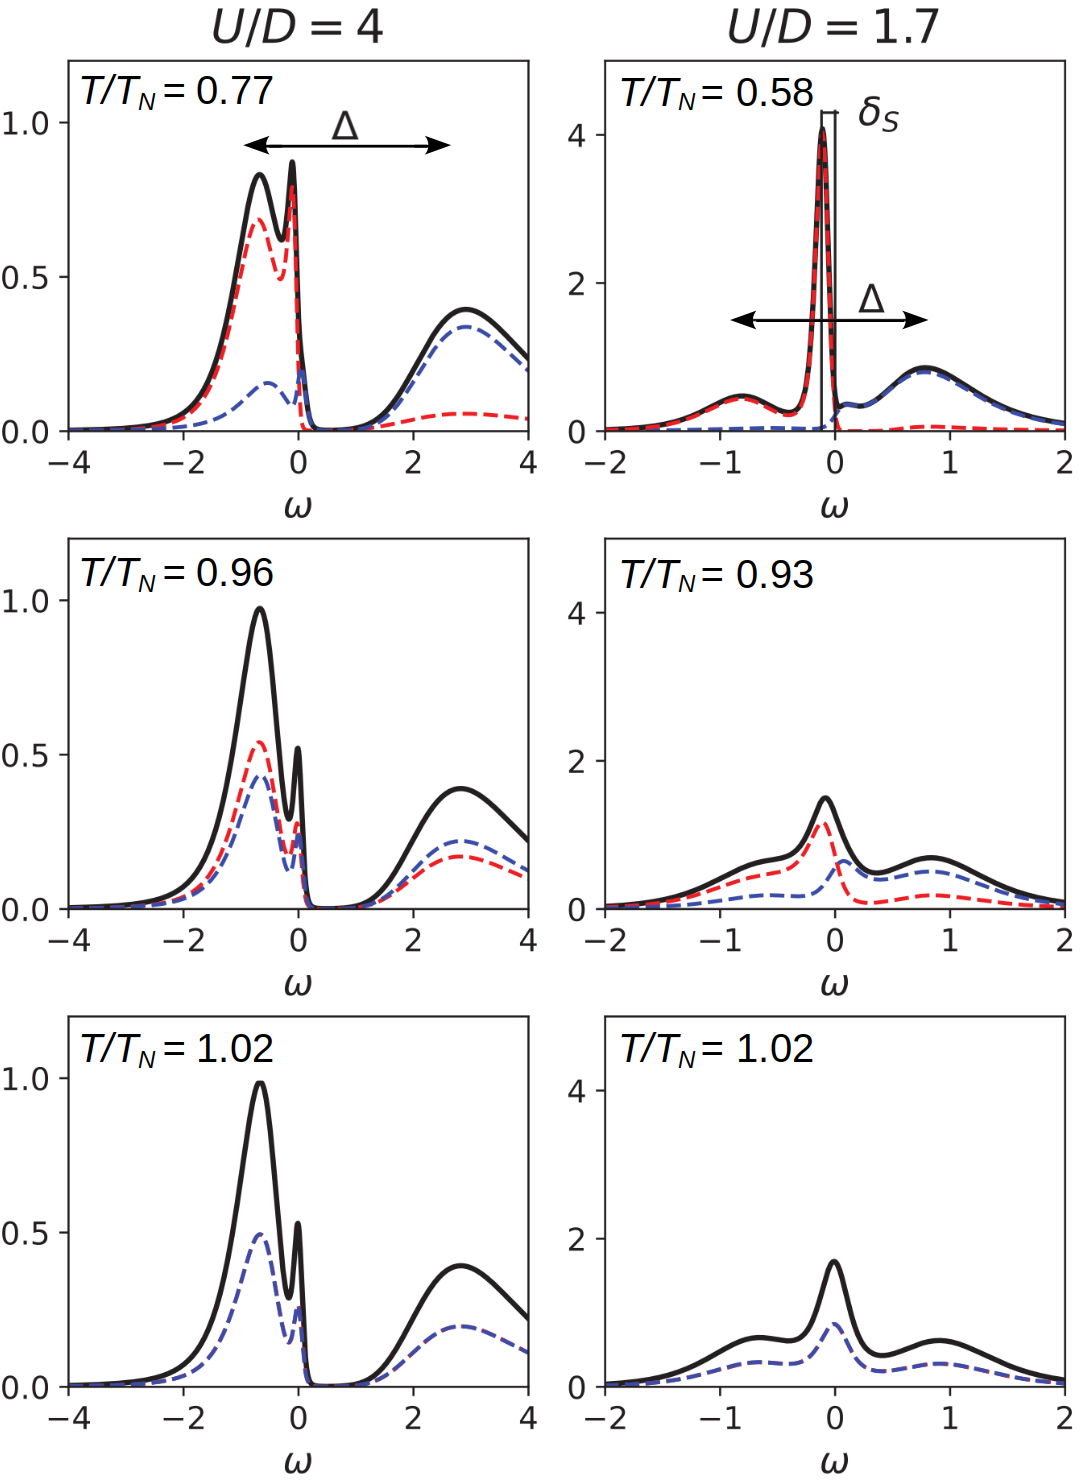
We now compare these experimental spectra with the theoretical expectations in a Mott vs Slater scenario. For this purpose we show in Fig. 7 the DMFT spectra of the Hubbard Model at small doping. On the left column we display the strongly correlated Mott regime (), on the right one the weakly interacting Slater regime (), for increasing temperature (from top to bottom). The system is at small hole doping, and , for strong and weak correlations respectively. Spectra put into evidence the sharp difference between the Mott and the Slater mechanism closing of the gap above .
In the Mott regime a Mott energy scale is well defined at low temperature, marked as on the top left panel, separating the LHB from the UHB. Upon doping, a small QP peak appears at the Fermi level, at the upper edge of the LHB. The AF is evident from the strong spectral weight differentiation between the spin up (red dashed line) and spin down (blue dashed line) species. This weak QP peak feature in the strong correlation regime is likely to be washed away by disorder and impurity effects in a real material. Indeed, we have seen with Figure 1 that lightly doped Sr2IrO4 is not immediately metallic, contrary to this prediction, and that is not fixed to the upper of LHB, but remains within the gap, at a position depending on doping and/or impurities. The key point is that upon increasing temperature, the spectra are little affected, and AF is suppressed only by recovering the balance between the spin up and spin down spectral weights.
In the Slater regime, we can still identify a Mott energy scale , separating the LHB and the UHB, though, with respect to the correlated Mott regime, this scale is now renormalized to a smaller value than the onsite interaction . Much more pronounced QP peaks appear now at the edges of the Hubbard bands and they define a small gap around the Fermi level. This gap is this time opened by the AF mechanism (besides the spin up and spin down spectral weight differentiation), separating spin up and spin down QP-like peaks. This is the key difference with respect to the Mott regime, for which the QP peak, though weak, is at the Fermi level even at small doping and T<TN. Upon increasing the temperature, while the Mott scale is only slightly affected, the low energy scale collapses at the transition temperature . At the same time the spin up and spin down spectral weight imbalance disappears. The distinctive feature is that with the closing of the energy scale, a sharp increase of spectral weight appears at the Fermi level explaining the "anomaly" observed in the resistivity.
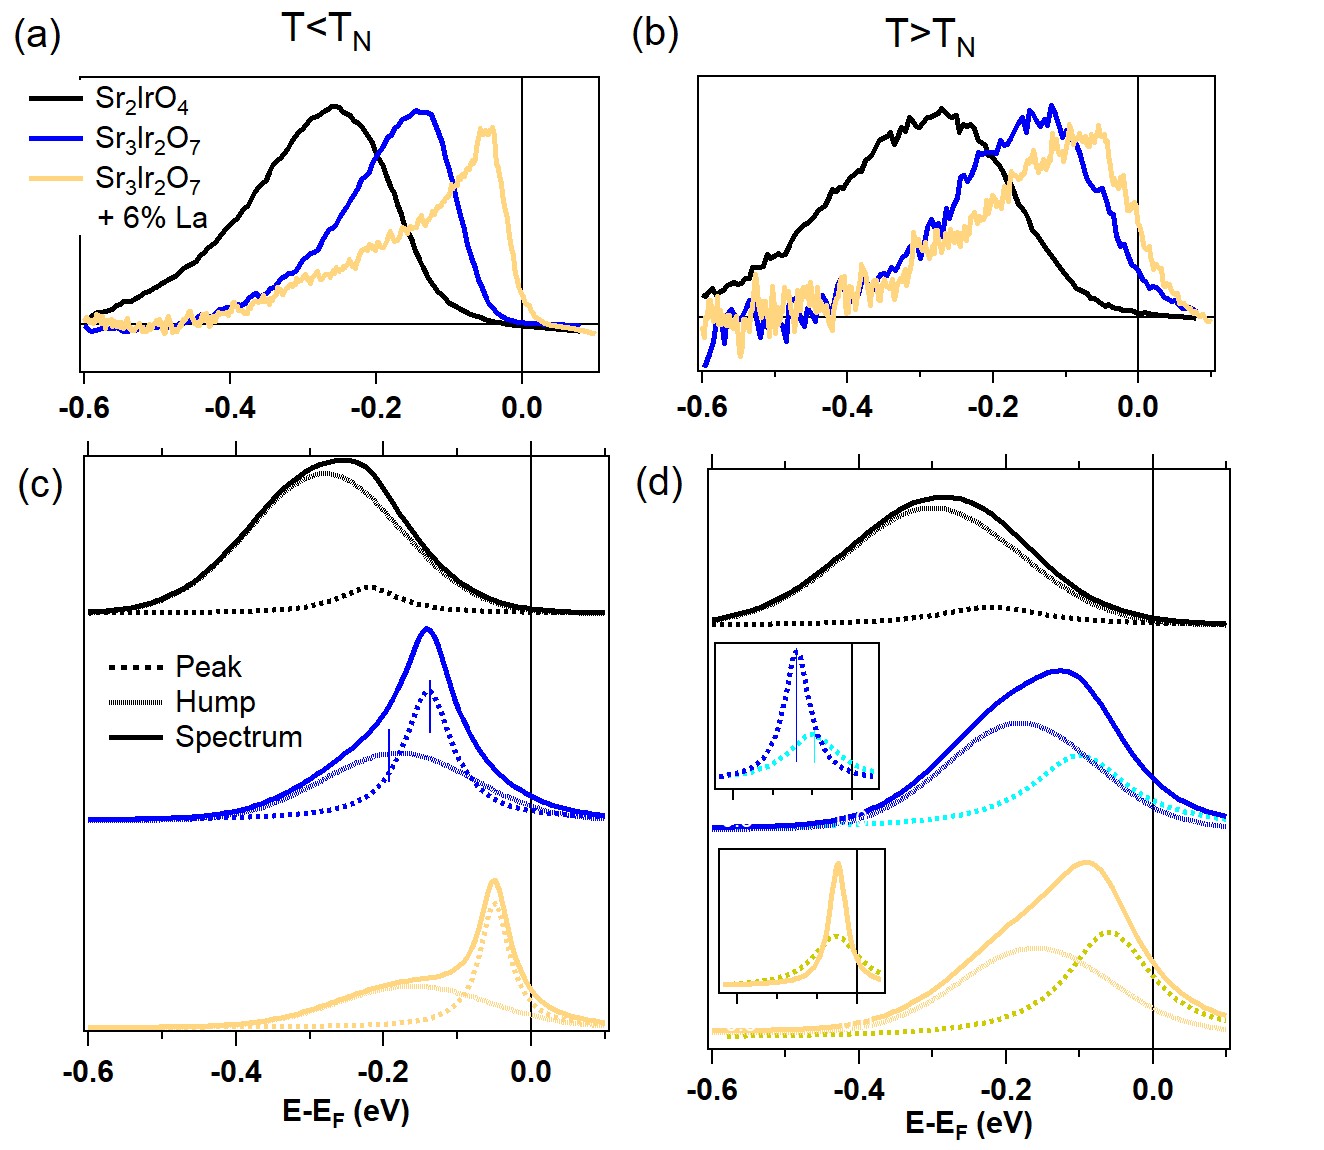
We now attempt a direct comparison between the experimental spectra and the two theoretical scenarios. In Fig. 8(a-b), we compare three different ARPES lineshapes (a baseline has been subtracted) for large gap (Sr2IrO4), smaller gap (Sr3Ir2O7) and a metallic case (Sr3Ir2O7 with 6% La). We find that the lineshape at low temperature in Sr2IrO4 (=0.15 and =0.08eV) is broader and more symmetric than in Sr3Ir2O7 (=0.12 and =0.05eV). It narrows down significantly in the metallic state, where a peak with =0.025eV dominates. Although none of the spectra exhibits a well resolved peak-hump structure, as for the theoretical spectra, it may be present but hidden by broadening. Assuming this, the different lineshapes mean that the hump dominates in Sr2IrO4, the peak and the hump have similar contributions in Sr3Ir2O7 (building a more asymmetric shape) and the peak dominates in doped Sr3Ir2O7, as sketched in Fig. 8(c) for low temperatures. As there is no well defined separation between peak and hump, it is of course impossible to refine the fitting further. However, it gives a simple and natural way to explain the evolution from the more insulating state to the more metallic situation, by simply transferring weight from the broad hump to the peak. Such a decomposition was actually already proposed to describe the insulator to metal evolution of the lineshape in Sr3Ir2O7 doped with La He et al. (2015).
The very interesting point is now to use this underlying structure to better understand the evolution at . The experimental high temperature spectra after background subtraction are compared in Fig. 8(b). The absence of sensitivity of Sr2IrO4 to can be explained if the incoherent hump is not sensitive to the magnetic order. This is in agreement with the theoretical scenario for the strongly correlated case, where most of the weight correspond to the Hubbard bands. In Sr3Ir2O7, most of the changes are due to the evolution of the coherent peak. More specifically, to explain a more symmetric lineshape, the coherent peak has to shift towards , as sketched in the inset of Fig.8(d). This is in agreement with the closure of the gap described before in the theory of the weakly correlated case. This suggests to identify the and energy scales. We note that the shift in Sr3Ir2O7 is only indirectly due to the closing of . The main driving force for the shift is the relocation of the Fermi level at the middle of the energy scale. Interestingly, there is a clear difference in theory for this position in the Mott and Slater cases at small dopings. In the Mott case, the QP peak forms at the edge of the Hubbard band without a gap. In contrast, in the Slater case, the QP forms at the edge of the remaining "Slater" gap , around /2. In the experimental case, it seems that as long as a gap is open (either or ), extrinsic degrees of freedom (disorder/impurities/dopant) may fix the position of the EF within the gap. Indeed at low temperatures, the peak poistions are similar in Sr2IrO4 and Sr3Ir2O7 for the same dopings. On the other hand, as soon as the low energy gap closes, EF is fixed to the theoretical position, inducing a shift in the weakly correlated case.
In Fig. 1, there is obviously a continuity between the metallicity found at high temperatures in the compounds keeping a magnetic ground state and the completely metallic ones. This decomposition bridges the two behaviors. The evolution in metallic Sr3Ir2O7 implies a rather large broadening of the peak with increasing temperature. Consequently, it is not well resolved from the hump anymore at high temperatures and the metallic nature of this spectrum is not obvious. Indeed, the lineshape for Sr3Ir2O7 pure and doped with 6% La are very similar (Fig. 8b). This is why identifying the nature of the metallic state at high temperatures was difficult. This decomposition offers a qualitative understanding, but, here again, any more advanced fitting is impossible as it is difficult to separate not only the coherent part from incoherent part, but also the incoherent part from the background at high temperatures.
VII Conclusion
Iridates offer a unique opportunity to study the crossover from Mott to Slater behaviors as a function of correlation strength. Although there are many examples of Mott oxides with magnetic transitions Kovaleva et al. (2004); Gorelov et al. (2010), there is often an orbital degree of freedom, which complicates the analysis of the mere impact of long-range magnetic order on the Mott state. This is not the case in iridates, where the filled J3/2 states do not take an active part in the transition. Here, we have studied the evolution of ARPES lineshapes corresponding to the half-filled J1/2 across the temperature driven magnetic transition in Sr3Ir2O7 and Sr2IrO4 compounds, using different dopings to establish the universality of the behavior. We have then compared our results to theoretical expectations within the Dynamical Mean Field Theory.
We argue that iridates are intermediately correlated systems, where the ARPES lineshape is formed by a continuity between incoherent Hubbard-like features and coherent QP-like excitations. In the more weakly correlated compound Sr3Ir2O7, a key change of the spectral lineshape at the magnetic transition is a broadening towards , which we attribute to a shift of the coherent weight towards . This result agrees with the closing of a coherent "Slater" gap at the magnetic transition expected by DMFT in the weakly correlated regime. This coherent weight coexists with incoherent features, centered at the position of Hubbard bands /2. In contrast, we find that the behavior of Sr2IrO4 agrees more with the Hubbard-Mott scenario. The coherent part of the lineshape is small and no clear evolution is observed through TN, as expected within the DMFT description. This decomposition of the spectra implies the existence of two energy scales, the large Mott-like gap , essentially fixed by short-range magnetic correlations and the small coherent gap , fixed by the long range magnetic order. This is consistent with the absence of correlation between the large charge gap and the short-range magnetic order observed in Sr2IrO4 by spin-polarized STM Zhao et al. (2019).
We further find that in the weakly correlated case, the closing of the small magnetic gap redefines the position of the Fermi level in the middle of the Hubbard bands. This drives a shift of the whole spectrum towards this position, exactly starting and stopping over the width of the magnetic transition. This view is quite different from the Lifshitz-like transition that was proposed before, where the shift of the band would bring weight to the Fermi level Song et al. (2018). In future experimental and theoretical investigations, the role of disorder, also induced by the chemical substitution, should be investigated to fully describe the lineshapes and their behavior as a function of doping and temperature. The width of the magnetic transition, as well as the spectral changes observed by STM near defects and/or dopants Okada et al. (2013); Sun et al. (2021); Wang et al. (2018), implies that there is some degree of heterogeneity in these systems, which certainly plays a role in the absence of well resolved coherent peak in ARPES.
References
- Hao et al. (2019) L. Hao, Z. Wang, J. Yang, D. Meyers, J. Sanchez, G. Fabbris, Y. Choi, J.-W. Kim, D. Haskel, P. J. Ryan, K. Barros, J.-H. Chu, M. P. M. Dean, C. D. Batista, and J. Liu, Nature Communications 10, 5301 (2019).
- Fratino et al. (2017) L. Fratino, P. Sémon, M. Charlebois, G. Sordi, and A.-M. S. Tremblay, Phys. Rev. B 95, 235109 (2017).
- Camjayi et al. (2006) A. Camjayi, R. Chitra, and M. J. Rozenberg, Phys. Rev. B 73, 041103 (2006).
- Kim et al. (2008) B. J. Kim, H. Jin, S. J. Moon, J.-Y. Kim, B.-G. Park, C. S. Leem, J. Yu, T. W. Noh, C. Kim, S.-J. Oh, J.-H. Park, V. Durairaj, G. Cao, and E. Rotenberg, Phys. Rev. Lett. 101, 076402 (2008).
- Martins et al. (2018) C. Martins, B. Lenz, L. Perfetti, V. Brouet, F. Bertran, and S. Biermann, Phys. Rev. Materials 2, 032001 (2018).
- Moon et al. (2008) S. J. Moon, H. Jin, K. W. Kim, W. S. Choi, Y. S. Lee, J. Yu, G. Cao, A. Sumi, H. Funakubo, C. Bernhard, and T. W. Noh, Phys. Rev. Lett. 101, 226402 (2008).
- Battisti et al. (2017) I. Battisti, K. M. Bastiaans, V. Fedoseev, A. de la Torre, N. Iliopoulos, A. Tamai, E. C. Hunter, R. . S. Perry, J. Zaanen, F. Baumberger, and M. P. Allan, Nature Physics 13, 21 (2017).
- Zhao et al. (2019) H. Zhao, S. Manna, Z. Porter, X. Chen, A. Uzdejczyk, J. Moodera, Z. Wang, S. D. Wilson, and I. Zeljkovic, Nature Physics 15, 1267 (2019).
- Sun et al. (2021) Z. Sun, J. M. Guevara, S. Sykora, E. M. Pärschke, K. Manna, A. Maljuk, S. Wurmehl, J. van den Brink, B. Büchner, and C. Hess, Phys. Rev. Research 3, 023075 (2021).
- Brouet et al. (2015) V. Brouet, J. Mansart, L. Perfetti, C. Piovera, I. Vobornik, P. Le Fèvre, F. Bertran, S. C. Riggs, M. C. Shapiro, P. Giraldo-Gallo, and I. R. Fisher, Physical Review B 92, 081117 (2015).
- Okada et al. (2013) Y. Okada, D. Walkup, H. Lin, C. Dhital, T.-R. Chang, S. Khadka, W. Zhou, H.-T. Jeng, M. Paranjape, A. Bansil, Z. Wang, S. D. Wilson, and V. Madhavan, Nature Materials 12, 707 (2013).
- Zhao et al. (2021) H. Zhao, Z. Porter, X. Chen, S. D. Wilson, Z. Wang, and I. Zeljkovic, Science Advances 7, eabi6468 (2021), https://www.science.org/doi/pdf/10.1126/sciadv.abi6468 .
- Brouet et al. (2018) V. Brouet, L. Serrier-Garcia, A. Louat, L. Fruchter, F. Bertran, P. Le Fèvre, J. Rault, A. Forget, and D. Colson, Phys. Rev. B 98, 235101 (2018).
- de la Torre et al. (2014) A. de la Torre, E. Hunter, A. Subedi, S. McKeown Walker, A. Tamai, T. Kim, M. Hoesch, R. Perry, A. Georges, and F. Baumberger, Phys. Rev. Lett. 113, 256402 (2014).
- (15) See supplementary information .
- Kim et al. (2012a) J. Kim, D. Casa, M. H. Upton, T. Gog, Y.-J. Kim, J. F. Mitchell, M. van Veenendaal, M. Daghofer, J. van den Brink, G. Khaliullin, and B. J. Kim, Phys. Rev. Lett. 108, 177003 (2012a).
- Dhital et al. (2013) C. Dhital, T. Hogan, Z. Yamani, C. de la Cruz, X. Chen, S. Khadka, Z. Ren, and S. D. Wilson, Phys. Rev. B 87, 144405 (2013).
- Kim et al. (2012b) J. Kim, A. H. Said, D. Casa, M. H. Upton, T. Gog, M. Daghofer, G. Jackeli, J. van den Brink, G. Khaliullin, and B. J. Kim, Phys. Rev. Lett. 109, 157402 (2012b).
- Korneta et al. (2010) O. B. Korneta, T. Qi, S. Chikara, S. Parkin, L. E. De Long, P. Schlottmann, and G. Cao, Phys. Rev. B 82, 115117 (2010).
- Cao et al. (2002) G. Cao, Y. Xin, C. S. Alexander, J. E. Crow, P. Schlottmann, M. K. Crawford, R. L. Harlow, and W. Marshall, Phys. Rev. B 66, 214412 (2002).
- Chen et al. (2015) X. Chen, T. Hogan, D. Walkup, W. Zhou, M. Pokharel, M. Yao, W. Tian, T. Z. Ward, Y. Zhao, D. Parshall, C. Opeil, J. W. Lynn, V. Madhavan, and S. D. Wilson, Phys. Rev. B 92, 075125 (2015).
- Moon et al. (2009) S. Moon, H. Jin, W. Choi, J. Lee, S. Seo, J. Yu, G. Cao, T. Noh, and Y. Lee, Phys. Rev. B 80, 195110 (2009).
- Ahn et al. (2016) G. Ahn, S. Song, T. Hogan, S. D. Wilson, and S. Moon, Scientific reports 6, 32632 (2016).
- Xu et al. (2020) B. Xu, P. Marsik, E. Sheveleva, F. Lyzwa, A. Louat, V. Brouet, D. Munzar, and C. Bernhard, Phys. Rev. Lett. 124, 027402 (2020).
- Sohn et al. (2014) C. H. Sohn, M.-C. Lee, H. J. Park, K. J. Noh, H. K. Yoo, S. J. Moon, K. W. Kim, T. F. Qi, G. Cao, D.-Y. Cho, and T. W. Noh, Phys. Rev. B 90, 041105 (2014).
- Song et al. (2018) S. Song, S. Kim, G. H. Ahn, J. H. Seo, J. L. Schmehr, M. Aling, S. D. Wilson, Y. K. Kim, and S. J. Moon, Phys. Rev. B 98, 035110 (2018).
- Wang et al. (2019) Z. Wang, D. Walkup, Y. Maximenko, W. Zhou, T. Hogan, Z. Wang, S. D. Wilson, and V. Madhavan, npj Quantum Materials 4, 43 (2019).
- King et al. (2013) P. D. C. King, T. Takayama, A. Tamai, E. Rozbicki, S. M. Walker, M. Shi, L. Patthey, R. G. Moore, D. Lu, K. M. Shen, H. Takagi, and F. Baumberger, Phys. Rev. B 87, 241106 (2013).
- Affeldt et al. (2017) G. Affeldt, T. Hogan, C. L. Smallwood, T. Das, J. D. Denlinger, S. D. Wilson, A. Vishwanath, and A. Lanzara, Phys. Rev. B 95, 235151 (2017).
- Ge et al. (2011) M. Ge, T. Qi, O. Korneta, D. De Long, P. Schlottmann, W. Crummett, and G. Cao, Phys. Rev. B 84, 100402 (2011).
- Hogan et al. (2015) T. Hogan, Z. Yamani, D. Walkup, X. Chen, R. Dally, T. Z. Ward, M. P. M. Dean, J. Hill, Z. Islam, V. Madhavan, and S. D. Wilson, Phys. Rev. Lett. 114, 257203 (2015).
- Dhital et al. (2014) C. Dhital, T. Hogan, W. Zhou, X. Chen, Z. Ren, M. Pokharel, Y. Okada, M. Heine, W. Tian, Z. Yamani, C. Opeil, J. S. Helton, J. W. Lynn, Z. Wang, V. Madhavan, and S. D. Wilson, Nature Communications 5, 3377 (2014).
- Yuan et al. (2015) S. J. Yuan, S. Aswartham, J. Terzic, H. Zheng, H. D. Zhao, P. Schlottmann, and G. Cao, Phys. Rev. B 92, 245103 (2015).
- Calder et al. (2015) S. Calder, J. W. Kim, G.-X. Cao, C. Cantoni, A. F. May, H. B. Cao, A. A. Aczel, M. Matsuda, Y. Choi, D. Haskel, B. C. Sales, D. Mandrus, M. D. Lumsden, and A. D. Christianson, Phys. Rev. B 92, 165128 (2015).
- Brouet et al. (2021) V. Brouet, P. Foulquier, A. Louat, F. m. c. Bertran, P. Le Fèvre, J. E. Rault, and D. Colson, Phys. Rev. B 104, L121104 (2021).
- Moutenet et al. (2018) A. Moutenet, A. Georges, and M. Ferrero, Phys. Rev. B 97, 155109 (2018).
- Zhang et al. (2013) H. Zhang, K. Haule, and D. Vanderbilt, Phys. Rev. Lett. 111, 246402 (2013).
- Jeong et al. (2020) J. Jeong, B. Lenz, A. Gukasov, X. Fabrèges, A. Sazonov, V. Hutanu, A. Louat, D. Bounoua, C. Martins, S. Biermann, V. Brouet, Y. Sidis, and P. Bourges, Phys. Rev. Lett. 125, 097202 (2020).
- Georges et al. (1996) A. Georges, G. Kotliar, W. Krauth, and M. J. Rozenberg, Rev. Mod. Phys. 68, 13 (1996).
- Gull et al. (2011) E. Gull, A. J. Millis, A. I. Lichtenstein, A. N. Rubtsov, M. Troyer, and P. Werner, Rev. Mod. Phys. 83, 349 (2011).
- Levy et al. (2017) R. Levy, J. LeBlanc, and E. Gull, Computer Physics Communications 215, 149 (2017).
- Hogan et al. (2016) T. Hogan, L. Bjaalie, L. Zhao, C. Belvin, X. Wang, C. G. Van de Walle, D. Hsieh, and S. D. Wilson, Phys. Rev. B 93, 134110 (2016).
- Louat et al. (2018) A. Louat, F. Bert, L. Serrier-Garcia, F. Bertran, P. Le Fèvre, J. Rault, and V. Brouet, Phys. Rev. B 97, 161109 (2018).
- Kim et al. (2002) C. Kim, F. Ronning, A. Damascelli, D. L. Feng, Z.-X. Shen, B. O. Wells, Y. J. Kim, R. J. Birgeneau, M. A. Kastner, L. L. Miller, H. Eisaki, and S. Uchida, Phys. Rev. B 65, 174516 (2002).
- Dessau et al. (1998) D. S. Dessau, T. Saitoh, C.-H. Park, Z.-X. Shen, P. Villella, N. Hamada, Y. Moritomo, and Y. Tokura, Phys. Rev. Lett. 81, 192 (1998).
- Perfetti et al. (2001) L. Perfetti, H. Berger, A. Reginelli, L. Degiorgi, H. Höchst, J. Voit, G. Margaritondo, and M. Grioni, Phys. Rev. Lett. 87, 216404 (2001).
- Shen et al. (2004) K. M. Shen, F. Ronning, D. H. Lu, W. S. Lee, N. J. C. Ingle, W. Meevasana, F. Baumberger, A. Damascelli, N. P. Armitage, L. L. Miller, Y. Kohsaka, M. Azuma, M. Takano, H. Takagi, and Z.-X. Shen, Phys. Rev. Lett. 93, 267002 (2004).
- Gretarsson et al. (2017) H. Gretarsson, J. Sauceda, N. H. Sung, M. Höppner, M. Minola, B. J. Kim, B. Keimer, and M. Le Tacon, Phys. Rev. B 96, 115138 (2017).
- He et al. (2015) J. He, T. Hogan, T. R. Mion, H. Hafiz, Y. He, J. D. Denlinger, S.-K. Mo, C. Dhital, X. Chen, Q. Lin, Y. Zhang, M. Hashimoto, H. Pan, D. H. Lu, M. Arita, K. Shimada, R. S. Markiewicz, Z. Wang, K. Kempa, M. J. Naughton, A. Bansil, S. D. Wilson, and R.-H. He, Nature Materials 14, 577 EP (2015).
- Kovaleva et al. (2004) N. N. Kovaleva, A. V. Boris, C. Bernhard, A. Kulakov, A. Pimenov, A. M. Balbashov, G. Khaliullin, and B. Keimer, Phys. Rev. Lett. 93, 147204 (2004).
- Gorelov et al. (2010) E. Gorelov, M. Karolak, T. O. Wehling, F. Lechermann, A. I. Lichtenstein, and E. Pavarini, Phys. Rev. Lett. 104, 226401 (2010).
- Wang et al. (2018) Z. Wang, Y. Okada, J. O’Neal, W. Zhou, D. Walkup, C. Dhital, T. Hogan, P. Clancy, Y.-J. Kim, Y. F. Hu, L. H. Santos, S. D. Wilson, N. Trivedi, and V. Madhavan, Proceedings of the National Academy of Sciences 115, 11198 (2018), https://www.pnas.org/content/115/44/11198.full.pdf .