Spectroscopy Study on NV Sensors in Diamond-based High-pressure Devices
Abstract
High-pressure experiments are crucial in modern interdisciplinary research fields such as engineering quantum materials, yet local probing techniques remain restricted due to the tight confinement of the pressure chamber in certain pressure devices. Recently, the negatively charged nitrogen-vacancy (NV) center has emerged as a robust and versatile quantum sensor in pressurized environments. There are two popular ways to implement NV sensing in a diamond anvil cell (DAC), which is a conventional workhorse in the high-pressure community: create implanted NV centers (INVs) at the diamond anvil tip or immerse NV-enriched nano-diamonds (NDs) in the pressure medium. Nonetheless, there are limited studies on comparing the local stress environments experienced by these sensor types as well as their performances as pressure gauges. In this work, by probing the NV energy levels with the optically detected magnetic resonance (ODMR) method, we experimentally reveal a dramatic difference in the partially reconstructed stress tensors of INVs and NDs incorporated in the same DAC. Our measurement results agree with computational simulations, concluding that INVs perceive a more non-hydrostatic environment dominated by a uniaxial stress along the DAC axis. This provides insights on the suitable choice of NV sensors for specific purposes and the stress distribution in a DAC. We further propose some possible methods, such as using NDs and diamond nanopillars, to extend the maximum working pressure of quantum sensing based on ODMR spectroscopy, since the maximum working pressure could be restricted by non-hydrostaticity of the pressure environment. Moreover, we explore more sensing applications of the NV center by studying how pressure modifies different aspects of the NV system. We perform a photoluminescence (PL) study using both INVs and NDs to determine the pressure dependence of the zero-phonon line (ZPL), which helps developing an all-optical pressure sensing protocol with the NV center. We also characterize the spin-lattice relaxation () time of INVs under pressure to lay a foundation for robust pulsed measurements with NV centers in pressurized environments.
I Introduction
Pressure is an important thermodynamic parameter for engineering quantum materials because it allows one to tune material properties without altering the chemical composition, and some long-searched-for quantum phases are expected to emerge under ultra-high pressure, such as room-temperature superconductivity [1, 2, 3, 4] and metallic hydrogen [5, 6]. High-pressure experiments are, however, non-trivial to perform since one needs robust pressure devices and compatible measurement techniques.
One reliable pressure device is the diamond anvil cell (DAC), which has been widely used in the high-pressure community. The pressure is achieved by mechanically pressing two opposing diamond anvils towards a tightly confined pressure chamber in the middle. The pressure medium filling up the chamber remains hydrostatic below its critical pressure , and it undergoes solidification or glass transition at where pressure inhomogeneity starts building up. It is crucial to understand whether the medium is hydrostatic during the experiment, since the subsequent data processing and interpretation may be inappropriate if the artifacts from pressure inhomogeneity are not taken into account.
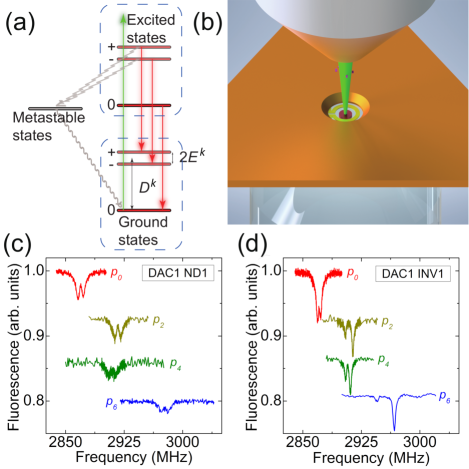
As to the suitable measurement techniques in high-pressure experiments, quantum sensing with negatively charged nitrogen-vacancy (NV-) centers has emerged as a strong candidate. We always denote NV- as NV in the rest of this paper. The NV center is a color defect in diamond which consists of a substitutional nitrogen atom, an adjacent atomic vacancy, and an extra electron. Its ground state is an electron spin system and the spin sublevels are responsive to temperature, stress field, magnetic field, electric field, and the surrounding spin bath, making the NV center a versatile sensor for these physical quantities [7, 8, 9, 10, 11, 12, 13, 14]. In practice, we measure the electron spin resonance (ESR) spectrum of the NV center using the optically detected magnetic resonance (ODMR) method, which relies on the spin-state-dependent fluorescence rate of the NV center caused by the spin-state-dependent decay route back to the ground state (Fig. 1(a)). In ODMR spectroscopy, a green laser is used for initialization and read-out of the NV spin state while a microwave (MW) is used for spin-state manipulation. The ODMR spectrum encodes information about the NV energy structure and hence the environment around the NV center. Due to the superior resolution and sensitivity, quantum sensing with NV centers has become a promising experimental technique.
It has been demonstrated that NV sensing is highly compatible with DACs, and NV centers have outstanding sensing performance even under the demanding conditions inside DACs [15, 16, 17, 18, 19, 20, 21, 22, 23]. There are mainly two ways to incorporate NV sensors in DACs: (1) create a layer of implanted NV centers (INVs) at a suitable depth inside the diamond anvil tip [18, 19, 22], (2) drop-cast some NV-enriched nano-diamonds (NDs) at the pressure medium interface inside the pressure chamber [16, 17, 20]. In general, they are employed to study different kinds of materials under pressure. INVs are commonly used to probe 2D or 3D materials with flat surfaces, while NDs are often applied to examine materials with irregular surfaces. Moreover, INVs and NDs have their own advantages and drawbacks in sensing applications. INVs provide an easy way to detect vector fields because of the known orientation of the bulk diamond crystal in the laboratory frame, yet, the spatial resolution is restricted by the optical diffraction limit and the spatial uniformity of INVs is constrained by imperfections in the implantation procedures; on the other hand, NDs present high spatial resolution controlled by the ND size given the NDs are sparsely distributed and NV centers in the NDs are in close proximity to the sample, yet, the crystal orientations of NDs are random and require individual calibration in the laboratory frame and spin decoherence times of NDs are generally shorter than INVs. Some obvious pros and cons of INVs and NDs are long known, but to the best of our knowledge, no studies have directly compared the pressurized environments perceived by these two types of NV sensors in a single DAC. This incomplete understanding of the pressurized environments at different locations in a DAC may hinder the accurate choice of NV sensors for different experimental purposes.
Another prevailing question from the NV community is the maximum pressure that NV centers can work with as quantum sensors, especially as magnetic field sensors since the probing of local magnetic fields with high spatial resolution is crucial for material research and phase transition studies [19, 18, 17]. Ultra-high pressure can bring detrimental effects on quantum sensing with NV centers, including the quenching of ODMR contrasts due to the spin-sublevel mixing in a non-hydrostatic environment. To realize magnetic field sensing in pressurized systems, some previous studies have demonstrated the use of a bias magnetic field to overcome the effects of uniaxial stresses [19, 18, 17]. Nonetheless, a strong bias field is required for large uniaxial stresses. This may impose technical difficulties on the experimental setup, and a strong bias field may undesirably change the properties of the material under investigation. Thus, it is of interest to explore other complementary solutions for extending the working pressure of NV sensing.
In this work, we first incorporate both INVs and NDs in the same DAC and analyze the difference in effective pressure transmissions from the hydrostatic pressure medium to these two types of sensors. We partially reconstruct the local stress tensors perceived by INVs and NDs using information from the respective ODMR spectra, and we also perform finite-element simulations to cross-check our experimental findings. These analyses serve to calibrate the local pressurized environments of the two sensor types, to compare their performances as hydrostatic pressure gauges, and to determine their optimal working ranges. By comparing the pressure conditions of the two sensor types, we demonstrate how non-hydrostaticity restricts the maximum working pressure of NV sensing, and we further propose some possible solutions to conquer the non-hydrostaticity. Besides, thoroughly characterizing the stress responses of NV sensors may pave the way for simultaneous detection of multiple physical parameters via ODMR spectroscopy, like pressure and temperature or pressure and magnetic field.
Next, we employ our ODMR-calibrated NV sensors to investigate from different perspectives the pressure-tuned energy structure of the NV center. We measure the photoluminescence (PL) spectra of both INVs and NDs to study the pressure dependence of the zero-phonon line (ZPL), which represents the energy spacing between electronic orbitals of the NV center. We also measure the spin-lattice relaxation () time of INVs against pressure to probe the electron-phonon coupling in the solid-state defect system. Combining various spectroscopic techniques ranging from continuous-wave (cw) to pulsed measurements and from ESR to PL measurements, we hereby provide a multi-dimensional understanding of the NV quantum system under high pressure, which helps fostering more accurate and distinct applications of NV sensing in extreme conditions. Such applications include an all-optical pressure sensing protocol based on PL spectroscopy and robust implementation of pulse sequences at high pressure.
II Theoretical Background
In a single crystalline diamond with an ensemble of NV centers, there are four possible spatial orientations for the NV centers. We thus have five relevant reference frames: the crystal frame and the principal axis frames for the four NV orientations , NV1, NV2, NV3, NV4. The four NV frames can be related by simple rotation transformations due to the symmetry of the diamond crystal. In this work, we follow Barfuss et al.’s conventions of the five frames and the coordinate transformations between them [24], and we always take compressive stresses to be positive.
The NV center is a robust stress sensor due to the spin-stress coupling effect [25, 26, 27, 24, 19, 20, 28, 29, 14, 30, 31, 32, 11, 33, 21, 34, 35, 36, 37]. Under a stress field affecting the spin-spin interaction, the ground-state Hamiltonian for each NV orientation in its principal axis frame can be written as [24, 25, 26]
| (1) |
where is the spin-1 operator, MHz in ambient conditions, and in the hybrid representation, the NV-frame quantities and can be expressed in terms of the components of the crystal-frame stress tensor . For NV1 along [111] crystal direction,
| (2) | ||||
| (3) | ||||
| (4) | ||||
| (5) | ||||
| (6) |
where , , , , , and are the spin-stress coupling constants in the hybrid representation. To obtain the above expressions for the other three NV orientations, we need to replace by in Eqs. 2, 3, 4, 5 and 6, where are the coordinate transformations from NV1 to NV2, NV3, NV4 as defined in Ref. [24]. The resulting expressions for NV2-4 are different from Eqs. 2, 3, 4, 5 and 6 only by sign flips in some of the off-diagonal tensor components. See Supplementary Materials for details.
Experiments have found that , , , MHz/kbar [25, 19], agreeing well with the theoretical values from a density functional theory (DFT) study [26]. This DFT study also reports and MHz/kbar. Since and are an order of magnitude smaller than the rest of the coupling constants, we can neglect the and terms in Eq. 1 for our first-order discussion here, and the three eigenvalues of the Hamiltonian can thus be analytically solved as follows,
| (7) |
Hence, are the two resonance frequencies detectable by ODMR spectroscopy, with their center and splitting being and respectively (Fig. 1(a)).
In the regime of small shear stresses, the four NV orientations have close ’s and close ’s, leading to two overall resonances in the ODMR spectrum of the whole NV ensemble. We further assume equal population for the four NV orientations in the diamond crystal, such that the two overall ODMR resonances should be averages of and over NV1, NV2, NV3, NV4, with their center and splitting written respectively as
| (8) | ||||
| (9) |
These expressions reveal that scales with pressure, while results from the imbalance between uniaxial stresses along the three orthogonal directions and the presence of shear stresses, or in other words is an indicator of hydrostaticity. When we compress the diamond crystal, both and will increase in general, i.e. the ODMR resonances will shift to the right and split further apart.
With Eqs. 8 and 9 in hand, we can employ ODMR spectroscopy to partially reconstruct the crystal-frame stress tensor perceived by the NV ensemble. This theory section is applicable for both INVs and NDs, and to have meaningful interpretations of the reconstructed crystal-frame stress tensors, we must also understand how the INV and ND crystal frames are related to the laboratory frame, which we will discuss in Section III.
III Experimental setup
Fig. 1(b) illustrates our customized DAC design where both INVs and NDs are incorporated. We utilize (100)-oriented diamond anvils, and the layer of INVs is located at the culet of one of the anvils. This implanted anvil is prepared by 9.8 keV \ce^15N ion implantation at a dose of 1012 N/cm2 and subsequent annealing at 950oC in a high vacuum ( mbar) for 2 hours. The resulting implantation area has a diameter of 200 µm and is at a depth of 10 nm below the culet surface that has a surface roughness of 1.5 nm. On the other hand, some 140-nm NDs with nitrogen concentration of 3 ppm are sparsely drop-casted on the culet surface of the other un-implanted diamond anvil. To perform ODMR spectroscopy with these two types of NV sensors, a 150-µm-radius Omega-shaped gold microstructure is fabricated on the implanted anvil for MW transmission [38]. As to the pressure chamber in our design, a 300-µm-diameter hole is drilled in the middle of a beryllium-copper gasket and the hole is completely filled with a 4:1 methanol:ethanol mixture as the pressure medium. At room temperature, this particular medium remains hydrostatic up to 100 kbar [39, 40, 41, 42, 43] which fully covers our experimental pressure range, enabling us to compare the local pressurized environments of INVs and NDs given the medium is in an excellent hydrostatic condition. Another reason for choosing this medium is that most of the common phase transitions tuned by pressure in condensed matter physics lie within 100 kbar. Therefore, it is of technical significance to study the stress distribution in a DAC, which is a popular pressure device in material research, using a medium with the hydrostatic limit up to 100 kbar.
We have prepared two DACs based on the above-described design, where all the cell configurations are the same except for the thickness of the pre-indented gasket (150 µm in one DAC and 200 µm in the other). We will denote these two DACs as DAC1 and DAC2 respectively hereafter. In our experiments with the DACs, a home-built confocal microscope with a 520-nm laser diode and a long-working-distance objective (50X Mitutoyo Plan Apo SL) is used to optically address the NV sensors, and the local pressure is calibrated by MHz/kbar [20] and the value at ambient pressure measured by the corresponding NV sensor (the ambient values have only tiny deviations from MHz).
Since the implanted anvil is (100)-oriented, it is natural to define the INV crystal frame () with the axis along the DAC axis. On the other hand, it is not that trivial to determine how the crystal frames of individual NDs are oriented with respect to the laboratory frame. We need to first apply a static magnetic field along the DAC axis and measure the ODMR spectrum of the target ND. Then by studying the Zeeman splittings in the spectrum, we can obtain the projection angles of the DAC axis onto the four NV orientations [44]. The unit direction of the DAC axis in the ND crystal frame can thus be computed by solving an effective problem of the intersection of three cones (see Supplementary Materials for details). The subsequent stress analysis should not depend on exactly how we assign the four angles to the four NV orientations (NV1-4) under our assumption of the equal population for the four orientations, and we will explicitly check that this is the case in Section V.
For PL measurements, we use the 520-nm laser diode to excite NV electrons from the electronic ground state to the phonon band above the electronic excited state. The NV electrons would decay to the zero-phonon mode of the excited state via emitting infrared (IR) radiation, then to the phonon band of the ground state via emitting red PL, and finally to the zero-phonon mode of the ground state via emitting IR radiation [45]. The ZPL in the resulting PL spectrum is produced by NV electrons that decay from the zero-phonon mode of the excited state directly back to the zero-phonon mode of the ground state. The PL spectra of INVs and NDs are collected using a commercial spectrometer (Princeton Instrument IsoPlane SCT-320) with a 550-nm long-pass filter in front. To obtain a PL spectrum solely originating from the NV centers in a targeted sensor, we subtract the PL spectrum measured under an applied MW field at one of the ODMR resonance frequencies from the spectrum without any exerted MW. This method makes use of the spin-state dependence of the NV fluorescence. To enhance the data quality, we choose to drive whichever one of the two ODMR resonances with higher contrast.
IV Comparisons of local pressurized environments
DAC1 (DAC2) is pressurized in an ascending pressure sequence from the ambient pressure up to (), except that () is a reduced pressure point. Throughout the experiment with DAC1 (DAC2), we have tracked three (five) 140-nm NDs and six (six) 500-nm patches of INVs. Note that our confocal microscope has a lateral resolution of 500 nm, and we will number the tracked sensors in DAC1 and DAC2 with Arabic numerals and in alphabetical order respectively, e.g. ND1, INV1, NDa, INVa. In general, the difference between the local pressurized environments of NDs and INVs becomes more significant as we increase the DAC pressure.
Using data from DAC1 as examples, we present in Fig. 1(c) and (d) how the raw ODMR spectra of ND1 and INV1 change with the DAC1 pressure respectively. Their spectral changes can be compared in terms of the center and splitting of the ODMR resonances. At , ND1 and INV1 agree well on but ND1 has a larger than INV1, indicating a larger intrinsic lattice distortion in ND1. When DAC1 is pressurized to , ND1 shows a greater rightward shift in while INV1 exhibits a more noticeable increase in , and such differences in their spectral responses become more pronounced at . These reveal that when we press the diamond anvils towards each other, ND1 experiences stronger local pressure from a more hydrostatic environment at the pressure medium interface, while INV1 is subjected to weaker local pressure from a more directional stress environment inside the anvil culet. The stress anisotropy around INV1 may have produced a symmetry breaking between the two ground-state sublevel transitions, as seen from the increasingly unequal contrasts of the two ODMR resonances at and in Fig. 1(d). On the other hand, both ND1 and INV1 show decreases in and at the reduced pressure point , reflecting the expected stress relaxation when we loosen the diamond anvils. Note that the decline in ODMR contrasts for ND1 and INV1 is due to the stress-induced mixing of NV spin states and the degradation of MW structure, where the latter factor takes a heavier toll on ND1. Apart from the artifact of the deteriorated MW structure, all the mentioned main features in the ODMR responses of the two NV sensor types can be reproduced in the independent experiment with DAC2 (see Supplementary Materials).
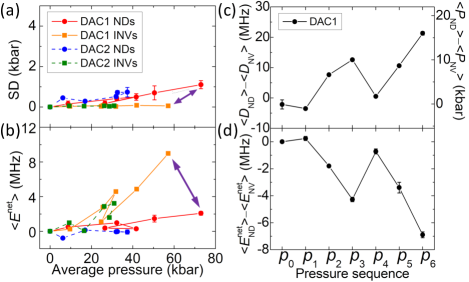
To go beyond describing the raw spectra, we perform statistical comparisons of the local environments perceived by NDs and INVs. In Fig. 2(a) and (b), we plot the standard deviation (SD) of pressure and average against average pressure for the tracked NDs and the tracked patches of INVs in DAC1 and DAC2, where is the measured offset by the ambient value. It is evident that the two DACs give rise to very similar results. First, the NDs only show a tiny increase in the SD of pressure while the patches of INVs have no observable SD at all. This suggests we have highly homogeneous pressure at both the medium interface and 10 nm deep in the culet, and the small SD from the NDs also hints at an excellent hydrostatic condition of the pressure medium (4:1 methanol:ethanol mixture) within the pressure range under investigation [20, 43]. Second, the average pressure detected by the NDs becomes increasingly greater than that detected by the patches of INVs, and the patches of INVs have a much more remarkable increase in the average compared with the NDs. These statistics verify our previous inference that a more hydrostatic environment exists at the medium interface to produce stronger local pressure, while a more anisotropic environment exists inside the anvil culet to give weaker local pressure. Third, at the reduced pressure points, the NDs and the patches of INVs show much smaller differences in the average pressure, SD of pressure, and average . This implies relaxation of the DAC may tend to “unify” the pressurized environments at the medium interface and inside the culet. Note that for DAC2, the data of NDs at may be affected by the instability of the pressure medium due to insufficient buffer time between the pressurization of the DAC and measurements. As a more direct comparison to supplement the above discussions, we plot in Fig. 2(c) and (d) the quantitative differences in average , average pressure , and average between the NDs and the patches of INVs in DAC1 along the pressure sequence.
V Quantitative stress tensor analysis
In this section, we will consider net effects of the DAC pressure on the stress tensors of the two NV sensor types.
First, we assume the stress tensors induced by the DAC pressure to be quasi-hydrostatic, i.e. a hydrostatic pressure plus a first-order correction from a uniaxial stress of magnitude along the DAC axis. This assumption is intuitive since any non-hydrostaticity in the DAC is likely to arise from the symmetry breaking due to the external force applied along the DAC axis. Under this assumption, the crystal-frame stress tensor of an ND can be written as
| (10) |
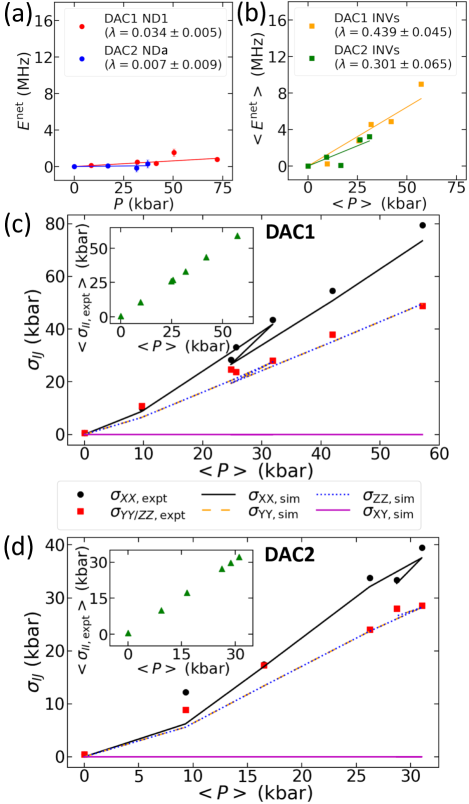
where is the coordinate transformation from the ND crystal frame to an auxiliary frame with its basis vector along the direction of the DAC axis observed in the ND crystal frame (see Supplementary Materials for the determination of ). As stated in Section III, we can derive the projection angles of the DAC axis onto the four NV orientations from the Zeeman splittings of the ND under an external magnetic field along the DAC axis. The angles found for ND1 in DAC1 and NDa in DAC2 are and respectively. For each of these two NDs, there are 12 permutations of assigning these four angles to NV1-4, hence leading to 12 cases of solved from the respective three-cone problems. Note that there would be 24 cases if we have four distinct projection angles instead. As we expected in Section III, all the 12 from each ND give rise to the same linear equation when we substitute their corresponding forms of Eq. 10 into Eq. 9 ( for ND1, for NDa). These linear equations are then used to fit the curves of versus measured by the two NDs (see Fig. 3(a)), and the fitted values of are and for ND1 and NDa respectively. Note that the reduced pressure points are not included in the linear curve fittings since pressurization and relaxation of a DAC are not simply the reverse of one another, as described in Ref. [20] and Section IV. Moreover, is omitted in the fitting for NDa in DAC2 owing to the instability of the pressure medium during measurements of NDs at this pressure point.
On the other hand, the INV crystal-frame stress tensor can be expressed as
| (11) |
which takes a simpler form since the axis of the INV crystal frame is precisely defined along the DAC axis as stated in Section III. Similarly to the NDs, we substitute Eq. 11 into Eq. 9 and use the resulting linear equation to fit the curves of average versus average measured by the six patches of INVs in DAC1 and DAC2 (see Fig. 3(b)). The fitted values of are and respectively, which are at least an order of magnitude greater than that of the corresponding ND in the same DAC. We therefore speculate that the INVs perceive a much more directional stress environment with a dominant uniaxial contribution along the DAC axis.
Next, we conduct a deeper study of the INV crystal-frame stress tensor originating from the DAC pressure, by writing down a more general tensor form,
| (12) |
where we assume negligible shear stresses and a cylindrical symmetry about the DAC axis (i.e. ). By substituting Eq. 12 into Eqs. 8 and 9, we can use the average and average measured by the six patches of INVs in each DAC to determine the and perceived by INVs at each pressure point. The experimentally derived results are presented using markers in Fig. 3(c) and (d) for DAC1 and DAC2 respectively, where the loading stress gradually becomes greater than the lateral stress in both DACs. Quantitatively, the ratio of to increases from 1 at to 1.62 (1.38) at the highest pressure point for DAC1 (DAC2). This demonstrates the accumulation of non-hydrostaticity in the diamond anvil culet due to the gradual dominance of the stress component along the DAC axis, in accord with our previous claims. To showcase the validity of our results, we further illustrate in the insets of Fig. 3(c) and (d) that the average of our derived diagonal stress components, , indeed gives the average pressure measured by the six patches of INVs.
To cross-check the above INV crystal-frame stress tensors derived from our experimental data, we perform simulations using a finite-element analysis software. We employ the solid mechanics module in the software to study the steady-state problem at each pressure point for our DACs. Fig. 4(a) shows the 2D axisymmetric model used in our simulations, which consists of the two (100)-oriented diamond anvils and the beryllium-copper gasket (the bottom anvil is the implanted one). The anvil geometry follows the standard design of a Type IIas diamond anvil from the manufacturer Megabar-Tech, with the culet diameter being 800 µm. The -axis of the INV crystal frame is defined along the DAC axis as usual, and we impose the following boundary conditions in the simulation at each pressure point for our DACs (refer to Fig. 4(a) for the naming of boundaries):
(1) Boundary loads: the base of the un-implanted anvil (boundary BC) is loaded with our externally applied force, while the pressure medium interfaces (boundaries AU, UP, and PO) are loaded with the average pressure measured by our NDs.
(2) Displacement constraints: the base of the implanted anvil (boundary MN) is fixed, while the boundaries GH, HI, and IJ are prescribed to have no radial displacements with respect to the DAC axis, such that the symmetry axis in our model will not be shifted.
(3) Contact surfaces: the static Coulomb friction model is applied to simulate the contact between the anvils and the gasket, where boundaries UT, TS, PQ, and QR have a friction constant of 0.02 while boundaries SF and RJ have a friction constant of 0.2 (constants taken from Ref. [19]).
To clearly portray the stress features in our DACs, the simulation results at the highest pressure point of DAC1 are summarized in Fig. 4(b) as examples, where the color maps visualize the spatial distributions of the loading stress , the lateral stresses , and one of the shear stresses . Note that the distributions of , , and are symmetric in the two anvils but it is not the case for . This may be due to the asymmetry of the gasket’s pre-indentation and the fact that we compress the DAC from above. The shear stress is notably smaller than the diagonal stress components, in agreement with the simulation in Ref. [19]. We notice, however, that in Ref. [19], they can reconstruct finite shear stresses from experimental data.
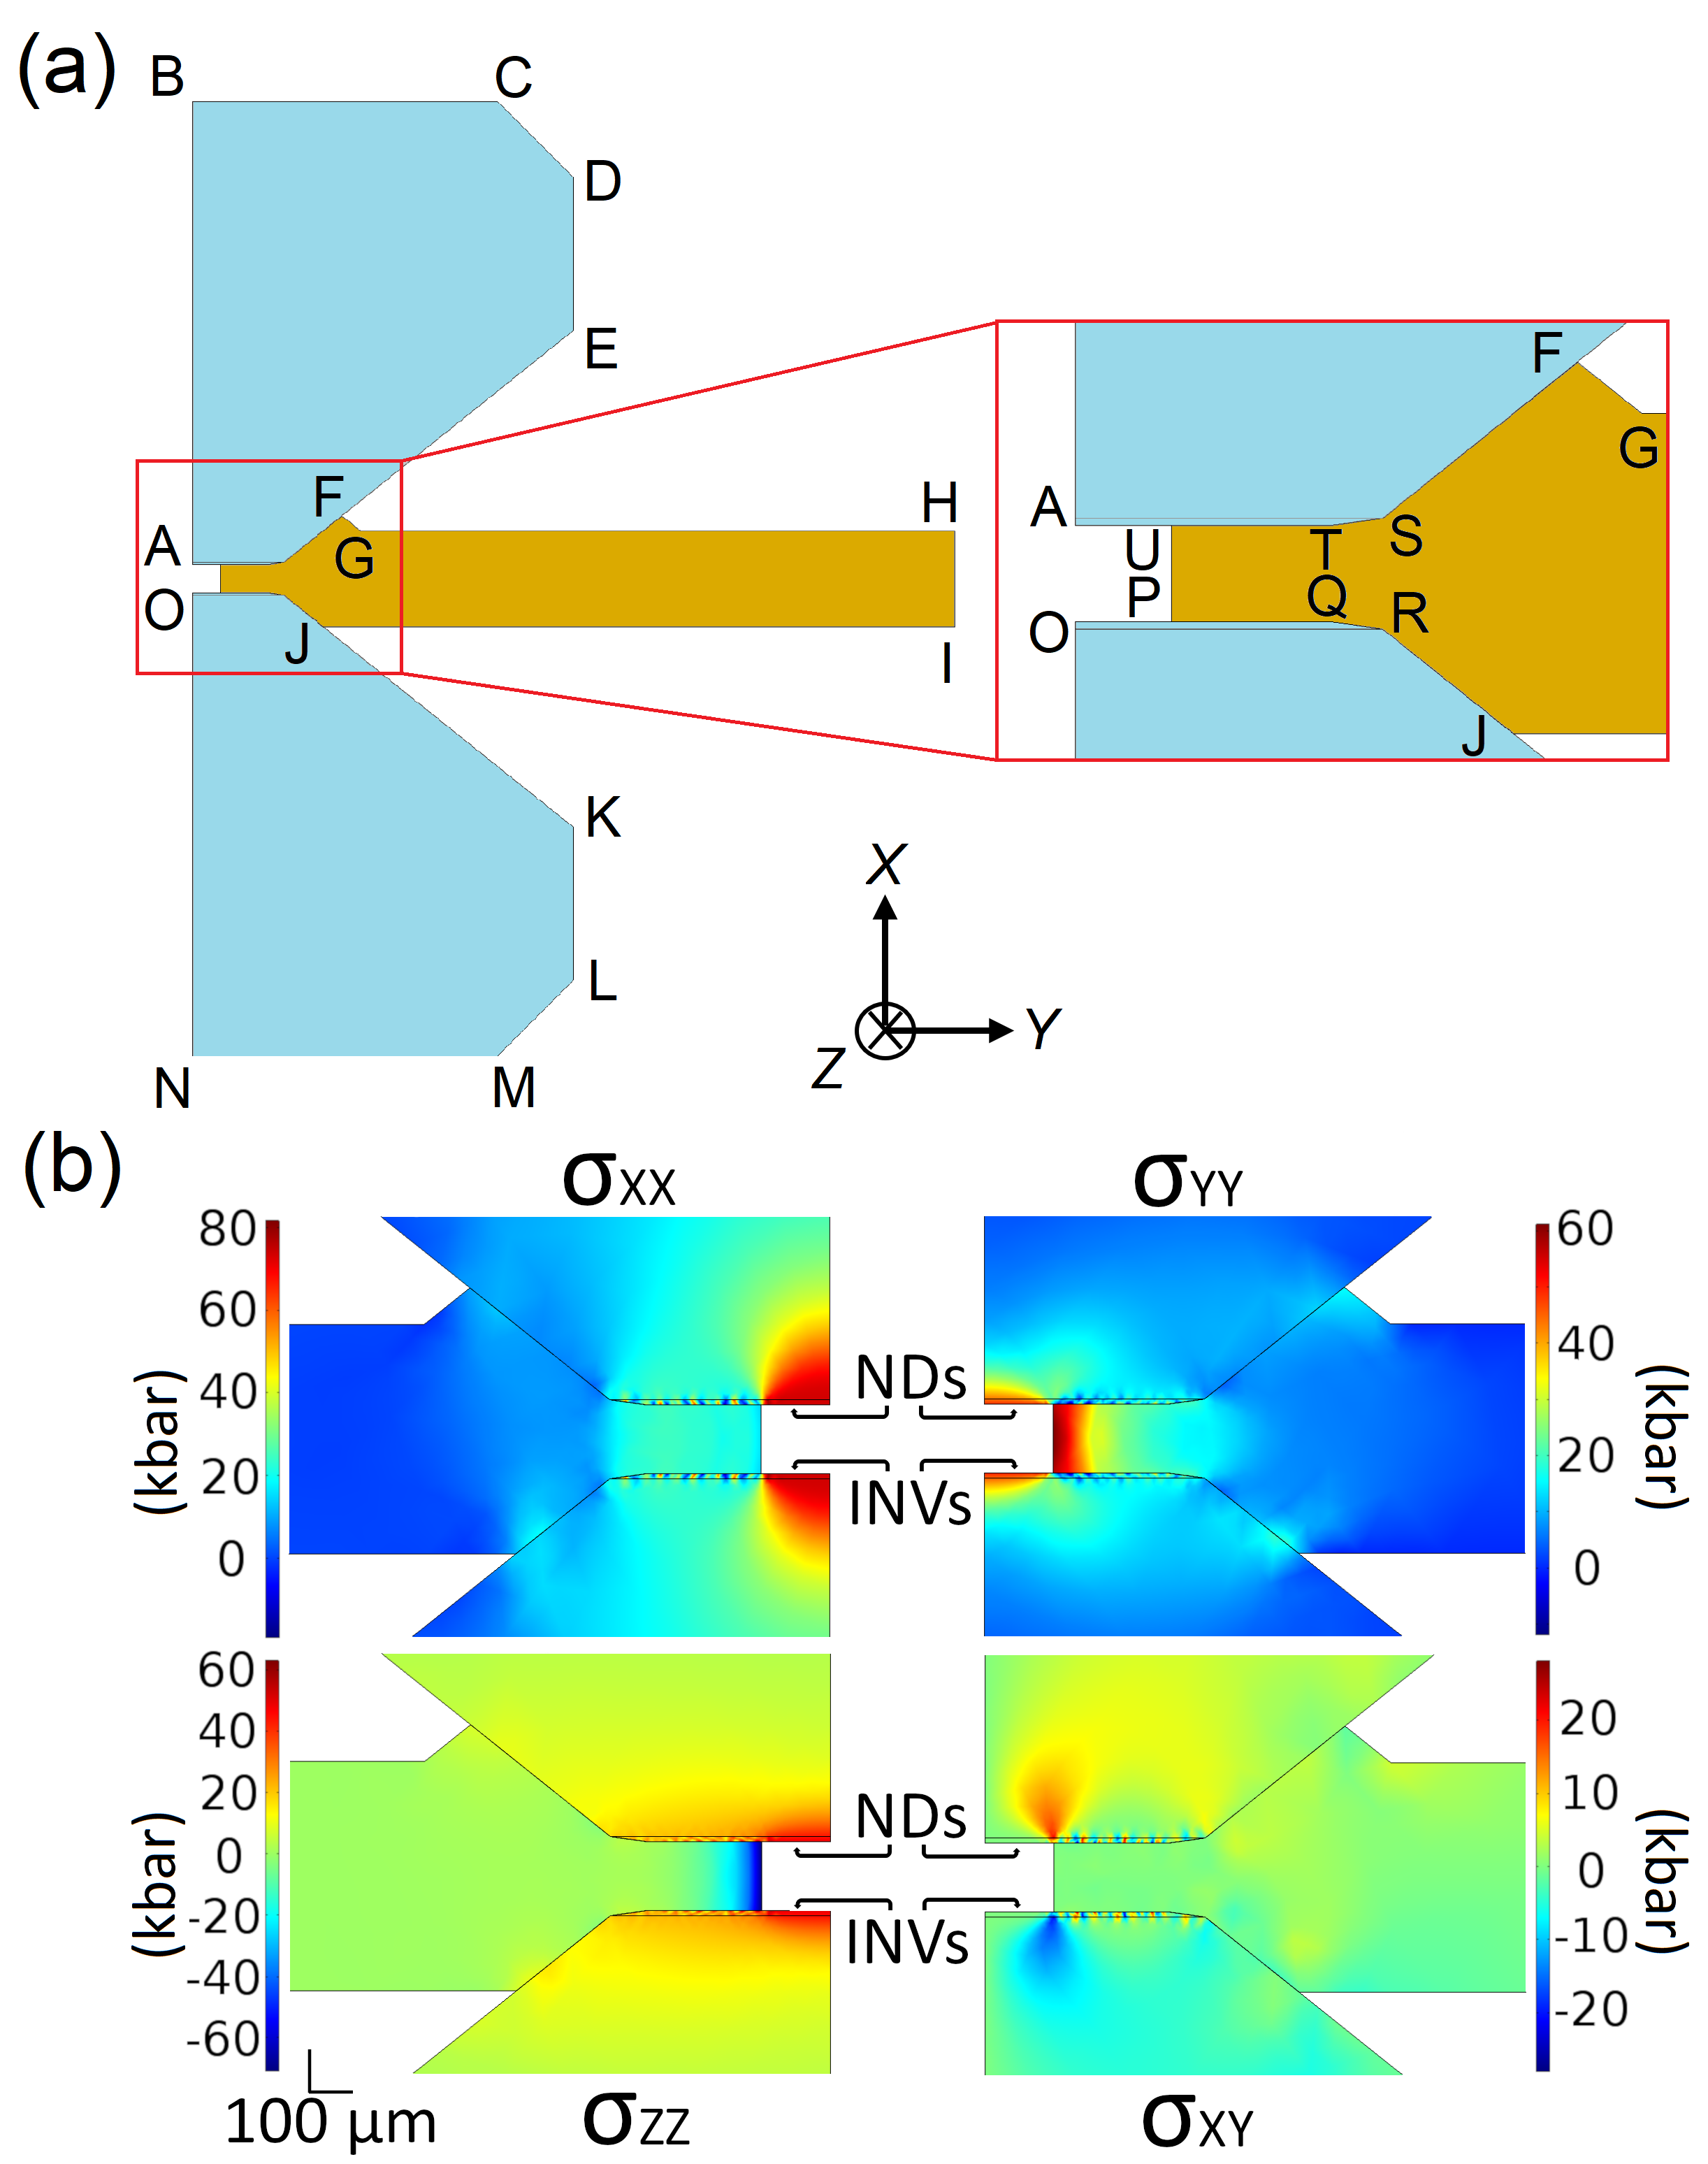
For each simulation, we average the simulated stress tensor components over the spatial region where the INVs are supposed to be in the DAC, i.e. 10 to 100 µm from the DAC axis and 10 to 15 nm below the culet surface of the implanted anvil. These simulated results of INV crystal-frame stress tensor components are presented using lines in Fig. 3(c) and (d) for DAC1 and DAC2 respectively, which reveal the same gradual dominance of the loading stress over the lateral stresses as in our previous results derived from experimental data. Moreover, the simulation results substantiate our assumptions in Eq. 12: First, one of the shear stresses is negligible at all the pressure points under investigation; second, although the lateral stresses and exhibit different spatial dependencies (Fig. 4(b) as an example), they have very close averages over the INV region as shown by the overlapping dashed and dotted lines in Fig. 3(c) and (d). To conclude, the computational simulations uphold our speculation that the non-hydrostaticity of the stress environment inside the anvil culet mainly emanates from the dominant uniaxial stress along the DAC axis.
Results from Sections IV and V elucidate that NDs perform better than INVs as hydrostatic pressure gauges. Given a hydrostatic pressure medium in a DAC, NDs at the medium interface efficiently receive the hydrostatic pressure, while INVs inside the anvil culet are heavily affected by the breaking of spatial symmetry due to the externally applied force. Moreover, our results substantiate that NDs have a longer working range for pressure detection compared with INVs. Throughout the hydrostatic pressure range of the pressure medium, NDs present tiny changes in and contrast ratio of ODMR resonances. However, as the DAC pressure is increased, INVs show gradual suppression of one of the ODMR resonances due to non-hydrostaticity in the local stress environment, which hinders accurate pressure determination from the center of resonances. One way-out to extend the working range of INVs is to apply a magnetic field of at least 50 Gauss along [100] of the diamond anvil, such that in the NV ground-state Hamiltonian, the magnetic field term O(102) MHz is significantly greater than the and terms which are related to O(101) MHz of INVs, where MHz/Gauss is the gyromagnetic ratio for electrons. Then, the local non-hydrostaticity would bring negligible effects to the ODMR spectrum of INVs and we would have two ODMR resonances of similar contrasts. We can solve and hence from this spectrum using equations from the section of three-cone method in Supplementary Materials, with the known magnetic field projections on the NV orientations. Thus, a well-controlled magnetic field is necessary for INVs to work fine in the entire hydrostatic pressure range of the medium, while NDs do not require extra apparatus for robust pressure sensing.
VI ZPL as an alternative pressure gauge
Researchers have extensively studied the responses of NV ground-state spin sublevels to external perturbations, and developed the well-known ODMR spectroscopy for quantum information technologies. In fact, not only spin sublevels but also electronic orbitals of the NV center would be adjusted by perturbations. Here, we aim at quantifying the pressure-induced change in the energy spacing between electronic ground and excited states of the NV center, via measuring the pressure dependence of ZPL in the PL spectra of INVs and NDs. We expect the two types of NV sensors would concur on the dependence as long as their respective local pressures are calibrated by ODMR spectroscopy.
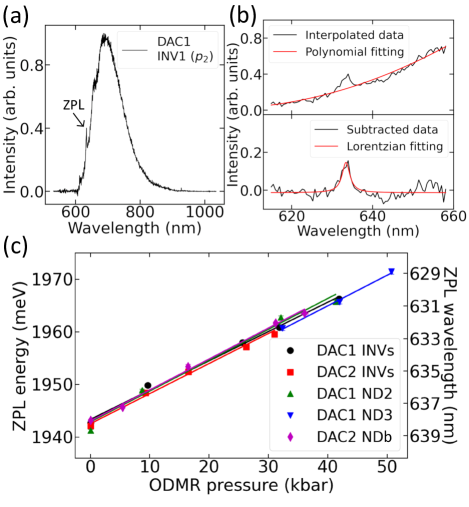
By manipulating the NV spin state as described in Section III, we measure the NV PL spectra from the six (six) patches of INVs and two (one) of the NDs in DAC1 (DAC2) along the pressure sequence. A sample NV PL spectrum is shown in Fig. 5(a). In general, the PL spectrum of an NV ensemble consists of broad phonon sidebands trailing behind a narrow ZPL which undergoes a weak blue shift under pressure. Without delving into the complicated fitting of the entire PL spectrum, we consistently extract the ZPL position from each measured spectrum in the following steps: (i) focus on the data between 615 and 658 nm which fully captures the ZPL evolution in our experimental pressure range, (ii) linearly interpolate this portion of data and perform a quadratic polynomial fitting (see the upper panel in Fig. 5(b)), (iii) subtract the fitted polynomial from the interpolated data and perform a Lorentzian peak fitting (see the lower panel in Fig. 5(b)). Note that Fig. 5(b) depicts the ZPL fitting procedures using the raw data in Fig. 5(a) as an example.
With the ZPL positions distilled out, we linearly fit the curves of ZPL energy versus local pressure for our targeted sensors in DAC1 and DAC2 (see Fig. 5(c)), where the ZPL energy is converted from the extracted ZPL wavelength and the local pressure is determined by ODMR method. The data points for INVs are averages from the six patches in the corresponding DAC. The five fittings in Fig. 5(c) reveal similar slopes ranging from 0.56 to 0.59 meV/kbar, with errors on the order of 0.01 meV/kbar. This fulfills our earlier expectation that well-calibrated NV sensors should agree on the pressure dependence of the ZPL, and our results can match with the previously reported values [15, 33, 34]. Moreover, it can be seen that our measured ZPL wavelengths are around 638 nm under ambient conditions, slightly off from the literature value of 637 nm. This may be due to some finite intrinsic stresses in the implanted diamond anvil. Note that each fitting in Fig. 5(c) only considers the pressure points where the corresponding sensor has sufficient ODMR contrasts to yield satisfactory NV PL spectra. Besides, the reduced pressure points are purposely excluded from the fittings in Fig. 5(c) for the same reason as before that relaxation of a DAC is not simply the reverse process of pressurization.
Our experimentally determined blue shift of the ZPL indicates a repulsion between NV electronic ground and excited states caused by pressure. In fact, it is of practical importance to confirm the slope of ZPL energy against pressure. By doing so, PL spectroscopy can be developed into an alternative to the ODMR method for pressure sensing with the NV center, and we can choose to utilize the spin or orbital degree of freedom in the NV energy structure for different experimental situations. PL spectroscopy is particularly useful if one does not want to introduce electrical feedthroughs into the DAC. An all-optical pressure sensing protocol is possible with PL spectroscopy, where one can obtain the NV PL spectrum by subtracting the spectrum measured near the NV sensor from the spectrum measured precisely at the location of the NV sensor, under an assumption of spatially uniform background PL signals. This assumption is valid if no components in the DAC other than NV sensors would emit red fluorescence under green laser excitation. With ODMR and PL spectroscopies, the NV center can be a resilient pressure sensor that caters to different experimental conditions.

VII Pulsed measurements with a hydrostatic pressure medium
Pulsed measurements are key to enhancing the sensitivity and realizing complex sensing schemes [8]. In real life, spin decoherence creates difficulties in implementing pulse sequences. The decoherence occurs via two channels: (i) the relaxation in -direction of the Bloch sphere due to electron-phonon coupling between NV centers and the lattice; (ii) the dephasing in - plane of the Bloch sphere due to spin-spin interactions. These two decoherence channels are characterized by the and times, respectively. In recent years, some promising pulsed sensing protocols have been demonstrated in either ambient or pressurized conditions [19, 46, 47, 48, 49, 23]. Nonetheless, little attention has been paid to the hydrostaticity of the pressure medium and the characterization of NV decoherence times using a hydrostatic medium. These concerns are important for high-fidelity NV sensing and NV-based quantum computing to be robustly performed in extreme conditions. To address these concerns, we examine the INV time over the course of pressurizing our DACs, where we check the hydrostaticity of the pressure medium with great caution.
Knowing the results in Sections IV and V, one may wonder if the local stress anisotropy in the diamond anvil culet would induce peculiar crystal deformations and modify the system’s electron-phonon coupling which in turn affects the time of the INVs. Thus, we would focus on the INVs rather than the NDs in this subsection. Refer to Section II, if the shear stresses are negligible (suggested by the simulations in Section V), all the four NV orientations would have the same eigenfrequencies, and , and the same eigenstates, and , where are superpositions of and . In this case, we would like to study the time of the two-level system spanned by and with transition frequency , which can be obtained by fitting the right-hand ODMR peak at zero magnetic field. With the pulse sequences depicted in Fig. 6(a) and (b), we can measure the relaxation curves of the bright state and the dark state respectively. Note that the pulse in Fig. 6(b) is half the Rabi period of driving the resonance . To extract the time, we subtract the relaxation curve of from that of , and fit the resulting curve with an exponential decay (see Fig. 6(c) as an example), where the amplitude is limited by the Rabi contrast. Here, we focus on the right-hand ODMR resonance because the left-hand ODMR contrast of INVs is suppressed when the DAC pressure is increased as shown in Fig. 1(d).
We perform the measurement using a new DAC (named as DAC3) which has the same cell configurations as DAC2 but with 99.5% glycerol as the pressure medium. Compared with 4:1 methanol:ethanol mixture, glycerol is a more common medium since it is not a strong solvent, and it is chemically inert. The ascending pressure sequence for DAC3 is from the ambient pressure to without any reduced pressure points. Through inspecting the SD of pressure among NDs, we find that our prepared glycerol in DAC3 has a critical pressure at around 80 kbar (see Supplementary Materials), which is in good agreement with [17]. Our medium is therefore perfectly hydrostatic before and quasi-hydrostatic at . By tracking two NDs and six patches of INVs in DAC3, we can reproduce the results in Figs. 1 and 2 (see Supplementary Materials), proving that our previous claims are independent of the choice of pressure medium as long as it is in the hydrostatic regime. For DAC3, we will number the tracked sensors using Roman numerals, e.g. NDI, INVI.
We have monitored the time for three patches of INVs in DAC3 from to , with the ambient-condition data from a patch of INVs close to the six tracked patches as a reference (INVs in the implanted region exhibit consistent ODMR properties from previous experience with DAC1 and DAC2). The measurement results are shown in Fig. 6(d), where no significant changes in the times are observed. Note that the efficiency of MW transmission through the Omega-shaped antenna is inevitably changed when we increase the DAC pressure. To ensure a constant MW power received by the INVs at different pressure points for fair comparison of the times in Fig. 6(d), we have fixed the Rabi period to be 582 ns for all patches of INVs at all pressure points by tuning the MW power fed into the DAC. We assume negligible detuning in the Rabi oscillations here. As examples, Fig. 6(e) shows the Rabi oscillations of a patch of INVs in DAC3 at different pressure points before and after tuning the input MW power.
Our measurement results indicate that possible modifications to the electron-phonon coupling by the local stress anisotropy in the anvil culet are tiny and within our experimental errors, given the medium is in a good hydrostatic condition. This demonstrates the stability of NV properties under extreme conditions and once again proves the robustness of NV sensing. A natural extension of our work is to monitor the time of INVs under pressure by implementing the Hahn-echo pulse sequence, but to do so, a well-controlled magnetic field is a requisite for aligning a magnetic field along one of the NV orientations. Our preliminary results (data not shown) under zero magnetic field in DAC3 seem to indicate no observable changes in the time up to 80 kbar.
VIII Proposal of diamond nanopillars in a DAC
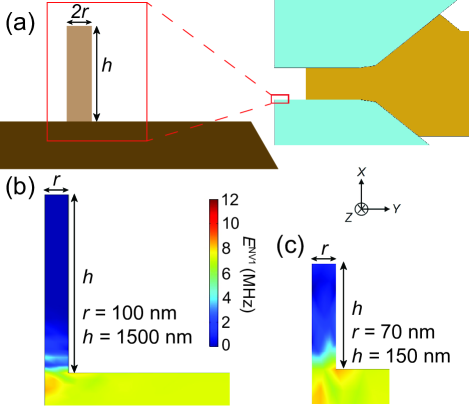
In addition to using NDs and applying a bias magnetic field, we propose here the third method to mitigate the adverse effects of the non-hydrostaticity in the pressurized environment and to extend the working pressure of NV centers as quantum sensors. The fabrication and characterization of diamond nanopillars have been discussed in the literature [50, 51, 52, 53], and NV sensing using nanopillars has been demonstrated under ambient conditions [50]. We therefore suggest the integration of nanopillars into a DAC so that the INVs embedded in the nanopillars can perform reliable quantum sensing in a hydrostatic stress environment. We conduct finite-element simulations to support our proposal, where we modify the 2D axisymmetric model in Fig. 4(a) by adding one nanopillar to the center of the implanted anvil culet (the bottom anvil in Fig. 4(a)). For the 2D model, we use the dimensions of DAC1 and try two different nanopillar geometries. One geometry has a radius of 100 nm and a height of 1500 nm, as inspired by the nanopillars in Ref.[50]. The other geometry has a radius of 70 nm and a height of 150 nm, which is similar to the size of our 140-nm NDs. We simulate the stress distribution under the boundary conditions stated in Section V, where the boundary loads follow the data at the highest pressure point of DAC1. In Fig. 7(b) and (c), we map the spatial distribution of in the implanted anvil for the two geometries, revealing that the indicator of non-hydrostaticity, , is close to zero within the nanopillar but it is much larger inside the bulk of the anvil. This hints at a good hydrostatic condition in the nanopillar, such that the mixing of NV ground-state spin sublevels can be minimized and the INVs inside the nanopillar can perform robust quantum sensing based on ODMR spectroscopy.
IX Discussion and Summary
Integrating different NV sensor types has some useful sensing applications. For instance, one may integrate INVs and NDs to study a liquid-solid phase boundary, where the liquid and solid properties can be sensed by immersed NDs and shallow INVs respectively. Understanding liquid-solid interfaces at a microscopic scale is a prevailing challenge in quantum chemistry [54], and NV sensing may provide new opportunities to the field.
In summary, this work has revealed a noticeable difference in the local stress environments encountered by INVs and NDs in the same DAC. Note that NV is just a platform for reconstructing the stress components, and our results should be generalized to the stress discrepancy between different parts in a high-pressure device: more hydrostatic at the pressure medium interface and more anisotropic inside the force-transmitting solid elements, given a hydrostatic pressure medium below . Moreover, our experiments and simulations demonstrate the sensitivity of NV centers to different stress profiles. Although INVs can be a versatile non-invasive tool in diamond-based pressure devices, NDs appear to be a better option for gauging hydrostatic pressure and have a longer working range for pressure detection with zero magnetic field. In fact, any type of NV sensor can be a legitimate pressure gauge as long as it is well-calibrated, and our work is exactly dedicated to characterizing the behaviors of different NV sensors in a confined pressure device. We want to emphasize that the choice of NV sensors heavily depends on the experimental purpose so that their unique advantages can be fully utilized. Furthermore, this work provides insights on different aspects of the NV energy structure. We confirm a pressure-induced repulsion between NV electronic ground and excited states by measuring the blue shift of ZPL in the NV PL spectrum. We also show that the electron-phonon coupling in the NV system would not be significantly modified by local stress anisotropy, as seen from the measured stability of the INV time. With a deeper understanding of the pressure-tuned NV system, more different sensing applications of the NV center are expected in the future.
Our work also addresses the tolerance to non-hydrostaticity when NV centers are applied as versatile sensors in pressurized environments, which is a key question from the NV community. Non-hydrostaticity hinders NV sensing in the following ways: (i) the ground-state spin sublevels are mixed in the energy eigenstates under a non-hydrostatic stress field (see Eq. 1), lowering the efficiency of ODMR spectroscopy; (ii) magnetic field sensing using NV centers would be inaccurate if the term in Eq. 9 is comparable to the magnetic field. Our empirical results show that when the indicator of non-hydrostaticity, , reaches O(101) MHz, one of the resonances in the ODMR spectrum of NV centers at zero bias field is heavily suppressed, and the sensing accuracy is thus decreased. This would impose restrictions on the maximum working pressure of NV sensing. There are three solutions when we encounter this threshold of O(101) MHz. A straightforward solution would be to use NDs in a pressure medium with a sufficiently high to ensure a hydrostatic environment around the NV centers. Another solution would be to fabricate a diamond anvil with some nanopillars on the anvil culet. The NV centers encompassed in the nanopillars would perceive a more hydrostatic environment similar to NDs drop-casted on the culet, as demonstrated in the finite-element simulations in Supplementary Materials. Besides, the crystal orientation of the nanopillers is definite in the laboratory frame, which is an advantage over NDs. The third solution would be to apply a bias magnetic field of such that the non-hydrostaticity is not the dominant term in the Hamiltonian, which has been demonstrated in the literature [19, 18].
Acknowledgements.
We thank P. T. Fong for the fruitful discussion. K.O.H acknowledges financial support from the Hong Kong PhD Fellowship Scheme. S.K.G. acknowledges financial support from Hong Kong RGC (GRF/14300418, GRF/14301020, and A-CUHK402/19). S.Y. acknowledges financial support from Hong Kong RGC (GRF/14304419). Kin On Ho, Man Yin Leung, and Wenyan Wang contributed equally to this work.References
- Drozdov et al. [2015] A. P. Drozdov, M. I. Eremets, I. A. Troyan, V. Ksenofontov, and S. I. Shylin. Conventional superconductivity at 203 kelvin at high pressures in the sulfur hydride system. Nature, 525(7567):73–76, Sep 2015. ISSN 1476-4687. doi: 10.1038/nature14964. URL https://doi.org/10.1038/nature14964.
- Somayazulu et al. [2019] Maddury Somayazulu, Muhtar Ahart, Ajay K. Mishra, Zachary M. Geballe, Maria Baldini, Yue Meng, Viktor V. Struzhkin, and Russell J. Hemley. Evidence for superconductivity above 260 k in lanthanum superhydride at megabar pressures. Phys. Rev. Lett., 122:027001, Jan 2019. doi: 10.1103/PhysRevLett.122.027001. URL https://link.aps.org/doi/10.1103/PhysRevLett.122.027001.
- Drozdov et al. [2019] A. P. Drozdov, P. P. Kong, V. S. Minkov, S. P. Besedin, M. A. Kuzovnikov, S. Mozaffari, L. Balicas, F. F. Balakirev, D. E. Graf, V. B. Prakapenka, E. Greenberg, D. A. Knyazev, M. Tkacz, and M. I. Eremets. Superconductivity at 250 k in lanthanum hydride under high pressures. Nature, 569(7757):528–531, May 2019. ISSN 1476-4687. doi: 10.1038/s41586-019-1201-8. URL https://doi.org/10.1038/s41586-019-1201-8.
- Kong et al. [2021] Panpan Kong, Vasily S. Minkov, Mikhail A. Kuzovnikov, Alexander P. Drozdov, Stanislav P. Besedin, Shirin Mozaffari, Luis Balicas, Fedor Fedorovich Balakirev, Vitali B. Prakapenka, Stella Chariton, Dmitry A. Knyazev, Eran Greenberg, and Mikhail I. Eremets. Superconductivity up to 243 k in the yttrium-hydrogen system under high pressure. Nature Communications, 12(1):5075, Aug 2021. ISSN 2041-1723. doi: 10.1038/s41467-021-25372-2. URL https://doi.org/10.1038/s41467-021-25372-2.
- Weir et al. [1996] S. T. Weir, A. C. Mitchell, and W. J. Nellis. Metallization of fluid molecular hydrogen at 140 gpa (1.4 mbar). Phys. Rev. Lett., 76:1860–1863, Mar 1996. doi: 10.1103/PhysRevLett.76.1860. URL https://link.aps.org/doi/10.1103/PhysRevLett.76.1860.
- Loubeyre et al. [2020] Paul Loubeyre, Florent Occelli, and Paul Dumas. Synchrotron infrared spectroscopic evidence of the probable transition to metal hydrogen. Nature, 577(7792):631–635, Jan 2020. ISSN 1476-4687. doi: 10.1038/s41586-019-1927-3. URL https://doi.org/10.1038/s41586-019-1927-3.
- Acosta et al. [2019] Victor M. Acosta, Louis S. Bouchard, Dmitry Budker, Ron Folman, Till Lenz, Patrick Maletinsky, Dominik Rohner, Yechezkel Schlussel, and Lucas Thiel. Color centers in diamond as novel probes of superconductivity. Journal of Superconductivity and Novel Magnetism, 32(1):85–95, Jan 2019. ISSN 1557-1947. doi: 10.1007/s10948-018-4877-3. URL https://doi.org/10.1007/s10948-018-4877-3.
- Barry et al. [2020] John F. Barry, Jennifer M. Schloss, Erik Bauch, Matthew J. Turner, Connor A. Hart, Linh M. Pham, and Ronald L. Walsworth. Sensitivity optimization for nv-diamond magnetometry. Rev. Mod. Phys., 92:015004, Mar 2020. doi: 10.1103/RevModPhys.92.015004. URL https://link.aps.org/doi/10.1103/RevModPhys.92.015004.
- Schirhagl et al. [2014] Romana Schirhagl, Kevin Chang, Michael Loretz, and Christian L. Degen. Nitrogen-vacancy centers in diamond: Nanoscale sensors for physics and biology. Annual Review of Physical Chemistry, 65(1):83–105, 2014. doi: 10.1146/annurev-physchem-040513-103659. URL https://doi.org/10.1146/annurev-physchem-040513-103659. PMID: 24274702.
- Jelezko and Wrachtrup [2006] F. Jelezko and J. Wrachtrup. Single defect centres in diamond: A review. physica status solidi (a), 203(13):3207–3225, 2006. doi: https://doi.org/10.1002/pssa.200671403. URL https://onlinelibrary.wiley.com/doi/abs/10.1002/pssa.200671403.
- Doherty et al. [2011] M W Doherty, N B Manson, P Delaney, and L C L Hollenberg. The negatively charged nitrogen-vacancy centre in diamond: the electronic solution. New Journal of Physics, 13(2):025019, feb 2011. doi: 10.1088/1367-2630/13/2/025019. URL https://doi.org/10.1088/1367-2630/13/2/025019.
- Ho et al. [2021a] Kin On Ho, Yang Shen, Yiu Yung Pang, Wai Kuen Leung, Nan Zhao, and Sen Yang. Diamond quantum sensors: from physics to applications on condensed matter research. Functional Diamond, 1(1):160–173, 2021a. doi: 10.1080/26941112.2021.1964926. URL https://doi.org/10.1080/26941112.2021.1964926.
- Ho et al. [2021b] Kin On Ho, King Cho Wong, Man Yin Leung, Yiu Yung Pang, Wai Kuen Leung, King Yau Yip, Wei Zhang, Jianyu Xie, Swee K. Goh, and Sen Yang. Recent developments of quantum sensing under pressurized environment using the nitrogen vacancy (nv) center in diamond. Journal of Applied Physics, 129(24):241101, 2021b. doi: 10.1063/5.0052233. URL https://doi.org/10.1063/5.0052233.
- Ádám Gali [2019] Ádám Gali. Ab initio theory of the nitrogen-vacancy center in diamond. Nanophotonics, 8(11):1907–1943, 2019. doi: doi:10.1515/nanoph-2019-0154. URL https://doi.org/10.1515/nanoph-2019-0154.
- Doherty et al. [2014a] Marcus W. Doherty, Viktor V. Struzhkin, David A. Simpson, Liam P. McGuinness, Yufei Meng, Alastair Stacey, Timothy J. Karle, Russell J. Hemley, Neil B. Manson, Lloyd C. L. Hollenberg, and Steven Prawer. Electronic properties and metrology applications of the diamond center under pressure. Phys. Rev. Lett., 112:047601, Jan 2014a. doi: 10.1103/PhysRevLett.112.047601. URL https://link.aps.org/doi/10.1103/PhysRevLett.112.047601.
- Steele et al. [2017] L. G. Steele, M. Lawson, M. Onyszczak, B. T. Bush, Z. Mei, A. P. Dioguardi, J. King, A. Parker, A. Pines, S. T. Weir, W. Evans, K. Visbeck, Y. K. Vohra, and N. J. Curro. Optically detected magnetic resonance of nitrogen vacancies in a diamond anvil cell using designer diamond anvils. Applied Physics Letters, 111(22):221903, 2017. doi: 10.1063/1.5004153. URL https://doi.org/10.1063/1.5004153.
- Yip et al. [2019] King Yau Yip, Kin On Ho, King Yiu Yu, Yang Chen, Wei Zhang, S. Kasahara, Y. Mizukami, T. Shibauchi, Y. Matsuda, Swee K. Goh, and Sen Yang. Measuring magnetic field texture in correlated electron systems under extreme conditions. Science, 366(6471):1355–1359, 2019. ISSN 0036-8075. doi: 10.1126/science.aaw4278. URL https://science.sciencemag.org/content/366/6471/1355.
- Lesik et al. [2019] Margarita Lesik, Thomas Plisson, Loïc Toraille, Justine Renaud, Florent Occelli, Martin Schmidt, Olivier Salord, Anne Delobbe, Thierry Debuisschert, Loïc Rondin, Paul Loubeyre, and Jean-François Roch. Magnetic measurements on micrometer-sized samples under high pressure using designed nv centers. Science, 366(6471):1359–1362, 2019. ISSN 0036-8075. doi: 10.1126/science.aaw4329. URL https://science.sciencemag.org/content/366/6471/1359.
- Hsieh et al. [2019] S. Hsieh, P. Bhattacharyya, C. Zu, T. Mittiga, T. J. Smart, F. Machado, B. Kobrin, T. O. Höhn, N. Z. Rui, M. Kamrani, S. Chatterjee, S. Choi, M. Zaletel, V. V. Struzhkin, J. E. Moore, V. I. Levitas, R. Jeanloz, and N. Y. Yao. Imaging stress and magnetism at high pressures using a nanoscale quantum sensor. Science, 366(6471):1349–1354, 2019. ISSN 0036-8075. doi: 10.1126/science.aaw4352. URL https://science.sciencemag.org/content/366/6471/1349.
- Ho et al. [2020] Kin On Ho, Man Yin Leung, Yaxin Jiang, Kin Pong Ao, Wei Zhang, King Yau Yip, Yiu Yung Pang, King Cho Wong, Swee K. Goh, and Sen Yang. Probing local pressure environment in anvil cells with nitrogen-vacancy (n-) centers in diamond. Phys. Rev. Applied, 13:024041, Feb 2020. doi: 10.1103/PhysRevApplied.13.024041. URL https://link.aps.org/doi/10.1103/PhysRevApplied.13.024041.
- Ivády et al. [2014] Viktor Ivády, Tamás Simon, Jeronimo R. Maze, I. A. Abrikosov, and Adam Gali. Pressure and temperature dependence of the zero-field splitting in the ground state of nv centers in diamond: A first-principles study. Phys. Rev. B, 90:235205, Dec 2014. doi: 10.1103/PhysRevB.90.235205. URL https://link.aps.org/doi/10.1103/PhysRevB.90.235205.
- Toraille et al. [2020] Loïc Toraille, Antoine Hilberer, Thomas Plisson, Margarita Lesik, Mayeul Chipaux, Baptiste Vindolet, Charles Pépin, Florent Occelli, Martin Schmidt, Thierry Debuisschert, Nicolas Guignot, Jean-Paul Itié, Paul Loubeyre, and Jean-François Roch. Combined synchrotron x-ray diffraction and NV diamond magnetic microscopy measurements at high pressure. New Journal of Physics, 22(10):103063, oct 2020. doi: 10.1088/1367-2630/abc28f. URL https://doi.org/10.1088/1367-2630/abc28f.
- Wang et al. [2021] Z Wang, C McPherson, R Kadado, N Brandt, S Edwards, WH Casey, and NJ Curro. ac sensing using nitrogen-vacancy centers in a diamond anvil cell up to 6 gpa. Physical Review Applied, 16(5):054014, 2021. doi: https://doi.org/10.1103/PhysRevApplied.16.054014.
- Barfuss et al. [2019] A. Barfuss, M. Kasperczyk, J. Kölbl, and P. Maletinsky. Spin-stress and spin-strain coupling in diamond-based hybrid spin oscillator systems. Phys. Rev. B, 99:174102, May 2019. doi: 10.1103/PhysRevB.99.174102. URL https://link.aps.org/doi/10.1103/PhysRevB.99.174102.
- Barson et al. [2017] Michael S. J. Barson, Phani Peddibhotla, Preeti Ovartchaiyapong, Kumaravelu Ganesan, Richard L. Taylor, Matthew Gebert, Zoe Mielens, Berndt Koslowski, David A. Simpson, Liam P. McGuinness, Jeffrey McCallum, Steven Prawer, Shinobu Onoda, Takeshi Ohshima, Ania C. Bleszynski Jayich, Fedor Jelezko, Neil B. Manson, and Marcus W. Doherty. Nanomechanical sensing using spins in diamond. Nano Letters, 17(3):1496–1503, 2017. doi: 10.1021/acs.nanolett.6b04544. URL https://doi.org/10.1021/acs.nanolett.6b04544. PMID: 28146361.
- Udvarhelyi et al. [2018] Péter Udvarhelyi, V. O. Shkolnikov, Adam Gali, Guido Burkard, and András Pályi. Spin-strain interaction in nitrogen-vacancy centers in diamond. Phys. Rev. B, 98:075201, Aug 2018. doi: 10.1103/PhysRevB.98.075201. URL https://link.aps.org/doi/10.1103/PhysRevB.98.075201.
- Broadway et al. [2019] D. A. Broadway, B. C. Johnson, M. S. J. Barson, S. E. Lillie, N. Dontschuk, D. J. McCloskey, A. Tsai, T. Teraji, D. A. Simpson, A. Stacey, J. C. McCallum, J. E. Bradby, M. W. Doherty, L. C. L. Hollenberg, and J.-P. Tetienne. Microscopic imaging of the stress tensor in diamond using in situ quantum sensors. Nano Letters, 19(7):4543–4550, 2019. doi: 10.1021/acs.nanolett.9b01402. URL https://doi.org/10.1021/acs.nanolett.9b01402. PMID: 31150580.
- Ho et al. [2021c] Kin On Ho, Man Yin Leung, Yiu Yung Pang, King Cho Wong, Ping Him Ng, and Sen Yang. In situ studies of stress environment in amorphous solids using negatively charged nitrogen vacancy (nv–) centers in nanodiamond. ACS Applied Polymer Materials, 3(1):162–170, 2021c. doi: 10.1021/acsapm.0c00964. URL https://doi.org/10.1021/acsapm.0c00964.
- Marshall et al. [2022] Mason C. Marshall, Reza Ebadi, Connor Hart, Matthew J. Turner, Mark J.H. Ku, David F. Phillips, and Ronald L. Walsworth. High-precision mapping of diamond crystal strain using quantum interferometry. Phys. Rev. Applied, 17:024041, Feb 2022. doi: 10.1103/PhysRevApplied.17.024041. URL https://link.aps.org/doi/10.1103/PhysRevApplied.17.024041.
- Doherty et al. [2012] M. W. Doherty, F. Dolde, H. Fedder, F. Jelezko, J. Wrachtrup, N. B. Manson, and L. C. L. Hollenberg. Theory of the ground-state spin of the nv- center in diamond. Phys. Rev. B, 85:205203, May 2012. doi: 10.1103/PhysRevB.85.205203. URL https://link.aps.org/doi/10.1103/PhysRevB.85.205203.
- Falk et al. [2014] Abram L. Falk, Paul V. Klimov, Bob B. Buckley, Viktor Ivády, Igor A. Abrikosov, Greg Calusine, William F. Koehl, Ádám Gali, and David D. Awschalom. Electrically and mechanically tunable electron spins in silicon carbide color centers. Phys. Rev. Lett., 112:187601, May 2014. doi: 10.1103/PhysRevLett.112.187601. URL https://link.aps.org/doi/10.1103/PhysRevLett.112.187601.
- Maze et al. [2011] J R Maze, A Gali, E Togan, Y Chu, A Trifonov, E Kaxiras, and M D Lukin. Properties of nitrogen-vacancy centers in diamond: the group theoretic approach. New Journal of Physics, 13(2):025025, feb 2011. doi: 10.1088/1367-2630/13/2/025025. URL https://doi.org/10.1088/1367-2630/13/2/025025.
- Doherty et al. [2014b] M. W. Doherty, V. M. Acosta, A. Jarmola, M. S. J. Barson, N. B. Manson, D. Budker, and L. C. L. Hollenberg. Temperature shifts of the resonances of the center in diamond. Phys. Rev. B, 90:041201, Jul 2014b. doi: 10.1103/PhysRevB.90.041201. URL https://link.aps.org/doi/10.1103/PhysRevB.90.041201.
- Kobayashi and Nisida [1993] Michihiro Kobayashi and Yosio Nisida. High pressure effects on photoluminescence spectra of color centers in diamond. Japanese Journal of Applied Physics, 32(S1):279, jan 1993. doi: 10.7567/jjaps.32s1.279. URL https://doi.org/10.7567/jjaps.32s1.279.
- Deng et al. [2014] Bei Deng, R. Q. Zhang, and X. Q. Shi. New insight into the spin-conserving excitation of the negatively charged nitrogen-vacancy center in diamond. Scientific Reports, 4(1):5144, Jun 2014. ISSN 2045-2322. doi: 10.1038/srep05144. URL https://doi.org/10.1038/srep05144.
- Udvarhelyi and Gali [2018] Péter Udvarhelyi and Adam Gali. Ab initio spin-strain coupling parameters of divacancy qubits in silicon carbide. Phys. Rev. Applied, 10:054010, Nov 2018. doi: 10.1103/PhysRevApplied.10.054010. URL https://link.aps.org/doi/10.1103/PhysRevApplied.10.054010.
- Kehayias et al. [2019] P. Kehayias, M. J. Turner, R. Trubko, J. M. Schloss, C. A. Hart, M. Wesson, D. R. Glenn, and R. L. Walsworth. Imaging crystal stress in diamond using ensembles of nitrogen-vacancy centers. Phys. Rev. B, 100:174103, Nov 2019. doi: 10.1103/PhysRevB.100.174103. URL https://link.aps.org/doi/10.1103/PhysRevB.100.174103.
- Xie et al. [2021] Jianyu Xie, Xinyou Liu, Wei Zhang, Sum Ming Wong, Xuefeng Zhou, Yusheng Zhao, Shanmin Wang, Kwing To Lai, and Swee K. Goh. Fragile pressure-induced magnetism in fese superconductors with a thickness reduction. Nano Letters, 21(21):9310–9317, 2021. doi: 10.1021/acs.nanolett.1c03508. URL https://doi.org/10.1021/acs.nanolett.1c03508. PMID: 34714653.
- Piermarini et al. [1973] G. J. Piermarini, S. Block, and J.D. Barnett. Hydrostatic limits in liquids and solids to 100 kbar. Journal of Applied Physics, 44(12):5377–5382, 1973. doi: 10.1063/1.1662159. URL https://doi.org/10.1063/1.1662159.
- Angel et al. [2007] Ross J. Angel, Maciej Bujak, Jing Zhao, G. Diego Gatta, and Steven D. Jacobsen. Effective hydrostatic limits of pressure media for high-pressure crystallographic studies. Journal of Applied Crystallography, 40(1):26–32, 2007. doi: 10.1107/S0021889806045523. URL https://onlinelibrary.wiley.com/doi/abs/10.1107/S0021889806045523.
- Tateiwa and Haga [2009] Naoyuki Tateiwa and Yoshinori Haga. Evaluations of pressure-transmitting media for cryogenic experiments with diamond anvil cell. Review of Scientific Instruments, 80(12):123901, 2009. doi: 10.1063/1.3265992. URL https://doi.org/10.1063/1.3265992.
- Klotz et al. [2009] S Klotz, J-C Chervin, P Munsch, and G Le Marchand. Hydrostatic limits of 11 pressure transmitting media. Journal of Physics D: Applied Physics, 42(7):075413, mar 2009. doi: 10.1088/0022-3727/42/7/075413. URL https://doi.org/10.1088%2F0022-3727%2F42%2F7%2F075413.
- Ho et al. [2022] Kin On Ho, Man Yin Leung, P. Reddy, Jianyu Xie, King Cho Wong, Yaxin Jiang, Wei Zhang, King Yau Yip, Wai Kuen Leung, Yiu Yung Pang, King Yiu Yu, Swee K. Goh, M.W. Doherty, and Sen Yang. Probing the evolution of the electron spin wave function of the nitrogen-vacancy center in diamond via pressure tuning. Phys. Rev. Appl., 18:064042, Dec 2022. doi: 10.1103/PhysRevApplied.18.064042. URL https://link.aps.org/doi/10.1103/PhysRevApplied.18.064042.
- Doherty et al. [2014c] M W Doherty, J Michl, F Dolde, I Jakobi, P Neumann, N B Manson, and J Wrachtrup. Measuring the defect structure orientation of a single centre in diamond. New Journal of Physics, 16(6):063067, jun 2014c. doi: 10.1088/1367-2630/16/6/063067. URL https://dx.doi.org/10.1088/1367-2630/16/6/063067.
- Kehayias et al. [2013] P. Kehayias, M. W. Doherty, D. English, R. Fischer, A. Jarmola, K. Jensen, N. Leefer, P. Hemmer, N. B. Manson, and D. Budker. Infrared absorption band and vibronic structure of the nitrogen-vacancy center in diamond. Phys. Rev. B, 88:165202, Oct 2013. doi: 10.1103/PhysRevB.88.165202. URL https://link.aps.org/doi/10.1103/PhysRevB.88.165202.
- McLaughlin et al. [2021] Nathan J. McLaughlin, Hailong Wang, Mengqi Huang, Eric Lee-Wong, Lunhui Hu, Hanyi Lu, Gerald Q. Yan, Genda Gu, Congjun Wu, Yi-Zhuang You, and Chunhui Rita Du. Strong correlation between superconductivity and ferromagnetism in an fe-chalcogenide superconductor. Nano Letters, 21(17):7277–7283, 2021. doi: 10.1021/acs.nanolett.1c02424. URL https://doi.org/10.1021/acs.nanolett.1c02424. PMID: 34415171.
- Monge et al. [2022] Richard Monge, Tom Delord, Nicholas Proscia, Zav Shotan, Harishankar Jayakumar, Jacob Henshaw, Pablo R. Zangara, Artur Lozovoi, Daniela Pagliero, Pablo D. Esquinazi, Toshu An, Inti Sodemann, Vinod M. Menon, and Carlos A. Meriles. Spin dynamics of a solid-state qubit in proximity to a superconductor, 2022. URL https://arxiv.org/abs/2207.07648.
- Tetienne et al. [2013] J.-P. Tetienne, T. Hingant, L. Rondin, A. Cavaillès, L. Mayer, G. Dantelle, T. Gacoin, J. Wrachtrup, J.-F. Roch, and V. Jacques. Spin relaxometry of single nitrogen-vacancy defects in diamond nanocrystals for magnetic noise sensing. Phys. Rev. B, 87:235436, Jun 2013. doi: 10.1103/PhysRevB.87.235436. URL https://link.aps.org/doi/10.1103/PhysRevB.87.235436.
- Schmid-Lorch et al. [2015] Dominik Schmid-Lorch, Thomas Häberle, Friedemann Reinhard, Andrea Zappe, Michael Slota, Lapo Bogani, Amit Finkler, and Jörg Wrachtrup. Relaxometry and dephasing imaging of superparamagnetic magnetite nanoparticles using a single qubit. Nano Letters, 15(8):4942–4947, 2015. doi: 10.1021/acs.nanolett.5b00679. URL https://doi.org/10.1021/acs.nanolett.5b00679. PMID: 26218205.
- Momenzadeh et al. [2015] S. Ali Momenzadeh, Rainer J. Stöhr, Felipe Favaro de Oliveira, Andreas Brunner, Andrej Denisenko, Sen Yang, Friedemann Reinhard, and Jörg Wrachtrup. Nanoengineered diamond waveguide as a robust bright platform for nanomagnetometry using shallow nitrogen vacancy centers. Nano Letters, 15(1):165–169, 2015. doi: 10.1021/nl503326t. URL https://doi.org/10.1021/nl503326t. PMID: 25438091.
- Widmann et al. [2015] C.J. Widmann, C. Giese, M. Wolfer, D. Brink, N. Heidrich, and C.E. Nebel. Fabrication and characterization of single crystalline diamond nanopillars with nv-centers. Diamond and Related Materials, 54:2–8, 2015. ISSN 0925-9635. doi: https://doi.org/10.1016/j.diamond.2014.10.005. URL https://www.sciencedirect.com/science/article/pii/S092596351400199X. Advances in Diamond Thin Films and Novel Nanocarbon Materials.
- Regan et al. [2020] Blake Regan, Alireza Aghajamali, Johannes Froech, Toan Trong Tran, John Scott, James Bishop, Irene Suarez-Martinez, Ying Liu, Julie M. Cairney, Nigel A Marks, Milos Toth, and Igor Aharonovich. Plastic deformation of single-crystal diamond nanopillars. Advanced Materials, 32(9):1906458, 2020. doi: https://doi.org/10.1002/adma.201906458. URL https://onlinelibrary.wiley.com/doi/abs/10.1002/adma.201906458.
- Zou et al. [2008] YS Zou, Y Yang, WJ Zhang, YM Chong, B He, I Bello, and ST Lee. Fabrication of diamond nanopillars and their arrays. Applied Physics Letters, 92(5):053105, 2008. doi: https://doi.org/10.1063/1.2841822.
- Zaera [2012] Francisco Zaera. Probing liquid/solid interfaces at the molecular level. Chemical Reviews, 112(5):2920–2986, 2012. doi: 10.1021/cr2002068. URL https://doi.org/10.1021/cr2002068. PMID: 22277079.