Do simulated molecular clouds look like real ones?
Abstract
Simulations of molecular clouds often begin from highly idealised initial conditions, such as a uniform-density sphere with an artificially imposed turbulent velocity field. While the resulting structures may appear qualitatively similar to those detected in continuum and line observations, it is unclear whether they are genuinely representative of real molecular clouds. Recent observational work has discovered a tight, often close-to-linear relationship between the integrated intensity of molecular lines and the total column density of the cloud material. We combine magnetohydrodynamical simulations, time-dependent chemistry, and radiative transfer to produce synthetic molecular line observations of model clouds. We find similarly tight correlations between line intensity and column density to those observed, although the linear behaviour is only seen in isolated (as opposed to colliding) model clouds. This linear relationship is not due to optically thin emission; all lines investigated have high optical depths, and the increase in integrated intensity with column density is due to higher velocity dispersion along the line of sight. Overall, the idealised models commonly used in the literature appear to be reasonably accurate representations of real molecular clouds.
keywords:
astrochemistry – stars: formation – ISM: molecules – ISM: clouds – ISM: structure1 Introduction
Stars form in molecular clouds, regions of the interstellar medium (ISM) where densities are high enough () and temperatures low enough () for most atoms to be bound in molecules (Bergin & Tafalla, 2007). How these clouds themselves are formed is not completely understood. Simulations on the scales of entire galaxies can track the conversion of ISM material into the dense, star-forming phase (e.g. Dobbs et al., 2015; Walch et al., 2015; Duarte-Cabral & Dobbs, 2016), but typically lack the resolution to follow the formation of individual stars or stellar systems (although with some exceptions; Seifried et al. 2017b; Smith et al. 2020; Whitworth et al. 2022). Cloud-scale simulations therefore generally start from highly idealised initial conditions, such as spheres or periodic boxes, with artificially-induced turbulence and (if present) uniform magnetic fields (e.g. Federrath, 2016; Wurster et al., 2019). We explore here how well these simulated clouds correspond to those actually observed.
A key issue is that simulation outputs do not directly correspond to observable quantities. Most column densities for molecular clouds are derived from thermal dust emission, but the optical properties of interstellar dust are notoriously uncertain (Clark et al., 2019b; Whitworth et al., 2019), and this only provides a two-dimensional view of the structure. Extracting physical properties from molecular line observations has its own complications, including the effects of optical depth, excitation and abundance, and structures seen in PPV space do not always correspond to physical ones in PPP space (Clarke et al., 2018). The relationship between the polarization angle of thermal dust emission and the direction of the magnetic field responsible for it is highly complex, involving the effects of grain alignment, viewing angle, and line-of-sight field variations (Chen et al., 2016; King et al., 2018; Seifried et al., 2019). Measurements of the magnetic field strength itself are subject to large uncertainties, both experimental and systematic (Lyo et al., 2021; Skalidis et al., 2021; Pattle et al., 2022). Great care should be exercised when comparing the predicted physical properties of simulated clouds with those derived from observations, as the quantities involved are not measuring the same things.
An alternative approach is to produce synthetic observations of simulated clouds, which can then be compared directly to the data. In addition to the underlying physical model, this requires assumptions about the dust properties and/or the molecular composition of the gas, but the latter at least can be calculated with a model of the time-dependent chemical evolution. Modern simulations often include CO chemistry due to its importance as a coolant, allowing a self-consistent determination of its predicted line intensities (e.g. Peñaloza et al., 2017; Seifried et al., 2017a; Clark et al., 2019a), and there are plentiful observational data for various CO transitions and isotopologues (e.g. Rigby et al., 2019; Eden et al., 2020; Duarte-Cabral et al., 2021). However, high molecular abundances and low critical densities make these lines poor tracers of the high-density regions where stars actually form (Shirley, 2015). So far, most work on molecules tracing denser material has relied on somewhat ad-hoc assumptions about their abundances (Smith et al., 2012, 2013; Jones et al., 2021), which may not accurately represent the actual chemical behaviour (Priestley & Whitworth, 2020).
Tafalla et al. (2021) have demonstrated a technique to efficiently sample how individual line intensities vary with total gas column density in molecular clouds, via randomly sampling regions of different column density. Achieving this for species other than CO has previously involved a significant investment of telescope time (Pety et al., 2017; Kauffmann et al., 2017; Barnes et al., 2020), limiting the number of clouds which could be covered. Tafalla et al. (2021) find extremely regular behaviour in the Perseus molecular cloud for most of the lines observed, with intensity increasing almost exactly linearly with column density. This represents an ideal test for models of star formation - if simulated clouds do not show the same behvaiour, then some aspect of the underlying physical/chemical model is incorrect, or at least not applicable to this particular object. In this paper, we use a combination of magnetohydrodynamic (MHD) simulations, time-dependent chemistry, and radiative transfer to predict the intensity-column density relationships of simulated molecular clouds, for a number of commonly-observed lines. By comparing these with the Tafalla et al. (2021) data, we investigate whether common model assumptions actually produce clouds which resemble real ones.
2 Method

| Model | Type | / | / | / | / | / | Dir. | / | / | / |
|---|---|---|---|---|---|---|---|---|---|---|
| TURB | Isolated | - | - | - | ||||||
| MAG | Isolated | - | - | |||||||
| COLL | Colliding | - | ||||||||
| SHEAR | Colliding | - | ||||||||
| COLLBPAR | Colliding | |||||||||
| COLLBPERP | Colliding |
| Element | Abundance | Element | Abundance | |
|---|---|---|---|---|
| C | S | |||
| N | Si | |||
| O | Mg |


We perform smoothed-particle (magneto)hydrodynamic (SPH) simulations of molecular clouds using the phantom code (Price et al., 2018). For the equation of state, we use
| (1) |
where is the number density of hydrogen nuclei in all forms, with a temperature floor of and a ceiling of . We find that this double power-law shape provides an excellent fit to calculations of the equilibrium gas temperature between and from Wolfire et al. (2003), as shown in Figure 1, and is a good approximation to the results of simulations including full non-equilibrium thermodynamics (e.g. Smith et al., 2020). We consider spherical clouds of mass and radius , giving an initial mean111SPH particles are positioned randomly within the cloud volume, so the initial density is not exactly uniform. density , and SPH particles per cloud, for an SPH particle mass . The clouds initially have a turbulent velocity field, with power spectrum (where is the wavenumber), a thermal mixture of compressive and solenoidal modes, and a root-mean-squared velocity of , generated following Lomax et al. (2015).
We consider simulations of isolated single clouds, and of collisions between two identical clouds, displaced along the axis by and given an additional velocity in the direction of . For models including magnetic fields, we use a uniform field strength of , giving a mass-to-flux ratio of twice the critical value (Mouschovias & Spitzer, 1976), and consistent with the observed column density-field strength relationship (Crutcher, 2012; Liu et al., 2022; Pattle et al., 2022). We also investigate colliding models offset in the direction by to produce shearing rather than head-on collisions (Balfour et al., 2017). The computational domain is a cubic box with side lengths and periodic boundary conditions, and the remainder of the volume is filled by a low-density medium with mean density times lower than that of the clouds. We run the SPH simulations until , when the maximum density exceeds . Model properties are listed in Table 1.
For each of our simulations, we randomly select SPH particles from within the clouds, and use their density and temperature evolution as input for uclchem (Holdship et al., 2017), a time-dependent gas-grain chemical code, using the UMIST12 reaction network (McElroy et al., 2013). We use elemental abundances from Sembach et al. (2000), as listed in Table 2, and assume all hydrogen is initially in the form of H2. The cosmic ray ionisation rate per H2 molecule is set to , and the ambient radiation field to Habing units (Habing, 1968). We assume each particle is shielded by a column of gas equal to the local density multiplied by the local Jeans length,
| (2) |
where is the sound speed, is the gravitational constant, and is the mass density. The visual extinction is then given by (Bohlin et al., 1978).
Self-shielding of H2 and CO is complicated by the numerous lines involved saturating, or being shifted to different frequencies by the bulk motion of the gas. We follow Glover & Mac Low (2007) and assume the minimum possible self-shielding: the local density of the molecule multiplied by the effective particle size,
| (3) |
where and are the shielding column density and abundance of molecular species . The suppression of the photodissociation rate due to self-shielding is then calculated following Federman et al. (1979) for H2 and van Dishoeck & Black (1988) for CO. Our results are not sensitive to the implementation of self-shielding; if we instead use the total column density from Equation 2 multiplied by the local molecular abundance, we find similar results to those obtained using Equation 3.
We use the three-dimensional physical and chemical structure of the clouds as input for line radiative transfer modelling with lime (Brinch & Hogerheijde, 2010). Each sampling point generated by lime is assigned the properties (density, temperature, velocity, and molecular abundance) of the nearest post-processed SPH particle. We use sampling points, with dust properties from Ossenkopf & Henning (1994) and molecular data from the lamda database (Schöier et al., 2005). Our output position-position-velocity cubes have spatial resolution and velocity resolution . We have made the results of the radiative transfer modelling publicly available at http://cloudzoo.astro.cf.ac.uk/Downloads/202211/.
As our chemical network does not distinguish between isotopes, we assume the ratios of molecular isotopologues are equal to the Wilson & Rood (1994) isotope values (specifically, for 12C/13C). Under the relevant physical conditions, isotopic chemistry will alter this value by at most a factor of for 12CO/13CO (Szűcs et al., 2014). In order to make the large number of radiative transfer calculations computationally feasible, we neglect hyperfine structure for those molecules where it is relevant, adopting lamda datafiles using a single-level approximation. We investigate the consequences of a full treatment of hyperfine structure in Appendix A.
3 Results
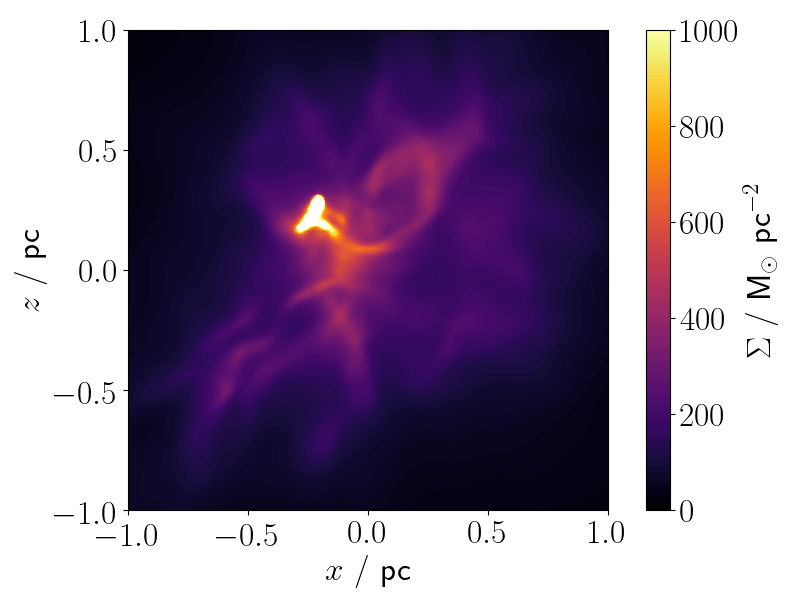
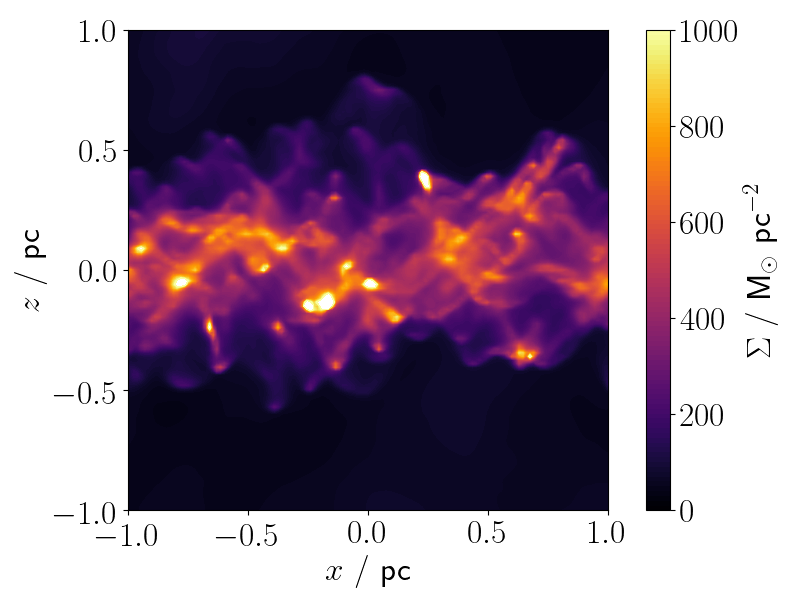
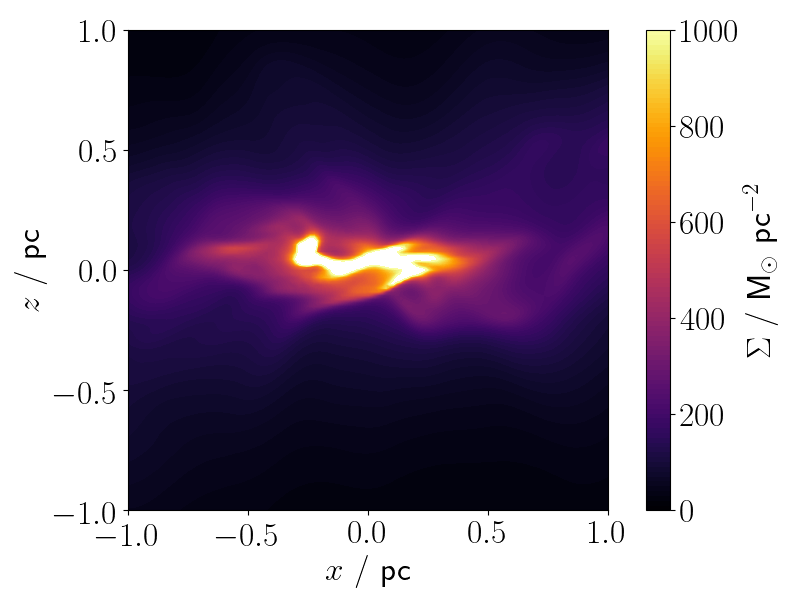
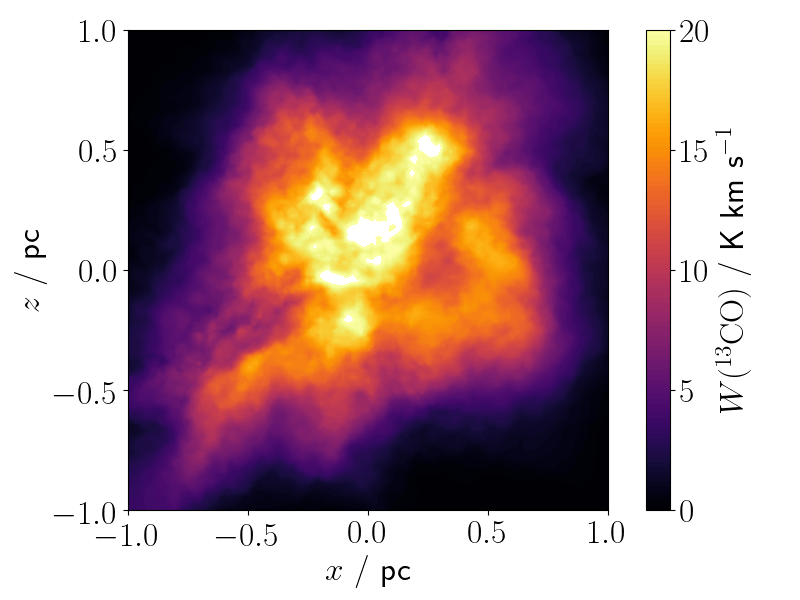
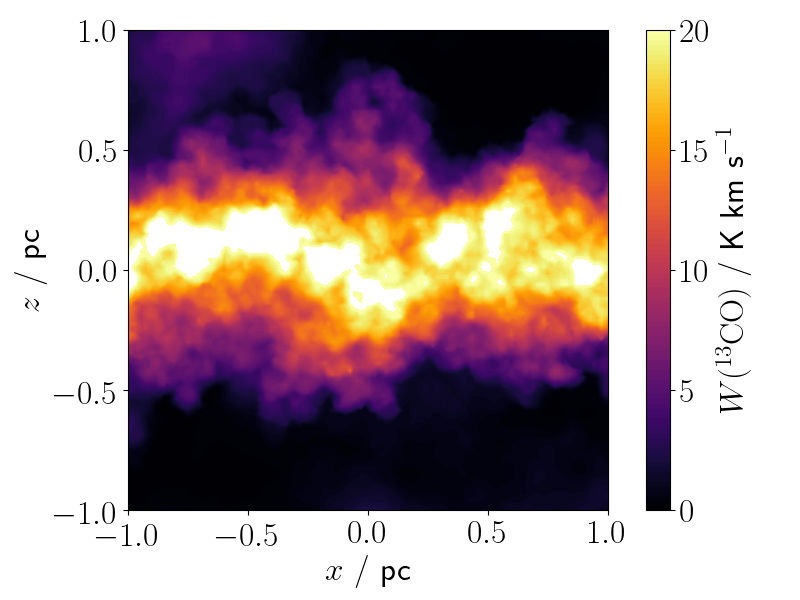
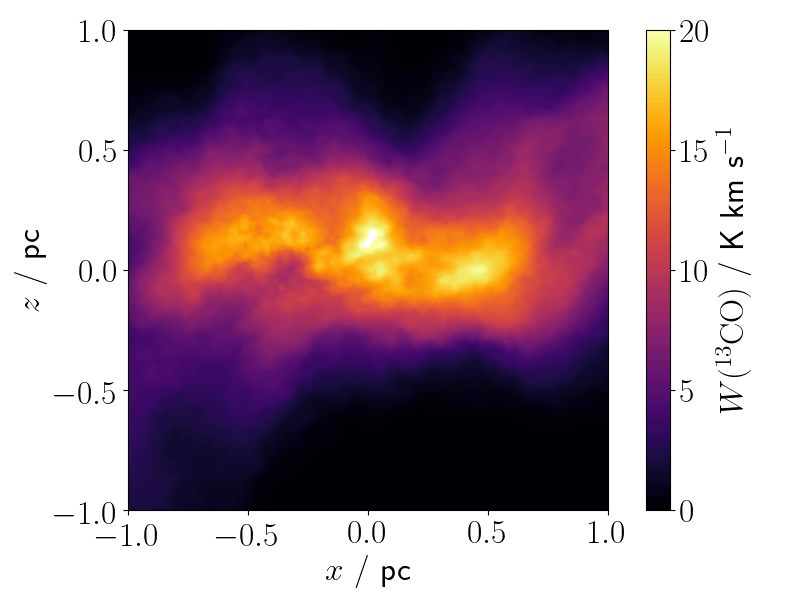
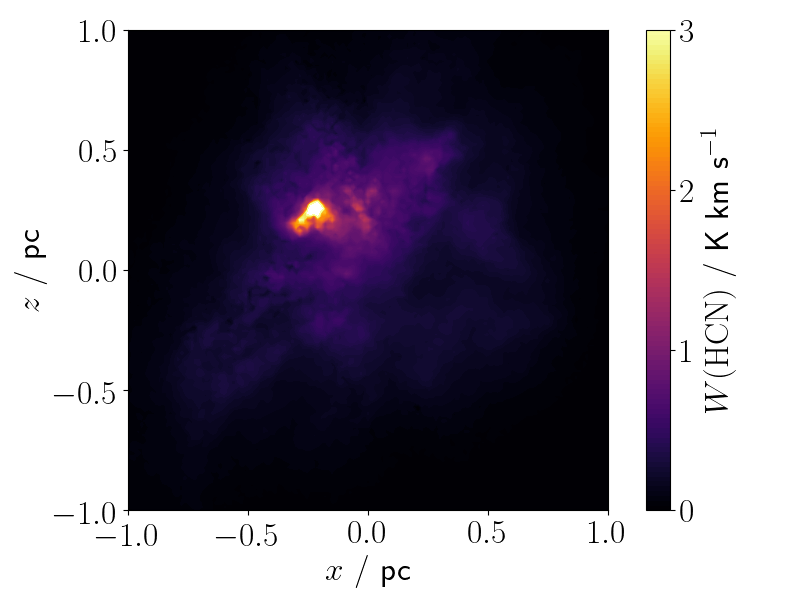
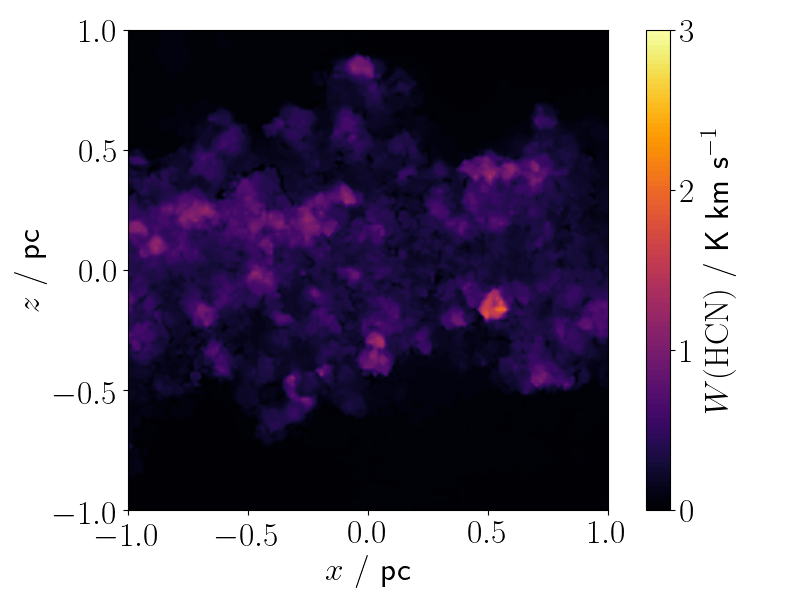
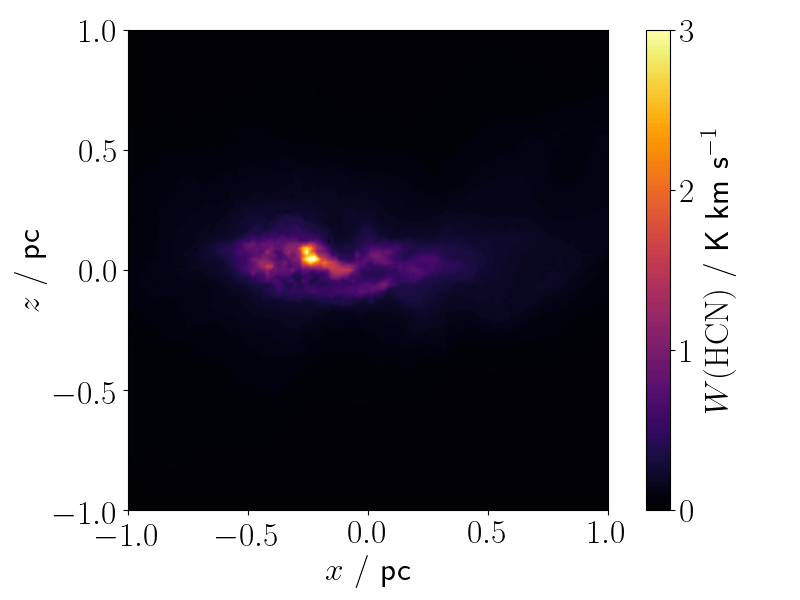
Figure 2 shows the TURB, COLL and MAG models at , seen in the plane (i.e. with collision axis/magnetic field aligned vertically), in column density and the integrated intensity of the 13CO and HCN lines. All three models have broadly filamentary substructure, although the magnetic field has prevented fragmentation to some extent in the MAG model. This substructure is almost completely invisible in the 13CO emission, as the line becomes optically thick and saturates at relatively low densities, resulting in a much lower contrast between low- and high-density regions of the clouds. Structures therefore appear more extended than they actually are (Priestley & Whitworth, 2020). HCN does not suffer from this issue, and the underlying density structures can be recovered to some extent in the TURB and MAG models. The same does not apply to the COLL simulation; the central column density peak, for example, is indiscernable in HCN emission.
We demonstrate this quantitatively in Figure 3, showing the median integrated intensities as a function of column density for the 13CO, HCN and N2H+ lines, compared to equivalent observational data for the Perseus molecular cloud from Tafalla et al. (2021). For all three models, the 13CO intensity rises steeply with density before plateauing beyond , as the emission saturates. The model predictions are in good agreement with observation, with the exception of the MAG and COLL models seen in the plane (i.e. along either the collision or magnetic field axis). In these cases, there is a deficit of emission at high column density and, for the COLL model, an excess at low column density. We attribute this to the more sheet-like geometry of these two models; when seen face-on, the typical volume density for a given column density is higher than in the more extended TURB model. The line intensity is then higher at low column density due to higher collisional excitation rates, but at high column density the saturation effect becomes stronger.
The TURB model is also able to reproduce the observed HCN intensity-column density behaviour, as is the MAG model seen in the and planes. The approximately linear relationship found by Tafalla et al. (2021) is recovered. Although model intensities are lower than observed, this is due to the single-level approximation for the line’s hyperfine structure. When all hyperfine components are included in the radiative transfer modelling, the integrated intensity of all three components together is higher than that of the single combined line, and in good agreement with the observed values (Appendix A).
Regardless of viewing angle, the COLL model fails to reproduce the linear trend for HCN, predicting a plateau in intensity beginning at around . A similar phenomenon happens for the MAG model in the plane, seen along the magnetic field axis. This occurs even with the inclusion of hyperfine structure (Appendix A). Unlike 13CO, HCN emission primarily originates from local overdensities which have substantial optical depths, so the line is optically thick at virtually all column densities for which there is significant emission. Figure 4 shows the intensity ratio of HCN to H13CN for the TURB model,222The lamda database does not contain collisional coefficients or energy levels for the H13CN isotopologue, so we assume the same values as for HCN, and reduce the molecular abundance by the 12C/13C ratio. which is significantly lower than the abundance ratio of for column densities above , signifying large departures from optically thin emission.
Increasing the integrated intensity of an optically thick line requires not just that there is more material along the line of sight, but that it has a large enough velocity dispersion for this additional material to contribute. Figure 5 shows the velocity dispersion of the gas in the plane for the TURB, COLL and MAG models. For the TURB and MAG models, the mass-weighted velocity dispersion increases up to a column density of , beyond which it declines. However, the volume-weighted dispersion remains roughly constant. As the high-density material will become increasingly less important to the observed emission as column densities (and thus optical depths) increase, the mass-weighted dispersion becomes correspondingly less representative of the available bandwidth compared to the volume-weighted quantity (although neither is a perfect representation). The MAG model reaches lower absolute values for both quantities, leading to the lower intensity at a given column density seen in Figure 3. The COLL model has a roughly constant velocity dispersion beyond , regardless of weighting, which means no additional bandwidth for emission is available, and the line intensity saturates.
The increase in velocity dispersion with column density in Figure 5 appears incompatible with the flat behaviour of line full-widths at half-maximum (FWHMs) found by Tafalla et al. (2021). However, the resulting line profiles do, in fact, reproduce this behaviour, such as the 13CO FWHMs shown in Figure 6, although the typical widths of are somewhat lower than the values seen in Perseus. The high optical depths of the lines make them unreliable tracers of the underlying gas dynamics.
The N2H+ line shows similar behaviour to HCN; the TURB model, and the MAG model viewed perpendicular to the field, are in reasonable agreement with the Perseus data, whereas the COLL model predicts a break in the intensity-column density relation which is not observed. However, in this case the inclusion of hyperfine structure may be sufficient to resolve the issue, although all hyperfine models in Appendix A appear to somewhat overpredict the N2H+ intensity, particularly the COLL model. Notably, all models recover the non-linear behaviour of this line, with an apparent break in the intensity scaling at around . We emphasise that this was not inserted by hand; it appears to be a natural outcome of the combination of dynamics, chemistry, and radiative transfer.
The inconsistency between the predicted HCN intensity from the COLL model and the observed values appears to be quite general to simulations of colliding clouds. Figure 7 shows results from the SHEAR model, where the clouds are offset perpendicularly to the collision axis, and the COLLBPAR and COLLBPERP models, with a magnetic field parallel or perpendicular to the collision axis respectively. The SHEAR and COLLBPAR models both behave quite similarly to the COLL case (for HCN and for other lines), with a break in the intensity scaling that is not seen in the data. Only the COLLBPERP model recovers an approximately linear intensity-column density relationship, as the perpendicular magnetic field tends to resist the compression of the interacting layer and the subsequent decline in velocity dispersion. In fact, this model appears to be in better agreement with the data than the isolated MAG model in Figure 3.
The lines in Figure 3 show, to some extent, agreement between the predicted and observed values. Figure 8 shows two lines where this is not the case, CS and HCO+ . The CS line intensity is strongly variable with viewing angle, even for the TURB model where there is no preferred direction, and while some orientations are a good match to the Tafalla et al. (2021) observations, most are not. This is a radiative transfer effect; the CS column density as a function of column density is statistically identical for viewing angles where the model geometry suggests this should be the case.
Conversely, the poor agreement between predicted and observed HCO+ intensities appears to be a chemical effect. Figure 9 shows molecular abundances as a function of volume density for the TURB model (other models display similar qualitative behaviour). HCN, like CO, rises to a peak abundance at a density of around and stays roughly constant above that point, whereas the N2H+ abundance is negligible at and continues to rise up to . This causes the differences in the behaviour of the lines seen in Figure 3. In Figure 9, the HCO+ abundance is more similar to N2H+, leading to a comparable break in the intensity scaling in Figure 8. The observed behaviour is a linear relationship, as for HCN, suggesting that the chemistry of HCO+ should have the same qualitative behaviour as this (and other) molecules.333The CS abundance behaves very similarly to that of HCN, further reinforcing that the differences in line behaviour with viewing angle are an optical depth effect. The underlying reasons for this discrepancy are, however, beyond the scope of this paper.
4 Discussion
4.1 Optically thick lines
The near-linear relationship between intensity and column density for most lines investigated by Tafalla et al. (2021) would be naturally explained by optically thin emission. However, our results suggest that lines are in fact optically thick over almost the entire column density range (Figure 4), and the observed linear scaling is due to a ‘bandwidth’ effect (e.g. Whitworth & Jaffa, 2018) from the velocity dispersion. While it is somewhat surprising that this results in the observed near-perfect linear relationship, at least for non-colliding models, it appears to occur naturally from the combination of hydrodynamics, chemistry and radiative transfer employed. Jones et al. (2021), using a more sophisticated physical model with a simplified chemical network, also found that the HCN line is optically thick in nearly all situations where it is visible.
If lines are optically thick, it follows that there is little (if any) correlation between the column density of the molecule and the line intensity. This limits the utility of chemically post-processed simulations without radiative transfer modelling (e.g. Gómez et al., 2022; Panessa et al., 2022) for interpreting observational data. While optical depths can be estimated if a transition from a less-common isotopologue is available, this is typcally only possible at high column densities where the weaker lines are detectable. Panessa et al. (2022) have no optical depth measurements for HCO+, and thus no reliable column density measurements, below ; this is also the point (probably not coincidentally) at which their models begin disagreeing with the data. Dynamical information estimated from line profiles may also be a poor representation of the actual gas dynamics in molecular clouds (compare Figures 5 and 6). We suggest that more effort be invested in producing synthetic observational data from simulations, rather than attempting to extract comparable physical properties from the observations themselves.
4.2 Cloud collisions
Cloud collision models (with the possible exception of the COLLBPERP case; Figure 7) appear to predict a fundamentally different relationship between line intensity and column density for several molecules, essentially because these species are concentrated in the compressed layer between clouds (Priestley & Whitworth, 2021) where the initial turbulent velocity dispersion has mostly dissipated. The Perseus data from Tafalla et al. (2021) suggests that this cloud is much better represented as an isolated cloud, rather than one formed via a collision. Comparable observational data are available for Orion A (Kauffmann et al., 2017), Orion B (Pety et al., 2017) and W49A (Barnes et al., 2020); of these three, only Orion B has an HCN intensity scaling resembling our colliding models, which would tend to support the collision scenario proposed by Enokiya et al. (2021) based on features in the CO line profiles (Haworth et al., 2015).
While these ‘bridging features’ are frequently identified in other regions (e.g. Maity et al., 2022), their identification is somewhat subjective, and many claimed detections bear very little resemblance to the Haworth et al. (2015) diagnostic. The relatively uniform increase in HCN and other line intensities with column density in three out of four clouds suggests that these collisions may be less common than is often assumed. The differences between isolated and colliding models (Figures 3 and 7) occur for all viewing angles, unlike bridging features, which are only visible when the system is viewed along (or close to) the collision axis (Haworth et al., 2015; Priestley & Whitworth, 2021). This could make the line intensity scaling behaviour a useful - and independent - observational diagnostic of cloud collisions. We plan to investigate this possibility further in future work.
An important caveat here is that we have simulated collisions between molecular clouds. These are chemically quite different from collisions between lower density, initially atomic gas clouds, which, for example, do not show any CO bridging features (Clark et al., 2019a). Although the restriction of molecular emission to the compressed layer, and the reduction in velocity dispersion, should both still hold in the atomic case, further work is necessary to assess the impact on the line intensity scaling.
4.3 Do simulated clouds look like real ones?
Given the complexity of going from the gas dynamics of a molecular cloud to its line emission via its chemical evolution, there was no guarantee that the model cloud properties we selected would result in anything resembling reality. While some models, in particular the colliding ones, are in tension with the Perseus data for some lines, in general there is impressive agreement between the model predictions and the data. Perseus is only one cloud; the fact that the models reproduce the tight correlation between line intensity and column density seen in all clouds where this has been tested (Pety et al., 2017; Kauffmann et al., 2017; Barnes et al., 2020; Tafalla et al., 2021) suggests that they are correctly capturing the underlying physics, particularly as it is not simply due to optically thin emission. We have not investigated the impact of varying the initial cloud parameters beyond those in Table 1, but it seems highly unlikely that we have stumbled upon the ‘correct’ values by accident. The simplified molecular cloud models in wide use in the literature appear to reproduce the observational properties of real clouds quite well.
5 Conclusions
We have combined MHD simulations, time-dependent chemistry, and radiative transfer models to produce synthetic molecular line observations of simulated molecular clouds. Our models reproduce the tight relationship between line intensity and column density seen in observational data. The linear scaling found for most lines by Tafalla et al. (2021) in the Perseus molecular cloud is only reproduced by isolated clouds, as opposed to colliding models. All lines have high optical depths; increases in integrated intensity with column density are driven by higher velocity dispersions, not directly by the higher total column density of gas as in optically thin emission. The line emission properties of the simulated clouds are in reasonable agreement with those observed, suggesting that they are acceptable representations of reality.
Acknowledgements
We are grateful to Mario Tafalla for a useful discussion about the observational data and its interpretation. The authors acknowledge the support of a consolidated grant (ST/K00926/1) from the UK Science and Technology Facilities Council (STFC).
Data Availability
The data underlying this article will be shared on request. The SPH and radiative transfer data used in the analysis are publicly available at http://cloudzoo.astro.cf.ac.uk/Downloads/202211/.
References
- Balfour et al. (2017) Balfour S. K., Whitworth A. P., Hubber D. A., 2017, MNRAS, 465, 3483
- Barnes et al. (2020) Barnes A. T., et al., 2020, MNRAS, 497, 1972
- Bergin & Tafalla (2007) Bergin E. A., Tafalla M., 2007, ARA&A, 45, 339
- Bohlin et al. (1978) Bohlin R. C., Savage B. D., Drake J. F., 1978, ApJ, 224, 132
- Brinch & Hogerheijde (2010) Brinch C., Hogerheijde M. R., 2010, A&A, 523, A25
- Chen et al. (2016) Chen C.-Y., King P. K., Li Z.-Y., 2016, ApJ, 829, 84
- Clark et al. (2019a) Clark P. C., Glover S. C. O., Ragan S. E., Duarte-Cabral A., 2019a, MNRAS, 486, 4622
- Clark et al. (2019b) Clark C. J. R., et al., 2019b, MNRAS, 489, 5256
- Clarke et al. (2018) Clarke S. D., Whitworth A. P., Spowage R. L., Duarte-Cabral A., Suri S. T., Jaffa S. E., Walch S., Clark P. C., 2018, MNRAS, 479, 1722
- Crutcher (2012) Crutcher R. M., 2012, ARA&A, 50, 29
- Dobbs et al. (2015) Dobbs C. L., Pringle J. E., Duarte-Cabral A., 2015, MNRAS, 446, 3608
- Duarte-Cabral & Dobbs (2016) Duarte-Cabral A., Dobbs C. L., 2016, MNRAS, 458, 3667
- Duarte-Cabral et al. (2021) Duarte-Cabral A., et al., 2021, MNRAS, 500, 3027
- Eden et al. (2020) Eden D. J., et al., 2020, MNRAS, 498, 5936
- Enokiya et al. (2021) Enokiya R., et al., 2021, PASJ, 73, S256
- Federman et al. (1979) Federman S. R., Glassgold A. E., Kwan J., 1979, ApJ, 227, 466
- Federrath (2016) Federrath C., 2016, MNRAS, 457, 375
- Glover & Mac Low (2007) Glover S. C. O., Mac Low M.-M., 2007, ApJS, 169, 239
- Gómez et al. (2022) Gómez G. C., Walsh C., Palau A., 2022, MNRAS, 513, 1244
- Habing (1968) Habing H. J., 1968, Bull. Astron. Inst. Netherlands, 19, 421
- Haworth et al. (2015) Haworth T. J., et al., 2015, MNRAS, 450, 10
- Holdship et al. (2017) Holdship J., Viti S., Jiménez-Serra I., Makrymallis A., Priestley F., 2017, AJ, 154, 38
- Jones et al. (2021) Jones G. H., Clark P. C., Glover S. C. O., Hacar A., 2021, arXiv e-prints, p. arXiv:2112.05543
- Kauffmann et al. (2017) Kauffmann J., Goldsmith P. F., Melnick G., Tolls V., Guzman A., Menten K. M., 2017, A&A, 605, L5
- King et al. (2018) King P. K., Fissel L. M., Chen C.-Y., Li Z.-Y., 2018, MNRAS, 474, 5122
- Liu et al. (2022) Liu J., Qiu K., Zhang Q., 2022, ApJ, 925, 30
- Lomax et al. (2015) Lomax O., Whitworth A. P., Hubber D. A., 2015, MNRAS, 449, 662
- Lyo et al. (2021) Lyo A. R., et al., 2021, ApJ, 918, 85
- Maity et al. (2022) Maity A. K., Dewangan L. K., Sano H., Tachihara K., Fukui Y., Bhadari N. K., 2022, ApJ, 934, 2
- McElroy et al. (2013) McElroy D., Walsh C., Markwick A. J., Cordiner M. A., Smith K., Millar T. J., 2013, A&A, 550, A36
- Mouschovias & Spitzer (1976) Mouschovias T. C., Spitzer L. J., 1976, ApJ, 210, 326
- Ossenkopf & Henning (1994) Ossenkopf V., Henning T., 1994, A&A, 291, 943
- Panessa et al. (2022) Panessa M., Seifried D., Walch S., Gaches B., Barnes A. T., Bigiel F., Neumann L., 2022, arXiv e-prints, p. arXiv:2210.06251
- Pattle et al. (2022) Pattle K., Fissel L., Tahani M., Liu T., Ntormousi E., 2022, arXiv e-prints, p. arXiv:2203.11179
- Peñaloza et al. (2017) Peñaloza C. H., Clark P. C., Glover S. C. O., Shetty R., Klessen R. S., 2017, MNRAS, 465, 2277
- Pety et al. (2017) Pety J., et al., 2017, A&A, 599, A98
- Price et al. (2018) Price D. J., et al., 2018, Publ. Astron. Soc. Australia, 35, e031
- Priestley & Whitworth (2020) Priestley F. D., Whitworth A. P., 2020, MNRAS, 499, 3728
- Priestley & Whitworth (2021) Priestley F. D., Whitworth A. P., 2021, MNRAS, 506, 775
- Rigby et al. (2019) Rigby A. J., et al., 2019, A&A, 632, A58
- Schöier et al. (2005) Schöier F. L., van der Tak F. F. S., van Dishoeck E. F., Black J. H., 2005, A&A, 432, 369
- Seifried et al. (2017a) Seifried D., Sánchez-Monge Á., Suri S., Walch S., 2017a, MNRAS, 467, 4467
- Seifried et al. (2017b) Seifried D., et al., 2017b, MNRAS, 472, 4797
- Seifried et al. (2019) Seifried D., Walch S., Reissl S., Ibáñez-Mejía J. C., 2019, MNRAS, 482, 2697
- Sembach et al. (2000) Sembach K. R., Howk J. C., Ryans R. S. I., Keenan F. P., 2000, ApJ, 528, 310
- Shirley (2015) Shirley Y. L., 2015, PASP, 127, 299
- Skalidis et al. (2021) Skalidis R., Sternberg J., Beattie J. R., Pavlidou V., Tassis K., 2021, A&A, 656, A118
- Smith et al. (2012) Smith R. J., Shetty R., Stutz A. M., Klessen R. S., 2012, ApJ, 750, 64
- Smith et al. (2013) Smith R. J., Shetty R., Beuther H., Klessen R. S., Bonnell I. A., 2013, ApJ, 771, 24
- Smith et al. (2020) Smith R. J., et al., 2020, MNRAS, 492, 1594
- Szűcs et al. (2014) Szűcs L., Glover S. C. O., Klessen R. S., 2014, MNRAS, 445, 4055
- Tafalla et al. (2021) Tafalla M., Usero A., Hacar A., 2021, A&A, 646, A97
- Walch et al. (2015) Walch S., et al., 2015, MNRAS, 454, 238
- Whitworth & Jaffa (2018) Whitworth A. P., Jaffa S. E., 2018, A&A, 611, A20
- Whitworth et al. (2019) Whitworth A. P., et al., 2019, MNRAS, 489, 5436
- Whitworth et al. (2022) Whitworth D. J., Smith R. J., Tress R., Kay S. T., Glover S. C. O., Sormani M. C., Klessen R. S., 2022, MNRAS, 510, 4146
- Wilson & Rood (1994) Wilson T. L., Rood R., 1994, ARA&A, 32, 191
- Wolfire et al. (2003) Wolfire M. G., McKee C. F., Hollenbach D., Tielens A. G. G. M., 2003, ApJ, 587, 278
- Wurster et al. (2019) Wurster J., Bate M. R., Price D. J., 2019, MNRAS, 489, 1719
- van Dishoeck & Black (1988) van Dishoeck E. F., Black J. H., 1988, ApJ, 334, 771
Appendix A Hyperfine structure


Figure 10 shows the impact of hyperfine structure on the HCN and N2H+ line intensities for the TURB, COLL and MAG models, seen in the plane. For an optically thin line, the integrated intensity for the single-level approximation should be the same as the integrated intensity of all hyperfine components combined. With a significant optical depth, as in our models, the reduced opacity of the individual hyperfine components compared to the single-level approximation results in a higher line intensity at a given column density. For the HCN line, this brings the TURB and MAG model predictions into good agreement with the Perseus data, but is not sufficient to remove the plateau effect seen in the COLL model. For the N2H+ line, while the non-linear behaviour below is preserved, the models with hyperfine structure tend to overestimate the line emission, particularly at high column densities.