HAWC Detection of a TeV Halo Candidate Surrounding a Radio-quiet pulsar
Abstract
Extended very-high-energy (VHE; 0.1-100 TeV) -ray emission has been observed around several middle-aged pulsars and referred to as “TeV halos”. Their formation mechanism remains under debate. It is also unknown whether they are ubiquitous or related to certain subgroup of pulsars. With 2321 days of observation, the High Altitude Water Cherenkov (HAWC) Gamma-Ray Observatory detected VHE -ray emission at the location of the radio-quiet pulsar PSR J0359+5414 with significance. By performing likelihood tests with different spectral and spatial models and comparing the TeV spectrum with multi-wavelength observations of nearby sources, we show that this excess is consistent with a TeV halo associated with PSR J0359+5414, though future observation of HAWC and multi-wavelength follow-ups are needed to confirm this nature. This new halo candidate is located in a non-crowded region in the outer Galaxy. It shares similar properties to the other halos but its pulsar is younger and radio-quiet. Our observation implies that TeV halos could commonly exist around pulsars and their formation does not depend on the configuration of the pulsar magnetosphere.
1 Introduction
Extended TeV gamma-ray emission has been observed around several middle-aged ( kyr) pulsars and grouped as a new source class named “TeV halos” (Linden et al., 2017; López-Coto et al., 2022). Seven sources are referenced as TeV halos in the online catalog for TeV Astronomy, TeVCat111http://tevcat2.uchicago.edu/ (Wakely & Horan, 2008), including the first halos around the Geminga and Monogem pulsars, discovered by HAWC (Abeysekara et al., 2017a), HESS J1825-137 reported by the H.E.S.S. collaboration (H. E. S. S. Collaboration et al., 2018), and the halo of PSR J0622+3749, identified by the LHAASO collaboration (Aharonian et al., 2021). The VHE fluxes of these halos suggest that of the spin-down power of the pulsars is converted into pair population that interacts with the ambient interstellar radiation field (Sudoh et al., 2019; Aharonian et al., 2021). The diffusion coefficients derived from the sizes of the halos are typically two orders of magnitude lower than the average diffusion coefficient of the interstellar medium (ISM; Hooper et al., 2017; Sudoh et al., 2019).
The formation mechanism of the TeV halos is still under debate (Linden et al., 2017; Sudoh et al., 2019; Giacinti et al., 2020; López-Coto et al., 2022; Liu, 2022; De La Torre Luque et al., 2022). Whether they are related to the local environment, such as extended, diffuse emission by other sources near the pulsar (e.g., the Monogem Ring Plucinsky et al., 1996), is also questioned. If TeV halos commonly exist around pulsars, they can be used to study the propagation of cosmic rays (e.g., Evoli et al., 2018) and to identify pulsars that are otherwise invisible to radio and -ray observations (Linden et al., 2017).
In this letter, we report the detection of a new TeV halo candidate around the pulsar PSR J0359+5414 (hereafter J0359) using 2321 days of HAWC data. The detection of J0359 was first reported in the Fermi Large Area Telescope (LAT) First Source Catalog (1FGL, Abdo et al., 2010) where it remained as an unclassified source until the Third Source Catalog (3FGL, Acero et al., 2015). J0359 was later classified as a radio-quiet pulsar by Clark et al. (2017) with an age of 75 kyr and a spin-down power of . In Zyuzin et al. (2018) a pseudo-distance of J0359 is reported as kpc, derived from the and the gamma-ray flux. The latest report at high energies of J0359 appears in the Fermi-LAT Fourth Source Catalog (4FGL, Abdollahi et al., 2020) where it is detected above in the MeV-GeV energy range. A pulsar wind nebula (PWN) with an extension of was observed by Chandra as a result of a X-ray analysis on gamma-ray pulsars (Zyuzin et al., 2018). No radio emission has been detected from the pulsar (Grießmeier et al., 2021). The VHE -ray emission from the vicinity of J0359 observed by HAWC presents similar properties to the other TeV halos candidates, including the derived acceleration efficiency and diffusion coefficient. If this source is a TeV halo, it would support the hypothesis that the halos are ubiquitous.
The paper is organized as follows. The data set and analysis framework are described in Section 2. The results of the spectral and spatial analysis are presented in Section 3. In Section 4, the broadband spectral energy distribution (SED) of J0359 is presented and the origin of the TeV emission is discussed. The conclusions are summarized in Section 5.
2 Instrument and Data Analysis
The HAWC Gamma-Ray Observatory consists of 300 water Cherenkov detectors located at N in Puebla, Mexico at an altitude of 4100 m. Each detector is instrumented with 4 photo-multiplier tubes (PMTs) that are capable of detecting the Cherenkov radiation produced in the detector water when an electromagnetic or hadronic shower hits the ground, which is initiated by a -ray or a cosmic ray, respectively, when it enters the Earth’s atmosphere. HAWC is sensitive to sources with declinations between and and to energies in the 300 GeV to TeV range. The data set used in this analysis comprises 2321 days of live data taken from November 2014 to October 2021. The data set is divided into 11 analysis bins () based on the fraction of PMTs that are triggered in each event, on and off the main detector array. A full description of HAWC’s design and performance can be found in Smith & HAWC Collaboration (2015) and Abeysekara et al. (2017b).
A maximum likelihood analysis was performed using the Multi-Mission Maximum Likelihood (3ML) framework (Vianello et al., 2015) with the HAWC Accelerated Likelihood (HAL) plug-in (Abeysekara et al., 2021). For model selection, we use the likelihood ratio test statistic (TS) which is defined by
| (1) |
where is the maximum likelihood of a signal plus background model, which depends on the spectral and spatial parameters, and is the maximum likelihood of the background-only hypothesis. Three spectral models are tested, including single power-law (PL, Equation 2), log-parabola (LOGP, Equation 3), and power-law with an exponential energy cutoff (PL+CO, Equation 4):
| (2) |
| (3) |
| (4) |
In the above equations, is the flux normalization in units of , is the pivot energy fixed at 30 TeV to minimize correlations with the other parameters, is the spectral index, is the cut-off energy and is the curvature of the log-parabola spectrum. Two spatial models are tested: a point-like template and an extended template. The extended template is described by a symmetric Gaussian with width as a free parameter.
The energy range in which a source is detected is computed by multiplying a step function with the best fit model (nominal case). The lower and upper values of the step function at which the likelihood decreases by , or from that of the nominal case are regarded as the upper limit to the minimum energy and lower limit to the maximum energy, respectively.
| Model | TS | Extension | |||||
|---|---|---|---|---|---|---|---|
| [] | [] | [TeV] | |||||
| PL, point-like | 37.86 | -12 | - | - | - | ||
| LOGP, point-like | 39.18 | -1 | - | - | |||
| PL+CO, point-like | 37.98 | 0 | - | - | |||
| PL, extended | 40.27 | -12 | - | - | |||
| LOGP, extended | 41.72 | -1.2 | - | ||||
| PL+CO, extended | 40.48 | 0 | - |
Note. — All the associated errors are statistical. The best model is the one with the lowest BIC value so, is the difference between a model and the best model, such that it quantifies the evidence against the model with the highest BIC value. In this case, from both spatial models, the PL+CO spectral model results with the highest BIC value. The energy cutoff of 500 TeV of the PL+CO point-like model is the boundary of the fit.
3 Results
3.1 Association with J0359
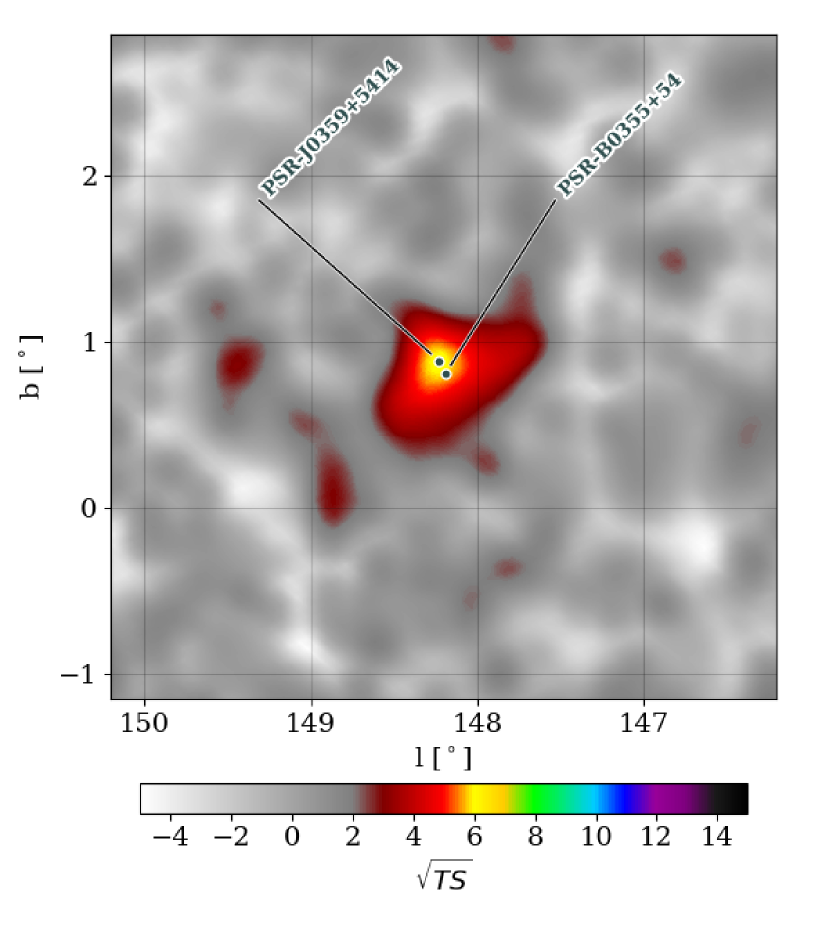
We first free the position of the emission and fit the PL point source model to data. The best-fit R.A. and decl. are and degrees (the systematic uncertainty at this location is ), which are consistent with the position of J0359 (59.86 and 54.25 degrees for R.A and decl. respectively). The TS of the model is , which corresponds to a significance of for four degrees of freedom based on the Wilks theorem (Wilks, 1938). As the position is consistent with the pulsar position, we fixed the TeV emission to the pulsar position to perform the spectral analysis.
Table 1 summarizes the best-fit parameters of different spectral and spatial models. The simplest model assuming a point-like morphology and non-broken PL yields . In general more complicated models with extended morphology and spectral curvature yields a larger TS since they have more degrees of freedom than the PL point-source model. So, the preferred spectral models for both spatial assumptions is a PL, based the BIC values, where these models have the lower ones.
Figure 2 presents the model and residual significance maps, and the residual histograms for the two spatial templates assuming a PL spectral model. The residual histogram shows the distribution of the significance value in each pixel within the region of interest centered at J0359. The residual significance is defined as the deviation from the background expectation after fitting and subtracting the modeled emission from J0359. If only random background fluctuations are left, then the significance values follow a standard normal distribution (dashed red line). A positive tail is visible in the residual map of the point-source model. Although the current sample do not allow to distinguish between the different spatial models, the residual histograms in Figure 2 indicate that we get a better fit for an extended model.
The energy range of the detection are found to be 7-188 TeV at level, 11-89 TeV at level and 15-51 TeV at level, with the PL point-source model. For the PL extended model, the energy range is 4-190 TeV at level, 9-110 TeV at level and 17-78 TeV at level.
The luminosity of the VHE emission is for a distance of 3.45 kpc. The typical energies of the synchrotron and inverse Compton photons produced by the same electrons are related by (e.g., Aharonian et al., 1997), where is the magnetic field strength in the PWN. As the magnetic energy density of a PWN is usually higher than the energy density of the Cosmic Microwave Background (CMB) and infrared (IR) photons of the ISM, the synchrotron flux of a typical PWN at keV energies is expected to be higher than its inverse Compton emission at the HAWC energies (see e.g., the Crab Nebula H. E. S. S. Collaboration, 2020). However, the X-ray luminosity of J0359’s PWN, (Zyuzin et al., 2018), is instead times lower than the VHE gamma-ray luminosity. This suggests the existence of a VHE electron population outside the region where the nebula is energetically dominant, which is expected in the case of a TeV halo (Linden et al., 2017; López-Coto et al., 2022).
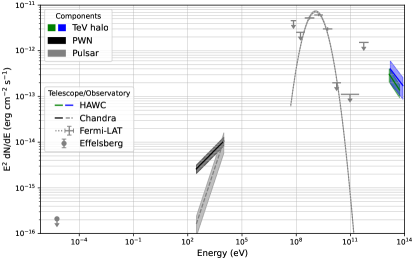
Figure 3 presents the broadband SED of J0359. The pulsar, PWN, and TeV halo components are shown in grey, black, and in blue/green colors, respectively. The multi-wavelength data points include an upper limit of the pulsar emission by the Effelsberg telescope at 1400 MHz (Grießmeier et al., 2021), X-ray measurements of the pulsar and PWN (Zyuzin et al., 2018), -ray observation of the pulsar from 50 MeV to 1 TeV by the Fermi-LAT (Abdollahi et al., 2020), and the VHE flux of the halo measured by HAWC.
3.2 Nearby pulsar B0355+54
Another pulsar, PSR B0355+54 (B0355) is only 0.09 degrees from J0359. B0355 is classified as a radio-loud pulsar with characteristic age of 564 kyr and spin-down power at a distance of 1 kpc. B0355 has not been detected at high or very-high energies (Benbow et al., 2021). Below we investigate whether B0355 is related to the HAWC excess emission.
We performed likelihood fits and compared three scenarios: 1) the VHE emission is only associated with J0359, 2) the VHE emission is only associated with B0355, and 3) the VHE emission is contributed by both sources. We present the detailed results of scenarios 2 and 3 in Appendix A and B, respectively. We find that the two-source scenario (scenario 3) is disfavored compared to the single-source scenarios. Scenario 1 (J0359) yields lower BIC values than scenario 2 (B0355) for various spectral and spatial models, though the preference of scenario 1 is not statistically significant.
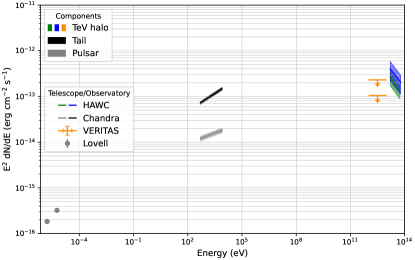
The VERITAS telescope searched for emission from the PWN of B0355 and posed tight upper limits on the TeV flux (Benbow et al., 2021). The right panel of Figure 3 shows the broadband SED of B0355, which includes the radio observation of the pulsar (Lorimer et al., 1995), X-ray observation of the pulsar and its tail at 0.5-8 keV (Klingler et al., 2016), and the VERITAS upper limits at 95% C.L. between 1 and 10 TeV (Benbow et al., 2021). For comparison, we show the best-fit flux between 16 and 59 TeV obtained by assuming that the VHE emission is centered at the position of B0355. The upper limits set by VERITAS on B0355’s tail are in tension with the HAWC’s flux at 16 TeV for both the point-like and extended models. This suggests that the excess emission observed by HAWC is more likely associated with J0359 than B0355, though future multi-wavelength observation is needed to confirm the finding.
4 Systematic Uncertainties
The systematic uncertainties arising from the detector performance and simulations are described in Abeysekara et al. (2017b) and Abeysekara et al. (2019). The systematic contribution is calculated in a single energy band for each spectral and spatial parameter, with the positive (negative) shift results added in quadrature to account for the upward (downward) uncertainties. The systematic uncertainties are calculated for the PL spectral model and for both the point-like and extended templates.
To account for additional sources of systematic uncertainties, such as the variations in the atmosphere that are not considered in simulations, a 10% error has been added to normalization flux (Albert et al., 2020). The total systematic uncertainties are reported in Table 2.
| Model | Parameter | Lower sys. | Upper sys. |
|---|---|---|---|
| Point-like | |||
| Extended | |||
| extension |
Note. — is in units of and extension is in degrees.
5 Conclusions
With 2321 days of HAWC observation, VHE -ray emission is detected in a relatively source-empty region in the outer galaxy. Based on likelihood fits with different spectral and spatial models to the HAWC data and the comparison of VHE -ray flux with multi-wavelength observations, we conclude that the emission is a TeV halo candidate associated with the pulsar PSR J03595414.
If this TeV emission is a halo, it would share similar characteristics with the existing population. We find a 95% upper limit on the extension of the emission as (with the PL-extended model in Table 1), corresponding to a physical size of . The diffusion coefficient of the halo is confined to be , where is the cooling time of an electron at energy by upper-scattering the CMB. Like the other halos (Abeysekara et al., 2017a), the diffusion coefficient is much lower than the average diffusion coefficient of the ISM.
The candidate halo of J0359 joins the observation of extended VHE emission surrounding PSR J06223749 (Aharonian et al., 2021) as the first evidence of TeV halos around radio-quiet pulsars. Their presence suggests that the formation of the halos is insensitive to the configuration of the pulsar magnetosphere, in particular, the geometry of the -ray and radio beams (Harding, 2001).
With an age of 70 kyr, J0359 is younger than the other pulsars with halos. It is likely in a transition between the so-called relic- and halo-stage of a PWN, the boundaries of which are not well defined and have motivated different classification criteria of TeV halos (Linden et al., 2017; Giacinti et al., 2020; López-Coto et al., 2022). Our observation of TeV halo features associated with J0359 implies that high-energy particles may already start escaping in the ISM in the late relic-stage.
Our observation provides spectral evidence toward a TeV halo nature of J0359. Future data from HAWC and multi-wavelength follow-ups of this new TeV source are crucial to confirming its nature via morphological studies that identify the halo extension and exclude the association with the nearby pulsars. Future observations of young to middle-aged pulsars like PSR J03595414 with wide-field -ray experiments and imaging atmospheric Cherenkov telescopes may provide further understanding into the evolution of TeV PWNe and their connection with TeV halos.
Acknowledgments
We acknowledge the support from: the US National Science Foundation (NSF); the US Department of Energy Office of High-Energy Physics; the Laboratory Directed Research and Development (LDRD) program of Los Alamos National Laboratory; Consejo Nacional de Ciencia y Tecnología (CONACyT), México, grants 271051, 232656, 260378, 179588, 254964, 258865, 243290, 132197, A1-S-46288, A1-S-22784, cátedras 873, 1563, 341, 323, Red HAWC, México; DGAPA-UNAM grants IG101320, IN111716-3, IN111419, IA102019, IN110621, IN110521; VIEP-BUAP; PIFI 2012, 2013, PROFOCIE 2014, 2015; the University of Wisconsin Alumni Research Foundation; the Institute of Geophysics, Planetary Physics, and Signatures at Los Alamos National Laboratory; Polish Science Centre grant, DEC-2017/27/B/ST9/02272; Coordinación de la Investigación Científica de la Universidad Michoacana; Royal Society - Newton Advanced Fellowship 180385; Generalitat Valenciana, grant CIDEGENT/2018/034; The Program Management Unit for Human Resources & Institutional Development, Research and Innovation, NXPO (grant number B16F630069); Coordinación General Académica e Innovación (CGAI-UdeG), PRODEP-SEP UDG-CA-499; Institute of Cosmic Ray Research (ICRR), University of Tokyo, H.F. acknowledges support by NASA under award number 80GSFC21M0002. We also acknowledge the significant contributions over many years of Stefan Westerhoff, Gaurang Yodh and Arnulfo Zepeda Dominguez, all deceased members of the HAWC collaboration. Thanks to Scott Delay, Luciano Díaz and Eduardo Murrieta for technical support.
References
- Abdo et al. (2010) Abdo, A. A., Ackermann, M., Ajello, M., et al. 2010, ApJS, 188, 405, doi: 10.1088/0067-0049/188/2/405
- Abdollahi et al. (2020) Abdollahi, S., Acero, F., Ackermann, M., et al. 2020, ApJS, 247, 33, doi: 10.3847/1538-4365/ab6bcb
- Abeysekara et al. (2017a) Abeysekara, A. U., Albert, A., Alfaro, R., et al. 2017a, Science, 358, 911, doi: 10.1126/science.aan4880
- Abeysekara et al. (2017b) —. 2017b, ApJ, 843, 39, doi: 10.3847/1538-4357/aa7555
- Abeysekara et al. (2019) —. 2019, ApJ, 881, 134, doi: 10.3847/1538-4357/ab2f7d
- Abeysekara et al. (2021) Abeysekara, A. U., et al. 2021, PoS, ICRC2021, 828, doi: 10.22323/1.395.0828
- Acero et al. (2015) Acero, F., Ackermann, M., Ajello, M., et al. 2015, ApJS, 218, 23, doi: 10.1088/0067-0049/218/2/23
- Aharonian et al. (2021) Aharonian, F., An, Q., Axikegu, Bai, L. X., et al. 2021, Phys. Rev. Lett., 126, 241103, doi: 10.1103/PhysRevLett.126.241103
- Aharonian et al. (1997) Aharonian, F. A., Atoyan, A. M., & Kifune, T. 1997, MNRAS, 291, 162, doi: 10.1093/mnras/291.1.162
- Albert et al. (2020) Albert, A., Alfaro, R., Alvarez, C., et al. 2020, ApJ, 905, 76, doi: 10.3847/1538-4357/abc2d8
- Benbow et al. (2021) Benbow, W., Brill, A., Buckley, J. H., et al. 2021, ApJ, 916, 117, doi: 10.3847/1538-4357/ac05b9
- Clark et al. (2017) Clark, C. J., Wu, J., Pletsch, H. J., et al. 2017, ApJ, 834, 106, doi: 10.3847/1538-4357/834/2/106
- De La Torre Luque et al. (2022) De La Torre Luque, P., Fornieri, O., & Linden, T. 2022, arXiv e-prints, arXiv:2205.08544. https://arxiv.org/abs/2205.08544
- Evoli et al. (2018) Evoli, C., Linden, T., & Morlino, G. 2018, Phys. Rev. D, 98, 063017, doi: 10.1103/PhysRevD.98.063017
- Giacinti et al. (2020) Giacinti, G., Mitchell, A. M. W., López-Coto, R., et al. 2020, Astron. Astrophys., 636, A113, doi: 10.1051/0004-6361/201936505
- Grießmeier et al. (2021) Grießmeier, J. M., Smith, D. A., Theureau, G., et al. 2021, A&A, 654, A43, doi: 10.1051/0004-6361/202140841
- H. E. S. S. Collaboration (2020) H. E. S. S. Collaboration. 2020, Nature Astronomy, 4, 167, doi: 10.1038/s41550-019-0910-0
- H. E. S. S. Collaboration et al. (2018) H. E. S. S. Collaboration, Abdalla, H., Abramowski, A., et al. 2018, A&A, 612, A2, doi: 10.1051/0004-6361/201629377
- Harding (2001) Harding, A. K. 2001, in American Institute of Physics Conference Series, Vol. 558, High Energy Gamma-Ray Astronomy: International Symposium, ed. F. A. Aharonian & H. J. Völk, 115–126, doi: 10.1063/1.1370785
- Hooper et al. (2017) Hooper, D., Cholis, I., Linden, T., & Fang, K. 2017, Phys. Rev. D, 96, 103013, doi: 10.1103/PhysRevD.96.103013
- Kass & Raftery (1995) Kass, R. E., & Raftery, A. E. 1995, Journal of the American Statistical Association, 90, 773, doi: 10.1080/01621459.1995.10476572
- Klingler et al. (2016) Klingler, N., Rangelov, B., Kargaltsev, O., et al. 2016, ApJ, 833, 253, doi: 10.3847/1538-4357/833/2/253
- Linden et al. (2017) Linden, T., Auchettl, K., Bramante, J., et al. 2017, Phys. Rev. D, 96, 103016, doi: 10.1103/PhysRevD.96.103016
- Liu (2022) Liu, R.-Y. 2022, arXiv e-prints, arXiv:2207.04011. https://arxiv.org/abs/2207.04011
- López-Coto et al. (2022) López-Coto, R., de Oña Wilhelmi, E., Aharonian, F., Amato, E., & Hinton, J. 2022, Nature Astronomy, 6, 199, doi: 10.1038/s41550-021-01580-0
- Lorimer et al. (1995) Lorimer, D. R., Yates, J. A., Lyne, A. G., & Gould, D. M. 1995, MNRAS, 273, 411, doi: 10.1093/mnras/273.2.411
- Plucinsky et al. (1996) Plucinsky, P. P., Snowden, S. L., Aschenbach, B., et al. 1996, ApJ, 463, 224, doi: 10.1086/177236
- Smith & HAWC Collaboration (2015) Smith, A. J., & HAWC Collaboration. 2015, in International Cosmic Ray Conference, Vol. 34, 34th International Cosmic Ray Conference (ICRC2015), 966. https://arxiv.org/abs/1508.05826
- Sudoh et al. (2019) Sudoh, T., Linden, T., & Beacom, J. F. 2019, Phys. Rev. D, 100, 043016, doi: 10.1103/PhysRevD.100.043016
- Vianello et al. (2015) Vianello, G., Lauer, R. J., Younk, P., et al. 2015, arXiv e-prints, arXiv:1507.08343. https://arxiv.org/abs/1507.08343
- Wakely & Horan (2008) Wakely, S. P., & Horan, D. 2008, in International Cosmic Ray Conference, Vol. 3, International Cosmic Ray Conference, 1341–1344
- Wilks (1938) Wilks, S. S. 1938, Annals Math. Statist., 9, 60, doi: 10.1214/aoms/1177732360
- Zyuzin et al. (2018) Zyuzin, D. A., Karpova, A. V., & Shibanov, Y. A. 2018, MNRAS, 476, 2177, doi: 10.1093/mnras/sty359
Appendix A PSR B0355+54 fitting results
In this section, we explore the possibility that the TeV excess comes entirely from B0355. We fit models with a power-law (PL) spectrum and the spatial templates described in Section 3. The results are summarized in Table 3. The energy ranges at which the source is detected are 7-180 TeV at level, 11-90 TeV at level and 17-54 TeV assuming at level assuming a point-like morphology. For an extended morphology, the energy ranges are found to be 8-155 TeV for level, 11-90 TeV at level and 17-59 at level.
As single-source scenarios are not nested models, we have employed the Bayesian Information Criterion (BIC) to select the models. The difference in the BIC value, , quantifies the evidence against the model with a higher BIC value. According to Kass & Raftery (1995), if is between 0 and 2 it is not clear which model is preferred; between 2 and 10 and above 10 indicates a slight and strong preference of the model with the smallest BIC, respectively.
The small difference in from the fits of models centered at J0359 and B0355 does not allow us to distinguish between the models. This is expected as the angular distance of the two pulsars is smaller than the spatial resolution of HAWC. However, the tension between the VERITAS limits on B0355 and HAWC fluxes, as explained in Section 3, suggests that the TeV emission is more likely associated with J0359.
| Spatial model | TS | Extension | |||
|---|---|---|---|---|---|
| [] | |||||
| Point-like | 35.86 | -1.9 | 0.0 | ||
| Extended | 41.83 | -1.5 |
Note. — All associated errors are statistical. is obtained comparing the BIC value with the best spectral model fit for both spatial models assuming that the emission is coming from J0359 (Section 3).
Appendix B Fitting results of a two-source scenario
We further explore a scenario where both J0359 and B0359 contribute to the TeV emission observed by HAWC. Such a two-source model is disfavored by the data.
Table 4 presents the results of the two-source models. We consider three combinations of spatial profiles of the two sources: (A) both sources are point-like, (B) both sources are extended with a Gaussian shape, and (C) J0359 is extended source and B0355 is point-like. The energy spectrum is assumed to be a PL. The normalization flux and the spectral index in each fit were free to vary while the position of the sources for all the scenarios were fixed.
The TS column shows the gain of test statistics by adding an extra source to the one-source model presented in Section 3 and Section A (the baseline model considers pure background plus the emission from the other source). The two-source model is disfavored in all cases.
| Two-source model | Source | TS | Extension | |||
|---|---|---|---|---|---|---|
| [] | ||||||
| J0359 | 2.32 | 0.0 | ||||
| Model A | B0355 | 0.32 | -24 | 0.0 | ||
| J0359 | 8.73 | |||||
| Model B | B0355 | 10.29 | -26 | |||
| J0359 | 13.02 | |||||
| Model C | B0355 | 8.62 | -26 / -15 | 0.0 |
Note. — All associated errors are statistical. Model A corresponds to a scenario where both sources are point-like, model B assumes that both sources are extended with a Gaussian shape, and model C assumes that PSR J0359+5414 is as a point-like source and PSR B0355+54 is an extended source with a Gaussian shape. is obtained comparing the BIC value with the best model fit assuming that the emission is coming from J0359 (Section 3). For model A, with the PL point-like model, for model B with the PL Gaussian model and for model C with the two previous models.