\ul
Video Surveillance System Incorporating Expert Decision-making Process: A Case Study on Detecting Calving Signs in Cattle
Abstract
Through a user study in the field of livestock farming, we verify the effectiveness of an XAI framework for video surveillance systems. The systems can be made interpretable by incorporating experts’ decision-making processes. AI systems are becoming increasingly common in real-world applications, especially in fields related to human decision-making, and its interpretability is necessary. However, there are still relatively few standard methods for assessing and addressing the interpretability of machine learning-based systems in real-world applications. In this study, we examine the framework of a video surveillance AI system that presents the reasoning behind predictions by incorporating experts’ decision-making processes with rich domain knowledge of the notification target. While general black-box AI systems can only present final probability values, the proposed framework can present information relevant to experts’ decisions, which is expected to be more helpful for their decision-making. In our case study, we designed a system for detecting signs of calving in cattle based on the proposed framework and evaluated the system through a user study (N=6) with people involved in livestock farming. A comparison with the black-box AI system revealed that many participants referred to the presented reasons for the prediction results, and five out of six participants selected the proposed system as the system they would like to use in the future. It became clear that we need to design a user interface that considers the reasons for the prediction results.
Index Terms-XAI, machine learning, user study, precision livestock farming
I Introduction
In recent years, artificial intelligence (AI) and machine learning (ML) have been used in areas related to human decision-making, including the medical field [1]. When developing AI systems, an end-to-end approach is generally considered to be an indispensable technique due to its simplicity. However, it has been pointed out that this approach is black-box in its internal behavior and is not a sufficient system for supporting human decision-making [2]. Meanwhile, there has been growing interest in the interpretability of AI systems as explainable AI (XAI) [3, 4]. Representative technologies of XAI include visualization techniques such as CAM [5] and Grad-CAM [6], and post-hoc explanations such as local interpretable model agnostic explanations (LIME) [7] and Shapley additive explanations (SHAP) [8]. However, many developments in AI and ML tend to suffer from a lack of usability and practical interpretability for real decision-makers [3, 4, 9].
In recent years, the human-computer interaction (HCI) community has recognized the importance of human-centered evaluation, which incorporates user evaluation into the interpretability of AI systems. There has been increasing research on the user evaluation of these explanatory techniques using experimental data sets [10, 11, 12]. However, when implementing AI systems for highly specialized tasks in industry, the aforementioned generic explanatory techniques and the findings on general user evaluations using experimental datasets do not lead to interpretability for experts. Thus, system design and empirical experiments in highly specialized tasks are essential; however, there is still a lack of research on XAI frameworks for industrial use and their validation through user studies [13].
This study examines the framework of a video surveillance system that can provide relevant explanations for expert judgments by incorporating their decision-making processes into the neural networks. The experts watch a video and determine whether there are any abnormalities after considering various attributes based on their domain knowledge. We design a neural network to incorporate this process into anomaly detection. Specifically, we extract different features related to an anomaly based on domain knowledge, and each stream with extracted features as input determine whether the features are anomalous. Here, explicitly extracting the features that experts use to make judgments enables them to be presented as interpretable information for the experts
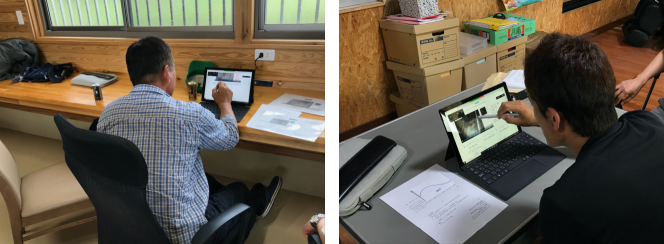
The above framework is applied to video-based detection for calving signs in cattle thorough a user study with livestock farmers (Fig. 1). Since calf deaths during calving can be very costly for farmers [14], accurately detecting the signs of calving is important for livestock management. Although contact-type sensors, which are attached directly to cattle, are widely used, a detection system using a camera, which is a non-contact-type sensor, is valuable in terms of management efficiency and animal welfare. First, to apply the above framework, we reviewed the literature on animal studies and conducted farmer interviews to collect domain knowledge about calving signs. Using our findings, we designed a system that explicitly extracts statistical information on the posture, rotation, and movement of cattle relevant to calving and then identifies the signs from these features. We designed the user interface of the notification screen using the information provided by the feature extractor. In the user interface, the frequency of posture, amount of rotation, amount of movement, and the pattern of movement (bird’s eye view) of cattle are presented to farmers. Compared with the user interface of the end-to-end system, which only presents the probability values of calving signs, the presentation of the internal state of the system is expected to be more interpretable for farmers. The user interface of the end-to-end system and the proposed system were evaluated by people who were involved in livestock farming (N=6). We anticipate that our findings will be useful in developing human-centered explainable AI-based systems that effectively incorporate experts’ knowledge.
The rest of the paper is organized as follows. In Section II, we briefly explain the framework which enables us to understand the reasoning behind predictions. Section III describes the case study on a calving detection system in livestock farming based on our framework. In Section IV, we discuss the findings from the case study and future work of the proposed framework. We conclude in Section V with a brief summary.
II Framework
The proposed framework incorporates the users’ decision-making process into a prediction network and allows for interpretation on the basis of their domain knowledge. A typical machine leaning-based system uses an end-to-end approach with experts’ annotations to model the notification target. In contrast, the proposed framework uses a human-centric approach and models the notification target through user interviews. This section describes the following four phases of the design procedure for the proposed framework:
-
•
Interview with an expert
-
•
Designing streams to extract the information that characterizes what is being monitored
-
•
Designing detectors by integrating information from multiple streams
-
•
Designing the notification interface
In the first phase, we interview experts on the notification target. In interviews, we ask them to verbalize their decision-making processes when detecting the target, and determine the features they focus on in daily operations. Then we divide those features into more detailed features that can be judged even by non-experts.
In the next phase, we extract more detailed features from the ones that experts focus on when they detect the notification target, and then we develop a stream network based on the extracted features. Dividing the features into more detailed features that can be judged even by non-experts, enables the addition of crowd-sourced annotations. This is important in terms of making the surveillance system sustainable, as it allows us to increase the amount of training data without having to rely on experts in the domain.
In the third phase, we develop a network that integrates multiple stream networks on the basis of different attribute features. The users are notified based on the posterior probability of the network. Here, even if the detection of each stream network is not necessarily effective, if the predictions of each stream are complementary, the detection can be improved.
Finally, we design the user interface that is presented to the users. In addition to the final posterior probability of the notification target, multiple features extracted from each stream network can be presented as the reasons for the prediction results. These features are designed with consideration for the responses in the user interviews, so they provide information necessary for users’ decision-making processes.
III Case Study
In this section, we verify the effectiveness of the proposed framework for detecting signs of calving in cattle through a user study with livestock farmers. First, we describe the system design based on our framework introduced in Section II, and then we describe the procedure for the user experiments and the results and findings.
III-A System Design
In this section, we describe the design of our calving detection system based on the proposed framework. We describe the domain knowledge of calving signs and the network structure that explicitly extracts features relevant to calving. Finally, we explain the user interface that presents the farmers with the reasons for the prediction results.
III-A1 Calving Signs Observable from Video
This section presents an overview of the domain knowledge about calving signs. We interviewed farmers and reviewed the animal science literature to identify cattle behaviors related to calving. Changes in postures and behaviors related to calving have been extensively investigated in animal science. This part corresponds to the implementation of the first phase of the proposed framework.
The following are typical posture-based calving signs that can be observed from images:
- •
- •
The following action-based calving signs were observed in the video:
-
•
Increase in the number of rotations and turns: Characteristic walking patterns (e.g., rotations and turns) can be observed four hours before calving and become more frequent three hours before calving [20].
- •
III-A2 System Architecture
We designed a multi-stream network [21] that extracts statistical information on posture, rotation, and movement based on calving signs identified in prior studies and integrates the three streams depending on the situation. This part corresponds to the implementation of the second and third phases of the proposed framework. Specifically, each stream identifies calving signs for each 30-minute input video based on features as follows:
-
•
Posture-based feature: The appearance of a cattle standing, lying, and raising its tail are captured for each video frame using ResNet-50 [22] and then accumulated into the relevant frequencies using temporal pooling techniques.
- •
-
•
Movement-based feature: The region of the cattle’s body is detected in each video frame using YOLOv3 [25] and differences in locations across frames are accumulated into a statistic on the cattle’s movement.
The calving-relevant features are designed to be extracted from information that can be judged by non-experts, such as posture, neck and tail positions, and positional coordinates. This makes it possible to collect data using crowdsourcing, and re-training the feature extraction mechanism becomes easier.
III-A3 User Interface of Notification Screen
In this section, we describe the design of the user interface of the proposed system. This part corresponds to the implementation of the fourth phase of the proposed framework. In addition to the final posterior probability of calving signs, the proposed framework provides the following information related to calving signs for each frame:
-
•
Posterior probability of cattle’s posture, 1) standing cattle with tail raised, 2) standing cattle without tail raised, 3) lying cattle, and 4) can’t tell
-
•
Heatmaps of cattle’s body direction
-
•
Position coordinates of cattle
Displaying these data in an easy-to-understand representation will help farmers to estimate when cattle start calving.
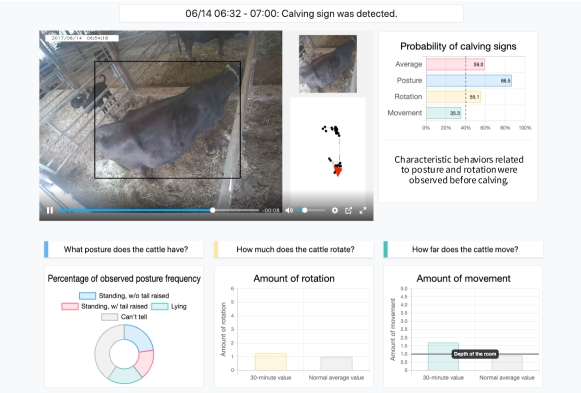
Fig. 2 shows the user interface designed using the information described above. In addition to the monitoring video and the posterior probability values of the system in this scene, the interface also displays information on the frequency of posture, amount of rotation, amount of movement, and trajectory of the cattle as seen from directly above. The upper right bar graph shows the posterior probability of calving signs which the system output using the 30-minute video frames. Four graphs are presented, each with posterior probabilities and their mean values based on the statistics on posture, rotation, and movement. Users can check which information the system considers to be a calving sign. The statistics on posture, rotation, and movement are presented at the bottom of the screen. The circle graph on the left shows the frequency of these 30-minute postures calculated from the posterior probability of the posture classification obtained by the feature extractor. This graph can be interpreted as the reasons for the prediction results of the posture-based stream. The comparison with the normal state in the amount of rotation (shown in the center) is calculated from the estimated heatmaps of the cattle’s body direction obtained from the feature extractor. It is possible to quantify how much the cattle turn during these 30 minutes compared with their default state, which can then be interpreted as reasons for the prediction results. In the prototype user interface, we visualized the time-series changes in the angle of body direction. After interviewing a farmer, a bar graph was used to simplify the representation. The comparison with the normal state in the amount of movement (shown on the right side) is calculated from the amount of change in the positional coordinates of the cattle. Compared with the normal state, the amount of movement of cattle during this 30-minute can be quantified and interpreted as the reasons for the prediction results of the movement-based stream. Finally, a bird’s eye view of the cattle’s position is displayed on the right side of the monitoring video, which shows the trajectory of the cattle’s position as seen from directly above the room. This allows us to understand the general movement pattern without continuously watching the video.
III-B User Study
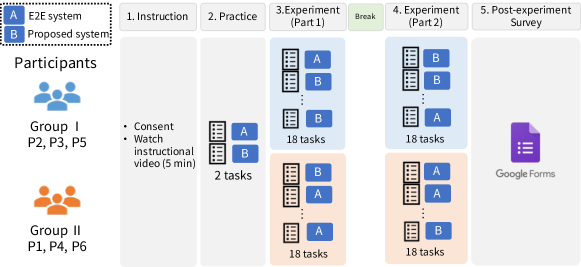
To evaluate the proposed framework, we experimentally compared it with the end-to-end system were conducted. The experiment took about 60-90 minutes in total and consisted of instruction, practice, experiment part 1, part 2, and a post-experiment survey (Fig. 3). First, the participants watched a 5-minute instructional video on the experiment. Afterwards, we obtained written informed consent signed by the participants before the experiments, and the participants were granted a gift card of ¥ 5,000 JPY (roughly $50 USD). As an exercise, the participants responded to two notifications from the proposed system and the end-to-end system. In this section, the participants were instructed to think aloud [26] and practiced answering questions by actively commenting on what they saw and thought during the experiment. The experiment consisted of two parts with a break in between, and the participants responded to 36 notifications in total. The participants were divided into two experimental groups, and each group was shown the user interface in a pseudo-random order to account for the sequential effects of the interface order. After the experiment, a qualitative post-experiment survey was conducted using Google Forms.
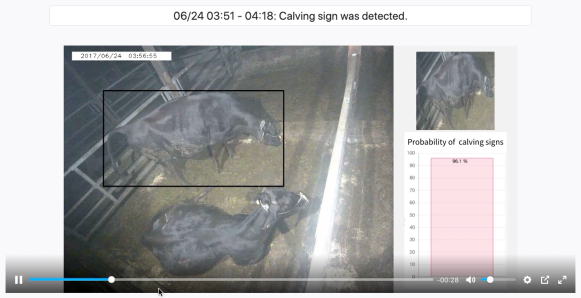
In the experiment, the two user interfaces were presented to the participants in a pseudo-random order on the basis of the experimental group. The user interface of the end-to-end system for comparison is shown in Fig. 4. Compared with the user interface of the proposed system, the end-to-end system presents only the posterior probability graph of the prediction result. For the same 30-minute sequence, the value of the posterior probability presented in the user interface of the end-to-end system was the same value as the average posterior probability of each stream in the user interface of the proposed system. To avoid bias from the system names, we designated the end-to-end system as system A and the proposed system as system B when presenting the user interfaces to the participants.
The unit of the notification was a 30-minute video sequence, and a total of 18 sequences were prepared. A positive case was defined as the time from three to zero hours before calving and a negative case as the time from 24 to 27 hours before calving. The prepared sequences consisted of six sequences each of true positives and false positives, and three sequences each of false negatives and true negatives. In other words, we assume that the notification threshold is significantly lowered and contains a certain number of false positives.
The participants are asked to answer the following two questions (maximum of four) at the bottom of the interface:
- Q1-1
-
Did you recognize calving signs in this 30-minutes scene? (-3: Absolutely Not, … 3: Absolutely Yes)
- Q1-2
-
What are the reasons for your answer? (Verbal answer)
The participants responded to the following prompts in Q1-2: 1) What did you see on the screen?, 2) What did you think?, and 3) How did you reach your decision? The intention of this format was to reveal as much of their thought process as possible. After answering the above questions, if the answer to Q1-1 was “neither” or “predictive” (0-3), the participant was asked to answer the following questions as well:
- Q2-1
-
What action would you take after seeing this user interface? (1: Begin assisting immediately, 2: Start making arrangements, 3: Do nothing)
- Q2-2
-
What are the reasons for your answer? (Verbal answer)
The candidate answers to Q2-1 are terms referring to common decision-making behaviors for livestock farmers. The terms are used in the contact-type sensor, Gyuonkei111Gyuonkei, http://www.gyuonkei.jp, a calving notification sensor widely used in Japan. Here, “Begin assisting immediately” refers to the decision to immediately begin assisting with calving, and “Start making arrangements” refers to the preparations made about 24 hours before calving. These questions are designed to encourage participants to use the interface for their decision-making. Each participant is asked to respond to the above questions for a total of 36 notifications (2 UIs x 18 sequences).
The questions in the post-experiment survey are as follows:
- Q’1
-
Which AI system would you like to use in the future? (1. System A, 2. System B)
- Q’2
-
Why did you choose that system? (Orally, if you prefer.)
- Q’3
-
How useful was the information presented in System A? (-2. Useless, …, 2. Useful)
- a
-
Graph of the probability of calving signs.
- Q’4
-
How useful was the information presented in System B? (-2. Useless, …, 2. Useful)
- a
-
Graph of the probability of calving signs.
- b
-
Graph of the posture frequency.
- c
-
Graph of the amount of rotation.
- d
-
Graph of the amount of movement.
- e
-
Bird’s eye view (position of the cattle as seen from directly above).
- Q’5
-
Which system provided more accurate predictions?(1. System A, 2. System B, 3. Neither)
- Q’6
-
What are the advantages of the system you chose in Q’1 over the other? (Orally, if you prefer.)
- Q’7
-
What improvements (if any) would you make to System B? (Orally, if you prefer.)
Six people who involved in livestock farming participated in the user experiment. Age, sex, and years of experience in the livestock industry of the participants are shown in Table I. The participants belonged to two groups: farmers (P1-4) and people from an agricultural college (P5-6). Here, P5 is a professor, and P6 is a student of animal science.
| ID | Group | Age | Sex | Years of experience | |
|---|---|---|---|---|---|
| P1 | II | 30’s | M | 10-19 | |
| P2 | I | 50’s | M | 20-29 | |
| P3 | I | 20’s | F | 5-9 | |
| P4 | II | 40’s | M | 20-29 | |
| P5 | I | 40’s | M | 20-29 | |
| P6 | II | 10’s | F | 0-1 |
The experiment was administered on a computer, and the participants accessed the URL to the experiment page provided in advance. We used a web conference application (Zoom) to record the participants’ responses. To record the participant’s speech during their think-aloud, we recorded online on Zoom and locally as a backup.
III-C Results and Findings
Participants judged whether a behavior was a calving sign from the monitoring video, but the behavior of their responses varied depending on the type of the user interface presented. When the interface of the end-to-end system was presented, most of the verbal comments were related to the video. However, when the interface of the proposed system was presented, some of the comments were related to the statistics. One participant shared their judgment, referring to a graph comparing the amount of movement with normal conditions. P5 stated “I think the cattle is near to calving because the data shows a lot of movement and an increase in rotation.”. Given the trend of the responses, we believe that presenting the internal state of the proposed system was effective for judging whether a behavior was a calving sign.
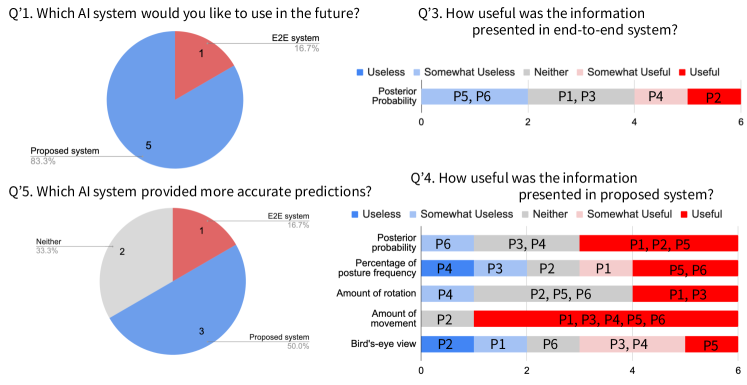
The results of the responses to the post-experimental survey are shown in Fig 5. Five out of six participants selected the proposed system as the system they would like to use in the future (Fig. 5, Q’1). They found that the internal state of the system was helpful in identifying calving signs. P1 said “It is easier to understand when the amount of movement, which is usually judged by the senses, is visualized in a graph.” P2 said “It’s helpful to see detailed information about the cattle.” P3 said “The presented graphs were helpful in determining whether a behavior was a calving sign.” , and P5 said “Because the data is presented in detail, I think less experienced farmers can make decisions with more certainty.”
In addition, some of the comments fit the hypothesis that the user interface of the end-to-end system, which is a black-box, is insufficient for decision-making. P1 stated, “The [end-to-end system’s] predicted probability alone does not tell us what we should do. I don’t know what to do with it.”. In contrast, P4, who was the only one to choose the end-to-end system in this question, said, “I did not find the indicators in the proposed system to be judgmental because there were many situations where the information presented differed from my perceptions.” P4 was a farmer who was asked to assist in the interviews to collect domain knowledge about calving signs, and he stated that the information presented was less accurate than he expected. One shortcoming is that a user evaluation should have been conducted in the second phase of the framework design. Because we did not receive sufficient feedback from experts in this phase, the extracted features were not always sufficiently useful indicators. In addition, it was suggested that actively presenting the internal state of the system, including the errors, may cause noise in judgment and cause participants to distrust the system.
Next, we discuss which information on the user interface was useful (Fig. 5, Q’3, Q’4). We found that the trend in the probability of calving signs varied between participants. Only P4 responded that the probability of the end-to-end system was more useful, while the other participants found the proposed system to be more useful or about the same. We now turn our attention to the results of the user interface of each statistic on the posture, rotation, and movement of the proposed system (Fig. 5, Q’4). Two participants from the agricultural college (P5, P6) responded that the graph of the posture frequency was useful, while the remaining four farmers responded that it was generally not useful. This may be because the farmers could view the raw data to obtain more accurate information on posture frequency, so there was less of a need to refer to the information presented by the system. On the other hand, participants from an agricultural college with an academic background found it useful to be able to quantitatively visualize the posture frequency.
A higher percentage of participants found the graph of the amount of movement to be more useful than the posture frequency graph because the meta-information, which cannot be captured from the raw data, is useful for judgment. In fact, many of the participants said that the comparison with normal conditions was helpful during their responses. P1 said “Before, I judged the amount of rotation and movement intuitively, so it’s easier to see when graphed.” and P6 said “The graph [of the amount of movement] makes it easier to notice the degree of change compared with the normal conditions.” The rotation graph tended to be less useful than the movement graph because the participants paid attention to the intensity of the cattle’s movement as one of the criteria for judging whether it was a calving sign, and the amount of rotation was not directly related to their judgment. Thus, it is important to present features in a way that users can easily understand, and a more abstract expression such as “intensity of movement” may be more suitable.
In their responses to the last question (Q’7), participants pointed out issues related to the accuracy of the presented information and that the user interface made the video smaller when information is presented. For the former issue, P4 said “I felt that the graph was not directly linked to the calving signs.” and P6 said “I was worried when the AI identified an indeterminable posture in many cases. I would prefer to judge it myself in such situations.” For the latter issue, P5 stated, “Readability. I don’t want the video to be too small.”
IV Discussion
Black-box AI systems are considered inadequate for supporting human decision-making. One farmer pointed out that the end-to-end system lacked instructions on what they should do after seeing the value for the probability of calving signs. Several farmers pointed out the advantages of our proposed system, stating that the detailed information would help novice farmers make correct decisions confidently and the reason visualization was helpful. In particular, statistical information including meta-information that cannot be obtained from the raw data tended to be particularly useful. In contrast, we found that the reliability of the system is adversely affected when the presented information is incorrect. This has been reported in several studies as algorithm aversion [27, 28], which is a phenomenon in which users stop trusting algorithms after seeing its mistakes. To present more information to users, the proposed framework needs to take into account the accuracy of the information. In addition, we should have conducted a user evaluation in the second phase of the framework design because the extracted features may not have been sufficiently useful indicators for users. In the participants’ feedback, they noted that the user interface became more complicated as more information was presented. When considering development for actual use, it is necessary to consider elderly users as well as smartphones which may make the screen more difficult to view. A more sophisticated user interface design is needed, such as the separation of the summary and detailed analysis screens. We anticipate that our evaluation of an XAI framework through user studies will contribute to the integration of XAI in various industrial domains.
V Conclusion
In this study, we proposed a framework for a video surveillance system that incorporates experts’ decision-making processes into the architecture such that the reasons for the prediction results can be interpreted. We evaluated the calving sign detection systems based on our proposed framework through a user study with people involved in livestock farming (N=6). The proposed framework was compared with an end-to-end system, and five out of six participants selected the proposed framework as the system they would like to use in the future. In addition, the proposed framework is used to present the internal state of the system, which can be used to help users make decisions and identify system errors. However, we found that presenting an inaccurate internal state of the system could interfere with the user’s judgment and cause them to distrust the system. In future work, we intend to study the accuracy of the information presented to users.
acknowledgment
We would like to thank the farmers who participated in the experiment and Kagoshima Prefecture Agricultural College. We also thank Kagoshima Brain Center for fruitful discussions.
References
- [1] E. Beede, E. Baylor, F. Hersch, A. Iurchenko, L. Wilcox, P. Ruamviboonsuk, and L. M. Vardoulakis, “A human-centered evaluation of a deep learning system deployed in clinics for the detection of diabetic retinopathy,” in Proceedings of the 2020 CHI Conference on Human Factors in Computing Systems (CHI ’20), 2020, pp. 1â–12.
- [2] A. Abdul, J. Vermeulen, D. Wang, B. Y. Lim, and M. Kankanhalli, “Trends and trajectories for explainable, accountable and intelligible systems: An hci research agenda,” in Proceedings of the 2018 CHI Conference on Human Factors in Computing Systems (CHI’18), 2018, pp. 1–18.
- [3] F. Doshi-Velez and B. Kim, “Towards a rigorous science of interpretable machine learning,” 2017.
- [4] Z. C. Lipton, “The mythos of model interpretability,” 2017.
- [5] B. Zhou, A. Khosla, A. Lapedriza, A. Oliva, and A. Torralba, “Learning deep features for discriminative localization,” in Computer Vision and Pattern Recognition (CVPR), 2016, pp. 2921–2929.
- [6] R. R. Selvaraju, M. Cogswell, A. Das, R. Vedantam, D. Parikh, and D. Batra, “Grad-cam: Visual explanations from deep networks via gradient-based localization,” International Journal of Computer Vision, vol. 128, no. 2, pp. 336–359, Oct 2019.
- [7] M. T. Ribeiro, S. Singh, and C. Guestrin, “Why should I trust you?”: Explaining the predictions of any classifier,” in Proceedings of the 2016 Conference of the North American Chapter of the Association for Computational Linguistics: Demonstrations (KDD ’16), June 2016, pp. 1135â–1144.
- [8] S. M. Lundberg and S.-I. Lee, “A unified approach to interpreting model predictions,” in Advances in Neural Information Processing Systems 30, I. Guyon, U. V. Luxburg, S. Bengio, H. Wallach, R. Fergus, S. Vishwanathan, and R. Garnett, Eds. Curran Associates, Inc., 2017, pp. 4765–4774.
- [9] T. Miller, “Explanation in artificial intelligence: Insights from the social sciences,” 2018.
- [10] H. Kaur, H. Nori, S. Jenkins, R. Caruana, H. Wallach, and J. Wortman Vaughan, “Interpreting interpretability: Understanding data scientists’ use of interpretability tools for machine learning,” in Proceedings of the 2020 CHI Conference on Human Factors in Computing Systems (CHI ’20), 2020, p. 1â14.
- [11] A. Abdul, C. von der Weth, M. Kankanhalli, and B. Y. Lim, “Cogam: Measuring and moderating cognitive load in machine learning model explanations,” in Proceedings of the 2020 CHI Conference on Human Factors in Computing Systems (CHI ’20), 2020, pp. 1–14.
- [12] M. Yin, J. Wortman Vaughan, and H. Wallach, “Understanding the effect of accuracy on trust in machine learning models,” in Proceedings of the 2019 CHI Conference on Human Factors in Computing Systems (CHI ’19), 2019, pp. 1–12.
- [13] D. Wang, Q. Yang, A. Abdul, and B. Y. Lim, “Designing theory-driven user-centric explainable ai,” in Proceedings of the 2019 CHI Conference on Human Factors in Computing Systems (CHI ’19), 2019, pp. 1–15.
- [14] B. J. McGuirk, R. Forsyth, and H. Dobson, “Economic cost of difficult calvings in the united kingdom dairy herd,” Veterinary Record, vol. 161, no. 20, pp. 685–687, 2007.
- [15] M. Speroni, M. Malacarne, R. Federico, P. Franceschi, and A. Summer, “Increasing of posture changes as indicator of imminent calving in dairy cows,” Agriculture, vol. 8, no. 11, pp. 1–11, 2018.
- [16] M. Saint-Dizier and S. Chastant-Maillart, “Methods and on-farm devices to predict calving time in cattle,” The Veterinary Journal, vol. 205, no. 3, pp. 349–356, 2015.
- [17] M. Jensen, “Behaviour around the time of calving in dairy cows,” Applied Animal Behaviour Science, vol. 139, no. 3, pp. 195–202, 2012.
- [18] L. P. Bueno, D. J. Tainturier, and Y. Ruckebusch, “Detection of parturition in cow and mare by a useful warning system,” Theriogenology, vol. 16, no. 6, pp. 599–605, 1981.
- [19] J. L. Owens, T. N. Edey, B. M. Bindon, and L. R. Piper, “Parturient behaviour and calf survival in a herd selected for twinning,” Applied Animal Behaviour Science, vol. 13, no. 4, pp. 321–333, 1985.
- [20] K. Sugawara, S. Saito, T. Nakano, M. Akabane, T. Kobayashi, and T. Ogawa, “Calving prediction from video: Exploiting behavioural information relevant to calving signs in japanese black beef cows,” in European Conference on Precision Livestock Farming (ECPLF 2019), 2019, pp. 663–669.
- [21] R. Hyodo, T. Nakano, and T. Ogawa, “Feature representation learning for calving detection of cows using video frames,” in 25th International Conference on Pattern Recognition (ICPR 2020), Jan. 2021, pp. 4131–4136.
- [22] K. He, X. Zhang, S. Ren, and J. Sun, “Deep residual learning for image recognition,” in Computer Vision and Pattern Recognition (CVPR 2016), 2016, pp. 770–778.
- [23] H. Hermansky, E. Variani, and V. Peddinti, “Mean temporal distance: Predicting ASR error from temporal properties of speech signal,” in International Conference on Acoustics, Speech and Signal Processing (ICASSP 2013), 2013, pp. 7423–7426.
- [24] T. Ogawa, S. Mallidi, E. Dupoux, J. Cohen, N. Feldman, and H. Hermansky, “A new efficient measure for accuracy prediction and its application to multistream-based unsupervised adaptation,” in International Conference on Pattern Recognition (ICPR 2017), 2017, pp. 2222–2227.
- [25] J. Redmon and A. Farhadi, “Yolov3: An incremental improvement,” CoRR, vol. abs/1804.02767, 2018. [Online]. Available: http://arxiv.org/abs/1804.02767
- [26] M. Jaspers, T. Steen, C. Bos, and M. Geenen, “The think aloud method: A guide to user interface design,” International journal of medical informatics, vol. 73, pp. 781–95, 12 2004.
- [27] B. Dietvorst, J. Simmons, and C. Massey, “Algorithm aversion: People erroneously avoid algorithms after seeing them err,” Journal of experimental psychology. General, vol. 144, 11 2014.
- [28] M. Dzindolet, L. Pierce, H. Beck, and L. Dawe, “The perceived utility of human and automated aids in a visual detection task,” Human factors, vol. 44, pp. 79–94, 2 2002.