The MicroBooNE Collaboration ††thanks: microboone_info@fnal.gov
Multi-Differential Cross Section Measurements of -Argon
Quasielastic-like Reactions with the MicroBooNE Detector
Abstract
We report on a flux-integrated multi-differential measurement of charged-current muon neutrino scattering on argon with one muon and one proton in the final state using the Booster Neutrino Beam and MicroBooNE detector at Fermi National Accelerator Laboratory. The data are studied as a function of various kinematic imbalance variables and of a neutrino energy estimator, and are compared to a number of event generator predictions. We find that the measured cross sections in different phase-space regions are sensitive to nuclear effects. Our results provide precision data to test and improve the neutrino-nucleus interaction models needed to perform high-accuracy oscillation analyses. Specific regions of phase-space are identified where further model refinements are most needed.
I Introduction
High-precision measurements of the neutrino mixing angles, mass differences, and charge-parity violating phase, and the search for physics beyond the Standard Model are the primary physics goals of many currently operating as well as next-generation neutrino experiments Tanabashi et al. (2018); Abe et al. (2020); Abi et al. (2018a, b, c); Abe et al. (2018a). These measurements require reliable comparisons of measured and theoretically-expected neutrino interaction rates in the corresponding detectors. Thus, understanding the neutrino-nucleus scattering processes in detail is a prerequisite for these experiments to reach their discovery potential. A number of neutrino oscillation experiments employ liquid argon time projection chambers (LArTPCs) Abi et al. (2018a, b, c); Antonello et al. (2015); Tortorici et al. (2018); Abi et al. (2018d) to detect the particles produced in neutrino interactions. The ultimate goal of these efforts is both to reconstruct the energy of the neutrino based on the kinematics of the outgoing particles and to enable few-percent-level modeling of neutrino-argon interaction rates Abi et al. (2020). Therefore, high-accuracy modeling of neutrino-argon interactions is of the utmost importance Dolan et al. (2018); Rocco et al. (2016); Rocco (2020).
This work presents the first measurement of flux-integrated single- and double-differential cross sections for muon-neutrino-argon (-Ar) charged-current (CC) quasielastic (QE)-like scattering reactions as a function of kinematic imbalance variables Lu et al. (2016); Abe et al. (2018b); Lu et al. (2018); Cai et al. (2020); Bathe-Peters et al. (2022). Double-differential measurements as a function of a neutrino energy estimator are further reported for the first time in kinematic imbalance bins on argon. Motivated by a previous analysis with a similar signal event topology Abratenko et al. (2020a), we focus on reactions where a single muon-proton pair is reconstructed with no additional detected particles. The results reported here use the MicroBooNE detector Acciarri et al. (2017) with an exposure of protons on target from the Booster Neutrino Beam (BNB) Aguilar-Arevalo et al. (2009) at Fermi National Accelerator Laboratory.
The experimental setup is presented in Sec. II, followed by the signal definition and event selection in Sec. III. The observables of interest are defined in Sec. IV. Section V describes the cross section extraction and systematics procedure and Sec. VI outlines the modeling configurations used for comparison to the data. The results are reported in Sec. VII and the conclusions are discussed in Sec. VIII.
II Experimental Setup
The MicroBooNE LArTPC has an active volume that contains 85 tonnes of argon. It is exposed to BNB neutrinos, with an energy spectrum that peaks around 0.8 GeV and extends to 2 GeV.
Charged particles are produced after the primary neutrino interaction with the argon nuclei in the LArTPC active volume. Scintillation light and electron ionization trails are produced while these charged particles travel through the liquid argon. In the presence of an electric field of 273 V/cm, the ionization electrons drift towards a system of three anode wire planes. Photomultiplier tubes (PMTs) are used to measure the scintillation light.
If the PMT signals are in time coincidence with the beam arrival time, then events are recorded. Trigger hardware and software selection criteria are designed to minimize the contribution from background events, which are primarily cosmic muons. After these are applied, enriched data samples are obtained in which a neutrino interaction occurs in 15% of selected beam spills Kaleko (2013).
Individual particle tracks are reconstructed with Pandora pattern recognition algorithms based on the measured ionization signals in the enriched data samples Acciarri et al. (2018). Particles are identified based on the measured track energy deposition profile, while the particle momenta are obtained based on the track length PDG (2012); H. Bichsel (2005).
III Signal Definition & Event Selection
The QE-like signal definition used in this analysis includes all -Ar scattering events with a final-state muon with momentum 0.1 1.2 GeV/, and exactly one proton with 0.3 1 GeV/. Events with final-state neutral pions at any momentum are excluded. Signal events may contain any number of protons below 300 MeV/ or above 1 GeV/, neutrons at any momentum, and charged pions with momentum lower than 70 MeV/. We refer to the events passing this definition as CC1p0. The aforementioned momentum ranges are driven by considering resolution effects, as well as regions of the phase space with non-zero efficiencies and systematic uncertainties that are well understood. This signal consists predominantly of QE events. More complex interactions as labeled at a generator level, namely meson exchange currents (MEC), resonance interactions (RES) and deep inelastic scattering events (DIS), can still yield CC1p0 events. That can be the case due to final-state interactions (FSI), such as pion absorption, or due to the presence of particles outside the momentum range of interest in the CC1p0 signal definition as defined above.
Events that satisfy the CC1p0 signal definition at a reconstruction level but not at truth level are treated as background events. We refer to these events as non-CC1p0. Based on simulation predictions, we find that the dominant background contribution originates from events with two protons in the momentum range of interest, where the second proton was not reconstructed. These events are referred to as CC12p0 and are the focus of a dedicated MicroBooNE cross section analysis that demonstrated good data-simulation agreement Abratenko et al. (2022a).
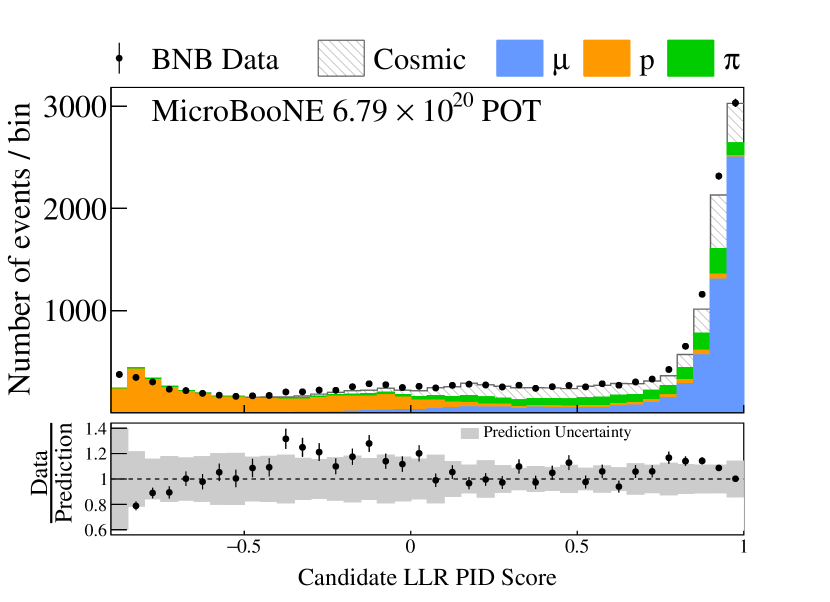
Candidate muon-proton pairs are isolated by requiring the existence of precisely two track-like and no shower-like objects, as classified by Pandora using a track-score variable Van De Pontseele (2020); Abratenko et al. (2022b). The log-likelihood ratio (LLR) particle identification (PID) score Abratenko et al. (2021) is used to identify the muon and proton candidates. Figure 1 shows the particle composition breakdown of the sample as a function of the LLR PID score.
Muons tend to have higher LLR PID score values than protons, thus the track with the highest score is tagged as the candidate muon. Meanwhile, the track with the lower score is treated as the candidate proton.

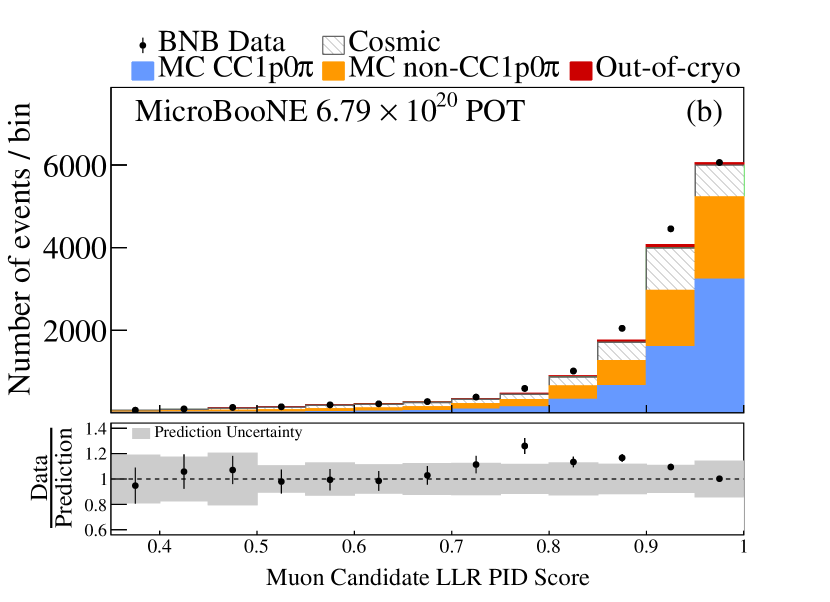
Cosmic muon and non-CC1p0 contamination backgrounds were significantly reduced by applying a requirement on the candidate proton LLR PID score. We studied the effect of cutting on different values of this quantity, which has a strong discrimination power for rejecting MC non-CC1p0 background, out-of-cryostat and cosmic events. That yielded an optimal cut on the proton candidate LLR score of 0.05, as shown in Fig. 2a. Figure 2b shows the corresponding muon candidate LLR score, which is peaked at values close to one. The uncertainty bands account for potential data-MC discrepancies observed for both particle scores. The particle composition of the panels included in Fig. 2 is shown in the Supplemental Material.
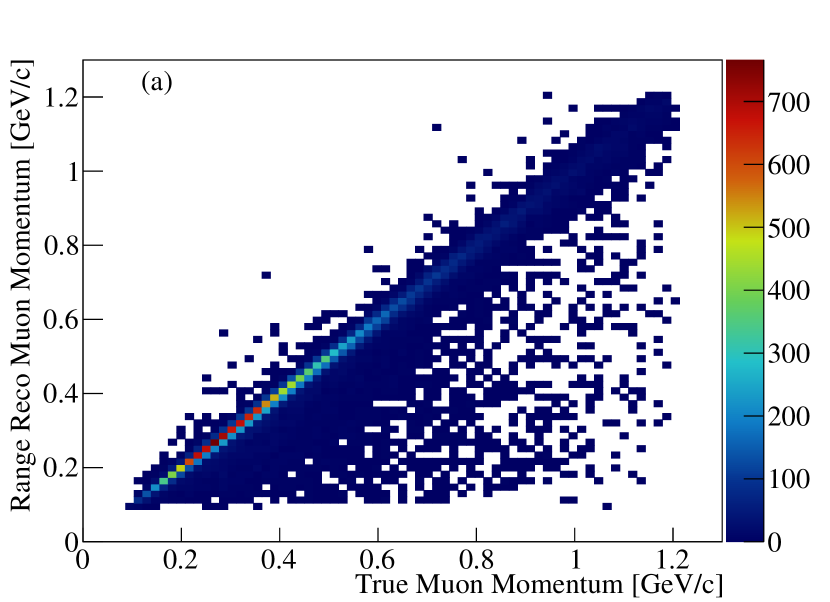
To further minimize the contribution of mis-reconstructed track directions, we took advantage of two muon momentum reconstruction methods available for contained tracks, namely the momentum from range Berger et al. (2017) and the momentum from Multiple Coulomb Scattering (MCS) Abratenko et al. (2017). The range and MCS muon momenta needed to be in agreement within 25% and the improvement in the muon momentum reconstruction can be seen in Fig. 3. We required that the distance between the track start points and the vertex is smaller than the corresponding distance between the track end points and the vertex. We also demanded that the distance between the start points of the two candidate tracks is smaller than the distance between the two end points.

Further reduction of the cosmic tracks and minimization of bin-migration effects is achieved by considering only fully contained candidate muon-proton pairs within a fiducial volume of 10 cm inside the edge of the detector active volume. We retain 9051 data events that satisfy all event selection criteria.
In order to provide an accurate description of the dominant cosmic backgrounds pertinent to surface detectors, the full Monte Carlo (MC) simulation consists of a combination of simulated neutrino interactions overlaid on top of beam-off background data. This approach has been extensively used by MicroBooNE Adams et al. (2019); Abratenko et al. (2020a, 2022c, 2022d). The GENIE v3.0.6 event generator is used to simulate neutrino interactions with the G18_10a_02_11a configuration Andreopoulos et al. (2010, 2015). The CCQE and CCMEC predictions have been additionally tuned to T2K -carbon CC0 data with any number of protons in the final state Abe et al. (2016); Abratenko et al. (2022e). The different target nuclei across T2K and MicroBooNE might result in particle reinteraction differences that can affect the reconstructed final state topologies, such as different absorption effects. Yet, the T2K data sets used for tuning are dominated by CCQE and CCMEC interaction processes, which are the main contributors to the CC1p0 topology presented in this work. Predictions for more complex interactions, such as RES, remain unaltered and no additional MC constraints are applied. We refer to the corresponding tuned prediction as G18. All the final state particles following the primary neutrino interaction are generated by GENIE. They are further propagated in GENIE through the nucleus to account for FSI. The propagation of the particles outside the nucleus is simulated using GEANT4 Agostinelli et al. (2003). The MicroBooNE detector response is modeled using the LArSoft framework Pordes and Snider (2016); Snider and Petrillo (2017). Based on this MC prediction, we obtain a purity of 70% and an efficiency for selecting CC1p0 events of 10%. The final efficiency is primarily driven by the demand for exactly two fully contained track-like candidates.
IV Observables
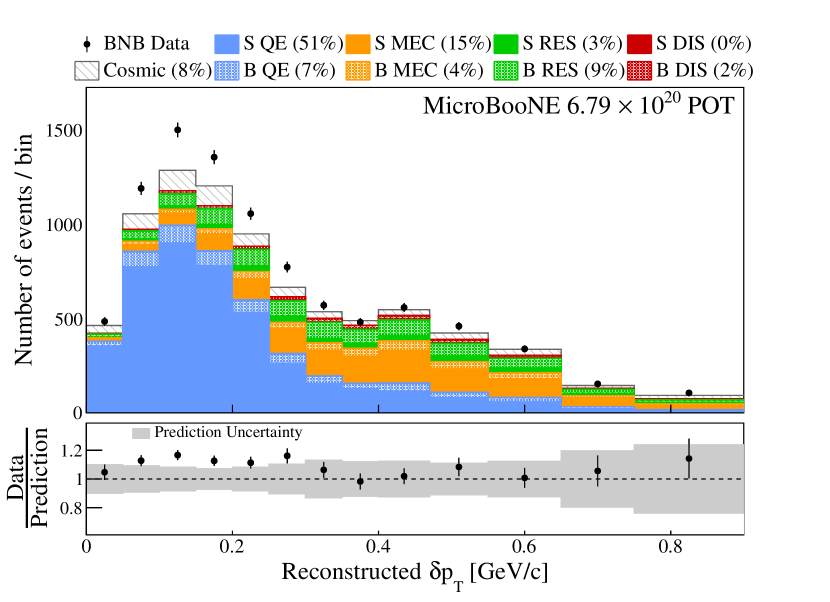
In neutrino-nucleus scattering events, there is an imbalance between the true initial neutrino momentum and the true sum of final-state lepton and hadron momenta as a result of nuclear effects Lu et al. (2016). A schematic representation of the kinematic imbalance variables of interest in this work is shown in Fig. 4.
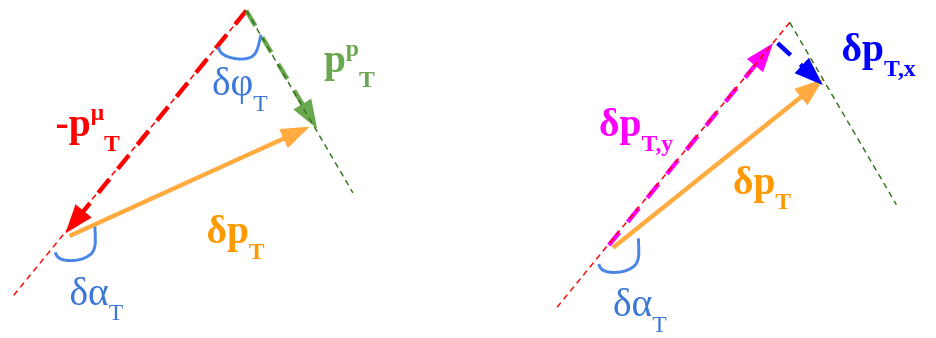
Using the CC1p0 candidate muon-proton pair kinematics, the missing momentum in the plane transverse to the beam direction is defined as
| (1) |
where and are the projections of the momenta of the outgoing lepton and proton on the transverse plane, respectively. In the absence of nuclear effects, purely QE interactions would yield = 0. In the presence of the dense nuclear medium, this variable encapsulates information related to the Fermi motion, but it is smeared due to FSI and non-QE interactions, as can be seen in Fig. 5. Further discussion on the FSI smearing effects can be found in Sec. VII.
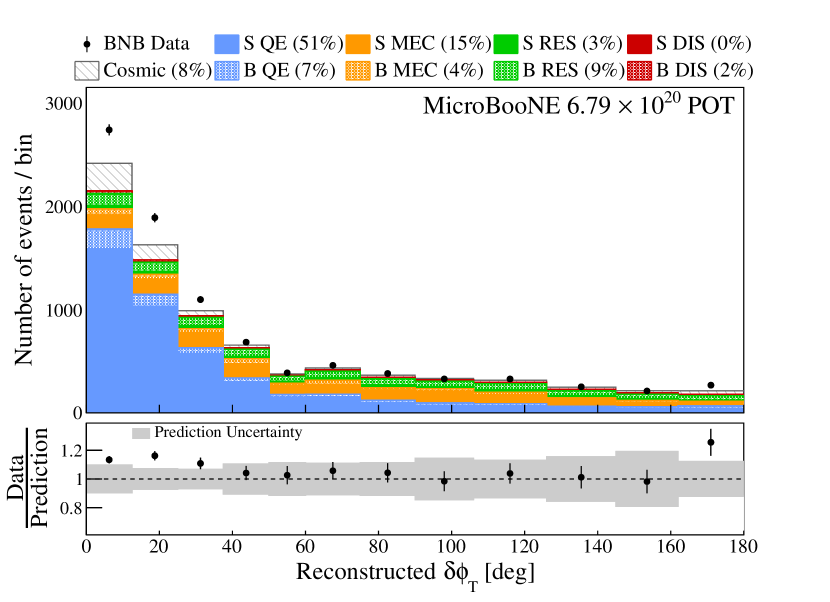
The direction of the transverse momentum imbalance is described by the angle
| (2) |
which is uniformly distributed in the absence of FSI due to the isotropic nature of the Fermi motion. In the presence of FSI, the proton momentum is generally reduced and the distribution becomes weighted towards 180∘, as can be seen in Fig. 6.

The opening angle between the correlated candidate muon-proton pair on the transverse plane is given by
| (3) |
In the absence of nuclear effects, QE events would be concentrated at = 0. When nuclear effects are present, QE events can occupy wider angles. At the same time, non-QE events are dominant in the high part of the tail and their contribution is fairly flat across all angles, as can be seen in Fig. 7.
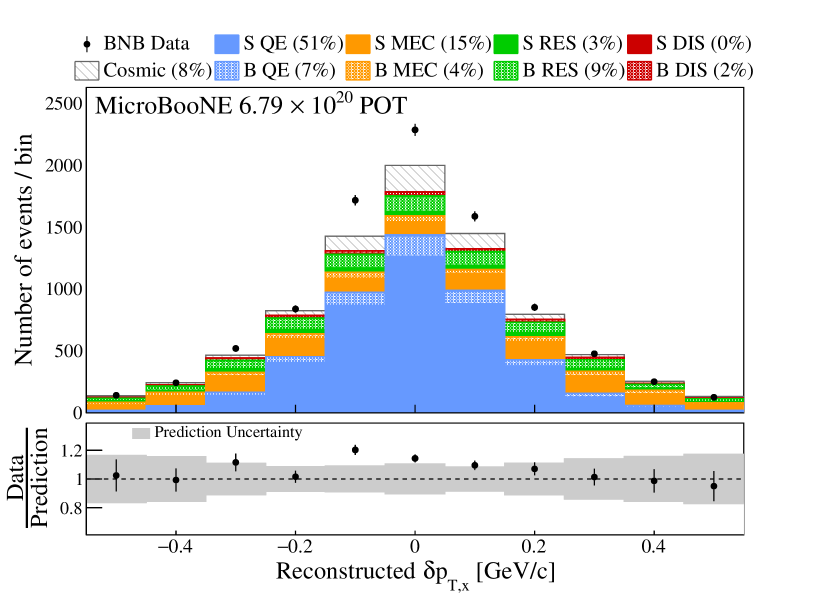
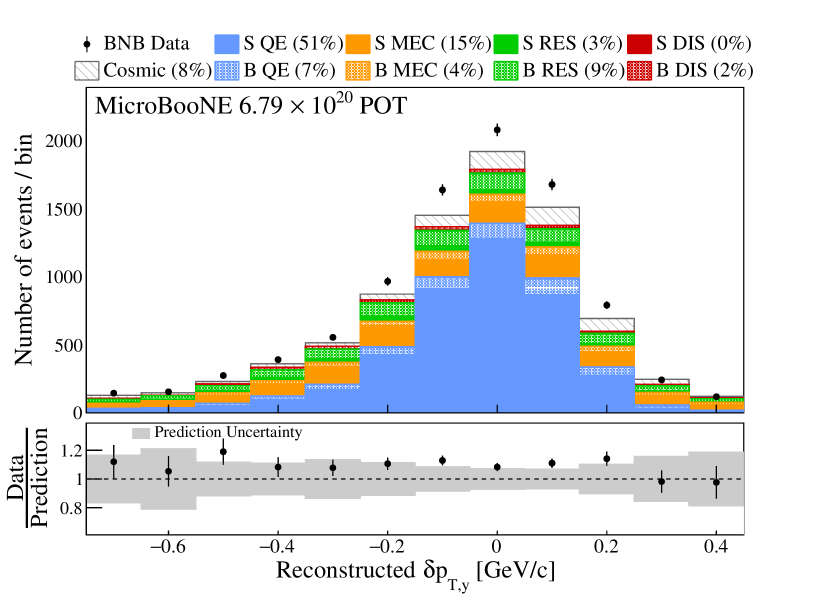
The muon-proton momentum imbalances transverse and longitudinal to the transverse lepton momentum Cai et al. (2020) are defined as
| (4) |
and can also be written as
| (5) |
These distributions can be seen in Fig. 8 and Fig. 9, respectively. The distribution is symmetric around 0 GeV/ due to the presence of the factor in Eq. 5 and the fact that ranges from 0o to 180o. The width of the distribution is driven by the Fermi motion that affects the magnitude. Unlike , the distribution is asymmetric with an enhanced contribution from negative values. The asymmetry is driven by the presence of the factor in Eq. 5 and the fact that is mainly peaked around 180o. Given that the forward peak is driven by FSI, the size of the asymmetry is also sensitive to the FSI strength.
Finally, the calorimetric energy reconstruction
| (6) |
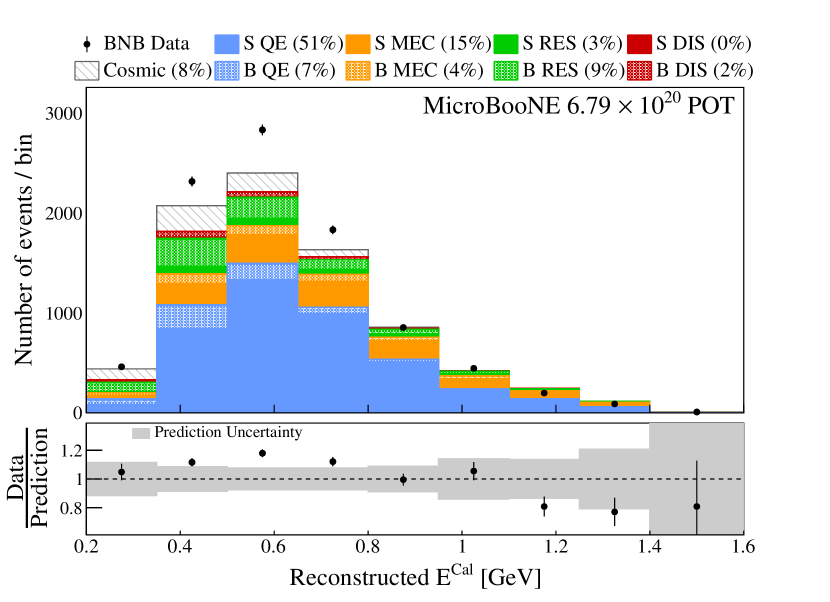
is investigated, where is the muon energy, is the proton kinetic energy and = 0.04 GeV is the average binding energy for argon Bodek and Cai (2019). This energy estimator, shown in Fig. 10, is an approximation for the true energy of the incoming neutrino and is used in oscillation searches.
V Cross Section Extraction & Systematics
The flux-averaged differential event rate as a function of a given variable in bin is obtained by
| (7) |
where and are the number of measured events and the expected background events, respectively. is the number of target argon nuclei in the fiducial volume of interest. corresponds to the integrated BNB flux and corresponds to the -th bin width or area for the single- and double-differential results, respectively.
We report the extracted cross sections for CC1p0 interactions using the Wiener singular value decomposition (Wiener-SVD) unfolding technique as a function of unfolded kinematic variables Tang et al. (2017). This unfolding procedure corrects a measured event rate for inefficiency and resolution effects. This is achieved by performing a minimization of a score that compares data to a prediction and allows for a regularization term. A Wiener filter determines the level of regularization that is required to minimize the mean square error between the variance and bias of the result. In addition to the measured event rate, the method uses a covariance matrix calculated from simulated events accounting for the statistical and systematic uncertainties on the measurement as input. It also requires the construction of a response matrix describing the expected detector smearing and reconstruction efficiency.
The output of the method is an unfolded differential cross section, a covariance matrix describing the total uncertainty on the unfolded result, and an additional smearing matrix that we refer to as . The latter contains information about the regularization and bias of the measurement. The corresponding matrices have been applied to all the cross section predictions included in this work when a comparison to the unfolded data is performed. The matrix should be applied to any independent theoretical prediction when a comparison is performed to the data reported in this paper. The data release, the unfolded covariance matrices, and the additional matrices can be found in the Supplemental Material.
The total covariance matrix = + includes the statistical and systematic uncertainties on the differential event rate associated with our measurement. is a diagonal covariance matrix with the statistical uncertainties and is a covariance matrix that incorporates the total systematic uncertainties both on the CC1p0 signal and on the non-CC1p0 background events as detailed below.
The neutrino flux is predicted using the flux simulation of the MiniBooNE collaboration that used the same beam line Aguilar-Arevalo et al. (2013). Neutrino cross section modeling uncertainties were estimated using the GENIE framework of event reweighting Andreopoulos et al. (2010, 2015); Abratenko et al. (2022e). The rescattering uncertainties were obtained using GEANT4 and the relevant reweighting package Calcutt et al. (2021). For each of these sources of uncertainty, we use a multisim technique Roe (2007), which consists of generating a large number of MC replicas, each one called a “universe”, where model parameters are varied within their uncertainties. The simultaneous varying of many model parameters provides a correct treatment of their correlations. A total of such universes are used to construct a covariance matrix corresponding to each source of uncertainty,
| (8) |
where () and () are the flux-averaged event rates for the central value and systematic universe in a measured bin (), respectively. The resulting covariance matrices are summed together to estimate the relevant uncertainty from each source.
In order to account for potential biases due to the nominal MC modeling prediction used in the unfolding procedure and presented in Sec. VI, an additional cross section uncertainty using the NuWro v19.02.2 event generator prediction Golan et al. (2012) as an alternative universe has been added. The relevant NuWro modeling is significantly different when compared to the nominal MC one, as detailed in Sect. VI. The flux-integrated NuWro cross sections are obtained using Eq. 7 and the corresponding covariance matrices are constructed using Eq. 8 and a single universe ( = 1).
For detector model systematic uncertainties, one detector parameter is varied each time by and is referred to as a “unisim”. These include variations in the light yield, the ionization electron recombination model, space-charge effects, and waveform deconvolution Abratenko et al. (2022f). We then examine the impact of each parameter variation on the MC event rates by obtaining the differences with respect to the central value on a bin-by-bin basis. We define the total detector systematic uncertainty by summing in quadrature the effect of detector variations using the formalism introduced in Eq. 8,
| (9) |
The full fractional uncertainty on the integrated total cross section is 11% and includes contributions from the neutrino flux prediction (7.3%), neutrino interaction cross section modeling (6%), detector response modeling (4.9%), beam exposure (2.3%), statistics (1.5%), number-of-scattering-targets (1.2%), reinteractions (1%), and out-of-cryostat (dirt) interaction modeling (0.2%). The Supplemental Material includes tables detailing all the cross section uncertainties used in this work. The main contributors are found to be the strength of the RPA correction and CCMEC cross section shape. The signal related cross section uncertainties are found to be 8.6%, while the background ones account for 6.3%. Note that the individual contributions are higher than the total cross section uncertainty of 6% due to correlations between the signal and background events, since the same interaction processes can contribute both as signal and background.
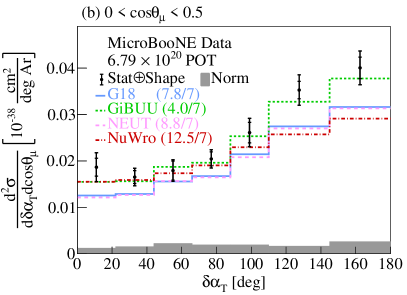
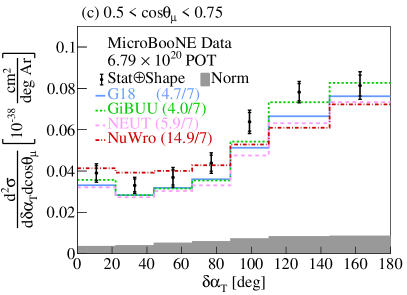
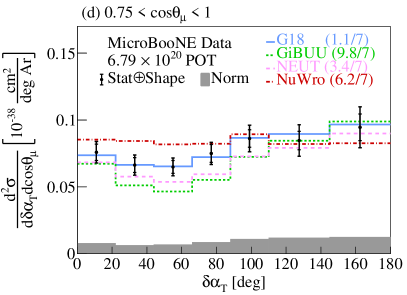
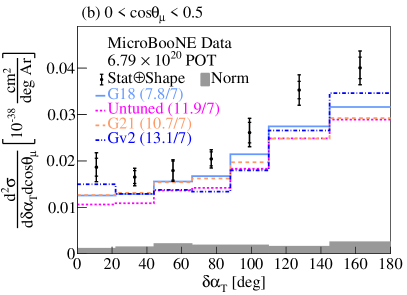
In the results presented below, the inner error bars on the reported cross sections correspond to the statistical uncertainties. The systematic uncertainties were decomposed into shape- and normalization-related sources following the procedure outlined in Mahn (2009). The cross-term uncertainties were incorporated in the normalization part. The outer error bars on the reported cross sections correspond to statistical and shape uncertainties added in quadrature. The normalization uncertainties are presented with the gray band at the bottom of each plot. Overflow (underflow) values are included in the last (first) bin. The relevant matrices have been applied to the theoretical predictions to account for regularization effects.
VI Modeling Configurations
The nominal MC neutrino interaction prediction (G18) uses the local Fermi gas (LFG) model Carrasco and Oset (1992), the Nieves CCQE scattering prescription Nieves et al. (2012) which includes Coulomb corrections for the outgoing muon Engel (1998) and random phase approximation (RPA) corrections Nieves et al. (2004). Additionally, it uses the Nieves MEC model Schwehr et al. (2016), the KLN-BS RES Nowak (2009); Kuzmin et al. (2004); Berger and Sehgal (2007); Graczyk and Sobczyk (2008) and Berger-Sehgal coherent (COH) Berger and Sehgal (2009) scattering models, the hA2018 FSI model Ashery et al. (1981), and MicroBooNE-specific tuning of model parameters Abratenko et al. (2022e).
Our results are also compared to a number of alternative event generators. GiBUU 2021 (GiBUU) uses similar models, but they are implemented in a coherent way by solving the Boltzmann-Uehling-Uhlenbeck transport equation Mosel (2019). The modeling includes the LFG model Carrasco and Oset (1992), a standard CCQE expression Leitner et al. (2006), an empirical MEC model and a dedicated spin dependent resonance amplitude calculation following the MAID analysis Mosel (2019). The DIS model is from PYTHIA Sjostrand et al. (2006). GiBUU’s FSI treatment propagates the hadrons through the residual nucleus in a nuclear potential which is consistent with the initial state. NuWro v19.02.2 (NuWro) uses the LFG model Carrasco and Oset (1992), the Llewellyn Smith model for QE events Llewellyn Smith (1972), the Nieves model for MEC events Nieves et al. (2011), the Adler-Rarita-Schwinger formalism to calculate the resonance explicitly Graczyk and Sobczyk (2008), the BS COH Berger and Sehgal (2009) scattering model and an intranuclear cascade model for FSI Nieves et al. (2011). NEUT v5.4.0 (NEUT) uses the LFG model Carrasco and Oset (1992), the Nieves CCQE scattering prescription Nieves et al. (2012), the Nieves MEC model Schwehr et al. (2016), the BS RES Nowak (2009); Kuzmin et al. (2004); Berger and Sehgal (2007); Graczyk and Sobczyk (2008) and BS COH Berger and Sehgal (2009) scattering models, and FSI with Oset medium corrections for pions Andreopoulos et al. (2010, 2015).
In addition to the alternative event generators, our results are compared to a number of different GENIE configurations. These include an older version, GENIE v2.12.10 (Gv2) Andreopoulos et al. (2010, 2015), which uses the Bodek-Ritchie Fermi Gas model, the Llewellyn Smith CCQE scattering prescription Llewellyn Smith (1972), the empirical MEC model Katori (2015), a Rein-Sehgal RES and COH scattering model Rein and Sehgal (1981), and a data driven FSI model denoted as “hA” Mashnik et al. (2006). Another model, “Untuned”, uses the GENIE v3.0.6 G18_10a_02_11a configuration without additional MicroBooNE-specific tuning. Finally, the newly added theory-driven GENIE v3.2.0 G21_11b_00_000 configuration (G21) is shown. This includes the SuSAv2 prediction for the QE and MEC scattering parts Dolan et al. (2020) and the hN2018 FSI model Dytman et al. (2021). The modeling options for RES, DIS, and COH interactions are the same as for G18.
To quantify the data-simulation agreement, the /bins ratio data comparison for each generator is shown on all the figures and is calculated by taking into account the total covariance matrix. Ratios close to unity are indicative of a sufficiently accurate modeling performance. Theoretical uncertainties on the models themselves are not included.
VII Results
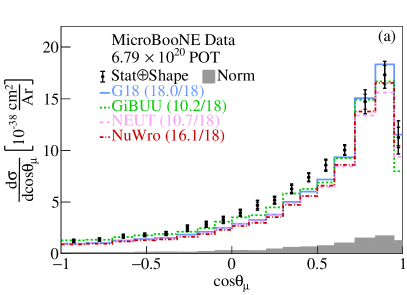
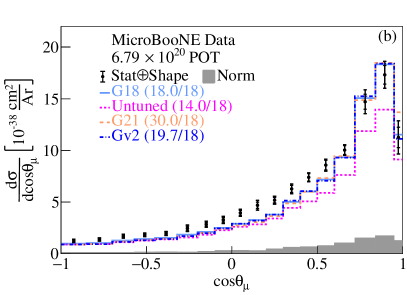
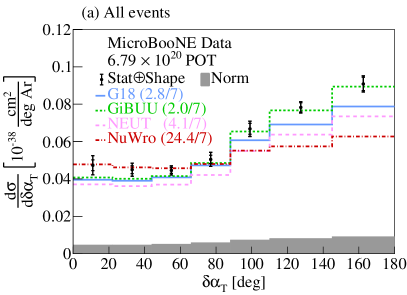
Along with the aforementioned kinematic imbalance and energy estimator results, the data are also presented as a function of the lepton angular orientation (Fig. 11). Previous MicroBooNE measurements using different signal definitions Abratenko et al. (2020a, 2019, b) showed discrepancies in that quantity, primarily in the forward direction. These analyses used an older simulation prediction, namely GENIE v2.12.2, to account for the efficiency corrections and beam-induced backgrounds. This work illustrates that all generator (Fig. 11a) and GENIE configuration (Fig. 11b) predictions are in good agreement with the data when reported as a function of cos.
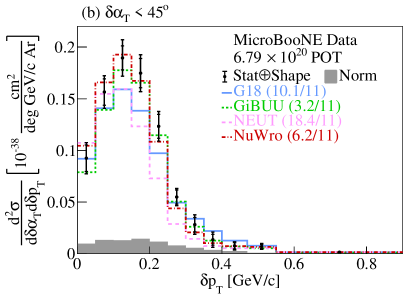
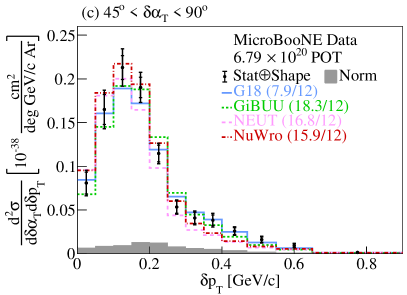
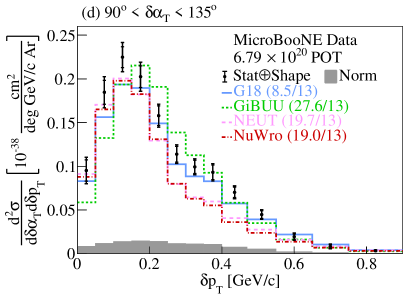
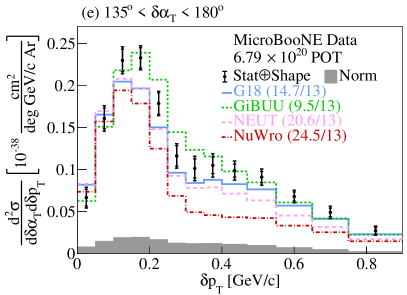
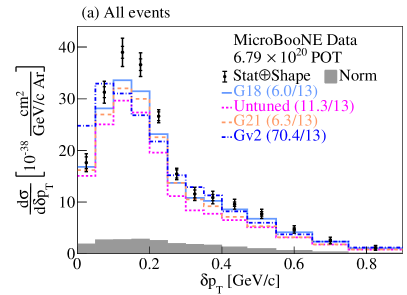
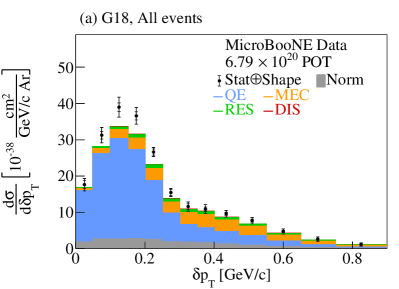
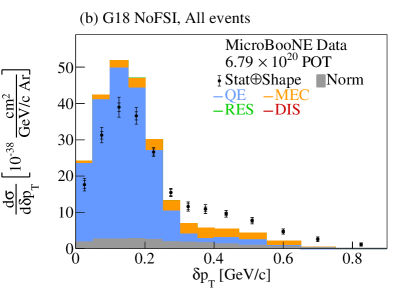
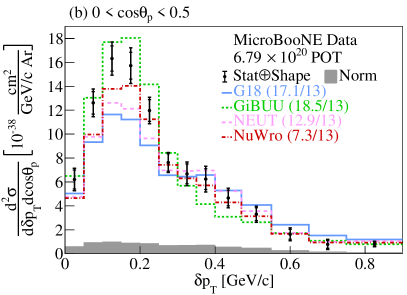
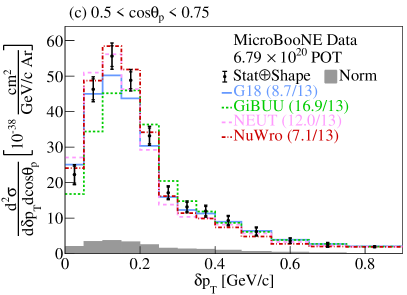
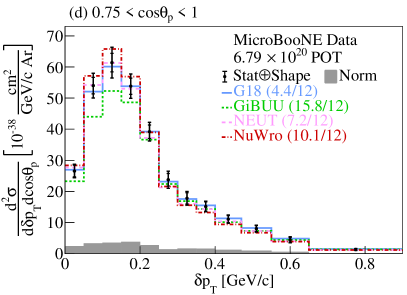
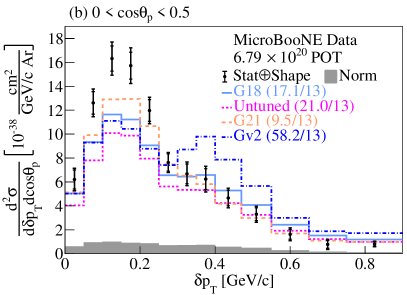
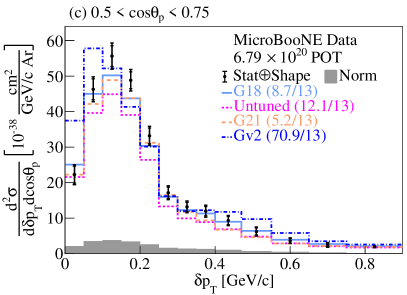
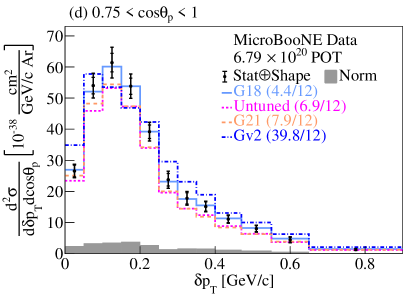
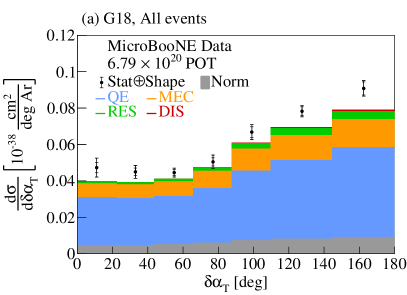
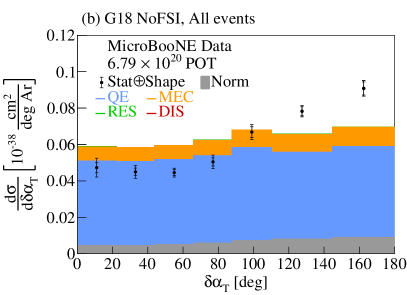
Figures 12 and 13 show the measured single-differential cross sections as a function of using all the events (panel a), as well as the double-differential results as a function of the same kinematic variable in bins (panels b-e). In the presence of FSI, the proton can rescatter or be absorbed, yielding larger kinematic imbalances on the transverse plane and values that extend beyond the Fermi momentum, as can be seen in Fig. 14. Furthermore, the same extended tail can be obtained when pions produced due to multi-nucleon effects (MEC or RES) are either absorbed or below the detection threshold. The single-differential result shows such a high-momentum tail that extends above 0.8 GeV/. This picture is consistent with the results reported by the T2K and MINERvA collaborations Avanzini et al. (2022); Abe et al. (2018b); Lu et al. (2018). Unlike the single-differential result, the double differential results with low extend only slightly above 0.4 GeV/. That indicates that this region contains minimal FSI and multi-nucleon effects and the distribution is driven by the nucleon Fermi motion. On the other hand, the higher values correspond to distributions that extend beyond 0.8 GeV/. This behavior is indicative of the presence of FSI and multi-nucleon effects that smear the distribution to higher values. Future multi-differential results can help further disentangle the contributions from these effects. Figure 12 shows the comparisons to a number of available neutrino event generators with NuWro and G18 showing the best agreement over all events. Figure 13 shows the same results compared to a number of GENIE configurations illustrating that Gv2 is disfavored, an observation that is driven by the Gv2 low behavior. Furthermore, Untuned shows a good /bins performance across all slices but predicts lower values than data. Additionally, Fig. 14 shows the effect of final state interactions (FSI) on the CC1p0 selection using the G18 configuration of GENIE. The addition of FSI allows for more non-QE events to satisfy the CC1p0 signal definition that smear the distribution to higher values.
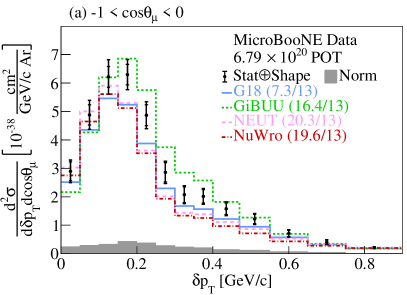
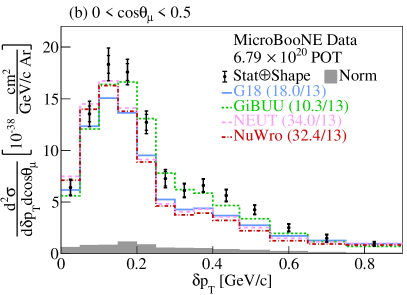
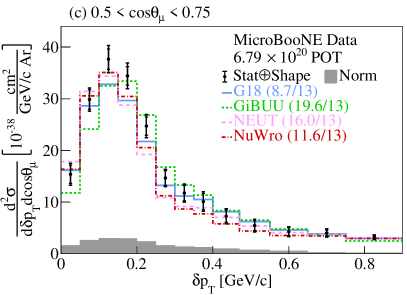
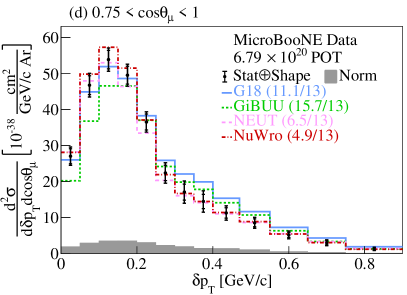
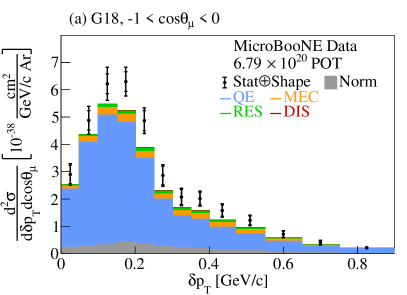
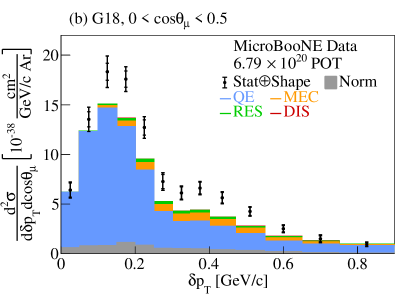
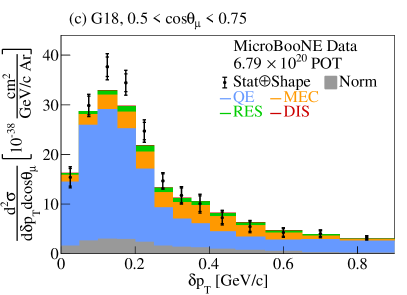
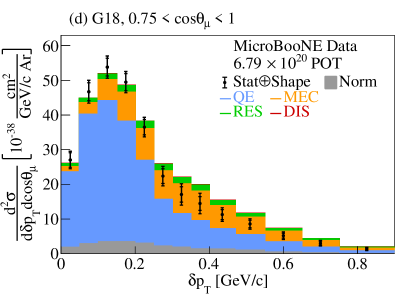
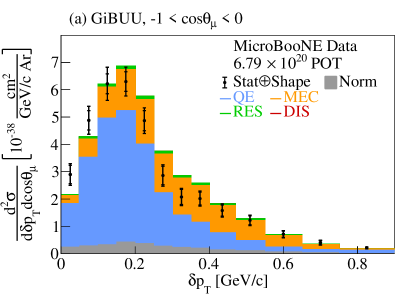
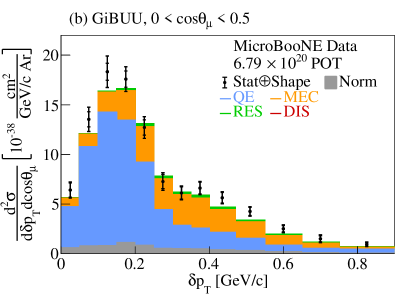
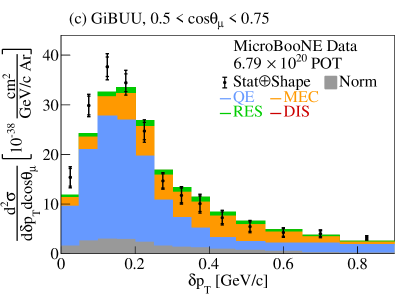
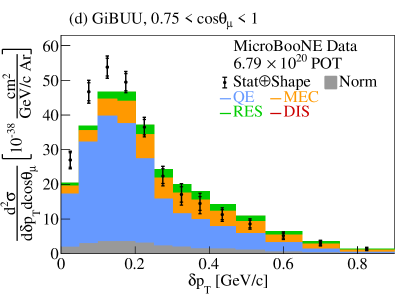
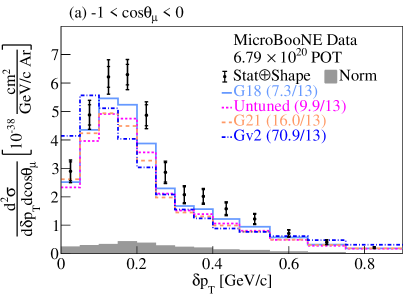
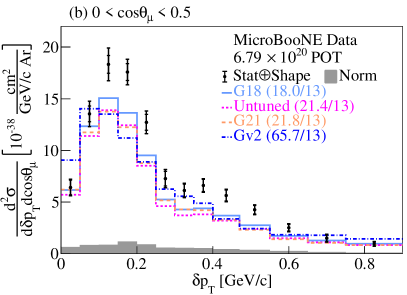
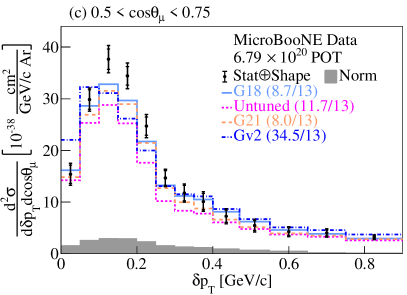
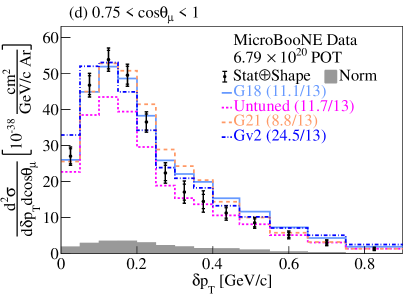
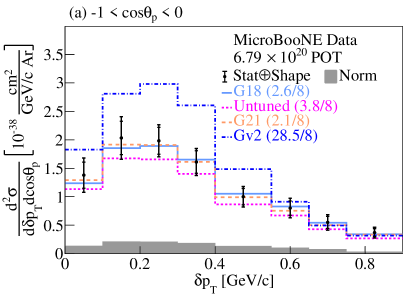
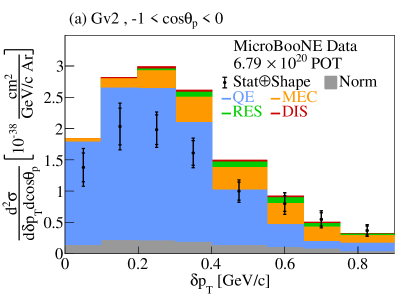
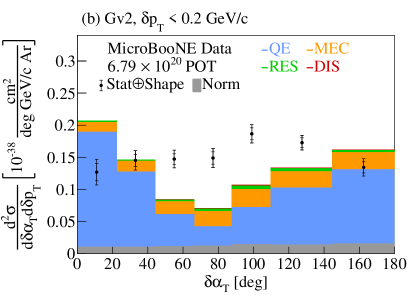
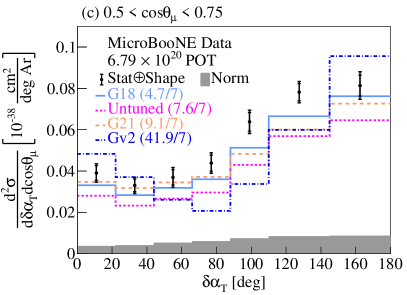
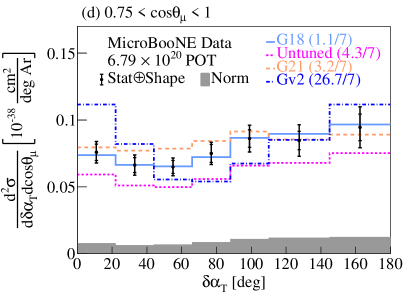
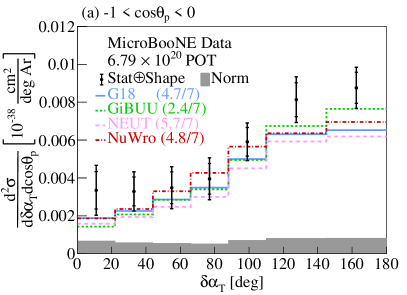
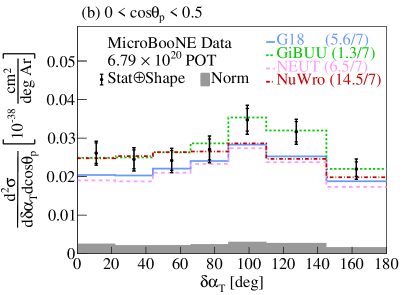
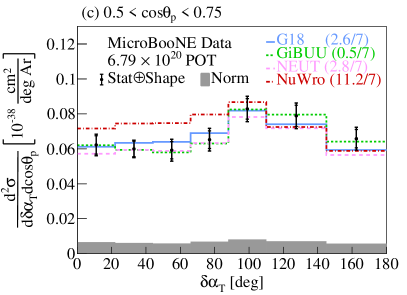
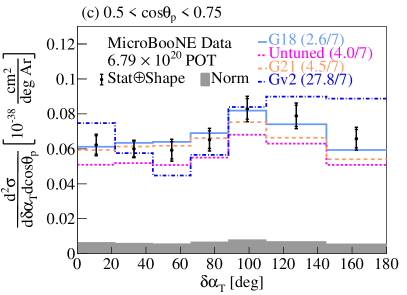
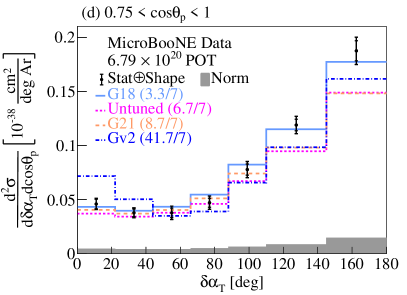
Figure 15 shows the double-differential results as a function of in cos bins. In a factorized nuclear model such as the LFG, the Fermi motion part of should stay constant in terms of the shape as a function of the outgoing lepton kinematics, since in such models the initial state nucleon momentum is a property of the nucleus that cannot be affected by the interaction momentum or energy transfer. That is indeed the observed behavior in the reported results across all event generators and configurations, where no evidence of the inadequacy of the factorization approach is observed. Figure 15 shows the comparisons to a number of available neutrino event generators, where the G18 prediction is favored based on the /ndf results. Apart from the factorization, a better separation between QE and non-QE can be gained depending on the cos region. As can be seen in Fig. 16 for G18, MEC events play a more pronounced role for forward muon scattering and in the high tail, as opposed to backward scattering angles, which are much more strongly populated by QE events. Furthermore, the G18 cross section prediction falls below the data in the -1 cos 0.5 region, as seen in Fig. 16a and Fig. 16b. That could indicate that additional contribution from the QE part of the G18 prediction is needed beyond the MicroBooNE tune. Figure 17 shows the same interaction breakdown for GiBUU. Unlike G18, GiBUU illustrates a peak shift to the right, which becomes more pronounced in the backward direction. This shift is driven by the enhanced MEC contribution in higher values and the reduced QE contribution at smaller values. In the backward direction, GiBUU further shows a cross section excess driven by the MEC contribution. Figure 18 shows the same results compared to a number of GENIE configurations illustrating that Gv2 is disfavored due to the low bin behavior.
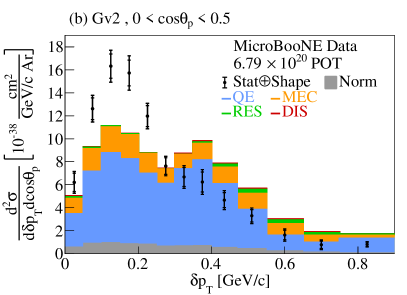
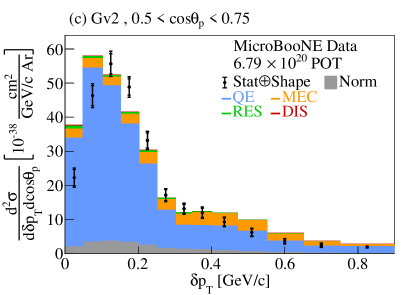
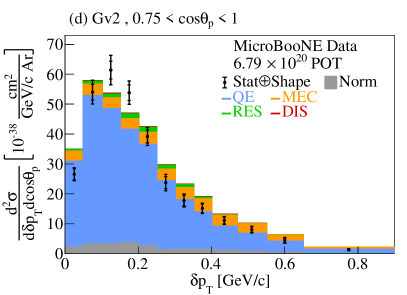
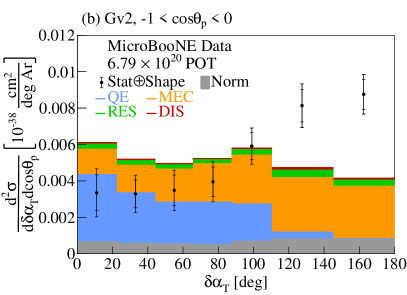
Figures 19 and 20 show the double-differential cross section as a function of in cos bins. The factorization of the nuclear motion is mostly preserved in cos bins, analogously to the previous result in cos. Figure 19 shows the comparisons to a number of available neutrino event generators. The GiBUU prediction is significantly lower than the data in the backward proton angle for low values, as shown in Fig. 19a. Figure 20 shows the same results compared to a number of GENIE configurations illustrating that Gv2 is disfavored across all cos bins. As can be seen in Fig. 21, this particularly poor performance is driven by the QE contribution. For backward scattering events (panel a), the QE contribution predicted by Llewellyn Smith is significantly overestimated. For intermediate angles (0 cos 0.5), the same QE model results in an unphysical double peak. For forward scattering (0.5 cos 1), the Gv2 QE prediction yields a pronounced contribution at lower values of compared to the data.
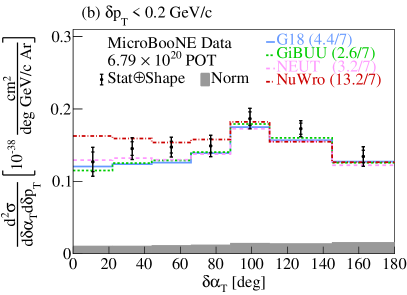
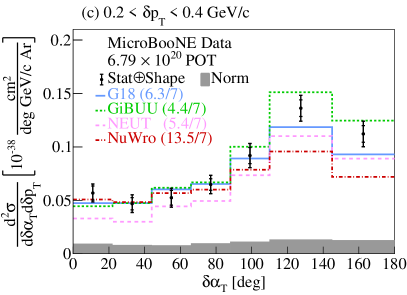
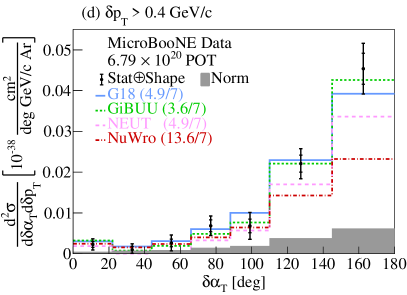
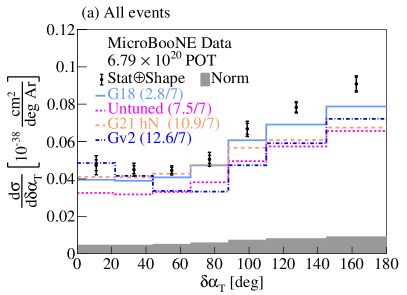
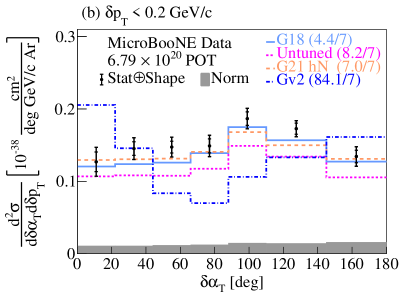
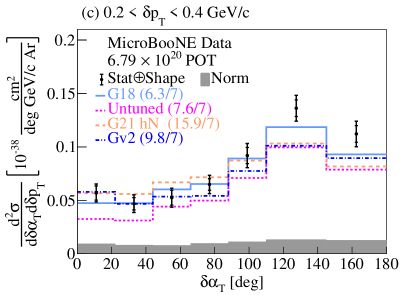
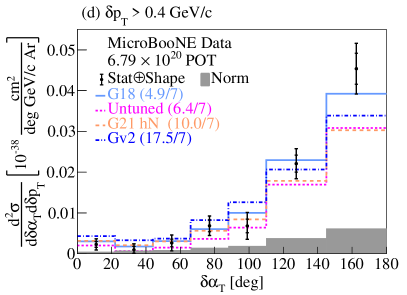
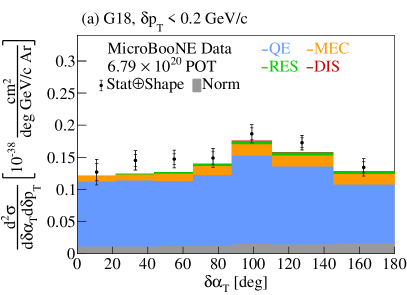
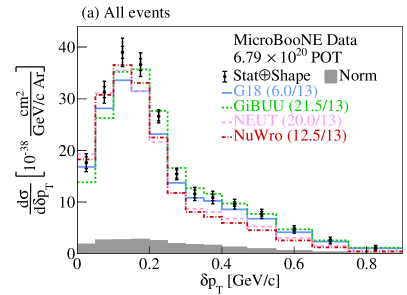
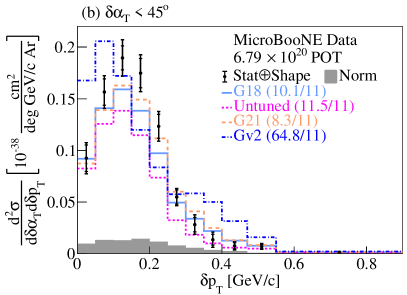
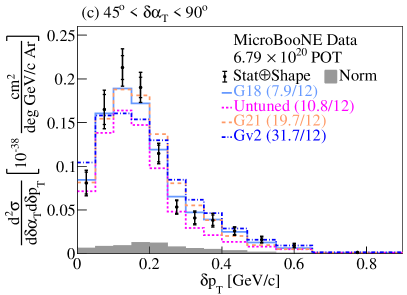
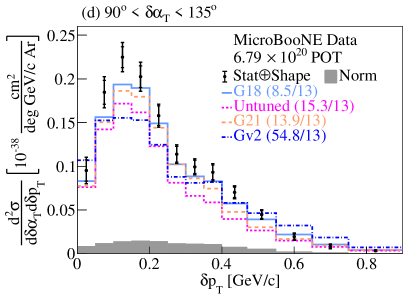
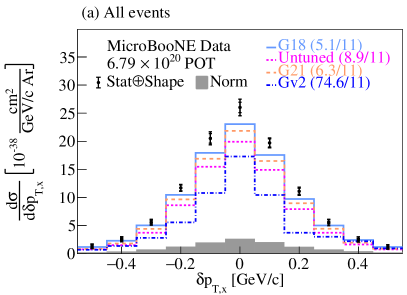
Figures 22 and 23 show the single-differential cross sections as a function of using all the events (panel a), as well as the double-differential results in the same kinematic variable in bins (panels b-d). The single-differential results shown in panel a yield some interesting observations when compared to the relevant T2K and MINERvA results Avanzini et al. (2022); Abe et al. (2018b); Lu et al. (2018). Our distribution illustrates a slightly asymmetric behavior, similar to the one reported by the T2K collaboration at a comparable energy with MicroBooNE. Both the already-published T2K results on carbon and the ones presented in this work on argon mostly demonstrate data-MC agreement within the experimental uncertainties. Therefore, the mass-number dependence of the nuclear effects seems to be reasonably well-modeled. Unlike our result, the measurement by MINERvA reports a more pronounced asymmetry on hydrocarbon. The breakdown plots in Fig. 18 in Ref. Avanzini et al. (2022) show that this behavior is driven by enhanced pion-production rates due to the higher average beam energy. Low values result in a fairly uniform distribution indicative of the absence of FSI effects in that part of the phase-space. On the other hand, higher values result in a highly asymmetric distribution, which is driven by the strength of the FSI interactions. Figure 22 shows the comparisons to a number of available neutrino event generators, where NuWro is the generator with the most conservative FSI strength. Figure 23 shows the same results compared to a number of GENIE configurations, where Gv2 yields the highest /bins result, especially in the lowest region. As shown in Fig. 24, this is driven by the Gv2 QE performance, which results in peaks at the edges of the distribution, unlike the data result. Additionally, Fig. 25 shows the effect of FSI on the CC1p0 selection using the G18 configuration of GENIE that introduces an asymmetric behavior in .

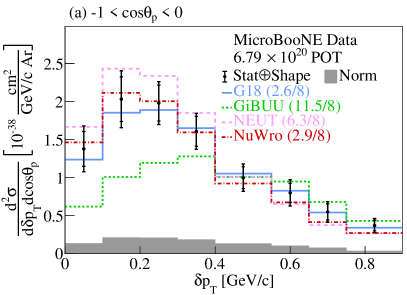
Figures 26 and 27 show the double-differential results as a function of in cos bins. All the bins illustrate an asymmetric distribution, with the exception of the region where cos 1, with the latter implying that this part of phase-space includes events with minimal FSI effects. Figure 26 shows the comparisons to a number of available neutrino event generators with GiBUU giving the best performance. Figure 27 shows the same results compared to a number of GENIE configurations, illustrating that Gv2 is disfavored in the region where cos 0.75.
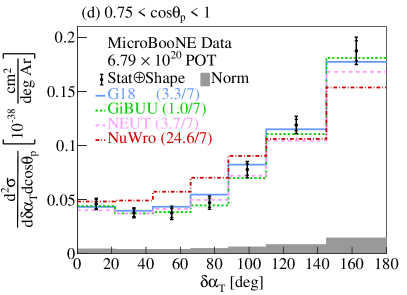
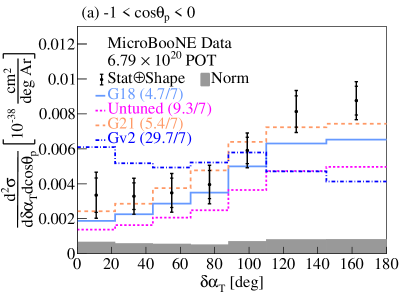
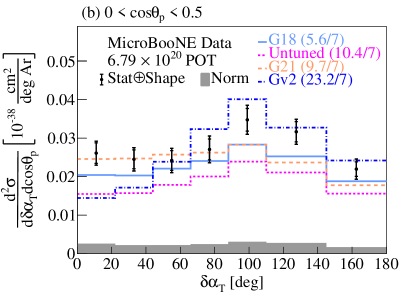

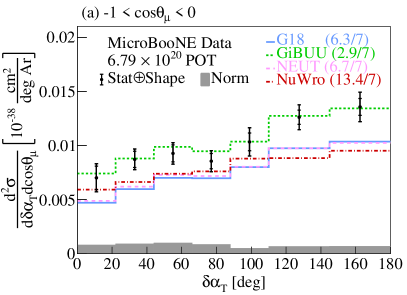
Figures 28 and 29 show the double-differential cross sections as a function of in cos bins. The results in the region with 0 cos 0.75 show a fairly flat distribution. The cross section distributions corresponding to forward and backward proton scattering exhibit an FSI-driven asymmetric behavior. Figure 28 shows the comparisons to a number of available neutrino event generators, where NuWro yields a prediction that is disfavored for forward scattering. Figure 29 shows the same results compared to a number of GENIE configurations, illustrating that Gv2 is disfavored across all cos bins. In the -1 cos 0 region shown in Fig. 29a, all the predictions illustrate a peak close to 180∘ with the exception of Gv2. The driving force for this difference is the Gv2 QE contribution, as can be seen in Fig. 30. This is indicative of potential modeling issues in the Llewellyn Smith QE cross section and of the hA FSI performance used in the Gv2 prediction. Unlike Gv2, the theory-driven GENIE v3 family of predictions (G18, Untuned, and G21) closely follow the data.
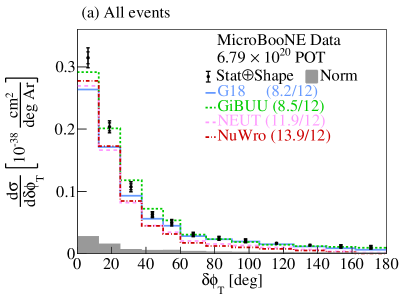
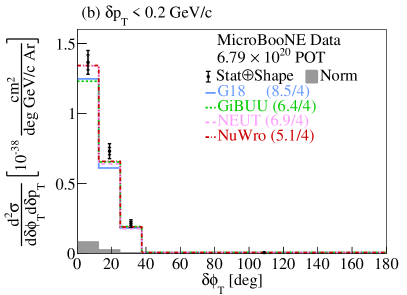
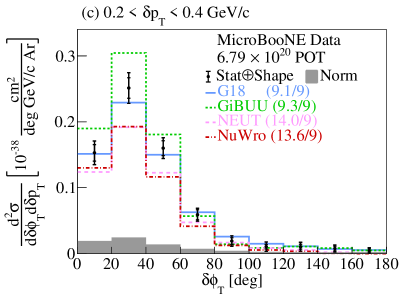
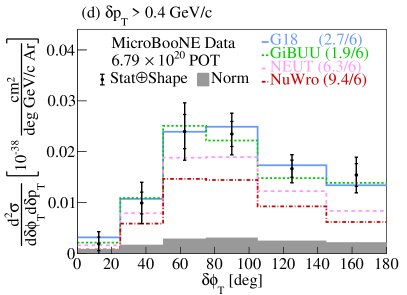
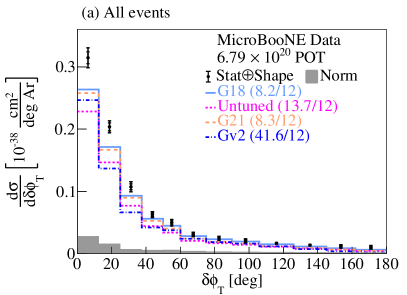
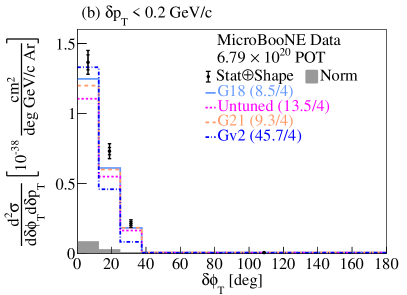
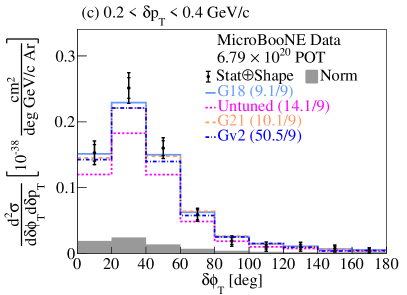
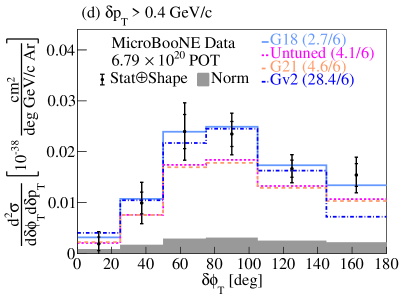
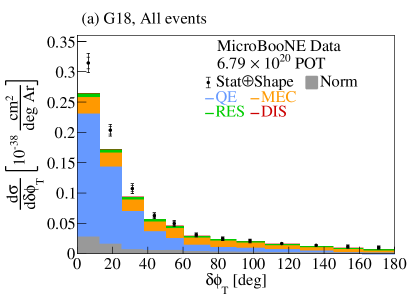
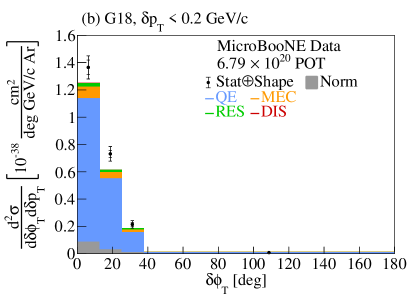
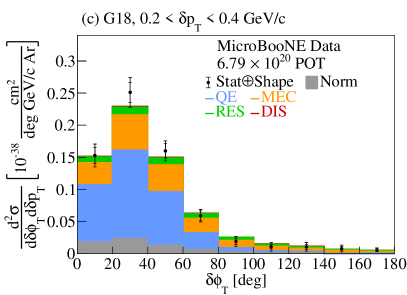
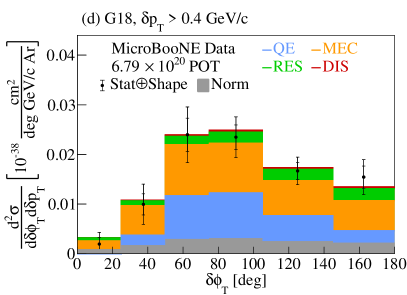
Figures 31 and 32 show the single-differential cross sections as a function of using all the events (panel a), as well as the double-differential results as a function of the same kinematic variable in bins (panels b-d). Figure 31 shows the comparisons to a number of available neutrino event generators, with all the generators illustrating a fairly good performance. This result is consistent with the one reported by the T2K collaboration Avanzini et al. (2022); Abe et al. (2018b). In the lowest region shown in panel b, NuWro is the generator with the best performance. Figure 32 shows the same results compared to a number of GENIE configurations, where Gv2 is disfavored in all regions. At small values the cross section is decreasing and zero above 40∘ which indicates the absence of multi-nucleon and FSI effects. Higher values lead to cross sections that extend up to 180∘. This behavior is primarily driven by multi-body effects with hadrons below the detection threshold that introduce large kinematic imbalances, as can be seen in panels c-d of Fig. 33.
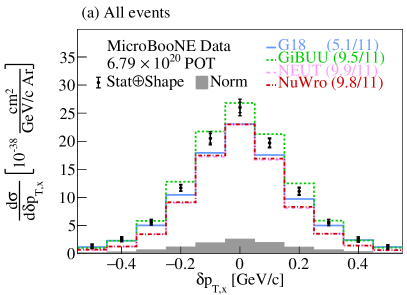
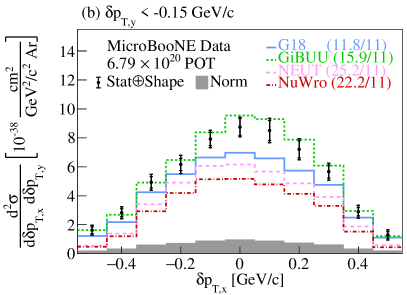
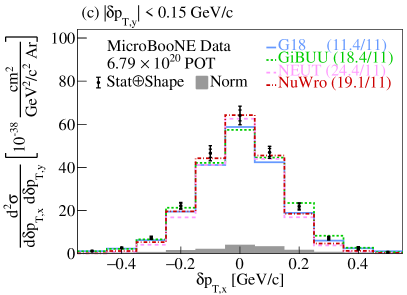
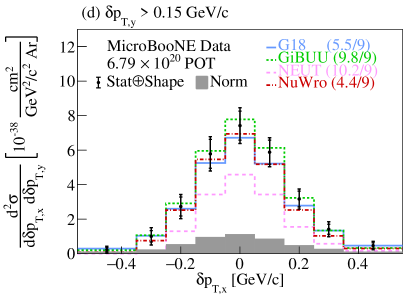
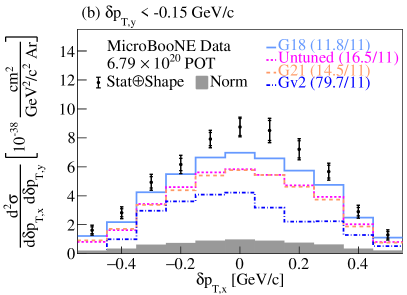
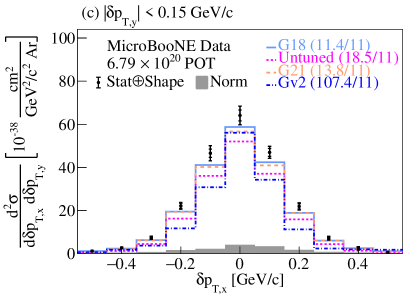
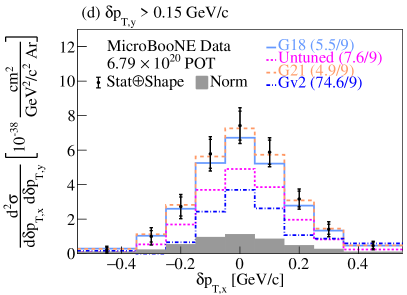
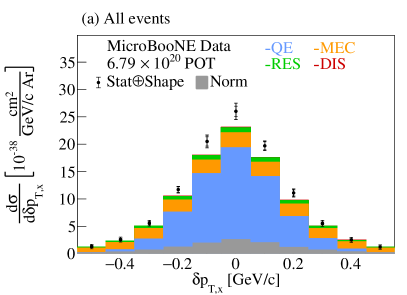
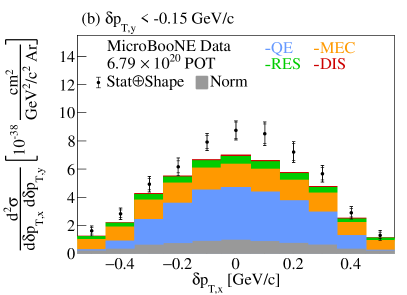
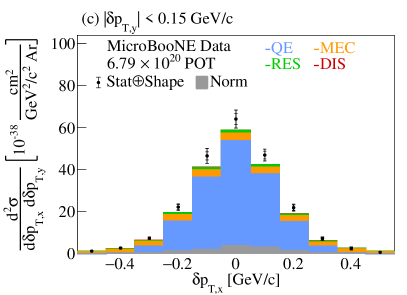
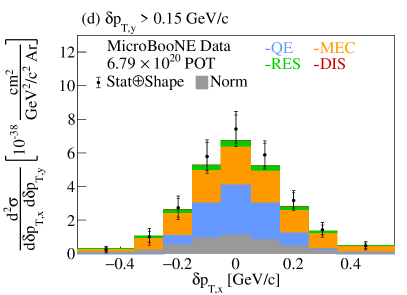
Figures 34 and 35 show the single-differential cross sections as a function of using all the events (panel a), as well as the double-differential results in the same kinematic variable in slices (panels b-c). Figure 34 shows the comparisons to a number of available neutrino event generators. The central region with 0.15 GeV/ is dominated by QE interactions, while the broader distributions with 0.15 GeV/ are mainly driven by MEC events, as can be seen in Fig. 36. In the MEC dominated region of -0.15 GeV/, all the generators, apart from GiBUU, seem to be lacking in terms of the peak strength. GiBUU seems to be overestimating that MEC contribution in the -0.15 GeV/ bin. With the exception of NEUT, all the event generators illustrate a good performance in the 0.15 GeV/ region. Figure 35 shows the same results compared to a number of GENIE configurations, where Gv2 shows the worst performance.
The aforementioned results in kinematic imbalance variables illustrate significant differences across the event generators and configurations used for comparison, especially in the case of the double-differential studies. Yet, the quantity that enters the oscillation probability is the true neutrino energy. Neutrino energy estimators, such as the calorimetric energy defined in Eq. 6, are used as a proxy for the true quantity. The studies reported next present the results as a function of in bins of the kinematic imbalance variables.
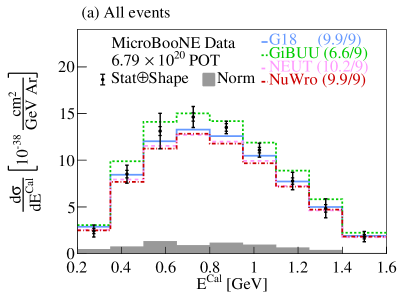
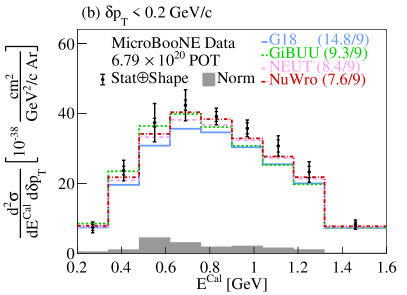
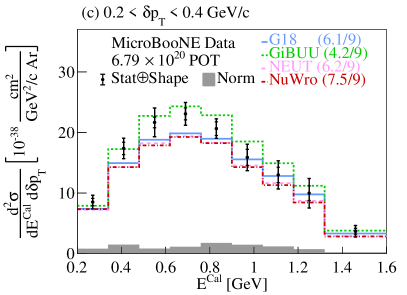
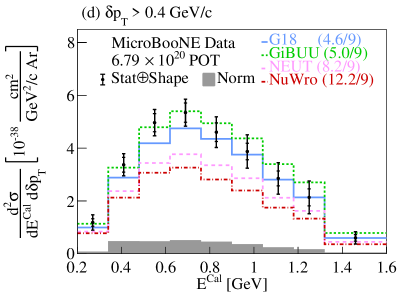

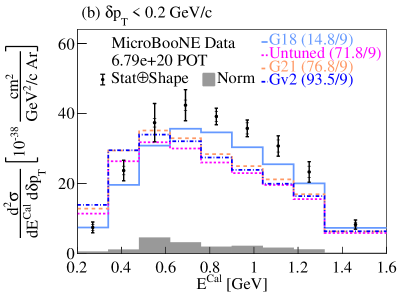
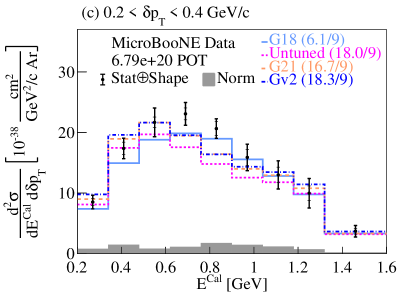
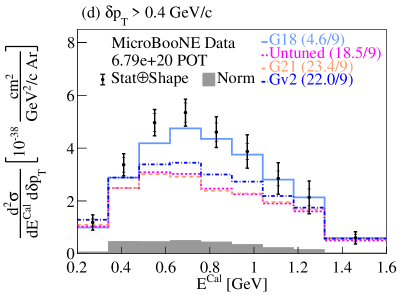
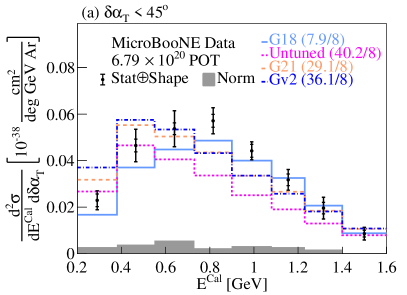
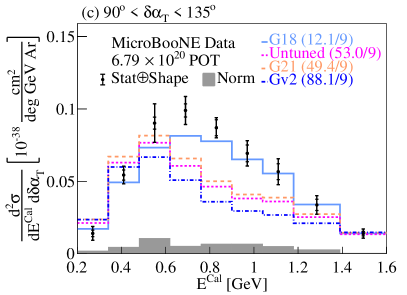
Figures 37 and 38 show the single-differential cross sections as a function of using all the events (panel a), as well as the double-differential results in the same kinematic variable in bins (panels b-d). Figure 37 shows the comparisons to a number of available neutrino event generators, where the distribution covers the same energy spectrum across all bins. All the event generators illustrate an equally good performance in the lowest bin. NEUT and NuWro show a deficit relative to the data in the highest bins. Figure 38 shows the same results compared to a number of GENIE configurations, where G18 illustrates the best performance. In the lowest bin, the different configurations illustrate a shift to the left compared to the data, unlike G18, which drives the significantly higher values. Interestingly, all the alternative GENIE configurations illustrate a plateau in the highest bin that also yields high /bins ratios.
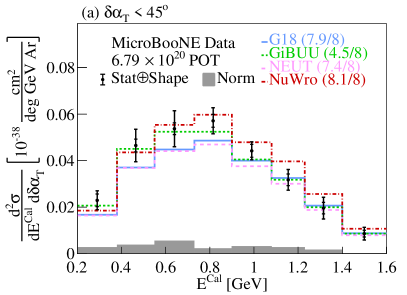
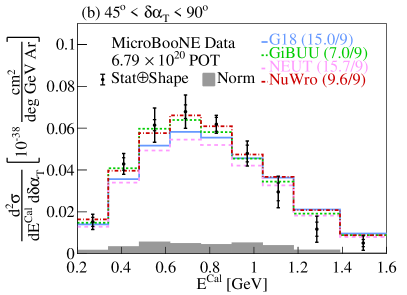
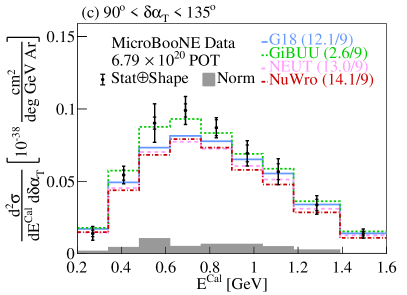
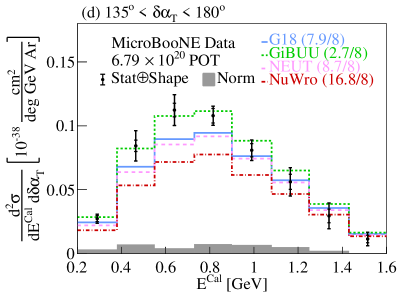

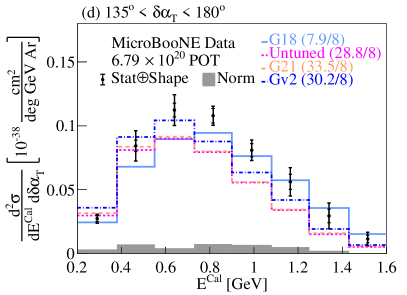
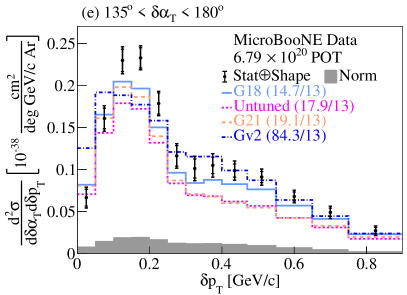
Figures 39 and 40 show the double-differential results as a function of in bins. Figure 39 shows the comparisons to a number of available neutrino event generators. Once again, the distribution covers the same energy spectrum across all of our results and all the event generators show fairly good behavior. NuWro illustrates a mild deficit in the 135∘ 180∘ bin, which is also reflected in the /bins ratio. Figure 40 shows the same results compared to a number of GENIE configurations, where all the GENIE configurations except for G18 illustrate shape and strength differences.
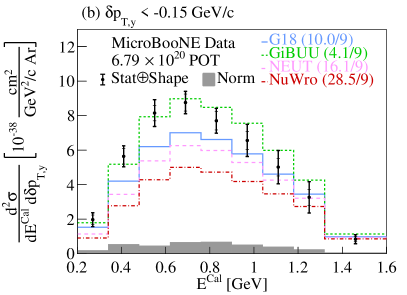
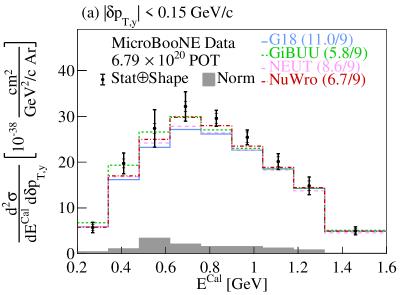
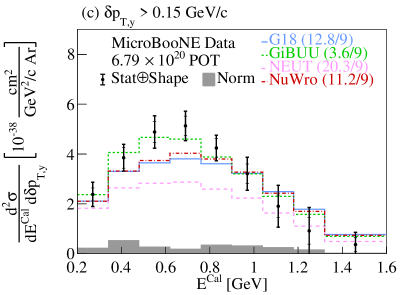
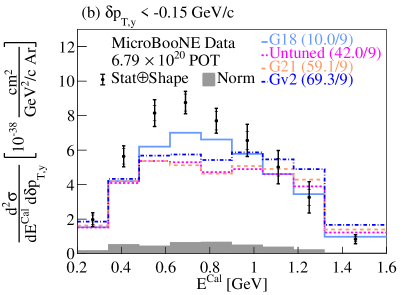
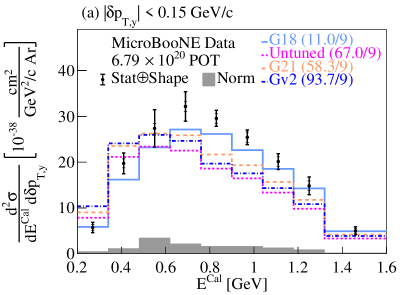
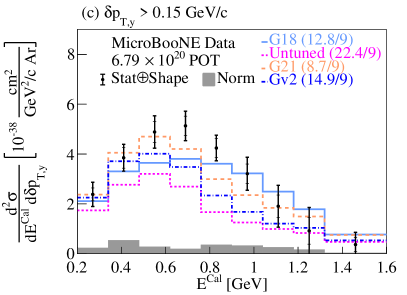
Figures 41 and 42 show the double-differential results as a function of in bins. Figure 41 shows the comparisons to a number of available neutrino event generators. All event generators predict very similar cross sections for -0.15 0.15 GeV/ (panel a). Unlike this central region, the 0.15 GeV/ results yield a wide spread across the generator predictions (panels b-c). Furthermore, apart from GiBUU, all the predictions lack strength in the -0.15 GeV/ bin (panel b). Additionally, NEUT illustrates the same deficit in the 0.15 GeV/ bin (panel c). Figure 42 shows the same results compared to a number of GENIE configurations, where all the GENIE configurations but G18 illustrate a poor performance due to shape and strength issues.
VIII Conclusions
This work reports on measurements of flux-integrated differential cross sections for event topologies with a single muon and a single proton detected in the final state using the Booster Neutrino Beam at Fermi National Accelerator Laboratory and the MicroBooNE detector. The data were studied for the first time in the form of single-differential cross sections in kinematic imbalance variables on argon. Furthermore, the first double-differential cross sections in these variables were reported on the same nucleus. Additionally, novel double-differential cross section measurements of a neutrino energy estimator in bins of these variables were presented. The results were compared to a number of event generators and model configurations. The predictions as a function of the energy estimator across all generators and model configurations remain mostly unchanged regardless of the kinematic variable used for the double-differential measurements. Based on the reported / bins, the good agreement observed across the calorimetric energy distributions suggests that the energy dependence is largely well-modeled across most predictions. Unlike the energy estimator results, we found that the measured kinematic imbalance cross sections in different phase-space regions are sensitive to nuclear effects. The performance of the event generators and configurations varies depending on the observable of interest. Overall, the GENIE v3.0.6 G18_10a_02_11a cross section predictions with the MicroBooNE-specific tuning (G18) fit the data well. On the other hand, the GENIE v2.12.10 (Gv2) cross section predictions are systematically a poor fit to data with significant shape differences across all variables of interest. The GENIE v3.0.6 G18_10a_02_11a configuration without additional tuning (Untuned) shows a systematic deficit of 20% which necessitated the development of the aforementioned tune. The GENIE v3.2.0 G21_11b_00_000 configuration (G21) serves as an example of a theory-driven GENIE configuration that shows good agreement with data in most variables without the need for additional tuning. GiBUU 2021 (GiBUU) shows good agreement with data in most kinematic variables, with the exception of , where a systematic shift to higher values of has been identified. A potential source of this shift is due to the GiBUU MEC modeling. The NuWro v19.02.2 (NuWro) prediction falls bellow the data due to poor FSI modeling and shows significant shape differences in FSI-dominated parts of the phase-space. NEUT v5.4.0 (NEUT) also results in predictions mostly falling below the data points. This mismodeling remains largely unnoticed when combined into the calorimetric energy estimator. Yet, future neutrino oscillation measurements will rely on accurate cross section predictions and a precise mapping between measured and true neutrino energies. Therefore, such mismodeling effects might impact their experimental sensitivity. The reported results both provide precision data to benchmark neutrino-nucleus interaction models and establish phase-space regions where precise reaction modeling is still needed.
IX Acknowledgments
This document was prepared by the MicroBooNE collaboration using the resources of the Fermi National Accelerator Laboratory (Fermilab), a U.S. Department of Energy, Office of Science, HEP User Facility. Fermilab is managed by Fermi Research Alliance, LLC (FRA), acting under Contract No. DE-AC02-07CH11359. This material is based upon work supported by Laboratory Directed Research and Development (LDRD) funding from Argonne National Laboratory, provided by the Director, Office of Science, of the U.S. Department of Energy under Contract No. DE-AC02-06CH11357. MicroBooNE is supported by the following: the U.S. Department of Energy, Office of Science, Offices of High Energy Physics and Nuclear Physics; the U.S. National Science Foundation; the Swiss National Science Foundation; the Science and Technology Facilities Council (STFC), part of the United Kingdom Research and Innovation; the Royal Society (United Kingdom); the UK Research and Innovation (UKRI) Future Leaders Fellowship; and The European Union’s Horizon 2020 Marie Sklodowska-Curie Actions. Additional support for the laser calibration system and cosmic ray tagger was provided by the Albert Einstein Center for Fundamental Physics, Bern, Switzerland. We also acknowledge the contributions of technical and scientific staff to the design, construction, and operation of the MicroBooNE detector as well as the contributions of past collaborators to the development of MicroBooNE analyses, without whom this work would not have been possible. For the purpose of open access, the authors have applied a Creative Commons Attribution (CC BY) license to any Author Accepted Manuscript version arising from this submission.
References
- Tanabashi et al. (2018) M. Tanabashi et al. (Particle Data Group), Phys. Rev. D 98, 030001 (2018).
- Abe et al. (2020) K. Abe et al. (T2K Collaboration), Nature 580, 339 (2020).
- Abi et al. (2018a) B. Abi et al. (DUNE Collaboration), arXiv (2018a), 1807.10334 [physics.ins-det] .
- Abi et al. (2018b) B. Abi et al. (DUNE Collaboration), arXiv (2018b), 1807.10327 [physics.ins-det] .
- Abi et al. (2018c) B. Abi et al. (DUNE Collaboration), arXiv (2018c), 1807.10340 [physics.ins-det] .
- Abe et al. (2018a) K. Abe et al. (Hyper-Kamiokande Collaboration), arXiv (2018a), 1805.04163 [physics.ins-det] .
- Antonello et al. (2015) M. Antonello et al. (MicroBooNE, LAr1-ND, ICARUS-WA104), arXiv (2015), 1503.01520 [physics.ins-det] .
- Tortorici et al. (2018) F. Tortorici, V. Bellini, and C. Sutera (ICARUS Collaboration), J. Phys. Conf. Ser. 1056, 012057 (2018).
- Abi et al. (2018d) B. Abi et al. (DUNE Collaboration), arXiv (2018d), 1807.10334 [physics.ins-det] .
- Abi et al. (2020) B. Abi et al. (DUNE Collaboration), arXiv (2020), 2002.03005 [hep-ex] .
- Dolan et al. (2018) S. Dolan, U. Mosel, K. Gallmeister, L. Pickering, and S. Bolognesi, Phys. Rev. C 98, 045502 (2018).
- Rocco et al. (2016) N. Rocco, A. Lovato, and O. Benhar, Phys. Rev. Lett. 116, 192501 (2016).
- Rocco (2020) N. Rocco, Frontiers in Physics 8, 116 (2020).
- Lu et al. (2016) X.-G. Lu, L. Pickering, S. Dolan, G. Barr, D. Coplowe, Y. Uchida, D. Wark, M. O. Wascko, A. Weber, and T. Yuan, Phys. Rev. C 94, 015503 (2016).
- Abe et al. (2018b) K. Abe et al. (T2K Collaboration), Phys. Rev. D 98, 032003 (2018b).
- Lu et al. (2018) X.-G. Lu et al. (MINERvA Collaboration), Phys. Rev. Lett. 121, 022504 (2018).
- Cai et al. (2020) T. Cai et al. (MINERvA Collaboration), Phys. Rev. D 101, 092001 (2020).
- Bathe-Peters et al. (2022) L. Bathe-Peters, S. Gardiner, and R. Guenette, arXiv (2022), 2201.04664 [hep-ph] .
- Abratenko et al. (2020a) P. Abratenko et al. (MicroBooNE Collaboration), Phys. Rev. Lett. 125, 201803 (2020a).
- Acciarri et al. (2017) R. Acciarri et al. (MicroBooNE Collaboration), J. Instrum. 12, P02017 (2017).
- Aguilar-Arevalo et al. (2009) A. Aguilar-Arevalo et al. (MiniBooNE Collaboration), Phys. Rev. D 79, 072002 (2009).
- Kaleko (2013) D. Kaleko, J. Instrum. 8, C09009 (2013).
- Acciarri et al. (2018) R. Acciarri et al. (MicroBooNE Collaboration), Eur. Phys. J. C 78, 82 (2018).
- PDG (2012) “Table 289: Muons in liquid argon (Ar),” http://pdg.lbl.gov/2012/AtomicNuclearProperties/MUON_ELOSS_TABLES/muonloss_289.pdf (2012).
- H. Bichsel (2005) S. K. H. Bichsel, D. E. Groom, “Passage of particles through matter,” PDG Chapter 27, Figure 27.1 http://pdg.lbl.gov/2005/reviews/passagerpp.pdf (2005).
- Abratenko et al. (2022a) P. Abratenko et al. (MicroBooNE Collaboration), arXiv (2022a), 2211.03734 [hep-ex] .
- Van De Pontseele (2020) W. Van De Pontseele, Search for Electron Neutrino Anomalies with the MicroBooNE Detector, Ph.D. thesis, Oxford U. (2020).
- Abratenko et al. (2022b) P. Abratenko et al. (MicroBooNE Collaboration), Phys. Rev. D 105, 112004 (2022b).
- Abratenko et al. (2021) P. Abratenko et al. (MicroBooNE Collaboration), J. High Energ. Phys. 2021, 153 (2021).
- Berger et al. (2017) M. Berger, J. Coursey, M. Zucker, and J. Chang, “Stopping powers and ranges for protons and alpha particles,” NIST Standard Reference Database 124 (2017).
- Abratenko et al. (2017) P. Abratenko et al. (MicroBooNE Collaboration), J. Instrum. 12, P10010 (2017).
- Adams et al. (2019) C. Adams et al. (MicroBooNE Collaboration), Eur. Phys. J. C 79, 673 (2019).
- Abratenko et al. (2022c) P. Abratenko et al. (MicroBooNE Collaboration), Phys. Rev. Lett. 128, 151801 (2022c).
- Abratenko et al. (2022d) P. Abratenko et al. (MicroBooNE Collaboration), Phys. Rev. D 105, L051102 (2022d).
- Andreopoulos et al. (2010) C. Andreopoulos et al., Nucl. Instrum. Meth. A 614, 87 (2010).
- Andreopoulos et al. (2015) C. Andreopoulos et al., arXiv (2015), 1510.05494 [hep-ph] .
- Abe et al. (2016) K. Abe et al. (T2K Collaboration), Phys. Rev. D 93, 112012 (2016).
- Abratenko et al. (2022e) P. Abratenko et al. (MicroBooNE Collaboration), Phys. Rev. D 105, 072001 (2022e).
- Agostinelli et al. (2003) S. Agostinelli et al. (GEANT4), Nucl. Instrum. Meth. A 506, 250 (2003).
- Pordes and Snider (2016) R. Pordes and E. Snider, PoS ICHEP2016, 182 (2016).
- Snider and Petrillo (2017) E. Snider and G. Petrillo, J. Phys. Conf. Ser. 898, 042057 (2017).
- Bodek and Cai (2019) A. Bodek and T. Cai, Eur. Phys. J. C 79, 293 (2019).
- Tang et al. (2017) W. Tang, X. Li, X. Qian, H. Wei, and C. Zhang, J. Instrum. 12, P10002–P10002 (2017).
- Aguilar-Arevalo et al. (2013) A. Aguilar-Arevalo et al. (MiniBooNE Collaboration), Phys. Rev. D 88 (2013), 10.1103/PhysRevD.88.032001.
- Calcutt et al. (2021) J. Calcutt, C. Thorpe, K. Mahn, and L. Fields, J. Instrum. 16, P08042 (2021).
- Roe (2007) B. Roe, Nucl. Instrum. Meth. A 570, 159 (2007).
- Golan et al. (2012) T. Golan, J. Sobczyk, and J. Żmuda, Nucl. Phys. B Proc. Suppl. 229-232, 499 (2012), Neutrino 2010.
- Abratenko et al. (2022f) P. Abratenko et al. (MicroBooNE Collaboration), Eur. Phys. J. C 82, 454 (2022f).
- Mahn (2009) K. Mahn, A search for muon neutrino and antineutrino disappearance in the Booster Neutrino Beam, Ph.D. thesis, Columbia University (2009).
- Carrasco and Oset (1992) R. Carrasco and E. Oset, Nucl. Phys. A 536, 445 (1992).
- Nieves et al. (2012) J. Nieves, F. Sanchez, I. Ruiz Simo, and M. Vicente Vacas, Phys. Rev. D 85, 113008 (2012).
- Engel (1998) J. Engel, Phys. Rev. C 57, 2004 (1998).
- Nieves et al. (2004) J. Nieves, J. E. Amaro, and M. Valverde, Phys. Rev. C 70, 055503 (2004).
- Schwehr et al. (2016) J. Schwehr, D. Cherdack, and R. Gran, arXiv (2016), 1601.02038 [hep-ph] .
- Nowak (2009) J. A. Nowak (MiniBooNE Collaboration), AIP Conf. Proc. 1189, 243 (2009).
- Kuzmin et al. (2004) K. Kuzmin, V. Lyubushkin, and V. Naumov, Phys. Part. Nucl. 35, S133 (2004).
- Berger and Sehgal (2007) C. Berger and L. Sehgal, Phys. Rev. D 76, 113004 (2007).
- Graczyk and Sobczyk (2008) K. M. Graczyk and J. T. Sobczyk, Phys. Rev. D 77, 053001 (2008), [Erratum: Phys.Rev.D 79, 079903 (2009)].
- Berger and Sehgal (2009) C. Berger and L. Sehgal, Phys. Rev. D 79, 053003 (2009).
- Ashery et al. (1981) D. Ashery, I. Navon, G. Azuelos, H. Walter, H. Pfeiffer, and F. Schleputz, Phys. Rev. C 23, 2173 (1981).
- Mosel (2019) U. Mosel, Phys. Rev. G 46, 113001 (2019).
- Leitner et al. (2006) T. Leitner, L. Alvarez-Ruso, and U. Mosel, Phys. Rev. C 73, 065502 (2006).
- Sjostrand et al. (2006) T. Sjostrand, S. Mrenna, and P. Z. Skands, J. High Energ. Phys. 05, 026 (2006).
- Llewellyn Smith (1972) C. Llewellyn Smith, Phys. Rept. 3, 261 (1972).
- Nieves et al. (2011) J. Nieves, I. R. Simo, and M. J. V. Vacas, Phys. Rev. C 83, 045501 (2011).
- Katori (2015) T. Katori, AIP Conf. Proc. 1663, 030001 (2015).
- Rein and Sehgal (1981) D. Rein and L. Sehgal, Annals Phys. 133, 79 (1981).
- Mashnik et al. (2006) S. Mashnik, A. Sierk, K. Gudima, and M. Baznat, J. Phys. Conf. Ser. 41, 340 (2006).
- Dolan et al. (2020) S. Dolan, G. D. Megias, and S. Bolognesi, Phys. Rev. D 101, 033003 (2020).
- Dytman et al. (2021) S. Dytman, Y. Hayato, R. Raboanary, J. T. Sobczyk, J. Tena-Vidal, and N. Vololoniaina, Phys. Rev. D 104, 053006 (2021).
- Abratenko et al. (2019) P. Abratenko et al. (MicroBooNE Collaboration), Phys. Rev. Lett. 123, 131801 (2019).
- Abratenko et al. (2020b) P. Abratenko et al. (MicroBooNE Collaboration), Phys. Rev. D 102, 112013 (2020b).
- Avanzini et al. (2022) M. B. Avanzini et al., Phys. Rev. D 105, 092004 (2022).