The Gaia view of the Cepheus OB2 association
Abstract
OB associations, birthplaces of the most luminous stars, are key objects for understanding the formation of high-mass stars and their effects on their environments. The aim of this work is to explore the structure and kinematics of the Cepheus OB2 association and characterize the history of star formation in the region – in particular, the role of the Cepheus Bubble, surrounding Cepheus OB2. Based on Gaia DR3 data we study the spatial and age distribution and kinematics of young stars in the region. We select candidate pre-main-sequence stars in the vs. GBPGRP colour–magnitude diagram, and using a clustering algorithm, we identify 13 stellar groups belonging to Cep OB2. Four groups, consisting of 10–13 Myr old low- and intermediate-mass stars, are located in the interior of the bubble, and are part of the oldest subsystem of the association Cep OB2a. Younger groups are found on the periphery. The tangential velocities suggest that some groups on the periphery were born in an expanding system of star-forming clouds, whereas others have been formed due to the collision of their parent cloud with the expanding bubble.
keywords:
stars: pre-main-sequence – stars: formation – ISM: clouds – ISM: individual objects : Cepheus Bubble – The Galaxy: open clusters and associations: individual: Cepheus OB21 Introduction
OB associations are unbound, dispersing groups of young, high luminosity stars, birthplaces of the high-mass stars of our Galaxy (Blaauw, 1964; de Zeeuw et al., 1999; Wright, 2020). High-mass stars have a strong impact on the structure, physics and chemistry of the interstellar medium, thus their astrophysical importance is enormous. Studying the properties of associations is important for understanding their formation and evolution. Dimensions of OB associations are 10–100 parsecs, and star formation in them may proceed for tens of million years. Most of them consist of substructures of different ages, including clusters of higher densities. Substructures of different ages are spatially and kinematically separated. Several associations are surrounded by supershells, created by the interaction of expanding ionization fronts, stellar winds, and supernova explosions of short-lived, high-mass stars with the surrounding interstellar medium (e.g. Bruhweiler et al., 1980). Due to their 100–1000 pc dimensions supershells are able to propagate star formation across the interstellar medium on very large scales (McCray & Kafatos, 1987).
The new astrometric and photometric data from the Gaia space telescope (Gaia Collaboration et al., 2016) can answer several long-standing questions related to the structure, origin, and evolution of OB associations. These questions include the expansion of associations and propagating star formation. The low space density of stars in association ( M☉ pc-3) could reasonably be explained by the expansion of originally dense, compact systems. Gaia data have shown that not all of the observed structure can be explained by expansion (e. g. Wright et al., 2016; Wright & Mamajek, 2018; Kounkel & Covey, 2019). Melnik & Dambis (2020) found expansion in five of the 28 examined associations. Kinematic studies by Lim et al. (2019); Lim et al. (2021, 2022) suggest that the formation of OB associations may result from structure formation driven by supersonic turbulence, rather than from the dynamical evolution of individual embedded clusters. The observed age differences of substructures can be explained by star formation in the gas compressed by the expanding ionization front and stellar wind bubble or supernova shock.
Supershells may trigger star formation via several mechanisms: the expanding shock front may compress pre-existing clouds, or accumulate the ambient, low-density gas into a thin, dense layer, or may collide with ambient molecular clouds and with other bubbles (Ehlerová & Palouš, 2002). These different mechanisms may result in new stellar populations which differ from each other in structure, velocity compared to the energy source, and star-forming time scales. Supershells, associated with nearby OB associations give an opportunity to study in detail various scenarios of propagating star formation. Precise parallaxes and proper motions, available in the Gaia data, allow us to study the spatial and kinematic substructures of OB associations, and explore the role of various types of triggered star formation.
The subject of the present work is the Cepheus OB2 association, discovered by Ambartsumian (1949). The luminous stars defining the association occupy an area of some around the Galactic position (Kun, Kiss & Balog, 2008). At a mean distance of 900 pc (Contreras et al., 2002) this angular size corresponds to a diameter of some 150 pc. Simonson (1968) identified 74 members of Cep OB2 based on spectroscopy and UBV photometry. Further members were identified based on HIPPARCOS data (de Zeeuw et al., 1999). Binary frequency among the high-mass stars of Cep OB2 was examined by Peter et al. (2012). They established that the multiplicity of massive ( M☉) stars seems to be significantly higher than that of intermediate-mass stars. Two open clusters, the 4 Myr old Trumpler 37, embedded in the H ii region IC 1396, and the Myr old NGC 7160 are the historical subsystems of Cep OB2 (Sicilia-Aguilar et al., 2005, 2006). Trumpler 37 itself is composed of several subgroups of different ages and structure, indicative of star formation triggered by interactions of the central O-type star HD 206267 with ambient clumps of molecular gas (e.g. Sicilia-Aguilar et al., 2015).
Cep OB2 is associated with the Cepheus Bubble, a supershell of some 10° in angular diameter. It was identified in the IRAS 60 and 100 µm images by Kun, Balázs & Tóth (1987). Ábrahám, Balázs & Kun (2000) studied the structure and kinematics of the bubble based on the data of the Leiden/Dwingeloo neutral hydrogen survey. The H i data revealed the expansion of the bubble. Observations of the region in the 2.6-mm CO line by Patel et al. (1998) revealed an expanding shell of some 120 pc in diameter, and containing M☉ gas. The morphology and kinematics suggested that the bubble was created by the stellar winds of the first generation of high-mass stars of Cep OB2a during their lifetime of 8–10 Myr, and accelerated by a supernova explosion Myr ago. The star-forming regions along the periphery of the bubble, such as Sh 2-129, IC 1396, Sh 2-140, L1188, were probably formed a few million years after the first generation, by the fragmentation and collapse of the gas, compressed by the expanding stellar wind bubble. The molecular clouds associated with the bubble are birthplaces of the third generation of Cep OB2 (see Szegedi-Elek et al., 2019).
We study the Gaia DR3 (Gaia Collaboration et al., 2022) data of the stars in the area of the Cepheus OB2 and the Cepheus Bubble. Our goal is to validate and extend the membership list of Cep OB2, separate stellar populations of various ages and velocities, establish their relation to the expanding bubble, and find conclusions on the large-scale structure of Cep OB2 and on the history of star formation. We define our initial data set and the method of cluster selection in Sect. 2. The tools applied to characterize the clusters are described in Sect. 3. Our results are described in Sect. 4, discussed in Sect. 5, and briefly summarized in Sect. 6.
2 Cep OB2 membership based on Gaia
2.1 High-mass members of Cep OB2
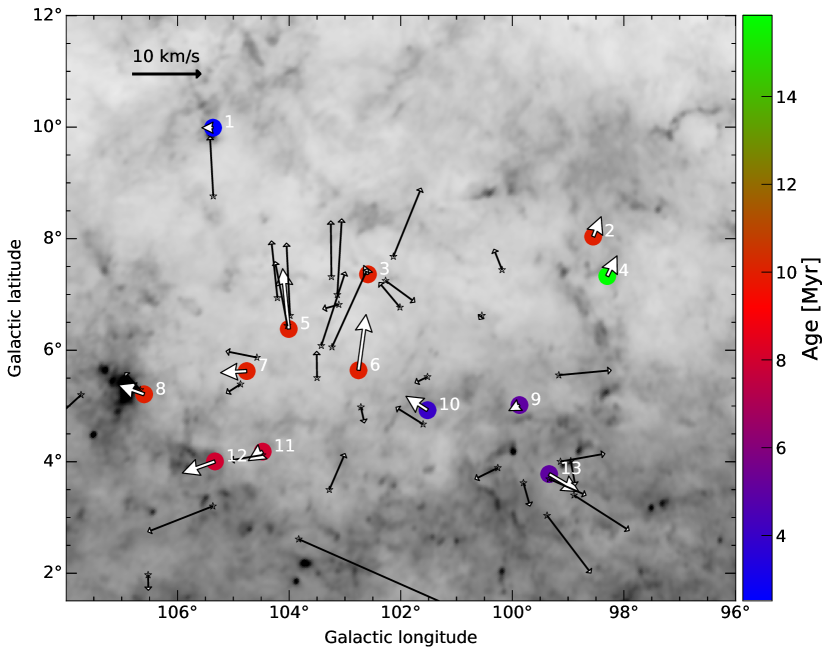
Formation mechanism and environment of high-mass stars above 10 M☉ may differ from those of the lower mass stars (e.g. Tan et al., 2014). The lists of luminous members of Cep OB2, published by Simonson (1968), Blaha & Humphreys (1989), and de Zeeuw et al. (1999) contain 90 stars above 10 M☉. In order to compare the distribution and kinematics of high- and low-mass stars we compiled our list of massive stars from these (overlapping) tables, and searched for their Gaia DR3 counterparts within 1″. In Gaia DR3, 52 historical members, supergiants and main-sequence stars earlier than B3 have distances between 800 and 1000 pc. Out of the 52, 8 stars have RUWE 1.4, indicating some issue with their astrometry, which could be caused by binarity (Lindegren, 2018). Most of them are indeed known binary or multiple systems (e.g. BD+62°2078, HD 204827, HD 209744, HD 239743, Fabricius et al., 2002; Peter et al., 2012). Surface distribution and tangential velocities of these high-mass stars are displayed in Fig. 1, and listed in Table 1. Several historical high-mass association members appear foreground (HD 239712, HD 199661) or background (HD 235618, HD 239758, HIP 109603, BD+53°2387, HD 235783, HD 235795, HD 235813, HD 240010, BD+57°2615, BD+53°2784, Cep, HD 239978, HIP 111972) stars in Gaia DR3.
| Name | Spectral type | Gaia DR3 source_id | Distance | Memb | |||||
|---|---|---|---|---|---|---|---|---|---|
| (pc) | (mas y-1) | (km s-1) | |||||||
| HD 198895 | B1Ve | 2183107416725856640 | 1 | 7 | |||||
| HD 199308 | B1.5V | 2189911847512999168 | 1 | 6 | |||||
| HD 200857 | B3III | 2188891844319403648 | 1 | 6 | |||||
| HD 204150 | B2III | 2191963398772774144 | 1;3 | 7 | |||||
| HD 205139 | B1Ib | 2191787957952122752 | 1;3 | 6 | |||||
2.2 Members defined by distances and tangential velocities
2.2.1 Gaia sample
We selected all sources from Gaia DR3 database with:
-
1.
,
-
2.
,
-
3.
,
-
4.
,
-
5.
,
-
6.
,
-
7.
,
where and are the galactic longitude and latitude, is the distance from Bailer-Jones et al. (2021), , , and , , are the parallax, proper motion in right ascension and declination and their uncertainities, respectively.
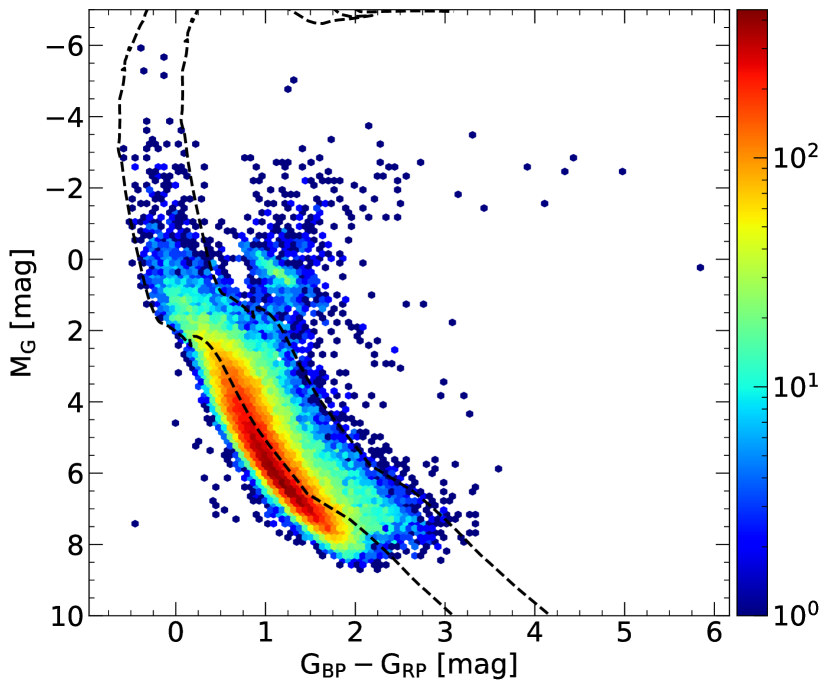
We selected the pre-main-sequence stars from the Gaia sample using their vs. GBPGRP colour-magnitude diagram, corrected for interstellar extinction (Fig. 2). We corrected the Gaia colour indices and magnitudes of each star using the Python implementation111https://github.com/edober/dust_maps_3d of the 3D dust maps STILISM (Lallement et al., 2018). STILISM gives the E(B-V) colour excess as a function of galactic coordinates and distance. We transformed the extinction into the Gaia bands with the coefficients in table 3. of Wang & Chen (2019), assuming .
Following the method described in Zari et al. (2019) we have used the 10-Myr isochrone from PARSEC (Bressan et al., 2012) to define an area in the de-reddened vs. GBPGRP colour–magnitude diagram, occupied by young stellar objects (YSOs). Figure 2 suggests that the stellar sample between the dashed lines is contaminated with main-sequence stars, located in the 800–1000 pc distance interval but not related to the association. To tighten the selection we searched for spatially and kinematically coherent groups in the sample selected from the colour–magnitude diagram.
2.2.2 Search for clusters
We used the Python-implemented package of Hierarchical Density-Based Spatial Clustering of Applications with Noise (HDBSCAN) clustering algorithm (McInnes et al., 2017) to find overdensities in our sample obtained in Sect. 2.2.1. An advantage of this clustering algorithm over other methods is that HDBSCAN can identify groups with various densities and arbitrary shapes. Main parameters of HDBSCAN are , and . defines the minimal number of data points a cluster must hold at least, while the defines how conservative a clustering is: the bigger the is, the more points are considered as noise. At default, uses the Excess of Mass (EOM) approach to select one or two large and several smaller clusters. For more homogeneous, smaller clusters, we can use the Leaf method. For a detailed description of the algorithm, see the website222https://hdbscan.readthedocs.io/en/latest/index.html of the package.
There are multiple ways for detecting stellar clusters in the Gaia data: some used ICRS coordinates, parallaxes and proper motions (e.g. Kounkel & Covey, 2019), some used heliocentric XYZ coordinates and tangential velocities multiplied by a constant (e.g. Kerr et al., 2021). Using the distance of 900 pc from Contreras et al. (2002) we transformed the Galactic coordinates and of the stars into 2D cartesian coordinates compared to the centre of the studied field. We also calculated the and Galactic tangential velocity components compared to the Local Standard of Rest (LSR) using the values from Schönrich et al. (2010). The fifth dimension is the distance. Due to the different units we standardized the data in each dimension by subtracting the mean and dividing with the largest standard deviation of the dimensions that share the same unit, which are the distance and respectively. We adopted and with the Leaf method.
3 Characterization of the groups
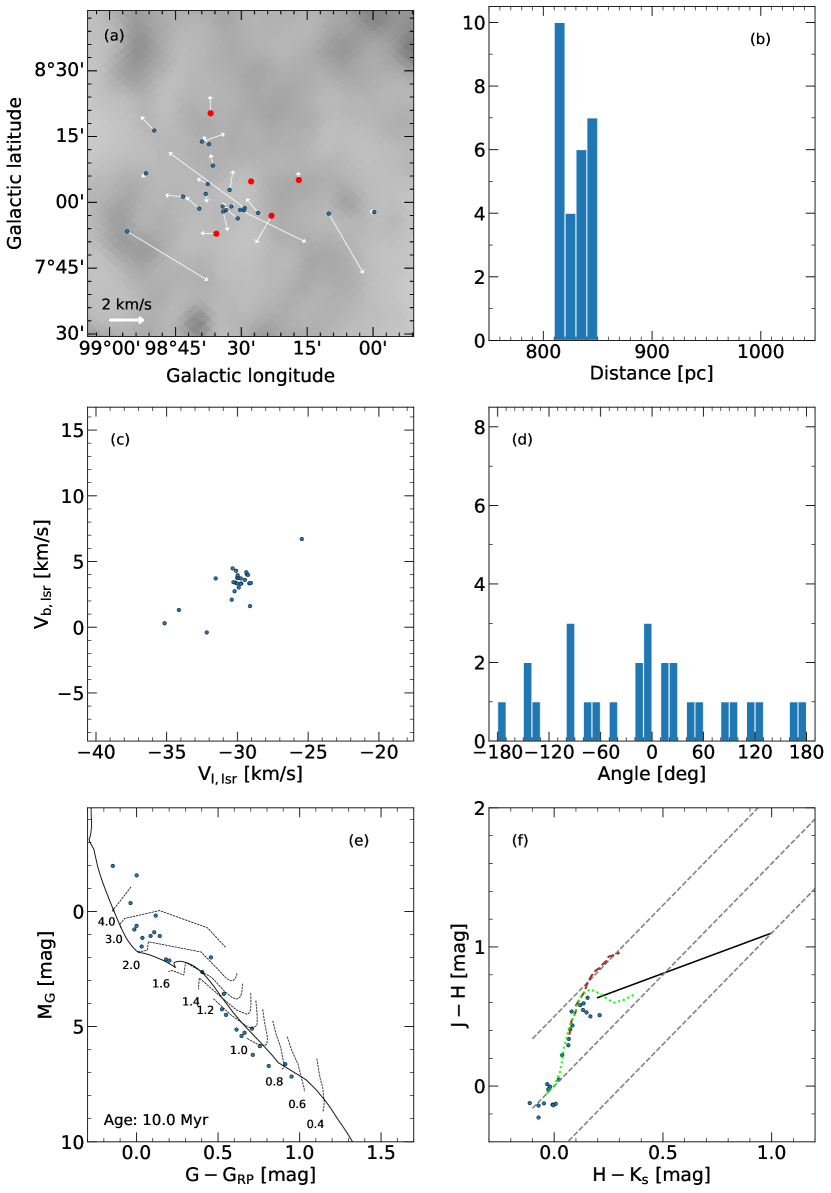
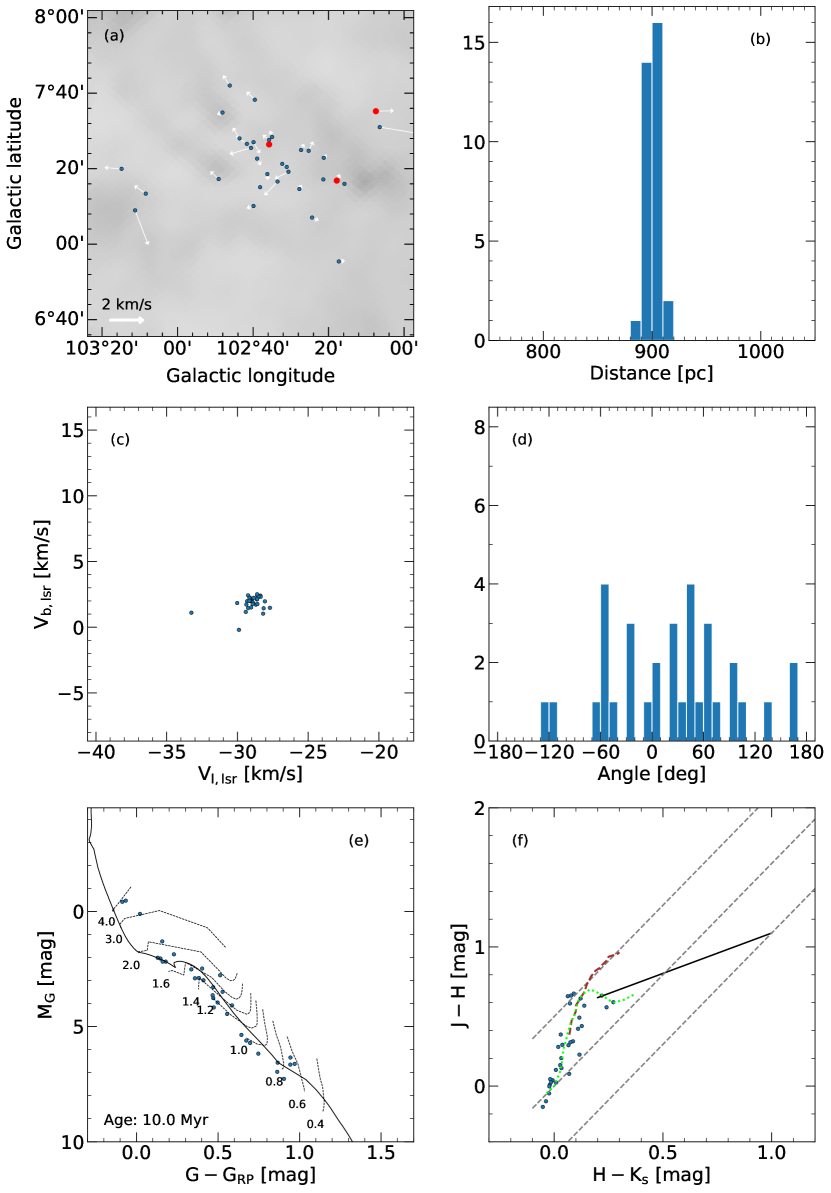
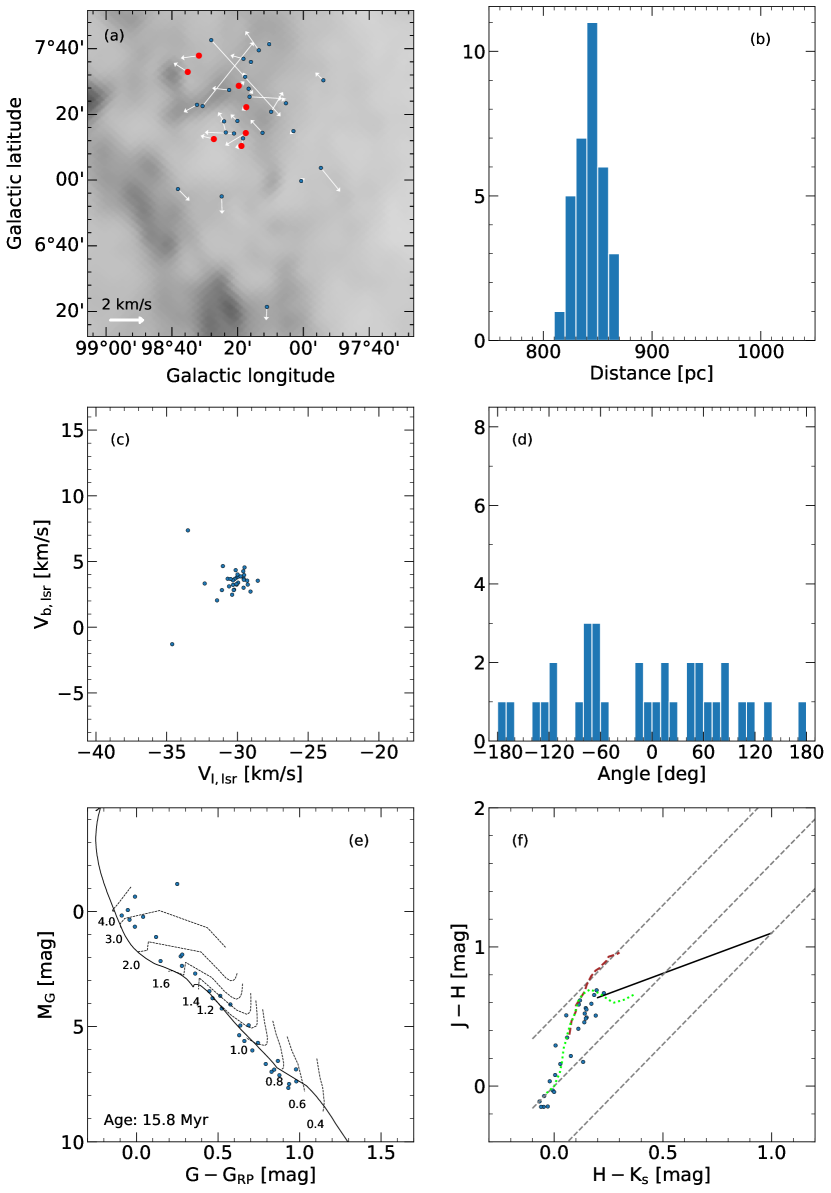
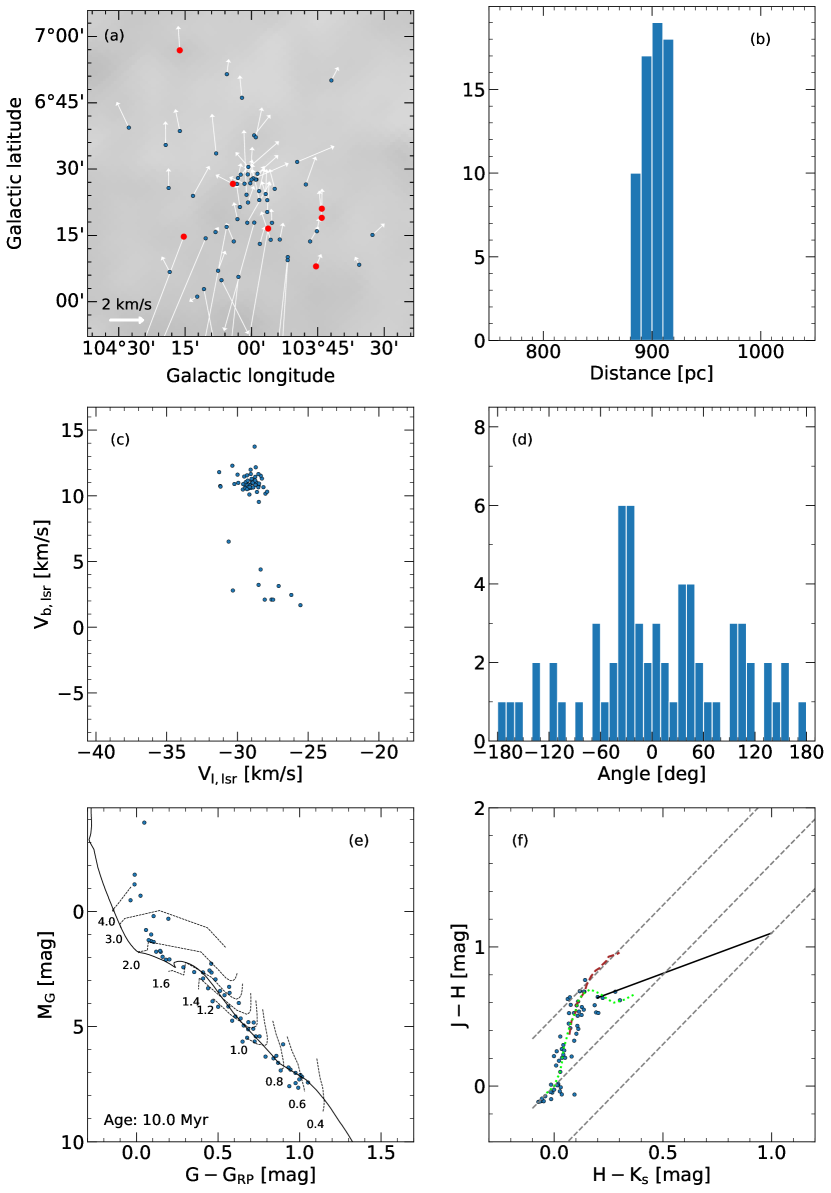
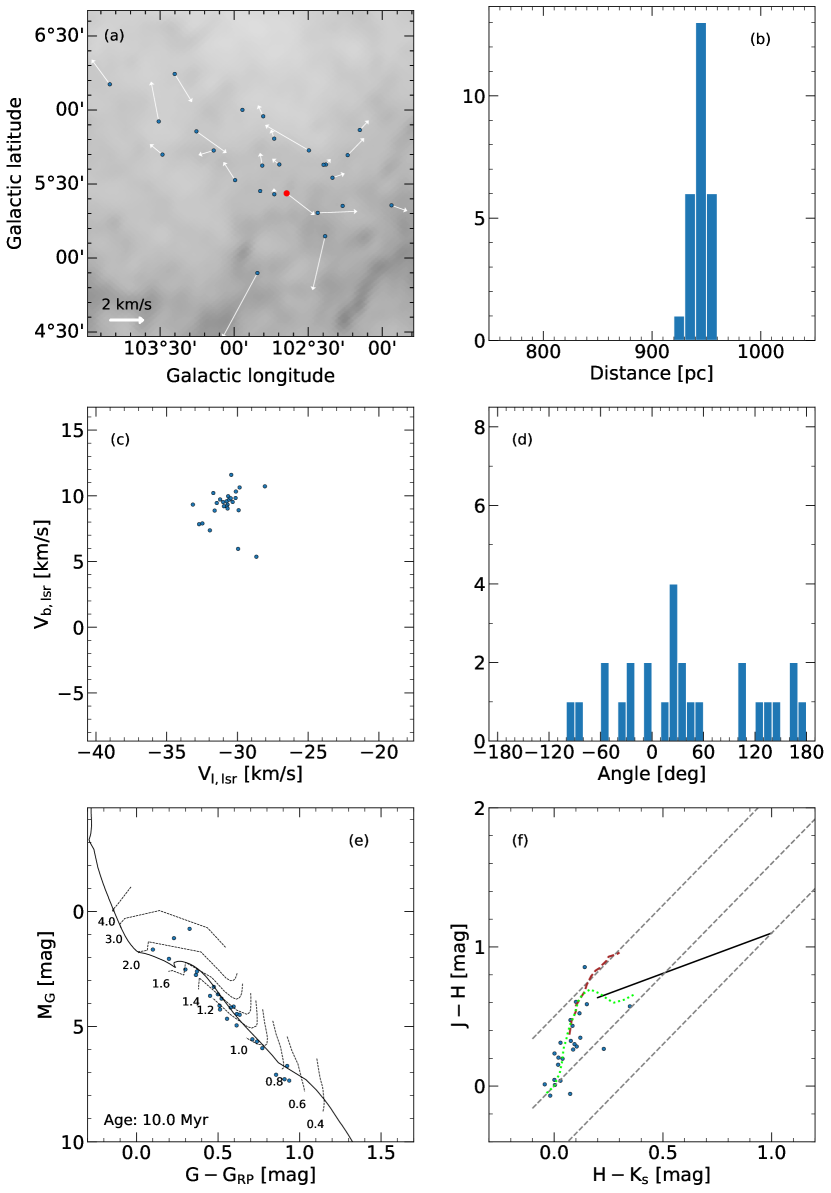
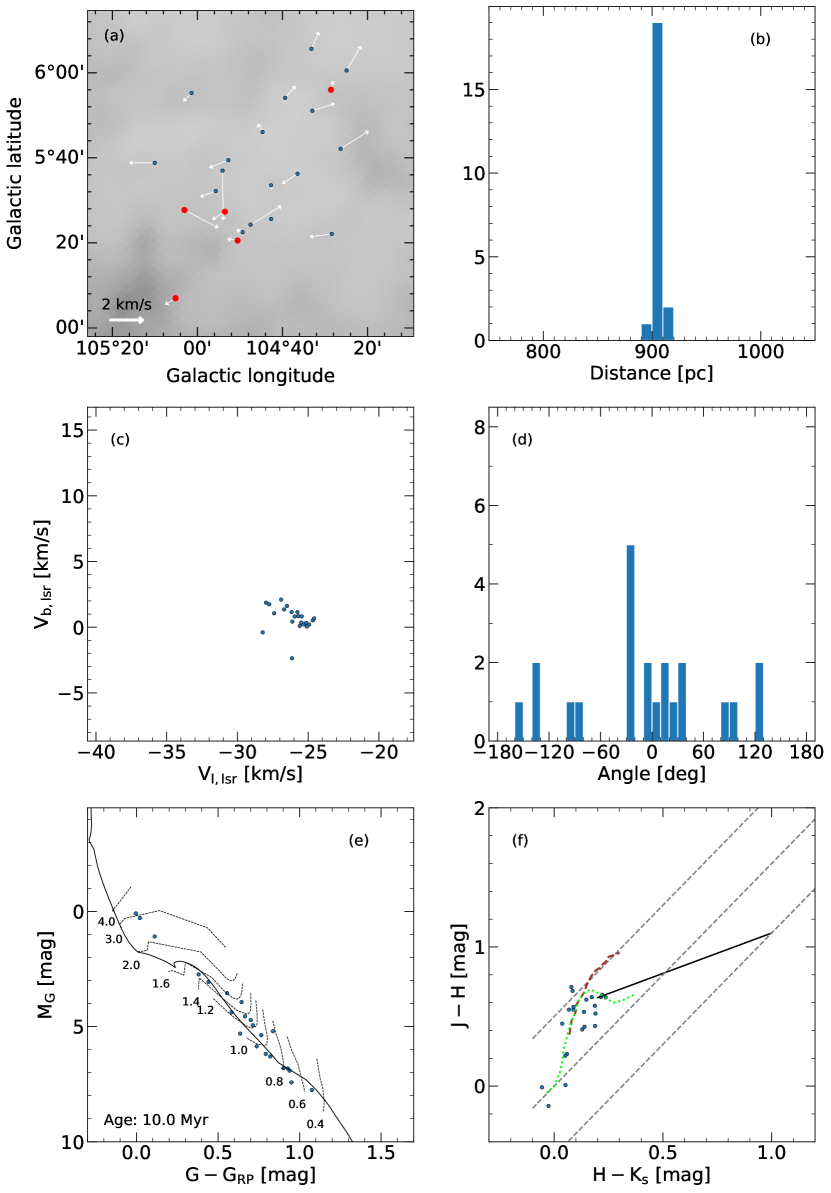
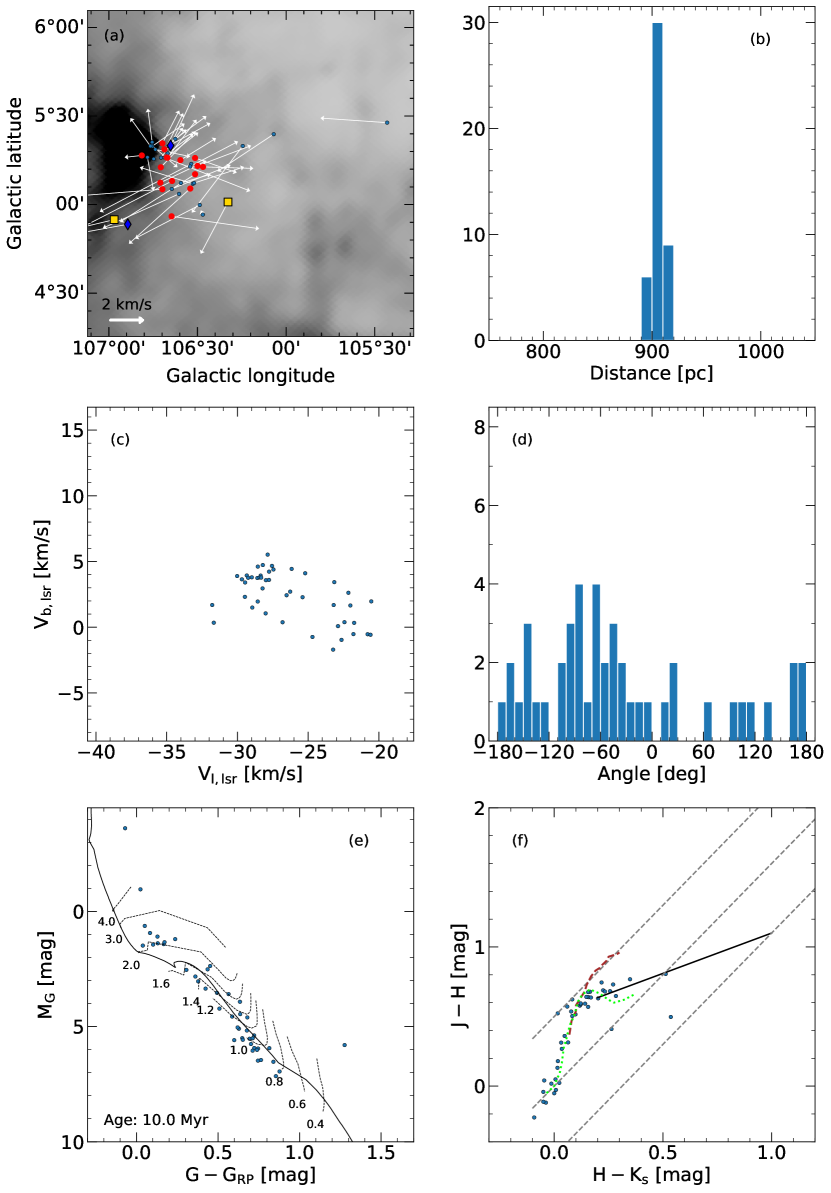
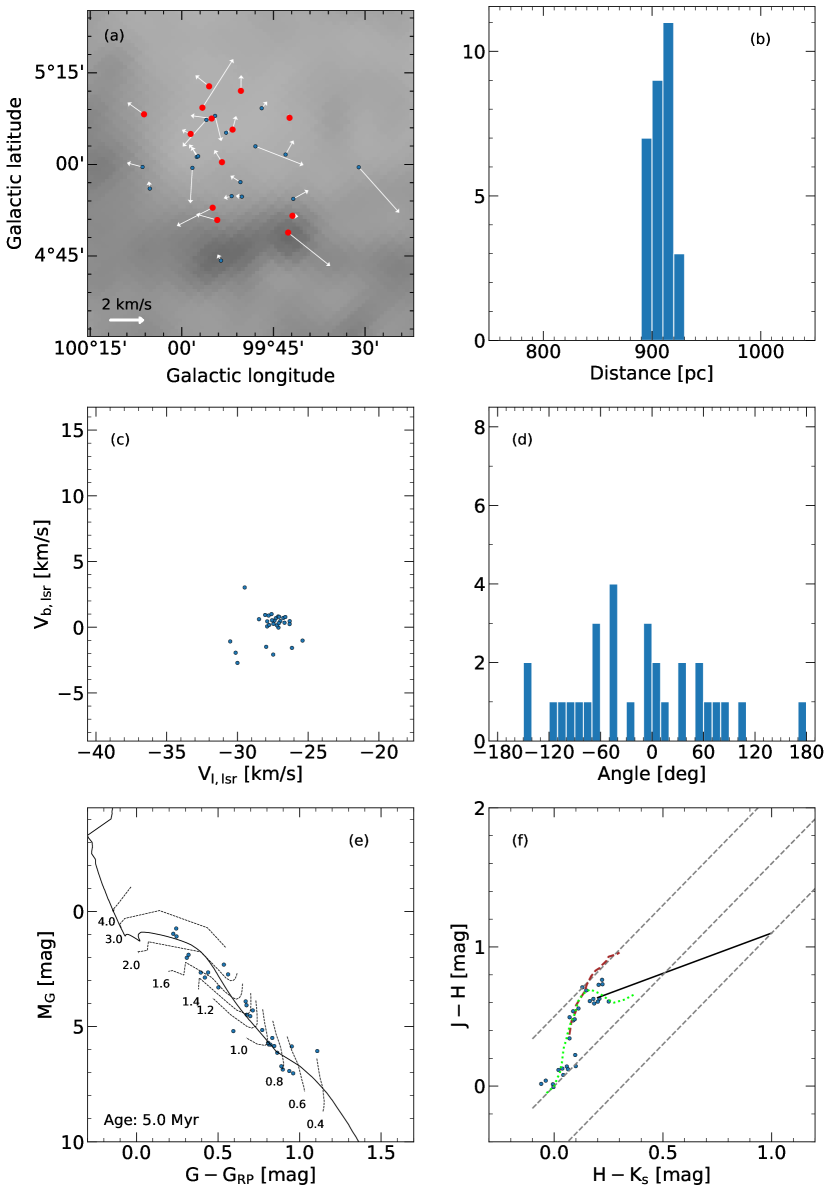
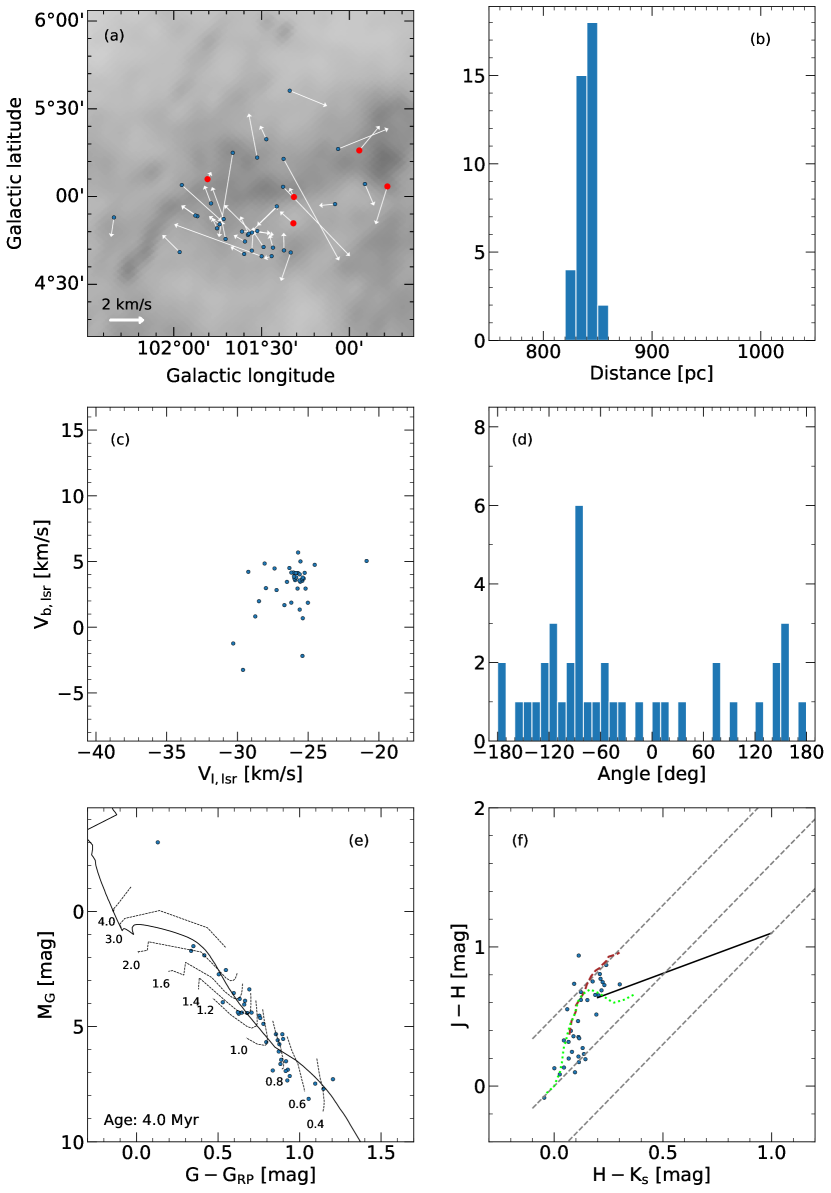
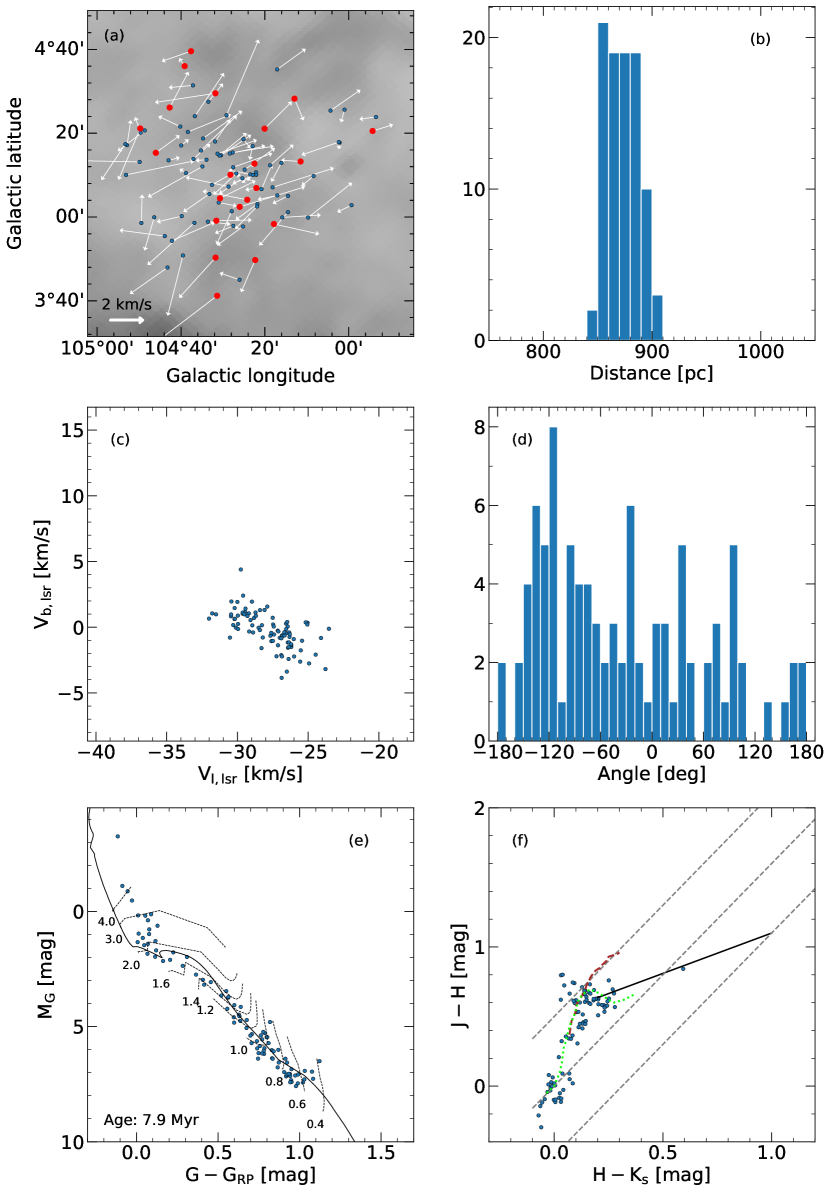
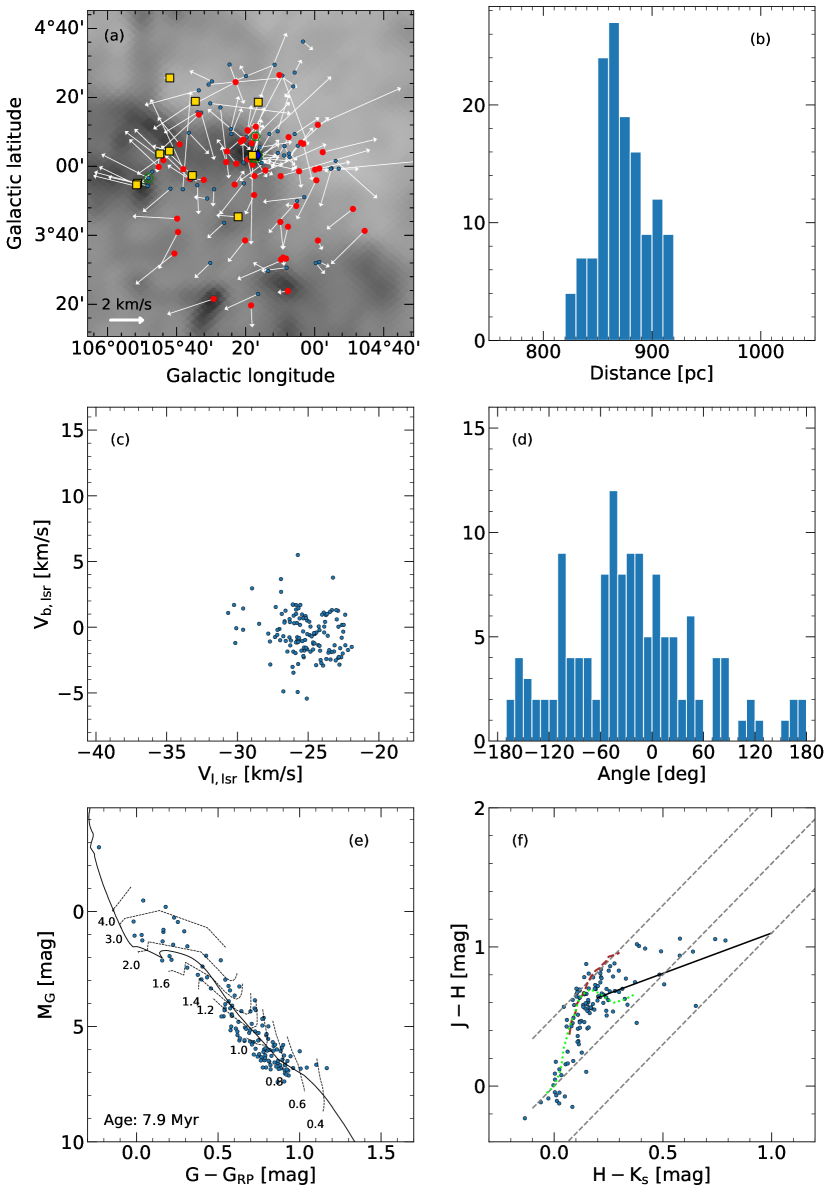
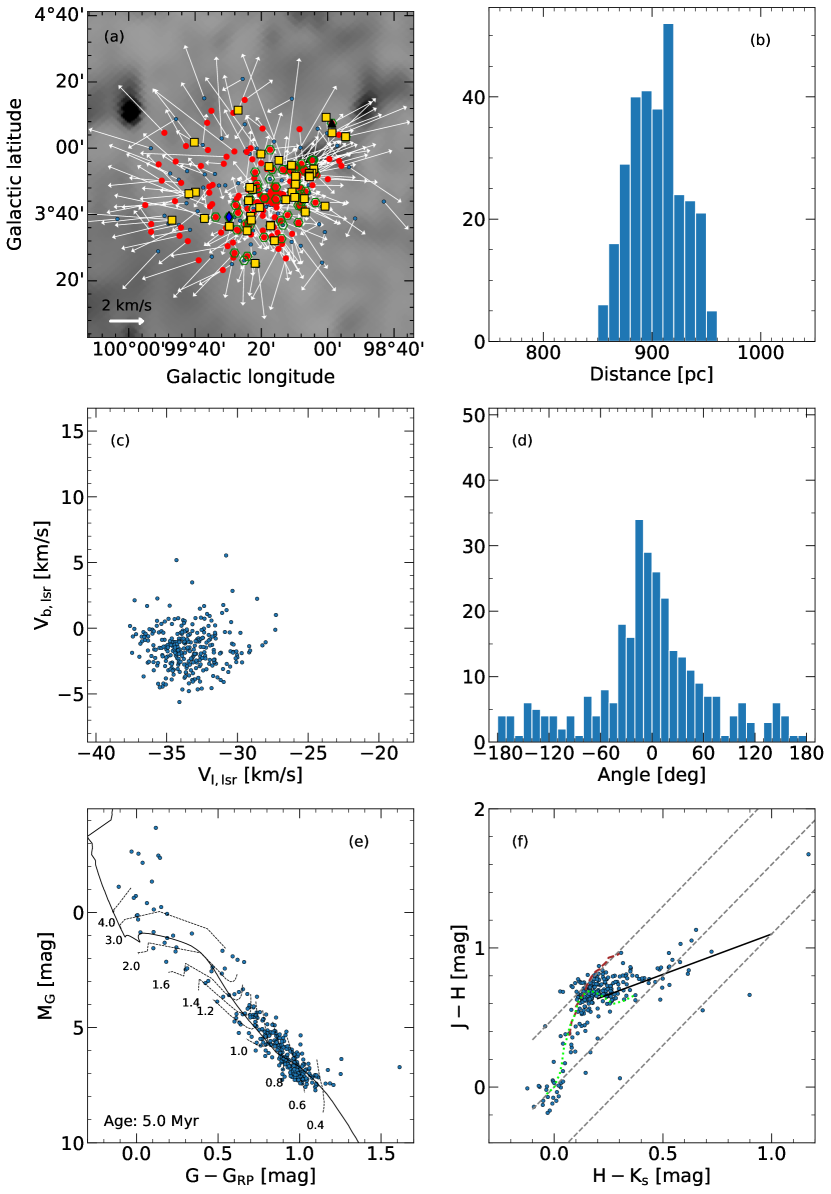
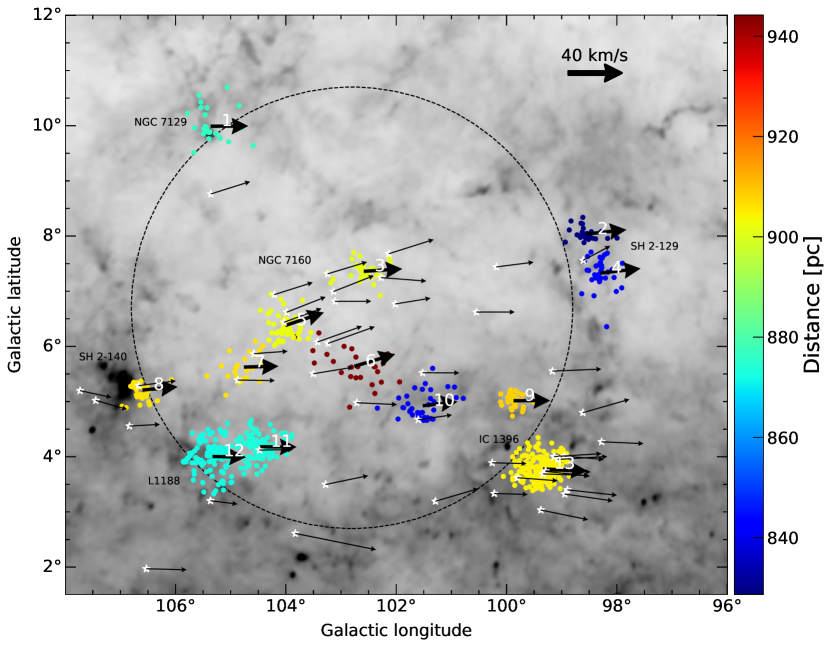
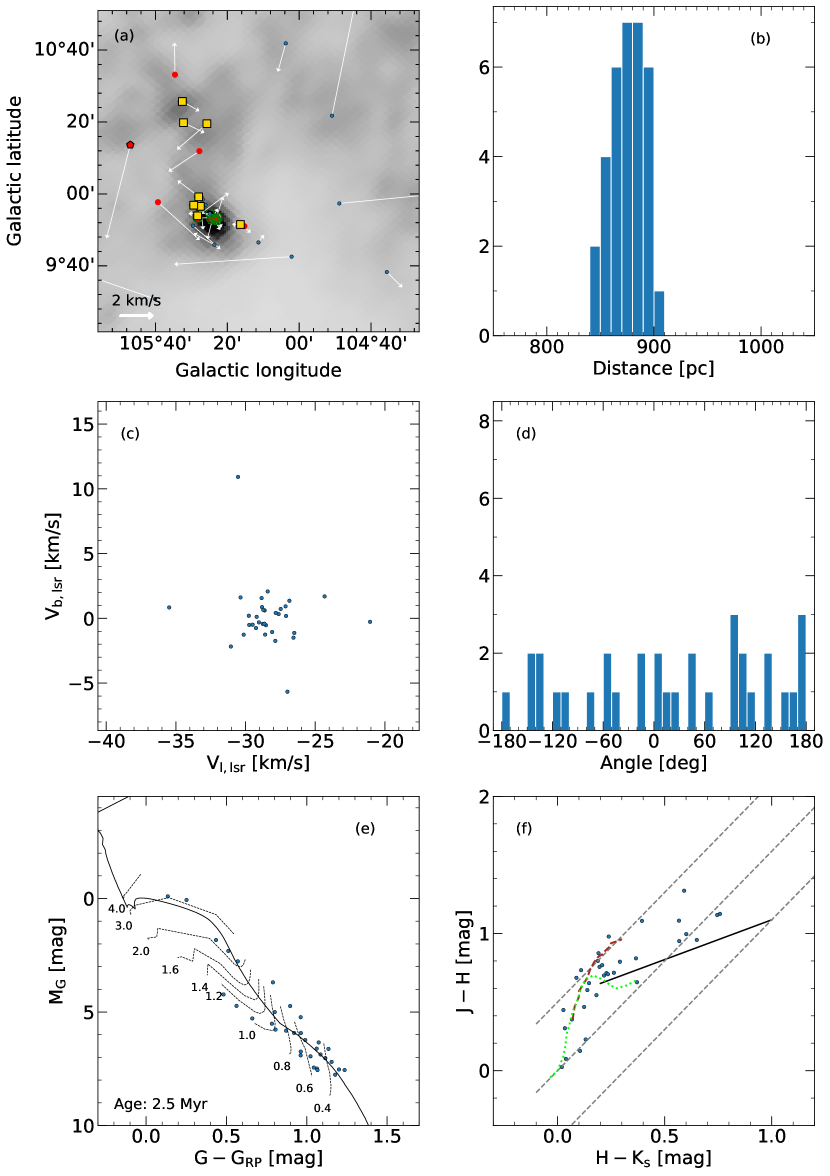
HDBSCAN found originally 10 groups, consisting altogether of 874 stars. The final Groups 2 and 4, 5 and 7, and 11 and 12 were originally merged into three larger groups, respectively, but their spatial distribution suggested that each of the three can be split into two smaller subgroups. The Groups 2 and 4 pairs we split at . For dividing the Group 5–7 and 11–12 pairs we used two-component Gaussian mixture model from scikit-learn (Pedregosa et al., 2011) to fit to their spatial distributions. These actions resulted in 13 groups. We regard these 13 groups as substructures of Cep OB2, and examine how their properties reflect the history of star formation in the region. Figure 1 shows the distribution of the clustered sources in Galactic coordinates, overplotted on the Planck 857 GHz image of the region. The mean tangential velocities of the groups, compared to the LSR, are also indicated. The colouring shows the mean distances of groups. The mean coordinates, distances and velocities of the groups are shown in Table 2. Known clusters and clouds from the literature, associated with the individual groups, are indicated. Surface distribution of stars in individual groups, along with their tangential velocity vectors compared to the mean velocity of the groups listed in Table 2, are displayed in Fig. 3a and Figs. 7a–17a. Distance histograms and vs. diagrams plotted in Figs. 3b and 7bc–17bc. Table 3, containing a detailed list of group members, is available in machine-readable form.
3.1 Radial velocities
3.2 Variable stars
Gaia DR3 provides a list containing 24 types of variable stars identified with machine learning methods (see Rimoldini et al., 2022; Eyer et al., 2022, for details). We crossmatched our group members with it, and found that 355, of the member stars are classified as YSO-candidates in Marton et al. (2022). These stars are overplotted with red circles in Fig. 3a and Figs. 7a–17a. Furthermore 60 stars were identified as RS Canum Venaticorum type variable stars. Additional 17 stars were classified as either eclipsing binaries (Mowlavi et al., 2022), solar-like variables, CVn/magnetic chemical peculiar star/rapidly oscillating Am/Ap star/SX Ari variable stars (Distefano et al., 2022) or Sct/ Dor/SX Phe. Column in Table 3 contains these information.
3.3 Colour–absolute magnitude diagrams
Figures 3e and 7e–17e show the MG vs. GGRP de-reddened colour–absolute magnitude diagrams (CMD) of each group. We downloaded PARSEC isochrones (Bressan et al., 2012) with logarithmic ages from 6 to 7.5 with a step of 0.1. The CMDs show the best-fitted isochrones, as well as evolutionary tracks for several initial masses. For 1.4 M☉ and below we plotted CIFIST (Baraffe et al., 2015) tracks.
3.4 2MASS colour–colour diagrams
We crossmatched our data with the 2MASS (Skrutskie et al., 2006) database. We transformed ICRS coordinates of the stars from Gaia’s J2016 epoch into J2000 epoch to search for 2MASS counterparts. Then we searched for coinciding 2MASS sources within 1 arcsec. We calculated the extinctions in the bands of 2MASS by the method described in Sect. 2. De-reddened JH vs. HKs colour–colour diagrams (CCD) are displayed in Figs. 3f and 7f–17f, showing only the stars with photometric quality criteria ’AAA’.
3.5 WISE colour–colour diagram
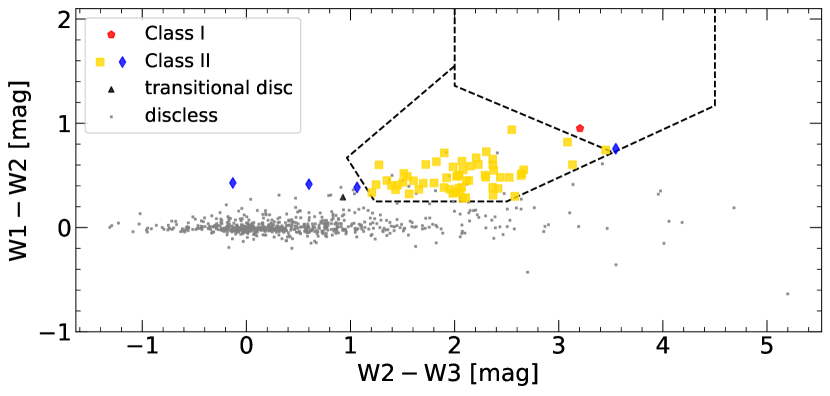
We also searched for counterparts in the AllWISE (Cutri et al., 2021) catalogue to identify potential disc-bearing stars. We found counterparts of 733 stars within 1 arcsec. We followed the methods described by Koenig & Leisawitz (2014) to find disc-bearing stars. From these AllWISE sources, 316 fulfil the quality criteria essential for constructing their vs. colour–colour diagram, displayed in Fig. 4. One star is classified as a Class I source, 58 of the sources are identified as Class II sources and one star is classified as transitional disc bearing star. Supplemented with 2MASS data we identified 4 more Class II sources. These stars are plotted as red pentagons, gold squares, black triangles and blue diamonds, respectively in Figs. 3a and 7a–17a.
3.6 Internal motions of the groups
We examined the internal motions of the substructures of Cep OB2. Following the method applied by Lim et al. (2019) we determined the angle between the radial vector of each star from the centre position of the group and its relative velocity vector. Figures 3d and 7d–17d show the histograms of these angles. Clustering of the angles around 0° is indicative of radial expansion of the group, whereas peaks around suggest contraction.
| Group | Associated object | E(B-V) | age | N⋆ | |||||||||
|---|---|---|---|---|---|---|---|---|---|---|---|---|---|
| (deg) | (pc) | (km s-1) | (mag) | (Myr) | |||||||||
| 1 | NGC 7129 | 105.36 | 9.99 | 0.21 | 2.5 | 33 | 6 | 16 | 3 | 1 | |||
| 2 | SH 2-129, UBC 385 | 98.55 | 8.04 | 0.49 | 10.0 | 27 | 12 | 5 | 2 | 1 | |||
| 3 | UBC 10a, UBC 167 | 102.59 | 7.36 | 0.43 | 10.0 | 33 | 13 | 3 | 7 | 1 | |||
| 4 | 98.30 | 7.33 | 0.48 | 15.8 | 33 | 11 | 7 | 3 | 1 | ||||
| 5 | NGC 7160 | 104.01 | 6.38 | 0.29 | 10.0 | 64 | 19 | 7 | 7 | 4 | |||
| 6 | UBC 10b | 102.76 | 5.64 | 0.34 | 10.0 | 26 | 8 | 1 | 2 | 0 | |||
| 7 | [KPR2005] 117 | 104.76 | 5.63 | 0.32 | 10.0 | 22 | 6 | 5 | 3 | 0 | |||
| 8 | SH 2-140, Pismis–Moreno 1 | 106.60 | 5.21 | 0.61 | 10.0 | 45 | 11 | 19 | 1 | 0 | |||
| 9 | IC 1396, L1116 | 99.87 | 5.02 | 0.32 | 5.0 | 30 | 9 | 13 | 3 | 0 | |||
| 10 | UPK 169, Theia 131 | 101.52 | 4.92 | 0.27 | 4.0 | 39 | 15 | 5 | 0 | 0 | |||
| 11 | Alessi–Teutsch 5 | 104.47 | 4.18 | 0.37 | 7.9 | 93 | 22 | 21 | 6 | 1 | |||
| 12 | L1188, [BDS2003] 30 | 105.33 | 4.00 | 0.6 | 7.9 | 134 | 23 | 66 | 7 | 3 | |||
| 13 | IC 1396, Trumpler 37 | 99.34 | 3.78 | 0.35 | 5.0 | 295 | 36 | 187 | 16 | 5 | |||
4 The substructures of Cep OB2
The historical substructures of Cep OB2 are NGC 7160, surrounded by a number of evolved high-mass stars (Cep OB2a), and IC 1396 (Cep OB2b) (Simonson & van Someren Greve, 1976). These represent two epochs of star formation in the volume of the association. The Cepheus Bubble has revealed new probable subgroups and suggested connection between them. Our search for stellar groups in the Gaia data resulted in further subgroups. Except Group 4 they coincide with known clusters, but most of them have not been coupled to Cep OB2 in the literature. We describe in this section the Gaia view of the substructures.
Most of clustered stars have G < 18 mag, only 33 of the 874 group members are fainter than this limit. The foreground AV extinctions are between 1–1.8 mag. These data suggest that the masses of the detected group members are above 0.6 and 0.7 M☉ in a 5 and 10 Myr old group, respectively.
Group 1,
the northernmost group, contains the well-known, compact young cluster NGC 7129, and a few stars to the west and north of the cluster. Kun et al. (1987) associated NGC 7129 with the Cepheus Bubble based on morphological considerations. Gaia data, in accordance with the VLBA parallax published in Reid et al. (2014) confirm that this cluster is located on the surface of the Cepheus Bubble. HDBSCAN identified 33 members, 8 of them are classified as Class II stars, and 1 is identifies as a Class I source. The colour–magnitude diagram (Fig. 3e) suggests an age of 2.5 Myr. Fig. 3f suggests significant intra-cluster extinction, which may affect the appearance of the colour–magnitude diagram. Eleven of the member stars appear in Dahm & Hillenbrand (2015) and one in Kun et al. (2009) as YSOs. They are overplotted with green hexagons in Fig. 3a.
Groups 2 and 4
are located at the western edge of the Cepheus Bubble. According to the CMDs in Figs. 7e and 9e they are 10 and 15.8 Myr old, and most of their members are more massive than 1 M☉. Unlike other groups, the detected members of Group 2 are aligned evenly along the fitted isochrone: the number of stars above 2 M☉ is nearly identical with that in the 1 M M M☉ interval. Group 2 is the nearest group with a mean distance of pc. It coincides with the cluster UBC 385, identified by Castro-Ginard et al. (2020), and contains several B8–A0 type stars, classified as Cep OB2 members by Alksnis (1958). It is the central cluster of the ring-shaped H ii region Sh 2-129, excited by the O9.5 IV type (Sota et al., 2014) component of the young triple system HD 202214 (Balega et al., 2004). Though the distance of HD 202214, projected at the cluster centre is uncertain, its spectral type and brightness suggest its membership. None of the group members were classified as disc-bearing stars. The neighbouring Group 4 was merged with Group 2 by HDBSCAN, but a closer inspection has shown that they differ slightly in distance.
Groups 3, 5, 6 and 7
are projected inside the Cepheus Bubble. The colour–magnitude diagrams suggest ages of 10 Myr, thus these groups belong to the first generation of Cep OB2 (Sicilia-Aguilar et al., 2005). Groups 3, 6, and 7 coincide with the known clusters UBC 10a, UBC 10b (Castro-Ginard et al., 2018), and [KPR2005] 117 (Kharchenko et al., 2005), respectively. The groups are projected close to each other, but differ in distance, space velocity and mass distribution. Compared to the neighbouring groups Groups 5 and 6 have large latitudal tangential velocity components, and high proportion of low-mass ( M☉) members. The angular distribution of the tangential velocity vectors in Fig. 9d shows the expansion of Groups 5. These groups lack interstellar matter. The dark cloud L1178 is located at the south-eastern edge of the region, but the extinction towards the cloud rises around 700 pc, suggesting that they are not related.
Group 8
is associated with the cluster Pismis–Moreno 1 (Pismis, Moreno & Hasse, 1979) that contains HD 211880, the B0.5V type exciting star of SH 2-140. The colour–magnitude diagram indicates an age around 10 Myr, in accordance with earlier estimates (e.g. Cantat-Gaudin et al., 2020). Four stars were designated as Class II star by the method of Koenig & Leisawitz (2014). Star formation is on-going in the molecular cloud bordered by the H ii region (Gutermuth et al., 2009). Quite a few Class II Spitzer sources, without reliable Gaia data, are projected within this group (see fig. 1 in Gutermuth et al., 2009), indicative of either their membership or the overlapping of the older Pismis–Moreno 1 and the embedded S140 cluster.
Groups 9 and 13
are located at the IC 1396 region. Several dark clouds of Lynds (1962) are found in the region. The extinction towards L1086, L1096, L1102 and L1116 rises around 900 pc, indicating that all these clouds may be related to IC 1396. Group 13 corresponds to the cluster Trumpler 37, containing the exciting star of IC 1396. We have identified 39 Class II sources and a transitional disc-bearing star in Group 13. The 295 members include 69 low-mass YSOs identified by Sicilia-Aguilar et al. (2005), and the intermediate-mass YSO IRAS 21365+5713 from Contreras et al. (2002). Figure 17d indicates the expansion of Tr 37. According to the CMDs, the ages of groups are around 5 Myrs.
Group 10
corresponds to the cluster UPK 169 (Cantat-Gaudin & Anders, 2020). It also appears in Kounkel & Covey (2019) as part of Theia 131. It is projected halfway between NGC 7160 and Tr 37, but its distance is some 60 pc smaller. The mean age of the group members is about 4 Myr. Based on AllWISE data none of the 39 members have infrared excess, characteristic of YSO discs. The brightest member of the group is HD 207538, an O9.7IV spectral-type star (Sota et al., 2011).
Groups 11 and 12
correspond to the known clusters Alessi–Teutsch 5 and [BDS2003] 30, respectively (Kharchenko et al., 2005; Bica et al., 2003). Eleven stars of Group 12 were identified as Class II sources based on AllWISE and 2MASS data. The most luminous member of Group 11 is the B1IV type component of the eclipsing binary V* V446 Cep. The star-forming dark cloud L1188 is associated with Group 12. Ten of Group 12 members were classified as young stars in Szegedi-Elek et al. (2019). The CMDs suggest ages of 7.9 Myr for both groups.
| Column | Description |
|---|---|
| group | Group identifier |
| name | Star identifier |
| source_id | Gaia DR3 source id |
| TMASS | 2MASS identifier |
| AllWISE | AllWISE identifier |
| ra | RA at J2016 |
| dec | DEC at J2016 |
| l | Galactic longitude |
| b | Galactic latitude |
| d | Distance from Bailer-Jones et al. (2021) |
| dmin | 16th percentile of distance posterior |
| from Bailer-Jones et al. (2021) | |
| dmax | 84th percentile of distance posterior |
| from Bailer-Jones et al. (2021) | |
| parallax | Parallax |
| parallax_error | Error of the parallax |
| pmra | Proper motion in right ascension |
| pmra_error | Error of the proper motion in RA |
| pmdec | Proper motion in declination |
| pmdec_error | Error of the proper motion in DEC |
| radial_velocity | Radial velocity |
| radial_velocity_error | Error of the radial velocity |
| ruwe | Renormalized unit-weight error |
| phot_g_mean_mag | Magnitude in G band |
| phot_bp_mean_mag | Magnitude in GBP band |
| phot_rp_mean_mag | Magnitude in GRP band |
| Jmag | Magnitude in 2MASS J band |
| Hmag | Magnitude in 2MASS H band |
| Kmag | Magnitude in 2MASS Ks band |
| eb_v | E(B-V) from STILISM |
| allwise_class | YSO type by the classification of |
| Koenig & Leisawitz (2014) | |
| best_class_name | Variable star type appear in |
| gaiadr3.vari_classifier_result | |
| (Rimoldini et al., 2022) |
5 Overall view of Cepheus OB2
The line-of-sight dimension of the system of groups is some 120 pc, similar to the apparent diameter of the Cepheus Bubble. To get an insight into the internal motions of the stars associated with the Cepheus Bubble we calculated the mean motion from the velocity data in Table 2. The mean velocities are km s-1and km s-1. In Fig. 5 we represent the tangential velocities of the groups compared to the mean values. The precision of available stellar radial velocities is not sufficient for studying the three-dimensional velocity structure.
The colour–magnitude diagrams show that star formation started some 10 million years ago in the studied region. Groups 3, 5, 6, 7 are located inside the volume bordered by the Cepheus Bubble, in the volume occupied by the evolved high-mass members of Cep OB2a. These groups are new components of Cep OB2a. The mean distance of this subsystem is 900 pc, the line-of-sight size is about 50 pc, and the dispersion of the tangential velocities is some 10 km s-1. The tangential velocities indicate the expansion of the largest group, most probably due to the disappearance of the the parental cloud. Expansion of the whole Cep OB2a cannot be demonstrated by the method applied in Sect. 3.6. The spatial and velocity structure suggest that each group had its own parent cloud clump, forming stars independently. Most of the high-mass stars were not selected by HDBSCAN as group members, the only exception is the B1 III type HD 208218, the most massive member of Group 5. The reason may be that the velocities of the high-mass stars are influenced by their probable multiplicities.
Groups 1, 2, 4, 8, 9, 12 and 13 line along the apparent perimeter of the Bubble. Except Groups 2, 4 and 8, these groups are younger than Cep OB2a. The diversity of their stellar contents, ages, and velocities suggest a complex history of star formation. The expansion of the by now extinct H ii region of Cep OB2a might have affected the formation of these groups, and/or the evolution of circumstellar discs of the group members.
Figure 5 shows that the Groups 11, 12, and 13 move radially outwards from the centre, suggesting that their parent clouds were accelerated by the shock wave from the expanding ionization front of the OB stars of Cep OB2a. Each of these groups is younger than Cep OB2a. Groups 12 and 13 are associated with large amounts of molecular gas (Szegedi-Elek et al., 2019; Sicilia-Aguilar et al., 2015, respectively), sites of active star formation. The colour–magnitude diagrams suggest that Groups 11 and 12 are nearly coeval. The difference in the proportion of disc-bearing members may result from the different environments (cf. Dale et al., 2013).
The small groups Group 2 (UBC 385) and 4 are projected near the westernmost wall of the Cepheus Bubble. Gaia data have shown that these groups are some 70 pc closer to us than the central groups. Their ages, suggested by the Gaia CMDs, are similar to that of Cep OB2a. Group 2 is centred on the H ii region S129. Since O-type stars and H ii regions are generally younger than 10 Myr (e.g. Tremblin et al., 2014), we may speculate that the exciting star HD 202214 was born later than the lower-mass members of the group. SPH simulations by Dale et al. (2013) show that such a situation may occur in molecular clouds near ionizing stars. Precise astrometric data of the HD 202214 triple system and more data on the cluster population may clarify the nature of star-forming processes in the region of S129, and its connection with the Cepheus Bubble.
Group 8 (Pismis–Moreno 1) is another 10 Myr old group associated with an H ii region. The main-sequence lifetime of the B0.5 V type exciting star HD 211880 is compatible with this age. The molecular cloud bordered by the ionization front contains the S140 embedded cluster (Gutermuth et al., 2009). This morphology suggests that probably Group 8 and HD 211880 itself were formed in the same molecular cloud, and star formation propagates radially outwards from the central Cep OB2a. However, the role of the expanding Cepheus Bubble in the formation of this cluster is unlikely because of the apparently similar ages of Cep OB2a and Group 8.
Group 9 is a small group at the outskirts of IC 1396, associated with dark clouds, bordering the H ii region. Its age is similar to that of Tr 37, whereas their tangential velocities, and probably star formation histories are different.
Group 10 (UPK 169, Cantat-Gaudin & Anders, 2020) is a Myr old small group, containing the O9 V type star HD 207538. It is projected inside the Bubble, and its distance of pc suggests association with the near wall. In spite of its young age, no disc-bearing low-mass star has been detected in this group, probably due to the disruptive radiation of the hot star. The parent cloud of this group was probably overrun by the expanding ionization front of Cep OB2a. Similarly, collision of the expanding bubble with the southernmost edge of an ambient giant molecular cloud, located at Galactic latitudes 10–13° (Grenier et al., 1989), might have played a role in the formation of Group 1 (NGC 7129).
6 Summary
We have studied the stars from Gaia DR3 in the region of the Cepheus OB2 association between , and . We selected candidate pre-main-sequence stars using isochrones in the vs. GBPGRP colour–magnitude diagram. We used HDBSCAN to find groups in the selected sample, and found 13 stellar groups, consisting of 874 stars. These 13 groups, located between 830–940 pc, are subsystems of Cepheus OB2. 355 of the clustered stars are classified as candidate YSOs by Marton et al. (2022). Based on WISE data we identified one Class I source, sixty-two Class II sources and one with transitional disc, according to the classification of Koenig & Leisawitz (2014).
We found that star formation in the volume of the association started some 10 million years ago. In addition to the evolved high-mass stars, the oldest subsystem Cep OB2a contains four groups of low- and intermediate-mass stars. The tangential velocities suggest the expansion of the group containing NGC 7160, however the expansion of the whole Cep OB2a cannot be proved.
In addition to the historical younger subsystem Cep OB2b, Trumpler 37, several other, 2–8 Myr old groups can be found in the volume of the association. Most of them might have been formed under the influence of the expanding bubble. Spatial and kinematic structure of the region suggest various means of interaction between the star-forming clouds and the expanding bubble. The tangential velocities show that the parent clouds of the young clusters Trumpler 37, Alessi–Teutsch 5 and [BDS2003] 30 (Groups 11, 12 and 13) have been accelerated by the expanding ionization front of Cep OB2a. Other groups reveal places where the expanding ionization front encountered ambient clouds (Groups 1, 8, and 10, aka NGC 7129, S140, and UPK 169). The age of the cluster Pismis–Moreno 1 (Group 8, S140) suggests that formation of this group was probably independent of the expanding bubble. The relation of S129 to the Cepheus Bubble is uncertain, because of the uncertain distance of the exciting star and the discrepancy of the age of the central cluster and the exciting star.
Acknowledgements
We thank the anonymous referee for the careful and insightful review of our manuscript. We thank Lajos Balázs for his help in statistics. This work has made use of data from the European Space Agency (ESA) mission Gaia (https://www.cosmos.esa.int/gaia), processed by the Gaia Data Processing and Analysis Consortium (DPAC, https://www.cosmos.esa.int/web/gaia/dpac/consortium). Funding for the DPAC has been provided by national institutions, in particular the institutions participating in the Gaia Multilateral Agreement. This work was supported by the ESA PRODEX Contract nr. 4000129910. For this work we have used Astropy (Astropy Collaboration et al., 2013, 2018), Matplotlib (Hunter, 2007), Pandas (McKinney, 2010), scikit-learn (Pedregosa et al., 2011), SciPy (Virtanen et al., 2020), TOPCAT (Taylor, 2005).
Data availability
References
- Ábrahám et al. (2000) Ábrahám P., Balázs L. G., Kun M., 2000, A&A, 354, 645
- Alksnis (1958) Alksnis A., 1958, Trudy Astrofiz. Lab. Riga, 7, 33
- Ambartsumian (1949) Ambartsumian V. A., 1949, Azh, 26, 3
- Astropy Collaboration et al. (2013) Astropy Collaboration et al., 2013, A&A, 558, A33
- Astropy Collaboration et al. (2018) Astropy Collaboration et al., 2018, AJ, 156, 123
- Bailer-Jones et al. (2021) Bailer-Jones C. A. L., Rybizki J., Fouesneau M., Demleitner M., Andrae R., 2021, AJ, 161, 147
- Balega et al. (2004) Balega I., Balega Y. Y., Maksimov A. F., Pluzhnik E. A., Schertl D., Shkhagosheva Z. U., Weigelt G., 2004, A&A, 422, 627
- Baraffe et al. (2015) Baraffe I., Homeier D., Allard F., Chabrier G., 2015, A&A, 577, A42
- Barbier-Brossat & Figon (2000) Barbier-Brossat M., Figon P., 2000, A&AS, 142, 217
- Bica et al. (2003) Bica E., Dutra C. M., Soares J., Barbuy B., 2003, A&A, 404, 223
- Blaauw (1964) Blaauw A., 1964, ARA&A, 2, 213
- Blaha & Humphreys (1989) Blaha C., Humphreys R. M., 1989, AJ, 98, 1598
- Boyajian et al. (2007) Boyajian T. S., et al., 2007, PASP, 119, 742
- Bressan et al. (2012) Bressan A., Marigo P., Girardi L., Salasnich B., Dal Cero C., Rubele S., Nanni A., 2012, MNRAS, 427, 127
- Bruhweiler et al. (1980) Bruhweiler F. C., Gull T. R., Kafatos M., Sofia S., 1980, ApJ, 238, L27
- Cantat-Gaudin & Anders (2020) Cantat-Gaudin T., Anders F., 2020, A&A, 633, A99
- Cantat-Gaudin et al. (2020) Cantat-Gaudin T., et al., 2020, A&A, 640, A1
- Castro-Ginard et al. (2018) Castro-Ginard A., Jordi C., Luri X., Julbe F., Morvan M., Balaguer-Núñez L., Cantat-Gaudin T., 2018, A&A, 618, A59
- Castro-Ginard et al. (2020) Castro-Ginard A., et al., 2020, A&A, 635, A45
- Contreras et al. (2002) Contreras M. E., Sicilia-Aguilar A., Muzerolle J., Calvet N., Berlind P., Hartmann L., 2002, AJ, 124, 1585
- Cutri et al. (2021) Cutri R. M., et al., 2021, VizieR Online Data Catalog, p. II/328
- Dahm & Hillenbrand (2015) Dahm S. E., Hillenbrand L. A., 2015, AJ, 149, 200
- Dale et al. (2013) Dale J. E., Ercolano B., Bonnell I. A., 2013, MNRAS, 430, 234
- Dias et al. (2002) Dias W. S., Alessi B. S., Moitinho A., Lépine J. R. D., 2002, A&A, 389, 871
- Distefano et al. (2022) Distefano E., et al., 2022, arXiv e-prints, p. arXiv:2206.05500
- Ehlerová & Palouš (2002) Ehlerová S., Palouš J., 2002, MNRAS, 330, 1022
- Eyer et al. (2022) Eyer L., et al., 2022, arXiv e-prints, p. arXiv:2206.06416
- Fabricius et al. (2002) Fabricius C., Høg E., Makarov V. V., Mason B. D., Wycoff G. L., Urban S. E., 2002, A&A, 384, 180
- Gaia Collaboration et al. (2016) Gaia Collaboration et al., 2016, A&A, 595, A1
- Gaia Collaboration et al. (2022) Gaia Collaboration et al., 2022, arXiv e-prints, p. arXiv:2208.00211
- Gontcharov (2006) Gontcharov G. A., 2006, Astronomy Letters, 32, 759
- Grenier et al. (1989) Grenier I. A., Lebrun F., Arnaud M., Dame T. M., Thaddeus P., 1989, ApJ, 347, 231
- Gutermuth et al. (2009) Gutermuth R. A., Megeath S. T., Myers P. C., Allen L. E., Pipher J. L., Fazio G. G., 2009, ApJS, 184, 18
- Hilditch et al. (1982) Hilditch R. W., McLean B. J., Reid I. N., 1982, MNRAS, 200, 1153
- Holgado et al. (2018) Holgado G., et al., 2018, A&A, 613, A65
- Hunter (2007) Hunter J. D., 2007, Computing in Science & Engineering, 9, 90
- Katz et al. (2022) Katz D., et al., 2022, arXiv e-prints, p. arXiv:2206.05902
- Kerr et al. (2021) Kerr R. M. P., Rizzuto A. C., Kraus A. L., Offner S. S. R., 2021, ApJ, 917, 23
- Kharchenko et al. (2005) Kharchenko N. V., Piskunov A. E., Röser S., Schilbach E., Scholz R. D., 2005, A&A, 440, 403
- Kharchenko et al. (2007) Kharchenko N. V., Scholz R. D., Piskunov A. E., Röser S., Schilbach E., 2007, Astronomische Nachrichten, 328, 889
- Koenig & Leisawitz (2014) Koenig X. P., Leisawitz D. T., 2014, ApJ, 791, 131
- Kounkel & Covey (2019) Kounkel M., Covey K., 2019, AJ, 158, 122
- Kun et al. (1987) Kun M., Balázs L. G., Tóth I., 1987, Ap&SS, 134, 211
- Kun et al. (2008) Kun M., Kiss Z. T., Balog Z., 2008, in Reipurth B., ed., , Vol. 4, Handbook of Star Forming Regions, Volume I. p. 136
- Kun et al. (2009) Kun M., Balog Z., Kenyon S. J., Mamajek E. E., Gutermuth R. A., 2009, ApJS, 185, 451
- Lallement et al. (2018) Lallement R., et al., 2018, A&A, 616, A132
- Lim et al. (2019) Lim B., Nazé Y., Gosset E., Rauw G., 2019, MNRAS, 490, 440
- Lim et al. (2021) Lim B., et al., 2021, AJ, 162, 56
- Lim et al. (2022) Lim B., Nazé Y., Hong J., Yoon S.-y., Lee J., Hwang N., Park B.-G., Lee J.-E., 2022, AJ, 163, 266
- Lindegren (2018) Lindegren L., 2018, Re-normalising the astrometric chi-square in Gaia DR2, GAIA-C3-TN-LU-LL-124
- Lynds (1962) Lynds B. T., 1962, ApJS, 7, 1
- Marton et al. (2022) Marton G., et al., 2022, arXiv e-prints, p. arXiv:2206.05796
- McCray & Kafatos (1987) McCray R., Kafatos M., 1987, ApJ, 317, 190
- McInnes et al. (2017) McInnes L., Healy J., Astels S., 2017, The Journal of Open Source Software, 2, 205
- McKinney (2010) McKinney W., 2010, in van der Walt S., Millman J., eds, Proceedings of the 9th Python in Science Conference. pp 51 – 56
- Melnik & Dambis (2020) Melnik A. M., Dambis A. K., 2020, MNRAS, 493, 2339
- Mowlavi et al. (2022) Mowlavi N., et al., 2022, arXiv e-prints, p. arXiv:2211.00929
- Patel et al. (1998) Patel N. A., Goldsmith P. F., Heyer M. H., Snell R. L., Pratap P., 1998, ApJ, 507, 241
- Pedregosa et al. (2011) Pedregosa F., et al., 2011, Journal of Machine Learning Research, 12, 2825
- Peter et al. (2012) Peter D., Feldt M., Henning T., Hormuth F., 2012, A&A, 538, A74
- Petrie & Pearce (1961) Petrie R. M., Pearce J. A., 1961, Publications of the Dominion Astrophysical Observatory Victoria, 12, 1
- Pismis et al. (1979) Pismis P., Moreno M. A., Hasse I., 1979, Rev. Mex. Astron. Astrofis., 4, 331
- Pourbaix et al. (2004) Pourbaix D., et al., 2004, A&A, 424, 727
- Reid et al. (2014) Reid M. J., et al., 2014, ApJ, 783, 130
- Rimoldini et al. (2022) Rimoldini L., et al., 2022, arXiv e-prints, p. arXiv:2211.17238
- Schönrich et al. (2010) Schönrich R., Binney J., Dehnen W., 2010, MNRAS, 403, 1829
- Sicilia-Aguilar et al. (2005) Sicilia-Aguilar A., Hartmann L. W., Hernández J., Briceño C., Calvet N., 2005, AJ, 130, 188
- Sicilia-Aguilar et al. (2006) Sicilia-Aguilar A., et al., 2006, ApJ, 638, 897
- Sicilia-Aguilar et al. (2015) Sicilia-Aguilar A., et al., 2015, A&A, 573, A19
- Simonson (1968) Simonson S. Christian I., 1968, ApJ, 154, 923
- Simonson & van Someren Greve (1976) Simonson S. C. I., van Someren Greve H. W., 1976, A&A, 49, 343
- Skrutskie et al. (2006) Skrutskie M. F., et al., 2006, AJ, 131, 1163
- Sota et al. (2011) Sota A., Maíz Apellániz J., Walborn N. R., Alfaro E. J., Barbá R. H., Morrell N. I., Gamen R. C., Arias J. I., 2011, ApJS, 193, 24
- Sota et al. (2014) Sota A., Maíz Apellániz J., Morrell N. I., Barbá R. H., Walborn N. R., Gamen R. C., Arias J. I., Alfaro E. J., 2014, ApJS, 211, 10
- Szegedi-Elek et al. (2019) Szegedi-Elek E., Kun M., Moór A., Marton G., Reipurth B., 2019, MNRAS, 484, 1800
- Tan et al. (2014) Tan J. C., Beltrán M. T., Caselli P., Fontani F., Fuente A., Krumholz M. R., McKee C. F., Stolte A., 2014, in Beuther H., Klessen R. S., Dullemond C. P., Henning T., eds, Protostars and Planets VI. p. 149 (arXiv:1402.0919), doi:10.2458/azu_uapress_9780816531240-ch007
- Taylor (2005) Taylor M. B., 2005, in Shopbell P., Britton M., Ebert R., eds, Astronomical Society of the Pacific Conference Series Vol. 347, Astronomical Data Analysis Software and Systems XIV. p. 29
- Tremblin et al. (2014) Tremblin P., et al., 2014, A&A, 568, A4
- Virtanen et al. (2020) Virtanen P., et al., 2020, Nature Methods, 17, 261
- Wang & Chen (2019) Wang S., Chen X., 2019, ApJ, 877, 116
- Wilson (1953) Wilson R. E., 1953, Carnegie Institute Washington D.C. Publication, p. 0
- Wright (2020) Wright N. J., 2020, New Astron. Rev., 90, 101549
- Wright & Mamajek (2018) Wright N. J., Mamajek E. E., 2018, MNRAS, 476, 381
- Wright et al. (2016) Wright N. J., Bouy H., Drew J. E., Sarro L. M., Bertin E., Cuillandre J.-C., Barrado D., 2016, MNRAS, 460, 2593
- Zari et al. (2019) Zari E., Brown A. G. A., de Zeeuw P. T., 2019, A&A, 628, A123
- de Bruijne & Eilers (2012) de Bruijne J. H. J., Eilers A. C., 2012, A&A, 546, A61
- de Zeeuw et al. (1999) de Zeeuw P. T., Hoogerwerf R., de Bruijne J. H. J., Brown A. G. A., Blaauw A., 1999, AJ, 117, 354
Appendix A Figures of stellar groups
In this section, we show the spatial, distance, tangential velocity distribution, colour–magnitude and colour–colour diagrams of Groups 2–13. For a detailed description, see Fig. 3.