11email: yordanka.apostolovski@gmail.com 22institutetext: Instituto de Estudios Astrofísicos, Facultad de Ingeniería y Ciencias, Universidad Diego Portales, Av. Ejército 441, Santiago, Chile 33institutetext: Instituto de Astrofisica, Facultad de Ciencias Exactas, Universidad Andres Bello, Fernandez Concha 700, Santiago, Chile 44institutetext: Millennium Institute of Astrophysics, Monseñor Nuncio Sotero Sanz 100, Oficina 104, Santiago, Chile 55institutetext: Aix Marseille Univ, CNRS, LAM, Laboratoire d’Astrophysique de Marseille, Marseille, France 66institutetext: Department of Physics and Astronomy, University of British Columbia, Vancouver, BC, Canada 77institutetext: Department of Physics and Atmospheric Science, Dalhousie University, Halifax, NS, B3H 4R2, Canada 88institutetext: European Southern Observatory, Karl Schwarzschild Straße 2, 85748 Garching bei München, Germany 99institutetext: Department of Astronomy, University of Florida, 211 Bryant Space Sciences Center, Gainesville, FL, 32611, USA 1010institutetext: Max Planck Institut fur Astrophysik, Karl-Schwarzschild-Straße 1, D-85748 Garching bei München, Germany 1111institutetext: Département de Physique, Université de Montréal, Montreal, Quebec, H3T 1J4, Canada 1212institutetext: Center for Computational Astrophysics, Flatiron Institute, 162 Fifth Avenue, New York, NY, 10010, USA 1313institutetext: Department of Astronomy, University of Illinois at Urbana-Champaign, 1002 West Green St., Urbana, IL, 61801, USA 1414institutetext: Department of Physics and Astronomy, University of California, Los Angeles, CA, 90095-1547, USA 1515institutetext: Department of Physics and Astronomy and George P. and Cynthia Woods Mitchell Institute for Fundamental Physics and Astronomy, Texas A&M University, 4242 TAMU, College Station, TX 77843-4242, USA 1616institutetext: Max-Planck-Institut für Radioastronomie, Auf dem Hügel 69, D-53121, Bonn, Germany
Extended Lyman- emission towards the SPT2349-56 protocluster at
Abstract
Context. Deep spectroscopic surveys with the Atacama Large Millimeter/submillimeter Array (ALMA) have revealed that some of the brightest infrared sources in the sky correspond to concentrations of dusty star-forming galaxies (DSFG) at high redshift. Among these, the SPT2349-56 protocluster system at is amongst the most extreme examples due to its high source density and integrated star formation rate.
Aims. We conducted a deep Lyman- line emission survey around SPT2349-56 using the Multi-Unit Spectroscopic Explorer (MUSE) at Very Large Telescope (VLT) in order to characterize this uniquely dense environment.
Methods. Taking advantage of the deep three-dimensional nature of this survey, we performed a sensitive search for Lyman- emitters (LAEs) toward the core and northern extension of the protocluster, which correspond to the brightest infrared regions in this field. Using a smoothed narrowband image extracted from the MUSE datacube around the protocluster redshift, we searched for possible extended structures.
Results. We identify only three LAEs at in this field, in concordance with expectations for blank-fields, and an extended Lyman- structure spatially associated with core of the protocluster. All the previously-identified DSFGs in this field are undetected in Lyman- emission, consistent with the conspicuous dust obscuration in these systems. We find an extended Lyman- structure, about kpc2 in size, and located 56 kpc west of the protocluster core. Three DSFGs coincide spatially with the location of this structure. We conclude that either the three co-spatial DSFGs or the protocluster core itself are feeding ionizing photons to the Lyman- structure.
Key Words.:
galaxies – formation: galaxies – intergalactic medium1 Introduction
| ID | RA | DEC | FWHM | EW | ||
| (J2000) | (J2000) | (km s-1) | (km s-1) | ( erg cm-2 s-1) | (km s-1) | |
| LAB | :: | :: | ||||
| LAE1 | :: | :: | ||||
| LAE3 | :: | :: | ||||
| LAE8 | :: | :: | ||||
| Tentative candidates† | ||||||
| NL3 | :: | :: | ||||
| LAE2 | :: | :: | ||||
| LAE4 | :: | :: | ||||
| LAE5 | :: | :: | ||||
| LAE6 | :: | :: | ||||
| LAE7 | :: | :: |
Notes: † List of Lyman- line candidates, which showed (snr) as computed in the LSDCat detection cube. Despite the high snr obtained in the “maximal” LSDCat extraction, these detections are considered tentative based on their low significance measured in the original cube through homogeneous radii aperture measurements. ‡ Velocity offset relative to the protocluster’s mean [Cii]-derived redshift, .
Studies of massive galaxies at the peak of their star-formation activity and their relation to the densest protocluster systems are key to understanding the hierarchical formation of the most massive galaxy structures in the early Universe. Current studies seek to understand the role of active galactic nuclei (AGN) feedback (Pike et al., 2014; Smolčić et al., 2017), or the relation between downsizing and star formation (Magliocchetti et al., 2013; Miller et al., 2015) during the active growth phases of such forming structures.
Cosmological simulations show that cold dark matter (CDM) haloes merge and form a web-like network traced by young galaxies and reionized gas. A protocluster will form at the highest overdensity regions within this filamentary structure at early cosmic times (; Baugh et al., 1998; De Lucia & Blaizot, 2007), eventually becoming a massive virialized cluster by (e.g.; Overzier, 2016). These cosmological simulations indicate that galaxies within galaxy protoclusters experience a luminous starburst-phase (Miley & De Breuck, 2008).
To identify and study these starbursting protocluster systems, several observational methods have been used. One of them corresponds to sub/millimeter wavelength observations, which allow one to pinpoint the obscured star-formation activity in young protocluster members (e.g., Chapman et al., 2009; Daddi et al., 2009; Aravena et al., 2010; Capak et al., 2011; Casey et al., 2015; Miller et al., 2018; Oteo et al., 2018). Similarly, low-frequency radio observations are typically used to search for radio-loud quasars sitting in the centers of dense protocluster fields (Galametz et al., 2013; Rigby et al., 2014). In these radio-selected protoclusters, Lyman- emitters (LAEs), star-forming galaxies selected through their significant UV rest-frame Lyman- emission line (), show overdensity factors times larger than the field at the same redshift (Venemans et al., 2005, 2007). Given this ubiquity of LAE overdensities in radio-selected fields, deep searches for these sources have been performed to confirm the redshifts of protocluster galaxy candidates using 8m-class optical/IR telescopes (e.g., Pentericci et al., 1997; Kurk et al., 2000; Venemans et al., 2002, 2004, 2005, 2007; Croft et al., 2005).
The velocity dispersions of radio-selected galaxy protoclusters are typically found in the km s-1 range centered at the mean velocity of the radio galaxies. Although these systems are not yet virialized, such large velocity dispersions suggest that these systems have large halo masses, possibly evolving into the most massive cluster systems in the local Universe.
Narrowband image surveys in protocluster fields have identified a population of LAEs with luminosities larger than erg s-1 and large spatial extensions ( kpc). These structures are often referred to as Lyman- blobs (LABs; Steidel et al., 2000; Matsuda et al., 2004). The origin of the emission of these structures can be explained by different scenarios such as the presence of AGN or massive star-forming galaxies. The production of Lyman- photons in these objects could be associated with different processes such as recombination radiation, continuum pumping, or collisional excitation (see; Cantalupo, 2017).
The large-scale millimeter survey covering 2500 squares degrees of the sky conducted with the South Pole Telescope (SPT; Carlstrom et al., 2011) discovered a population of millimeter-bright sources ( mJy; Vieira et al., 2010, 2013; Everett et al., 2020; Reuter et al., 2020). Follow-up observations with the Atacama Large Millimeter/submillimeter Array (ALMA) showed that the majority of these sources are gravitationally lensed submillimeter galaxies (; SMGs; also known as dusty star-forming galaxies, or DSFGs) with magnifications (median Spilker et al., 2016). The remaining sources show no evidence of gravitational lensing, being either intrinsically bright or composed of fainter multiple-component SMGs or groups of SMGs (Hezaveh et al., 2013; Spilker et al., 2016). The high number of SMGs spread over a small area of the sky () found in these fields strongly suggests the existence of (sub)millimeter bright protocluster fields (Wang et al., 2021).
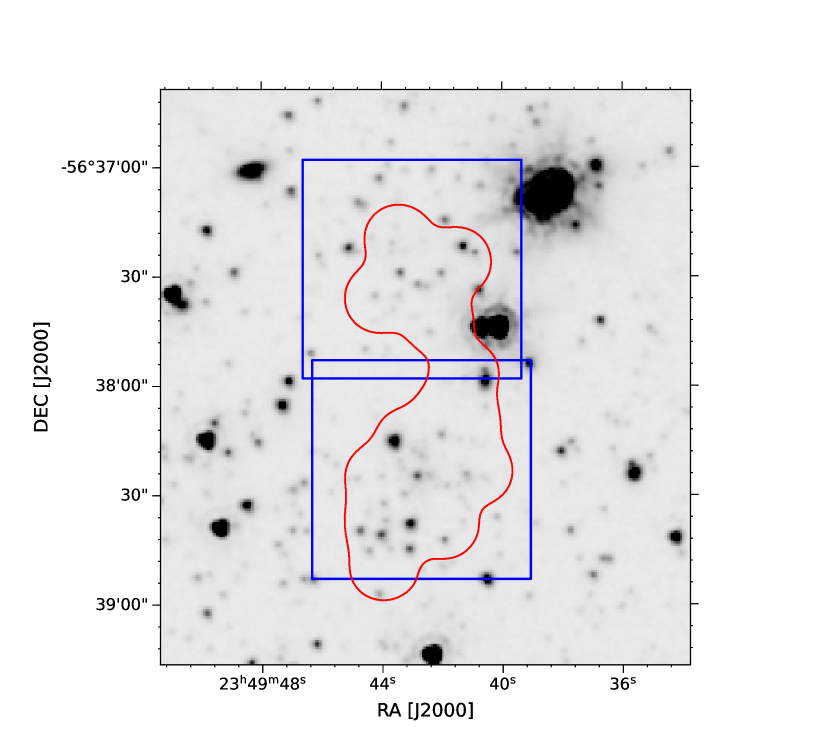
Among the sample of SPT protoclusters, the SPT2349-56 system stands out due to its exceptionally high surface density of SMGs. SPT2349-56 is located at and has a surface density of more than ten times the average blank-field value and a volume density 1000 times the average (Miller et al., 2018; Hill et al., 2020). This system could represent the core of a massive galaxy cluster and is one of the most massive structures known to date in the early Universe. The SPT2349-56 system has two main infrared (IR) bright structures as seen in the APEX/LABOCA 870 m maps, following the north-south direction (Figure 1). The southern component comprises by itself a flux density of S mJy, whereas the northern component contributes with S mJy. For reference, a typical unlensed SMG has a flux density of around 5–10 mJy at 870 m. Higher-resolution deep ALMA spectroscopy yielded a total of 24 [Cii] and 16 CO(4-3) line emitters in the southern and northern extensions of the cluster (e.g. Miller et al., 2018; Hill et al., 2020). Several components of this system have SFR estimates of M⊙ yr-1, while the full protocluster system is estimated to have a SFR of about M☉ yr-1 (Hill et al., 2020). Similarly, the dynamical mass of the core region is estimated to be , while the total halo mass of the whole structure is (Hill et al., 2020).
The physical properties of these sources indicate that this protocluster already harbors massive galaxies that are rapidly forming stars from an abundant gas supply. The large number of SMGs in this system pushes and challenges theoretical models seeking to explain the origin and evolution of protoclusters (Chiang et al., 2013).
Due to the proximity of the SMG members in the core of the protocluster (the diameter is about kpc), it is likely that its component galaxies will merge to form a massive elliptical galaxy at the core of a lower-redshift Coma-like galaxy cluster (Miller et al., 2018; Hill et al., 2020).
A recent search for Lyman Break Galaxies (LBGs) in the extended SPT2349-56 environment found 4 LBGs in the southern part of the protocluster (Rotermund et al., 2021), indicating that most of the SMGs are inconspicuous at optical wavelengths, with only one of the 4 LBGs coinciding with a previously reported SMG.
Motivated by the significant overdensities found in radio-selected protocluster fields, we conducted an independent census of star-forming galaxies in the SPT2349-56 field through a sensitive search for Lyman- emission using deep optical spectroscopy obtained with the Multi-Object Spectroscopy Unit (MUSE) at the Very Large Telescope (VLT). In Section 2 we describe the observations and reduction of the MUSE data towards SPT2349-56, and summarize previous observations. In Section 3 we present the detection of Lyman- emission through both a blind search and narrowband imaging. In Section 4 we analyze the nature of the extended Lyman- emission along with its connection with LAEs and the structure of the protocluster. Section 5 summarizes and presents the conclusions of this work.
Hereafter, we adopt a flat CDM cosmology with , and (Planck Collaboration et al., 2016).
2 Observations
In this section, we describe details of the Lyman- line observations in the SPT2349-56 protocluster at .
2.1 MUSE observations
Observations with MUSE at the VLT UT4 were performed in two separate pointings targeting the north and south extensions of the SPT2349-56 protocluster system (Figure 1). MUSE covers the wavelength range 480-930 nm. Each pointing covers roughly 1 square arcmin (). These observations were carried out in the wide field mode (WFM) in service-mode observing as a part of projects 0100.A-0437(A) and 0100.A-0437(B) (PI: M. Aravena) during dark-time. Each pointing was observed for 5 hours (a total of 10 hours) between November 2017 and September 2018. Each pointing consisted of a set of exposures of 680 seconds each, with individual exposures rotated by 90 degrees with respect to each other.
The average seeing of these observations was 0.97 and 0.98 arcsec for the southern and northern pointings, respectively, after correction of air-mass. Weather conditions were classified by ESO as clear (CL; 55%), with high wind (CL-WI; 11%) and photometric conditions (PH; 33%) for all observing blocks (OBs).
We reduced the data using the MUSE pipeline v2.6 (Weilbacher et al., 2014) for bias subtraction, flat-fielding, and wavelength and flux calibration, resulting in a single data cube per each of the 5 OBs per field. We combined the five OB data cubes per field using the MUSE Python Data Analysis Framework (MPDAF; Bacon et al. 2016). The data cubes were merged using a sigma-clipped mean with . Since the field is relatively sparse (especially in Lyman- at ), we used Zurich Atmosphere Purge (ZAP; Soto et al. 2016) to perform a sky subtraction through principal component analysis (PCA). For this process, we used a mask in order to avoid spaxels that contained obvious continuum sources.
2.2 Previous ALMA observations
In this study, we used as reference the images, cubes and location of protocluster members previously identified through ALMA Cycle 5 and 6 observations. These observations and the corresponding data reduction and source identification are described in detail by Miller et al. (2018) and Hill et al. (2020) and we refer the reader to those papers for full details.
In brief, observations of the redshifted [Cii] fine structure line towards the SPT2349-56 system were obtained using ALMA in Band 7. These were centered at a frequency of GHz, yielding an average synthesized beam size of and 3 sensitivities of mJy beam-1. These observations, which cover the full IR-bright region, led to the identification of 24 [Cii] emitters in the field. The MUSE observations described above fully cover the region observed by ALMA in Band 7 at with uniform sensitivity (Fig. 1). Based on the identified [Cii] sources, the mean redshift of the system was determined to be at (Miller et al., 2018; Hill et al., 2020).
2.3 HST imaging
We used HST/Wide Field Camera 3 (WFC3)-IR images under program 15701 (PI: S. Chapman). The target was assigned 2 orbits for the F110W filter and three orbits for the F160W filter in the infrared channels. Dithering was implemented for maximum resolution. The data was reduced using the standard HST pipeline. The pixel size in the WFC3 images is .
3 Results
We used the MUSE observations obtained toward SPT2349-56 to perform a systematic search of Lyman- emission with three methods: a blind automatic search in the cube, creating a narrow band image around the known protocluster redshift and a search for Lyman- emission in (dusty) sources that had previously been identified in this field. Below, we describe each of these searches.
3.1 Blind Search
We performed a blind search for Lyman- emission in the MUSE data cubes, using the Line Source Detection and Cataloguing Tool (LSDCat; Herenz & Wisotzki 2017). For this, we focused on a 4000 km s-1 band centered on the red-shifted () Lyman- wavelength (). The LSDCat routine detects emission lines through an spatial and spectral filtering (3D matched-filtering) approach and sorts them into discrete objects. This method is used to maximise the signal-to-noise ratio (snr) of the entire cube, and thus creating a snr detection cube. To determine an appropriate threshold for detection in the snr cube, we conducted an unbiased line search also in the negative version of our original cube (multiplied by ). Assuming that the noise in this reduced velocity range of the cube is symmetric around 0 and roughly follows a Gaussian distribution, the detections obtained in the negative cube will set the maximum level at which we expect line features produced by noise. From this, we find that the most significant feature in the negative cube is found at (snr)det , thus yielding our detection threshold.
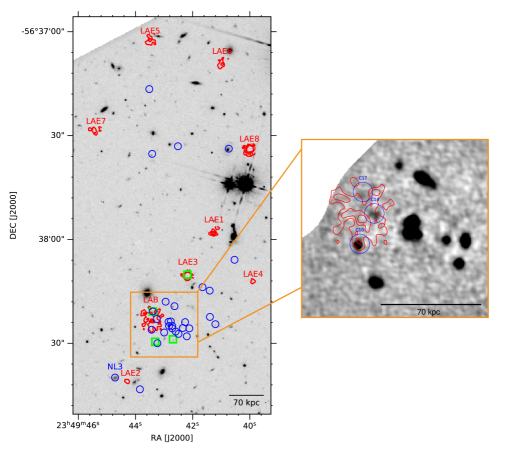
This process yields a significant number of positive features located at the edges of the independent channel images, and with linewidths of one or two channels only, which we remove from our catalogue as they are unphysically narrow. To filter the Lyman- line candidates from spurious positive features, we constrain the full-width at half maximum (FWHM) of the detected lines to the range of widths found for the [Cii] and CO(4-3) lines for sources in the field (Hill et al., 2020), which correspond to km s-1. After this selection process, we identified eight LAE candidates, four in the northern and four in the southern pointing (Figure 2).
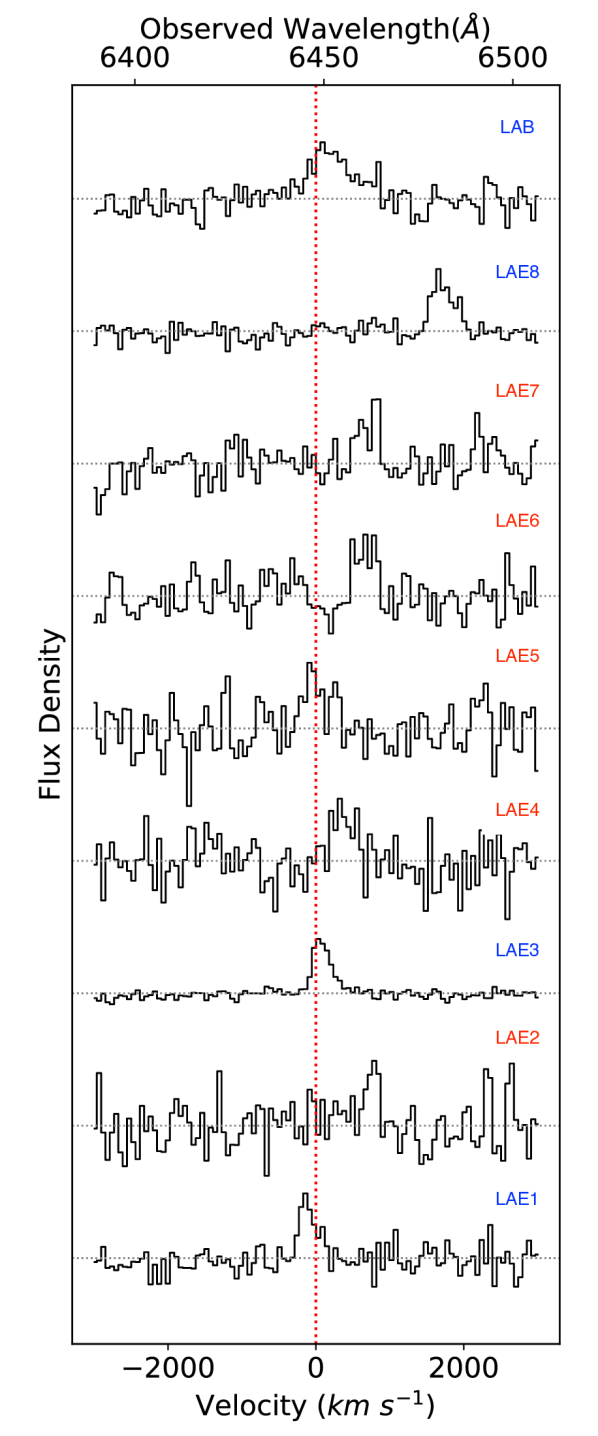
We extracted the spectra of each of the LAE candidates using apertures with radii of 1 arcsec. Due to the more extended spatial nature compared to the other LAEs, we extracted the spectra of sources LAE3 and LAE8 using apertures of 2 arcsec radius (Figure 3). Based on the significance of each of the line candidates measured in these apertures (see Fig. 3 and Table 1), we split the sample in secured LAEs and tentative candidate sources.
Only three sources are securely detected in this fashion (LAE1, LAE3 and LAE8), and the remaining five sources are thus considered tentative detections. All the spectra were manually inspected and searched for other lines that would point to a lower redshift possibility. However, all line detections were consistent with Lyman- at .
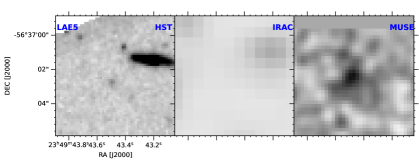
LAE1 is associated with detections in all available broadband images, including , , through band (see Appendix B in Hill et al., 2022). However, if the galaxy is at , we would expect it to be faint in the band due to the Lyman break. Inspection of the HST F110W image (see Fig. 9) suggest that the excess g-band emission comes from a foreground object along the line of sight. Indeed, due to the mismatch between MUSE Lyman- position and the optical broadband position, Hill et al. (2022) lists its photometry as upper limits (see their Table 1). The significance of the detected line and the lack of other line features in the MUSE spectrum strongly favour the spectroscopic confirmation. As a precedent, note that ALMA source C1 (source ‘A’) appears to be well detected in -band, since there is a foreground galaxy as shown in Rotermund et al. (2021).
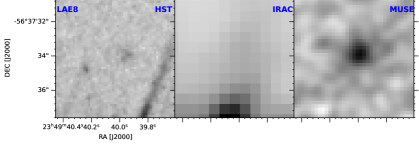
LAE3 and LAE8 are both undetected in the -band and have faint detections in the deep and HST F110W images (see Fig. 9 and Appendix B in Hill et al., 2022). They are significantly detected in Lyman- without other line identifications, and have considerable EWs compared to the other sources identified in this field.
Based on the redshift implied by the identified Lyman- lines, we computed a median velocity offset for all the LAEs in the field with respect to the protocluster redshift (obtained from previous [Cii] and CO identifications; Miller et al., 2018; Hill et al., 2020). The northern and southern LAEs are found to have velocity offsets of and km s-1 respectively, indicating that the Lyman- emissions are systematically redshifted from the center of the protocluster.
3.2 Narrowband Image
To independently search for line emission in the field, we produced a continuum-subtracted narrowband image using a spectrally and spatially smoothed version of the MUSE datacube with LSDCat. We selected as a central wavelength for the image of the Lyman- line redshifted to and a width of 2000 km s-1 (i.e. ). As such, this procedure was specifically designed to search for extended emission. As a result, we found an extended Lyman- structure towards the east of the protocluster core, which we associate with a so-called “Lyman- blob” (LAB, see Figure 2). The Lyman- emission of the LAB subtends a roughly circular region with an area of in the sky ( 70 70), and is located about kpc east of the center of SPT2349-56. With a radius of (34.4 kpc), this yields an area, kpc2 or kpc2.
To obtain a spectrum of this extended emission, we draw a polygon around this source, containing all pixels detected above 2 in the narrowband image (see Figures 2 and 3). Based on the Lyman- profile, we find that the extended feature shows a line with a FWHM of about km s-1 and a velocity offset with respect to the [Cii]/CO protocluster redshift of km s-1. After integrating along the full width of the line emission we obtain a flux of erg cm-2 s-1.
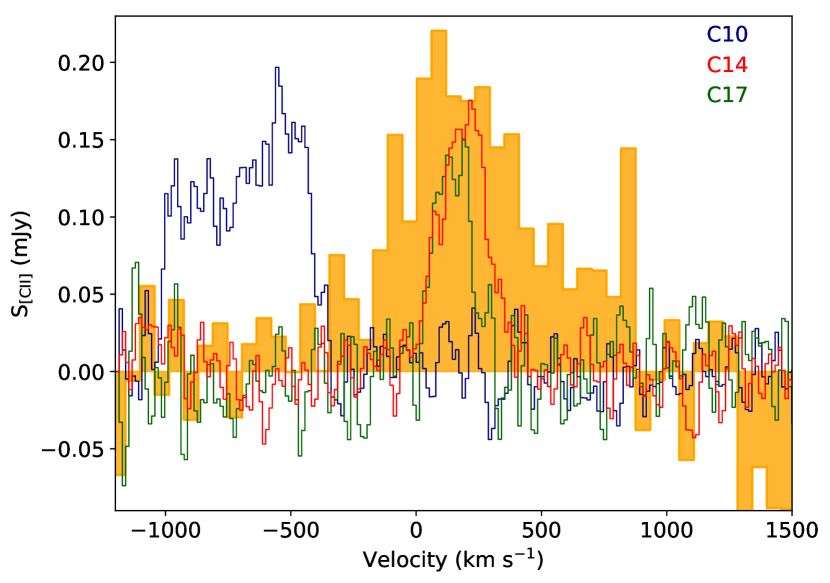
A comparison of the position of the LAB with the location of the previously-identified SMGs in this field (Miller et al., 2018; Hill et al., 2020) shows that three sources overlap spatially with the western part of the blob. These sources, called C10, C14 and C17 using the nomenclature of Hill et al. (2020), were identified based on their bright [Cii] line emission, with fluxes of 2.96, 1.70 and 0.93 Jy km s-1, respectively. These galaxies are not the most luminous in the sample of [Cii] emitters in the SPT2349-56 system, and are located at about 65 kpc from the center of the protocluster.
3.3 Previously Known Protocluster Members
In addition to the independent searches described above, we searched the MUSE datacubes for Lyman- emission at the positions of the previously-identified SMGs in the SPT2349-56 system at . All of these sources have confirmed systemic redshifts based on the identification of the [Cii] and CO(4-3) lines with ALMA (Hill et al., 2020).
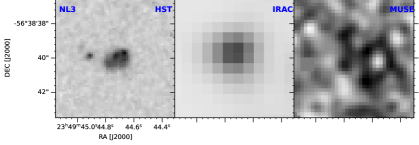
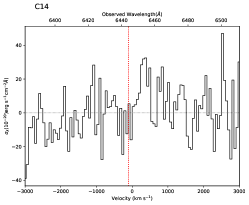
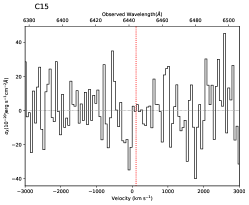
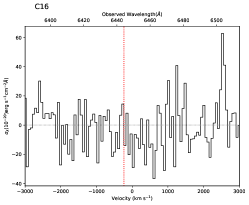
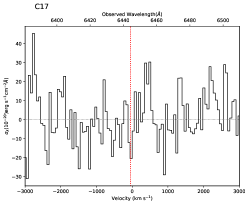
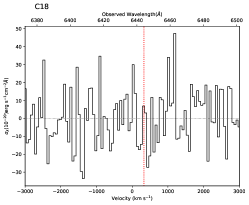
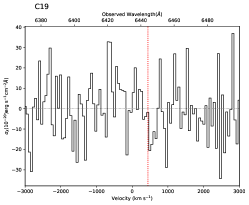
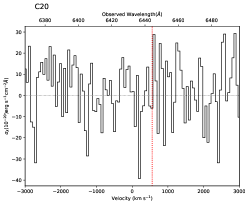
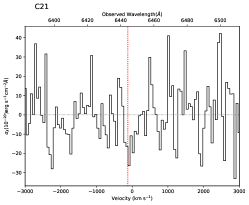
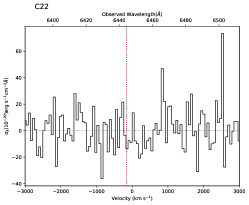
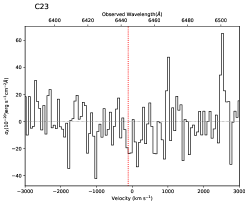
For each of these sources, we extracted a spectrum using apertures with radii of centered at the location of either the [Cii] and CO(4-3) detections (Figure 8). Inside the range of 6000 km s-1 centered at we do not find significant Lyman- emission in any of the previously-confirmed SMGs in the field. However, we do find a tentative detection of Lyman- emission from one of the ALMA continuum sources in this field for which no redshift confirmation was possible using the [Cii] or CO(4-3) lines, source NL3. This source shows possible Lyman- emission at a velocity of -1600 km s-1 from the cluster core redshift (). This velocity is covered by the ALMA CO observations but not by the [Cii] ones. Thus, while the ALMA [Cii] observations missed the line, it is possible that either the source is too faint in CO(4-3) emission or the tentative Lyman- feature is not real. We thus tag this as a tentative candidate here.
We note that stacking of the MUSE spectra to yield a constrain on the average Lyman- emission in these undetected SMGs is difficult. Several studies have demonstrated that the Lyman- emission line does not always trace the galaxies’ systemic redshifts due to IGM scattering and absorption (e.g. Shapley et al., 2003; Song et al., 2014; Hashimoto et al., 2015). Therefore, aligning the MUSE spectra at the [Cii] or CO-derived systemic redshifts or correcting them to the rest-frame will yield a diluted Lyman- stack signal. While corrections for the Lyman--derived to the systemic redshifts (or velocities) as a function of equivalent width have been calibrated, these are statistical in nature and will not yield the precise redshift/velocities necessary for stacking. We do use such corrections in the check to see if the identified LAEs are gravitationally bound to the protocluster core (see next section).
4 Analysis and discussion
4.1 Lyman- emitters
As we showed in the results section, we have found 8 blindly selected LAEs and one LAB. Three of the blind identifications are considered secure and 5 are tentative based on their low significance (see Table 1). As shown in Fig. 2, the LAB and four of the identified LAEs are located in the southern structure, while the rest are located in the north. The locations of the LAEs and candidates range from 95 to 580 kpc from the core of the protocluster and the implied velocities for Lyman- appear redshifted with respect to its systemic redshift.
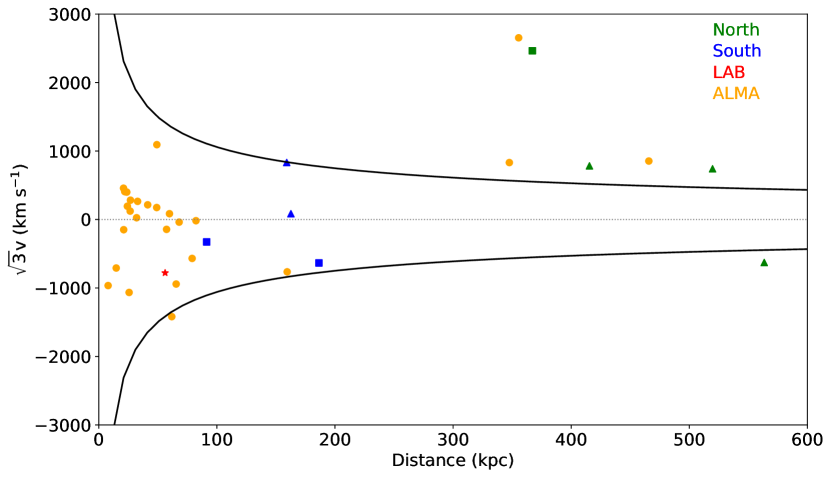
The significant mass of the central core of the protocluster is , making it possible that most of the galaxies identified in the core neighbourhood are gravitationally bound as already shown by Hill et al. (2020). To test whether the identified Lyman- emitters are also bound, which may yield insights into the future evolution of the LAEs within the SPT2349-56 system, we compare the offset velocities of each of the protocluster members as a function of distance from the protocluster core (Fig. 4). For the ALMA-identified protocluster members we show their [Cii]/CO-based velocities, while for the LAEs, we show their Lyman--based velocities. For the later, we obtain a statistical correction to the systemic redshift of each galaxy using the relation described in Verhamme et al. (2018). Galaxies that have velocities lower than the the escape velocity envelope at a given radius from the protocluster core are expected to be bound to the structure. The southern LAEs appear to be consistently associated to the protocluster core, including the LAB. Only one of the identified LAEs in the southern structure (a tentative candidate) resides outside the escape velocity envelope. Conversely, most of the northern LAEs, including the secure LAE8 identification, appear to be unbound and redshifted with respect to the protocluster core yet following the trend of the other [Cii] identified sources. The fact that the northern LAEs follow the velocity offset of the ALMA [Cii] sources in the north, bolsters the interpretation of the northern structure as an unbound/infalling sub-halo (e.g., Miller et al., 2018; Hill et al., 2020). In addition, this supports the idea that the southern structure, which includes the protocluster core is likely already reaching a virialized form.
We compare the number of Lyman- emitters found in the SPT2349-56 field at with the field counts using the ultra-deep MUSE observations in the Hubble Ultra Deep Field (Inami et al., 2017, HUDF mosaic area of arcmin2). Down to a Lyman- luminosity of log(, corresponding to the depth reached by our SPT2349-56 observations, Drake et al. (2017) finds 144 LAEs in the redshift range . The MUSE HUDF observations are deeper than our pointings, and thus are complete to this depth. Considering the redshift range used to search for LAEs in the SPT2349-56 () and the MUSE covered area ( arcmin2), we would thus expect to have found LAEs. This indicates that the detection of 3 secure sources in the SPT2349-56 field are consistent with blank-field counts, and strengthens the case that most of the emission output and mass in this system is associated to heavily dust obscured sources. In this scenario, the existence of a LAB in such complex obscured environment appears as a rare case, where the Lyman- emission is able to escape in a preferential, less obscured direction.
4.2 Insights on the nature of the extended Lyman- emission
As mentioned previously, the extended Lyman- emission found in the MUSE-based narrowband image broadly coincides with the position of three SMGs that were identified as part of the protocluster structure. This suggests a possible physical relationship between them as indicated by previous studies of LABs at high redshift (e.g., Chapman et al., 2001; Umehata et al., 2015; Geach et al., 2016; Oteo et al., 2018).
Cen & Zheng (2013) constructed a model for the origin of extended Lyman- emission in the context of the cold dark matter framework, in which the LAB are produced due to starburst activity. The model incorporates AGN feedback, although it is expected that it should have a subdominant contribution (e.g., Webb et al., 2009). For extended Lyman- emission in a protocluster, each galaxy member contributes to the whole Lyman- emission yielding a variety of sizes and geometries typically found within a contiguous structure. The relative contribution of these DSFGs depends on the dust attenuation of Lyman- photons and the propagation and diffusion process through the circumgalactic medium (CGM) and intergalactic medium (IGM) of each member.
In Figure 5 we compare the Lyman- spectra of the LAB with the [Cii] emission line spectra of the three DSFGs spatially coincident to it: C10, C14 and C17. The [Cii] line emission is expected to trace the kinematics of each host galaxy, and thus probe the galaxies’ systemic velocities and geometries (rotation, merger, etc). Due to obscuration and absorption by the intergalactic medium, the Lyman- spectrum is expected to be redshifted with respect to the galaxies’ systemic velocities, and thus with respect to the [Cii] lines. In this case, the Lyman- spectrum of the LAB is found km s-1 redward of the protocluster core velocity ( km/s) and km s-1 of the C14 and C17 SMGs. A much larger velocity difference is seen between the LAB and the systemic velocity of the C10 galaxy. The inconsistency in velocities for C10 suggest this source might be unrelated to the Lyman- emission. We explore this issue in more detail in the next sections.
4.3 The protocluster core as the origin for the LAB?
The LAB is located kpc to the east of the of the protocluster core, thus being within the protocluster effective radius defined by Hill et al. (2020). Along with the velocity connection between the LAB and the SMGs, this spatial coincidence suggest a physical link between the protocluster core and the LAB. It is thus possible that the powering source of the extended Lyman- emission is star formation or AGN activity in the starbursting SMGs at the protocluster center, where the Lyman- photons are produced in a photon-ionized medium.
In this scenario, it is possible that most of the Lyman- photons along our line of sight are not absorbed and/or scattered but are instead able to escape toward the eastern part of the protocluster core. Indeed, Vernet et al. (2017) observed similar regions with offsets of kpc in the haloes of high redshift AGN-host galaxies, invoking similar arguments.
Following Furlanetto et al. (2005), the Lyman- emission can be used to yield an estimate of the underlying SFR from the powering source. For star formation episodes following a Salpeter initial mass function (Salpeter, 1959) and that two thirds of the ionizing photons are absorbed in the dense ISM, we have:
| (1) |
Taking the value of erg s-1, we obtain a SFR for the extended emission of yr-1, which is orders of magnitude lower than the SFR estimates for any of the SMGs in the field. This is consistent with the idea that most () of the UV radiation is obscured by dust within the SMGs.
Recent radio imaging of the SPT2349-56 field using the Australia Telescope Compact Array (ATCA) and the Australian Square Kilometer Array Pathfinder (ASKAP) found strong radio emission from the protocluster core complex (Chapman et al. in preparation). The steep radio spectrum found clearly indicates that at least one of the three central sources (B, C and G in the nomenclature used by Miller et al., or C3, C6 and C13 following Hill et al.) host a radio AGN. This finding supports the idea that enhanced Lyman- emission at the LAB location is produced by AGN activity at the protocluster core (e.g. Vito et al., 2020).
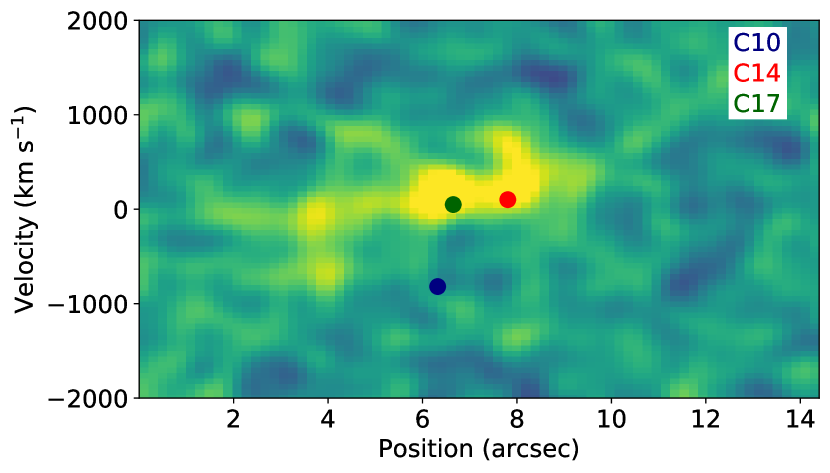
Figure 6 shows a position-velocity (PV) diagram of the Lyman- emission of the LAB, extracted along the x-axis (0 degrees of inclination) towards the west of the MUSE datacube, with a slit width of 14.2 arcsec. Here we note a widespread emission along the central velocity with an extension of 5 arcsec. At the edges, for the more distant structure, the emission goes towards bluer velocities. On the other hand, in the edge closer to the cluster, we have a structure that shifts to positive velocities. Another important issue is the behavior of the luminosity in the PV diagram. We can divide the structure into two different blobs: with the western being brighter than the eastern. This result is in agreement with the spectral line of the LAB, where we observe that the reddest emission is strongest and wider than the bluest emission (Figure 5).
4.4 Modeling the Lyman- spectrum of the extended emission
| Model | Source† | log() | log() | EW(Lyman-) | (Lyman-)‡ | |||
|---|---|---|---|---|---|---|---|---|
| (km s-1) | (cm-2) | (K) | () | (km s-1) | ||||
| 0 | C10 | |||||||
| 1 | C14 | |||||||
| 2 | C17 | |||||||
| 3 | Core |
To further explore the origin of the LAB, we test the idea that either the protocluster core or the galaxies spatially coincident with the LAB are the source of the Lyman- emission.
For this, we use the Lyman- line profile of the LAB and the Lyman- Monte Carlo Radiate Transfer code tlac (Gronke & Dijkstra, 2014; Gronke et al., 2015). We utilize a expanding shell model, which has been widely used in several studies to successfully reproduce the Lyman- profiles of galaxies in different redshifts and environments. The model assumes an homogeneous, spherical shell that expands radially outwards, with uniformly mixed neutral gas (HI) and dust (Verhamme et al., 2006), and the emitting source located at the center of the shell. The shell model is defined by a set of seven parameters including the expanding velocity (), the HI column density (), the dust optical depth (), the effective temperature of the gas (), the systemic redshift of the emitter (), the intrinsic equivalent width of the Lyman- line (EW(Lyman-)) and the intrinsic FWHM of the Lyman- line (FWHM(Lyman-)). For more details on these parameters, we refer the reader to Gronke et al. (2015). Given a constraint for the systemic redshift of the source and the input Lyman- spectrum, the code yields the most likely set of parameters that reproduce the observed spectrum under the assumed geometry.
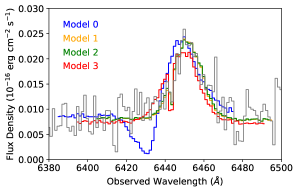
Since we are interested in learning which of the underlying starburst galaxies might be producing the Lyman- emission, we constrain using the [Cii]-based redshifts of each of the possible sources of the Lyman- line: C10 (model ), C14 (model ) and C17 galaxies (model ), and the protocluster core (model ). Instead of simply fixing , we allow for a range in redshift given by the uncertainty around measured [Cii] redshift in each case. Since these ranges overlap, some of the solutions found are similar between each other. The results of this procedure are shown in Figure 7 and listed in Table 2.
We find that the model does not converge into a proper fit to the data, mostly due to the significant difference between the [Cii] redshift and that of the Lyman- line. This forces the model to a high expansion velocity ( km s-1) and low dust optical depth. This solution is less preferred, since the assumed emitting source (the C10 galaxy) is a gas-rich, dusty galaxy contrary to the result of a low dust optical depth.
The best fits are produced when using higher systemic redshifts (models ), which are more consistent with the redshift of the Lyman- line. This is the case for sources C14 and C17, and the protocluster core. In these cases, the solutions are similar, yielding high outflow velocities ( km s-1) and yet very low HI column densities (log(N(HI))). In these cases, the opacities appear to be moderate (), yet more consistent with the dusty nature of the purported emission sources. Based on these results alone it is hard to disentangle the origin of the LAB. However, if the protocluster core starbursting galaxies are producing the Lyman- emission it would require a complex patchy geometry where some of the UV radiation escapes and illuminates the HI gas in the LAB direction. While this is a plausible scenario, supported by the moderate optical depth of this solution (model 3), such solution is less likely than the scenario where the UV radiation is produced in-situ by either the C14, the C17 an/or both galaxies.
5 Summary and conclusions
We presented a census of Lyman- emission toward the IR-bright protocluster SPT2349-56 at obtained using MUSE observations. Through a blind search of Lyman- emission towards the protocluster core and northern extension, we found three LAEs at distances kpc from the protocluster core. The LAEs are bound to the protocluster core and all of them are redshifted relative to SPT2349-56. Only one of the ALMA SMGs previously identified in this field is tentatively detected in Lyman-.
Using a continuum-subtracted narrowband image we detect extended Lyman- emission, which we refer to as a LAB, with a size of about 70 kpc across, located at kpc to the east of the protocluster core. The bulk of the LAB emission is also redshifted with respect to the core of the protocluster, in agreement with a red-skewed asymmetric profile.
Two of the spatially overlapping DSFGs C14 and C17, are found to also coincide spectrally, when comparing their [Cii] emission lines with that of the Lyman- emission from the LAB (Miller et al., 2018; Hill et al., 2020). This observation could be explained by the high star-formation activity seen in the DSFG protocluster members. Based on their locations and redshifts, the main suspects to be producing the ionizing photons and thus the Lyman- emission are the C14 and C17 DSFGs, or the protocluster core. In the later case, the geometry of the dust distribution should allow the Lyman- photons to get scattered from the core such that the photons find a region to escape to the east. Such scenarios are supported by radiative transfer modeling of the Lyman- line profile of the LAB.
We do not find an overdensity of LAEs, or a source density comparable to what we might have expected from the number of [CII] and submillimeter continuum sources found in this field. We interpret this as a structure that is still heavily dust obscured and dominated by submm-detected galaxies.
Acknowledgements.
This paper makes use of the following ALMA data: ADS/JAO.ALMA#2017.1.00273.S; and ADS/JAO.ALMA#2018.1.00058.S. ALMA is a partnership of ESO (representing its member states), NSF (USA) and NINS (Japan), together with NRC (Canada), MOST and ASIAA (Taiwan), and KASI (Republic of Korea), in cooperation with the Republic of Chile. The Joint ALMA Observatory is operated by ESO, AUI/NRAO, and NAOJ. Y.A. acknowledges partial support from Comité Mixto ESO - Gobierno de Chile. MA acknowledges support from FONDECYT grant 1211951, CONICYT + PCI + INSTITUTO MAX PLANCK DE ASTRONOMIA MPG190030 and CONICYT+PCI+REDES 190194. This work was partially funded by the ANID BASAL project FB210003. T.A. acknowledges support from the Millennium Science Initiative ICN12_009. D.N. acknowledges support from the US NSF under grant 1715206 and Space Telescope Science Institute under grant AR-15043.0001. J.D.V. and S.J. acknowledge support from the US NSF under grants AST-1715213 and AST-1716127. S.J. acknowledge support from the US NSF NRAO under grants SOSPA5-001 and SOSPA7-006, and SOSPA4-007, respectively. J.D.V. acknowledges support from an A. P. Sloan Foundation Fellowship. E.J.J. acknowledges support from FONDECYT Iniciación en investigación 2020 Project 11200263.References
- Aravena et al. (2010) Aravena, M., Bertoldi, F., Carilli, C., et al. 2010, ApJ, 708, L36
- Bacon et al. (2016) Bacon, R., Piqueras, L., Conseil, S., Richard, J., & Shepherd, M. 2016, MPDAF: MUSE Python Data Analysis Framework
- Baugh et al. (1998) Baugh, C. M., Cole, S., Frenk, C. S., & Lacey, C. G. 1998, ApJ, 498, 504
- Cantalupo (2017) Cantalupo, S. 2017, Astrophysics and Space Science Library, Vol. 430, Gas Accretion and Giant Ly Nebulae, ed. A. Fox & R. Davé, 195
- Capak et al. (2011) Capak, P. L., Riechers, D., Scoville, N. Z., et al. 2011, Nature, 470, 233
- Carlstrom et al. (2011) Carlstrom, J. E., Ade, P. A. R., Aird, K. A., et al. 2011, PASP, 123, 568
- Casey et al. (2015) Casey, C. M., Cooray, A., Capak, P., et al. 2015, ApJ, 808, L33
- Cen & Zheng (2013) Cen, R. & Zheng, Z. 2013, ApJ, 775, 112
- Chapman et al. (2009) Chapman, S. C., Blain, A., Ibata, R., et al. 2009, ApJ, 691, 560
- Chapman et al. (2001) Chapman, S. C., Lewis, G. F., Scott, D., et al. 2001, ApJ, 548, L17
- Chiang et al. (2013) Chiang, Y.-K., Overzier, R., & Gebhardt, K. 2013, ApJ, 779, 127
- Croft et al. (2005) Croft, S., Kurk, J., van Breugel, W., et al. 2005, AJ, 130, 867
- Daddi et al. (2009) Daddi, E., Dannerbauer, H., Stern, D., et al. 2009, ApJ, 694, 1517
- De Lucia & Blaizot (2007) De Lucia, G. & Blaizot, J. 2007, MNRAS, 375, 2
- Drake et al. (2017) Drake, A. B., Garel, T., Wisotzki, L., et al. 2017, A&A, 608, A6
- Everett et al. (2020) Everett, W. B., Zhang, L., Crawford, T. M., et al. 2020, ApJ, 900, 55
- Furlanetto et al. (2005) Furlanetto, S. R., Schaye, J., Springel, V., & Hernquist, L. 2005, ApJ, 622, 7
- Galametz et al. (2013) Galametz, A., Stern, D., Pentericci, L., et al. 2013, A&A, 559, A2
- Geach et al. (2016) Geach, J. E., Narayanan, D., Matsuda, Y., et al. 2016, ApJ, 832, 37
- Gronke et al. (2015) Gronke, M., Bull, P., & Dijkstra, M. 2015, ApJ, 812, 123
- Gronke & Dijkstra (2014) Gronke, M. & Dijkstra, M. 2014, MNRAS, 444, 1095
- Hashimoto et al. (2015) Hashimoto, T., Verhamme, A., Ouchi, M., et al. 2015, ApJ, 812, 157
- Herenz & Wisotzki (2017) Herenz, E. C. & Wisotzki, L. 2017, A&A, 602, A111
- Hezaveh et al. (2013) Hezaveh, Y. D., Marrone, D. P., Fassnacht, C. D., et al. 2013, ApJ, 767, 132
- Hill et al. (2022) Hill, R., Chapman, S., Phadke, K. A., et al. 2022, MNRAS, 512, 4352
- Hill et al. (2020) Hill, R., Chapman, S., Scott, D., et al. 2020, MNRAS
- Inami et al. (2017) Inami, H., Bacon, R., Brinchmann, J., et al. 2017, A&A, 608, A2
- Kurk et al. (2000) Kurk, J. D., Röttgering, H. J. A., Pentericci, L., et al. 2000, A&A, 358, L1
- Magliocchetti et al. (2013) Magliocchetti, M., Popesso, P., Rosario, D., et al. 2013, MNRAS, 433, 127
- Matsuda et al. (2004) Matsuda, Y., Yamada, T., Hayashino, T., et al. 2004, AJ, 128, 569
- Miley & De Breuck (2008) Miley, G. & De Breuck, C. 2008, A&A Rev., 15, 67
- Miller et al. (2018) Miller, T. B., Chapman, S. C., Aravena, M., et al. 2018, Nature, 556, 469
- Miller et al. (2015) Miller, T. B., Hayward, C. C., Chapman, S. C., & Behroozi, P. S. 2015, MNRAS, 452, 878
- Oteo et al. (2018) Oteo, I., Ivison, R. J., Dunne, L., et al. 2018, ApJ, 856, 72
- Overzier (2016) Overzier, R. A. 2016, A&A Rev., 24, 14
- Pentericci et al. (1997) Pentericci, L., Roettgering, H. J. A., Miley, G. K., Carilli, C. L., & McCarthy, P. 1997, A&A, 326, 580
- Pike et al. (2014) Pike, S. R., Kay, S. T., Newton, R. D. A., Thomas, P. A., & Jenkins, A. 2014, MNRAS, 445, 1774
- Planck Collaboration et al. (2016) Planck Collaboration, Ade, P. A. R., Aghanim, N., et al. 2016, A&A, 594, A13
- Reuter et al. (2020) Reuter, C., Vieira, J. D., Spilker, J. S., et al. 2020, ApJ, 902, 78
- Rigby et al. (2014) Rigby, E. E., Hatch, N. A., Röttgering, H. J. A., et al. 2014, MNRAS, 437, 1882
- Rotermund et al. (2021) Rotermund, K. M., Chapman, S. C., Phadke, K. A., et al. 2021, MNRAS, 502, 1797
- Salpeter (1959) Salpeter, E. E. 1959, ApJ, 129, 608
- Shapley et al. (2003) Shapley, A. E., Steidel, C. C., Pettini, M., & Adelberger, K. L. 2003, ApJ, 588, 65
- Smolčić et al. (2017) Smolčić, V., Novak, M., Delvecchio, I., et al. 2017, A&A, 602, A6
- Song et al. (2014) Song, M., Finkelstein, S. L., Gebhardt, K., et al. 2014, ApJ, 791, 3
- Soto et al. (2016) Soto, K. T., Lilly, S. J., Bacon, R., Richard, J., & Conseil, S. 2016, MNRAS, 458, 3210
- Spilker et al. (2016) Spilker, J. S., Marrone, D. P., Aravena, M., et al. 2016, ApJ, 826, 112
- Steidel et al. (2000) Steidel, C. C., Adelberger, K. L., Shapley, A. E., et al. 2000, ApJ, 532, 170
- Umehata et al. (2015) Umehata, H., Tamura, Y., Kohno, K., et al. 2015, ApJ, 815, L8
- Venemans et al. (2002) Venemans, B. P., Kurk, J. D., Miley, G. K., et al. 2002, ApJ, 569, L11
- Venemans et al. (2005) Venemans, B. P., Röttgering, H. J. A., Miley, G. K., et al. 2005, A&A, 431, 793
- Venemans et al. (2007) Venemans, B. P., Röttgering, H. J. A., Miley, G. K., et al. 2007, A&A, 461, 823
- Venemans et al. (2004) Venemans, B. P., Röttgering, H. J. A., Overzier, R. A., et al. 2004, A&A, 424, L17
- Verhamme et al. (2018) Verhamme, A., Garel, T., Ventou, E., et al. 2018, MNRAS, 478, L60
- Verhamme et al. (2006) Verhamme, A., Schaerer, D., & Maselli, A. 2006, A&A, 460, 397
- Vernet et al. (2017) Vernet, J., Lehnert, M. D., De Breuck, C., et al. 2017, A&A, 602, L6
- Vieira et al. (2010) Vieira, J. D., Crawford, T. M., Switzer, E. R., et al. 2010, ApJ, 719, 763
- Vieira et al. (2013) Vieira, J. D., Marrone, D. P., Chapman, S. C., et al. 2013, Nature, 495, 344
- Vito et al. (2020) Vito, F., Brandt, W. N., Lehmer, B. D., et al. 2020, A&A, 642, A149
- Wang et al. (2021) Wang, G. C. P., Hill, R., Chapman, S. C., et al. 2021, MNRAS, 508, 3754
- Webb et al. (2009) Webb, T. M. A., Yamada, T., Huang, J. S., et al. 2009, ApJ, 692, 1561
- Weilbacher et al. (2014) Weilbacher, P. M., Streicher, O., Urrutia, T., et al. 2014, Astronomical Society of the Pacific Conference Series, Vol. 485, The MUSE Data Reduction Pipeline: Status after Preliminary Acceptance Europe, ed. N. Manset & P. Forshay, 451
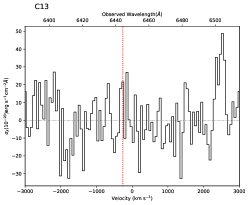
Appendix A Lyman- spectra toward the SPT2349-56 DSFGs
The following figures show the observed MUSE spectra toward all the DSFGs in the SPT2349-56 system, centered at the expected location of the Lyman- line emission.
![[Uncaptioned image]](/html/2301.01328/assets/x8.png)
![[Uncaptioned image]](/html/2301.01328/assets/x9.png)
![[Uncaptioned image]](/html/2301.01328/assets/x10.png)
![[Uncaptioned image]](/html/2301.01328/assets/x11.png)
![[Uncaptioned image]](/html/2301.01328/assets/x12.png)
![[Uncaptioned image]](/html/2301.01328/assets/x13.png)
![[Uncaptioned image]](/html/2301.01328/assets/x14.png)
![[Uncaptioned image]](/html/2301.01328/assets/x15.png)
![[Uncaptioned image]](/html/2301.01328/assets/x16.png)
![[Uncaptioned image]](/html/2301.01328/assets/x17.png)
![[Uncaptioned image]](/html/2301.01328/assets/x18.png)
![[Uncaptioned image]](/html/2301.01328/assets/x19.png)

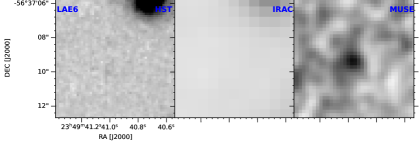
Appendix B Detected and confirmed Lyman- emitters maps at different wavelength
![[Uncaptioned image]](/html/2301.01328/assets/x32.png)
![[Uncaptioned image]](/html/2301.01328/assets/x33.png)
![[Uncaptioned image]](/html/2301.01328/assets/x34.png)
![[Uncaptioned image]](/html/2301.01328/assets/x35.png)