A search for variable subdwarf B stars in TESS Full Frame Images
III. An update on variable targets in both ecliptic hemispheres – contamination analysis and new sdB pulsators
Abstract
We present an update on the variable star survey performed on the TESS 30 min Full Frame Image (FFI) data reported by our first two papers in this series. This update includes a contamination analysis in order to identify false positives and analysis of the TESS 10 min FFI data collected during Years 3 and 4 of the mission. We clarify the variability status of 2 995 targets identifying 1 403 variable stars. In addition, we spectroscopically classify 24 pre-filtered targets sampled with the 10 min FFI data and discover 11 new sdB pulsators. Future follow-up space- and/or ground-based data of variables reported here, to identify the nature of their variability and reveal spectroscopic parameters of the stars, would complement this work.
keywords:
Stars: subdwarfs – Stars: oscillations (including pulsations) – asteroseismology1 Introduction
Sahoo et al. (2020) (Paper I) and Baran et al. (2021) (Paper II) presented their results of variability checks of the most promising subdwarf B (sdB) candidates found in the Geier et al. (2019) and Geier (2020) catalogs. The former authors pre-selected 45 674 targets and used the Full Frame Images (FFI) collected by the TESS mission in the Southern Ecliptic Hemisphere (SEH) during Year 1 and in the Northern Ecliptic Hemisphere (NEH) during Year 2. As a result, 2 313 new variable targets in both ecliptic hemispheres were listed.
It is a well known feature of the TESS CCDs that an individual pixel has a 21 arcsec square projection on the sky. This makes contamination a serious problem. A contaminating star contributes by either increasing the average flux level in an aperture, thus lowering the apparent amplitude of flux variation in the target, or – if variable – makes a constant flux target star a false positive variable. The former issue can be corrected by removing the estimated amount of a contaminating star’s flux and this is fairly well achieved in the Pre-search Data Conditioning fluxes. The latter issue can only be resolved by checking the variability of all contaminators around the target of interest. We also found this method useful to resolve variability in case both the target of interest and contaminator are variables.
In this work, we aimed to remove false positives from our list of 2 313 new variable objects. We searched all pixels within the target masks of all 2 313 objects listed in Papers I and II. In addition, for the most promising pulsating subdwarf candidates, we retrieved the new light curves from the FFI collected during Years 3 and 4, which are sampled at a 10 min cadence. This cadence extends the Nyquist frequency up to 833.3 Hz, which allows us to cover the entire gravity mode region in an amplitude spectrum111In hot subdwarfs, pressure or p-mode pulsations typically have periods of a few minutes; gravity or g-modes have periods of the order of an hour. See, for example, Heber (2016).. By promising candidates, we mean objects that in Papers I and II show signals close to the Nyquist frequency of 277.7 Hz resulting from the 30 min cadence of observation used during Years 1 and 2.
To summarize the findings reported in Paper I and II, there are 15 pulsating subdwarf B star candidates, 79 variable (other than pulsating) sdB stars, 33 variable subdwarf candidates and 2 186 other variable stars, including 123 stars with non-sd classification.
Data are downloaded and processed in the same way as explained in Papers I and II. For a convenient comparison, the Tables presented here will preserve the listing order from the previous papers of this series, however some of the tables from Paper I are merged to be consistent with those in Paper II. They also contain the most important information from Papers I and II with additional information resulting from this work. In the following sections, we explain the details of the contamination analysis and provide the results of this work.
2 contamination analysis
We defined each target mask as a square of 11 11 pixels, which provides enough pixels to clarify contamination, if any. We used our custom PYTHON scripts to retrieve fluxes separately from each pixel in a 3 3 pixel square centered at a given target. Then, for each of the nine pixels, we calculated an amplitude spectrum and checked if the signals reported in Papers I and II is detected in pixels that overlap with the location of the target. We employed either PanSTARRS or DSS images and overlapped them with target pixel files (TPF) created from the TESSCUT tool (Brasseur et al., 2019). In specific cases, that is, bright stars in target masks, even though far enough from our targets not to contaminate them, we calculated the amplitude spectra in pixels covering these stars to check for their variability. As a result of our contamination analysis, we derived a few common cases, listed below (the columns refer to Tables in the online materials):
| G | Period | Variable | ||||
| No. | Gaia DR2 | TIC | Name | [mag] | [d] | contaminator |
| sdBVs | ||||||
| 1 | 3129751228471383808 | 237597052 | TYC 161-49-1 | 11.14 | 0.05-0.1 | none |
| 2 | 3159937564294110080 | 262753627 | TYC 770-941-1 | 12.46 | 0.04-0.08 | none |
| Phased lightcurves | ||||||
| 1 | 2333936291513550336 | 12379252 | Ton S138 | 16.01 | 0.2648 | none |
| 2 | 2385348183917624448 | 9035375 | PHL 460 | 12.21 | 0.4734 | none |
| 3 | 2969438206889996160 | 139397815 | - | 13.61 | 0.2746 | none |
| G | Period | Variable | ||||
|---|---|---|---|---|---|---|
| No. | Gaia DR2 | TIC | Name | [mag] | [d] | contaminator |
| sdBVs | ||||||
| 1 | 1028374599849118976 | 802232206 | SDSSJ082428.41+512601.6 | 18.72 | 0.1734 | CRTS J082433.5+512441 (EB) |
| 2 | 127674641678296704 | 353892824 | KUV02281+2730 | 15.15 | 0.0487 | none |
| 3 | 1345049483546987904 | 159850392 | GALEXJ17566+4125 | 14.28 | 0.08 - 0.13 | none |
| 4 | 1469357759922416256 | 321423000 | SDSSJ132432.37+320420.9 | 16.64 | 0.0907 | TIC 321422994 |
| 5 | 1495329392800826624 | 23746001 | PG1350+372 | 14.31 | 0.06 - 0.09 | none |
| G | Period | Variable | ||||
|---|---|---|---|---|---|---|
| No. | Gaia DR2 | TIC | Name | [mag] | [d] | contaminator |
| sdVs | ||||||
| 1 | 1906485375099435136 | 259091223 | FBS2209+354 | 14.30 | 0.07-0.13 | no signal in individual pixels |
| 2 | 1952553606634620928 | 407657360 | LAMOSTJ214600.31+372119.7 | 14.66 | 0.045 - 0.1 | TIC 407657373 |
| 3 | 2041883531914920064 | 20688004 | GALEXJ18578+3048 | 13.73 | 0.1726 | ATO J284.4865+30.8044 (EB candidate) |
| 4 | 2128012018629286144 | 1882679963 | KeplerJ19352+4555 | 17.16 | 0.1766 | ATO J293.8168+45.8972 (EB candidate) |
| 5 | 237650985848157312 | 194781979 | LAMOSTJ032717.71+410344.5 | 10.19 | 0.1594 | none |
| G | Variable | |||
|---|---|---|---|---|
| No. | Gaia DR2 | TIC | [mag] | contaminator |
| 1 | 2921500461998485248 | 744231977 | 18.31 | TYC 6526-2198-1 |
| 2 | 2927637764107094272 | 744958933 | 18.67 | ATO J106.3086-23.5750 |
| 3 | 3062196993541803904 | 754827446 | 17.45 | TYC 4817-751-1 |
| 4 | 3087146252404755584 | 257068255 | 15.08 | none |
| 5 | 3111790534231122944 | 284329074 | 15.26 | TYC 163-370-1 |
| G | Variable | |||
|---|---|---|---|---|
| No. | Gaia DR2 | TIC | [mag] | contaminator |
| 1 | 1422182595056481536 | 320525680 | 13.87 | no signal in individual pixels |
| 2 | 1943952161530528256 | 431548978 | 15.61 | no signal in individual pixels |
| 34.14 Hz: none; | ||||
| 3 | 1974973679520560896 | 311792028 | 15.88 | 95.37 Hz+harmonics: TYC 3605-1317-1 (V) |
| 4 | 1988552407605096320 | 66784300 | 14.88 | TIC 66784249 |
| 5 | 1991879937806406656 | 2044241813 | 18.47 | NSVS 1502401 (EB) |
| G | Period | Variable | |||
| No. | Gaia DR2 | TIC | [mag] | [d] | contaminator |
| 32 eclipsing binaries that show both primary and secondary eclipses | |||||
| 1 | 2938186341221700480 | 60523137 | 16.23 | 1.2532 | none |
| 2 | 3056677303432024960 | 753916356 | 17.97 | 2.4282 | TIC 68060528 |
| 3 | 4037952609036313728 | 1556986400 | 18.86 | 4.2844 | TIC 368875977 |
| 4 | 4038037855601783296 | 1557298522 | 17.18 | 2.9735 | TYC 7404-5579-1 |
| 5 | 4044609357370901632 | 1569961982 | 16.46 | 2.415 | RS Sgr (B3/4IV/V, EB) |
| G | Period | Variable | |||
| No. | Gaia DR2 | TIC | [mag] | [d] | contaminator |
| Eclipsing binaries that show only primary eclipses | |||||
| 49.77 Hz+harmonics: none; | |||||
| 1 | 1131845039229607680 | 459182998 | 16.16 | 0.2344 | 6.94 Hz+harmonic: TIC 459183003 |
| 2 | 1417117518648285056 | 1400704733 | 17.03 | 0.3637 | none |
| 3 | 1816806183083980288 | 1943324398 | 17.22 | 1.3135 | HD 195052 (F8) |
| 4 | 1840900601716813440 | 1951174238 | 18.92 | 1.0329 | TIC 126684646 |
| 5 | 1846629538332584960 | 15040115 | 11.83 | 0.8099 | none |
| G | Period | Variable | |||
|---|---|---|---|---|---|
| No. | Gaia DR2 | TIC | [mag] | [d] | contaminator |
| One symmetric maximum | |||||
| 1 | 2896588449084891136 | 49547169 | 13.28 | 0.3086 | IS CMa (F3V) |
| 2 | 2905822663130146688 | 31353391 | 14.03 | 0.8929 | none |
| 3 | 2909497952544966272 | 37118148 | 14.28 | 0.2681 | none |
| 4 | 2911497105202950400 | 37004041 | 15.16 | 0.2833 | none |
| 5 | 2921050693020996864 | 63113578 | 11.45 | 0.4854 | none |
| G | Period | Variable | |||
|---|---|---|---|---|---|
| No. | Gaia DR2 | TIC | [mag] | [d] | contaminator |
| One symmetric maximum | |||||
| 1 | 1000519267329142144 | 444946935 | 15.92 | 1.6725 | none |
| 2 | 1086341235118052096 | 85158691 | 12.85 | 0.3546 | none |
| 3 | 1099487030500185344 | 743328948 | 16.90 | 0.3297 | none |
| 4 | 1133795950814826240 | 841399917 | 17.31 | 1.5134 | none |
| 5 | 1141625057721183616 | 138400883 | 16.24 | 0.0680 | none |
| G | Variable | ||||
|---|---|---|---|---|---|
| No. | Gaia DR2 | TIC | Name | [mag] | contaminator |
| 1 | 5207384891323130368 | 735128403 | AH Men | 13.51 | none |
| 2 | 6544371342567818496 | 121422158 | RZ Gru | 12.63 | none |
| G | Variable | |||
|---|---|---|---|---|
| No. | Gaia DR2 | TIC | [mag] | contaminator |
| 1 | 2326333512204996992 | 380826878 | 15.69 | none |
| 2 | 2342907791000463232 | 610076106 | 17.18 | [SHM2017] J013.19449-26.56892 (RR Lyr) |
| 3 | 2342907962798690944 | 610077229 | 16.68 | [SHM2017] J013.19449-26.56892 (RR Lyr) |
| 4 | 2409630520260038784 | 2052262357 | 18.09 | Cl* NGC 7492 C 1306 (RR Lyr) |
| 5 | 2410677839445234944 | 111183765 | 14.48 | none |
| G | Variable | |||
|---|---|---|---|---|
| No. | Gaia DR2 | TIC | [mag] | contaminator |
| 1 | 1082306439760979840 | 743148169 | 18.81 | TIC 284473271 |
| 2 | 1107705772542003200 | 705157619 | 18.09 | no signal in individual pixels |
| 3 | 1108642968765677696 | 743476657 | 18.74 | V486 Cam (RR Lyr) |
| 4 | 1112770367915047424 | 705166070 | 17.41 | none |
| 5 | 1113516073020001152 | 705175423 | 18.32 | TIC 468921975 |
| G | Period | Variable | ||||
|---|---|---|---|---|---|---|
| No. | Gaia DR2 | TIC | [mag] | spT | [d] | contaminator |
| Pulsators | ||||||
| 1 | 2969201399574096128 | 708596809 | 11.30 | A0IV/V | - | no signal in individual pixels |
| 2 | 3109409266919646976 | 168595004 | 10.70 | A5 | - | none |
| 3 | 3115125211261708032 | 293137161 | 11.01 | A0 | - | none |
| 4 | 3344114626761364224 | 437889214 | 10.02 | B5 | - | none |
| 5 | 3396397877830881792 | 247513086 | 8.17 | A0 | - | none |
| G | Period | Variable | ||||
|---|---|---|---|---|---|---|
| No. | Gaia DR2 | TIC | [mag] | spT | [d] | contaminator |
| Pulsators | ||||||
| 1 | 1625627602365544832 | 198209459 | 13.53 | B2 | - | none |
| 2 | 1713032695100155904 | 298091568 | 15.00 | B4.1 | - | none |
| 3 | 1861191062326013696 | 1955410399 | 10.31 | A0 | - | none |
| 11 Hz+harmonics: none; | ||||||
| 4 | 2077737678383889408 | 270610177 | 11.77 | Be | - | 46 - 70 Hz: UCAC4 663-077912 (PulV) |
| 5 | 2132171608553758336 | 279919275 | 13.46 | B3V | - | none |
-
•
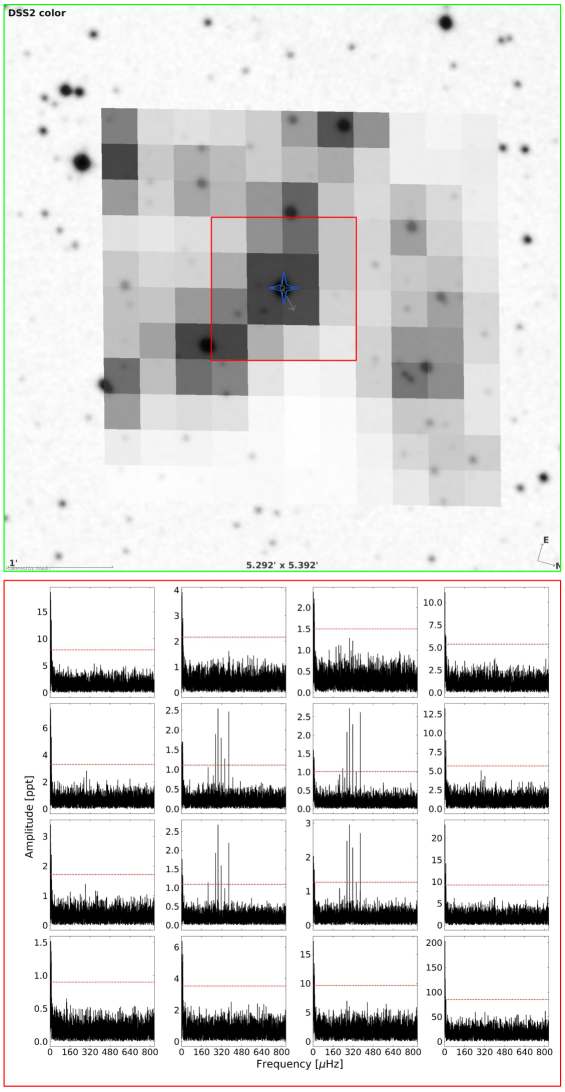
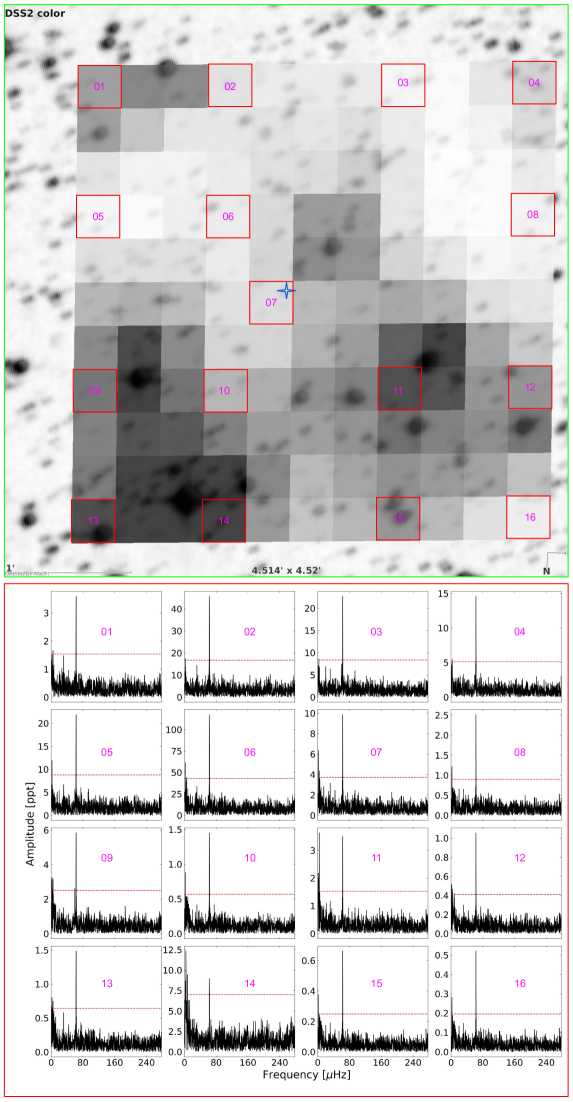
A signal comes only from the target star, which means no contamination and the target listed in Papers I and II is the source of the variability (Figure 1). In the variable contaminator column of Tables 1-14, we marked these cases with none.
-
•
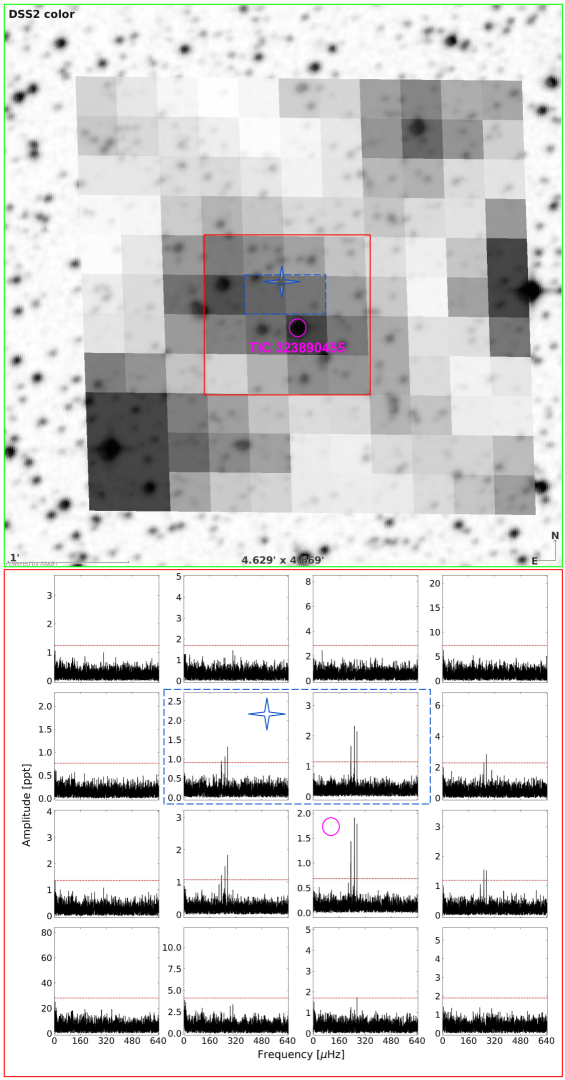
A signal comes from a contaminating object (Figure 2). These cases have the name of the contaminator listed in the variable contaminator column. In parentheses, we added additional information on the contaminators collected from the simbad database. If these contaminators are new variable stars, then they are also listed in Table 16. This is a false positive case.
-
•
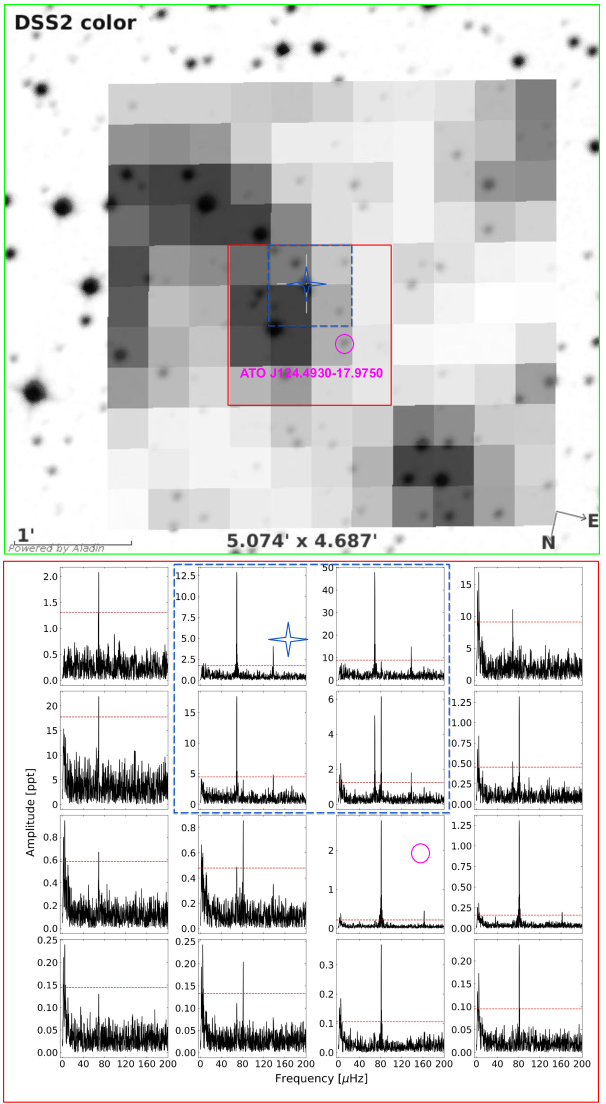
A signal comes from both the target and contaminating object(s) (Figure 3). These cases will have frequencies assigned to either our target (marked as none) or contaminator(s) listed in the variable contaminator column. This is the case of a variable target showing an additional signal, which is a false positive.
-
•
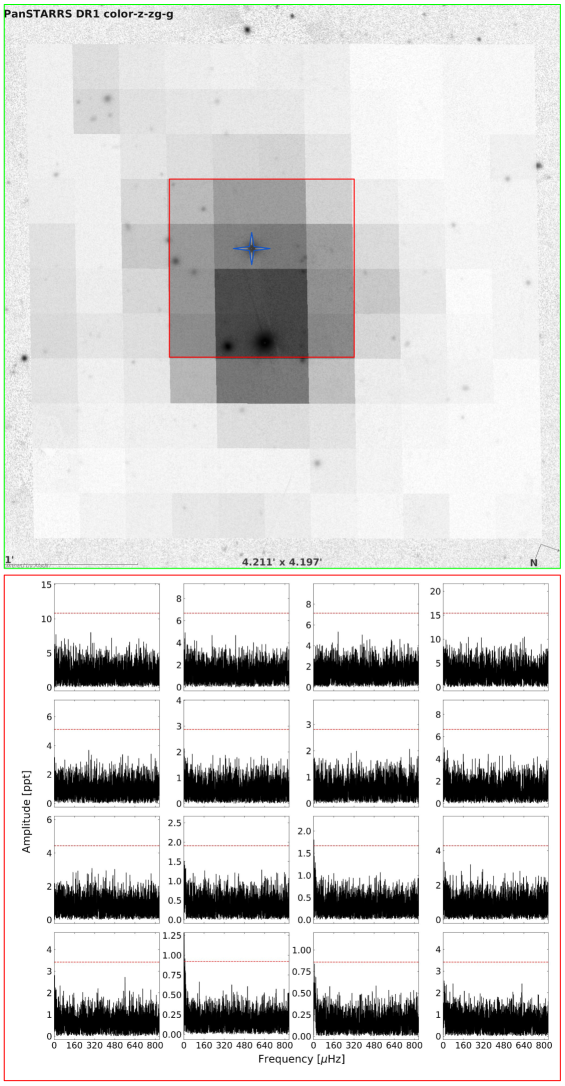
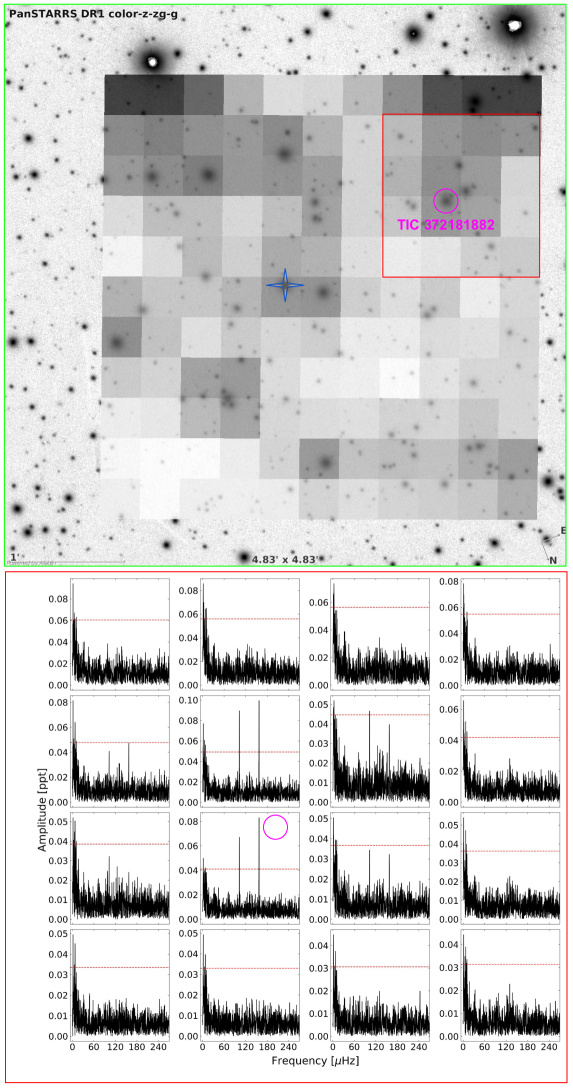
No signal is detected in single pixels (Figure 4). These cases are caused by low S/N in merged pixels defined in Papers I and II. In the variable contaminator column we marked these cases with no signal in individual pixels. This case is not verified, however remarks on nearby stars listed in tables in Papers I and II give some clue on the possible contamination.
-
•
A signal is detected in all pixels across a target mask (Figure 5). In the variable contaminator column we marked these cases with signal in all pixels. This is a false positive case. The source of the signal is either a nearby bright object that shines over a large area or an instrumental artifact.
-
•
A nearby non-contaminating bright object (within the target mask) has been verified positively for its variability (Figure 6). These new variable stars are listed in Table 16.
The full tables with remarks of our contamination analysis are presented in the online materials. The most interesting conclusions of our contamination analysis are the following:
-
•
Among two sdBV candidates from Paper I, TIC 237597052, is no longer considered a candidate. It turned out to be a main sequence B8 star (Table 1). Our fit to a spectrum which we collected from the LAMOST survey provides the following atmospheric parameters, Teff = 12 460(300) K, = 4.17(12). The other candidate is a confirmed sdB star, so TIC 262753627 is a new sdB pulsator.
-
•
Out of 13 sdBV candidates listed in Paper II, five are no longer considered the sources of the signal. Apart from these five contaminated targets, TIC 363766470 is also partially contaminated by ATO J265.8117+21.5538. However, our target is still the source of the 116.44 Hz frequency. The contamination of one case could not be verified, while the remaining seven sdBs including TIC 363766470 are confirmed pulsators. ATO J265.8117+21.5538 is listed in the simbad database as an eclipsing binary candidate and we confirm this type by detecting signal at a frequency of 41.09 Hz along with its harmonics. We determined an orbital period of 0.28169 days (Table 2).
-
•
Among 66 other (than the above) variable sdBs listed in Papers I and II, we found 14 not to be the sources of the variable signals. Six cases are not verified. The remaining 46 are confirmed variable sdBs (Tables 1 and 2).
-
•
Out of 10 sdV candidates listed in Paper II, four are no longer considered to be the sources of the signals, while TIC 194781979 was identified as a main sequence B6 star. One case is not verified. The remaining four sdVs are confirmed pulsating candidates (Table 3).
-
•
Among 23 other (than the above) variable sdVs listed in Paper II, we found seven targets not to be the sources of the signal. Four cases are not verified. The remaining 12 sdVs are confirmed variables (Table 3).
-
•
Among 113 spectroscopically unclassified pulsators, we found 68 targets not to be the sources of the signal. Seven cases are not confirmed. The remaining 38 original targets are confirmed pulsators. In the case of TIC 311792028, the 95.37 Hz frequency along with its harmonics are native to TIC 311792021, while the 34.14 Hz frequency originating in our target does not seem to be related to pulsations (Tables 4 and 5).
-
•
Among 106 candidate eclipsing binaries, we found 65 targets not to be the sources of the signal. We do not confirm the variability of TIC 847473488. We found 38 original targets to be confirmed eclipsing binaries. In the case of TIC 1509561926, the eclipses originate in TYC 9289-2657-1, while our target itself shows only the 102.89 Hz frequency. In the case of TIC 159448831, the target is contaminated by an eclipsing binary TIC 159448824, however our target shows 158.68 Hz along with harmonics. These frequencies, though, are not responsible for the eclipses we plot in Figure 9 in Paper II (Tables 6 and 7).
-
•
Among 248 binaries showing one symmetric maximum, we found 118 targets not to be the sources of the signal. Five cases are not verified. We found 125 original targets that are confirmed variables. TIC 377658867 shows a significant signal at 54.28 Hz and its harmonics, though the contaminator TIC 378037013 shows 76.27 Hz frequency. Likewise in TIC 388622589, which shows 13.77 Hz frequency, while a contaminator TIC 388622573 is responsible for the 161.92 Hz frequency. On the other hand, TIC 463006021 is heavily contaminated by two sources, even though the target still shows 53.01 Hz frequency and its harmonics. TIC 463006006 shows the 9.03 Hz frequency presented in Paper I, while TIC 463006054 shows a 6.71 Hz frequency and its harmonics. In the case of TIC 2040326958, it is actually TIC 10596964 that shows the 7.87 Hz frequency and its harmonics reported in Paper II, though our target still shows a 131.94 Hz frequency (Tables 8 and 9).
-
•
Among 52 binaries showing one asymmetric maximum, we found 42 targets not to be the sources of the signal. The remaining 10 original targets are confirmed variables. TIC 79689537, which shows a 82.64 Hz frequency and its harmonics, is heavily contaminated by two objects. TIC 79689505 shows the 3.7 Hz frequency and its harmonics reported in Paper I, while ATO J104.6541-23.0081 shows a 5.56 Hz frequency and its harmonics (Tables 8 and 9).
-
•
Among 66 binaries showing two maxima, we found 49 targets not to be the source of the signal. The remaining 17 targets are confirmed binaries (Tables 8 and 9).
-
•
The two novae listed in Paper I are not contaminated (Table 10).
-
•
Among 1 490 spectroscopically unclassified targets showing signal in their amplitude spectra, we found 719 not to be the sources of the signal while 460 cases are not verified. Such a high number of these cases is a consequence of a low signal that is not detectable in individual pixels. The remaining 311 original targets are confirmed variables. In five cases, our original targets show a signal, although it may not be the one reported in Papers I or II (Tables 11 and 12).
-
•
Among 122 spectroscopically classified non-sdB stars, we found 14 targets not to be the sources of the signal. Nine cases are not verified, while the remaining 99 original targets are confirmed variables (Tables 13 and 14).
To summarize our contamination analysis, we found 1 141 targets not to be the sources of the signal, while 451 targets were not verified. This leaves us with 721 variable sdB candidates remaining, including both pulsating and binary stars.
3 Updated amplitude spectra and new pulsating sdB stars
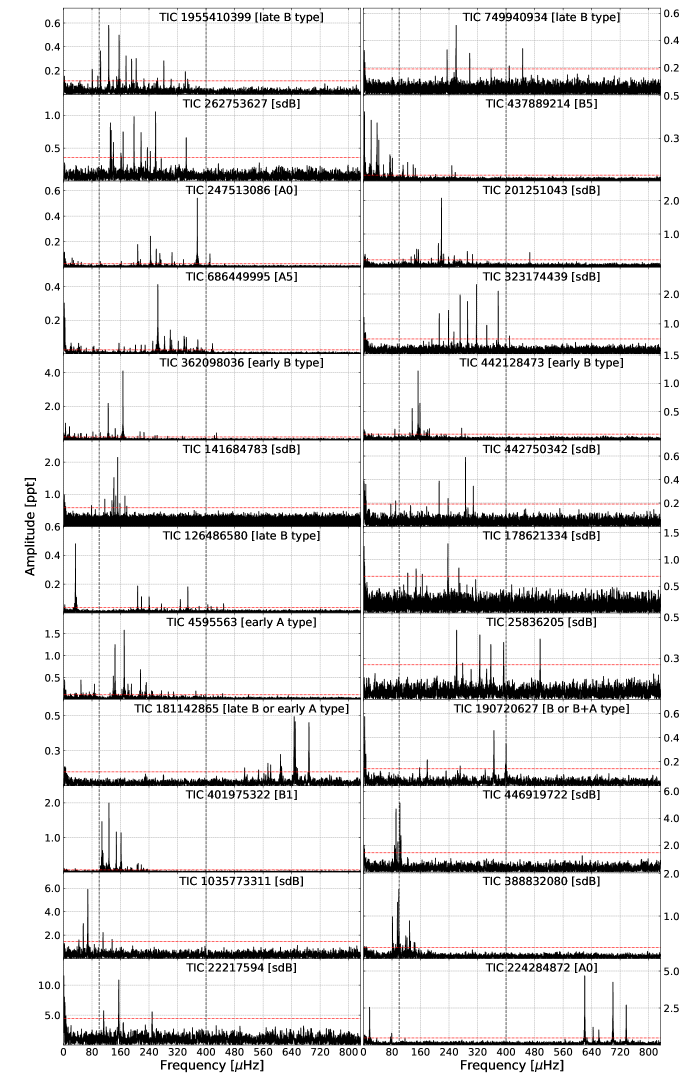
We took advantage of access to the 10 min FFI data collected during Years 3 and 4 to discover new variable sdB stars and to improve the amplitude spectra for known sdBV stars. Not all variable stars listed in Papers I and II were subject to this updated analysis. Binaries would surely benefit from a three times better sampling, which would yield much better definition of eclipses and more precise orbital period estimation, but it would not affect their variability type. The contaminated stars, which turned out not to be sources of the signal, were also excluded. We focused only on targets that show rich signal close to the 277.7 Hz Nyquist frequency, which appear to be quite convincing pulsations. In these cases shifting the Nyquist frequency to a three times higher value would uncover the entire g-mode region of possible pulsating sdB stars. We ended up with a final list of 78 targets.
The light curve extraction process and data reduction of the 10 min FFI data, are the same as for the 30 min FFI data described in Papers I and II, where we refer the reader for details. Out of 78 pre-selected targets we found 24 that show multiple frequencies, which we interpret as pulsations, and the number of frequencies were significantly increased or more frequencies beyond the 277.7 Hz Nyquist frequency were detected. We list these targets in Table 15 in the online material. The targets are confirmed as the original sources of the detected signals. We show the amplitude spectra of these 24 targets in Figure 7. We marked the typical g-mode frequency range (i.e. 100 – 400 Hz) with dashed vertical lines. This region overlaps with the typical p-mode frequency range of Scuti stars, so it is not generally straightforward to claim the detection of a pulsating sdB star based only on the amplitude spectrum content. Alternatively, if the frequencies detected are outside the indicated range, we might well doubt the detection of an sdB pulsator. For instance, TIC 224284872 is an A star and the frequencies are outside the expected range. Similarly, TIC 181142865 turned out to be a main sequence star. TIC 437889214 shows frequencies below the expected region – its spectral type is B5. There are other targets which are not classified as hot subdwarfs, yet show frequencies in the range characteristic of pulsating sdB stars. These cases may be either Scuti pulsators or misclassified hot subdwarfs. We confirm a detection of g-mode pulsations in 11 sdB pulsators. TIC 442750342 seems to be an exception in our sample being a low gravity and cool sdB pulsator.
| G | Variable | ||||
|---|---|---|---|---|---|
| No. | Gaia DR2 | TIC | [mag] | contaminator | Remarks |
| 1 | 1861191062326013696 | 1955410399 | 10.66 | none | late B type |
| 2 | 3032890473180888192 | 749940934 | 12.46 | none | late B type |
| 3 | 3159937564294110080 | 262753627 | 12.46 | none | sdB |
| 4 | 3344114626761364224 | 437889214 | 10.16 | none | B5 |
| 5 | 3396397877830881792 | 247513086 | 8.44 | none | A0 |
| 6 | 4923853724788504192 | 201251043 | 11.93 | none | sdB |
| 7 | 5090382015016433920 | 686449995 | 6.99 | none | A5 |
| 8 | 5196271513123121152 | 323174439 | 13.30 | none | sdB |
| 9 | 5250674622612902912 | 362098036 | 11.48 | none | early B type |
| 10 | 5257747299878049152 | 442128473 | 10.84 | none | early B type |
| 11 | 5266133451162548864 | 141684783 | 14.53 | none | sdB |
| 12 | 5307946881949072000 | 442750342 | 12.82 | none | sdB |
| 13 | 5326745919424790656 | 126486580 | 9.30 | none | late B type |
| 14 | 5362558250096941056 | 178621334 | 13.33 | none | sdB |
| 15 | 5429254969036524416 | 4595563 | 10.11 | none | early A type |
| 16 | 5439887654492064256 | 25836205 | 13.14 | none | sdB |
| 17 | 5525342630213336448 | 181142865 | 11.11 | none | late B or early A type |
| 18 | 5622554881336253824 | 190720627 | 11.07 | none | B or B+A type |
| 19 | 5796399012705196800 | 401975322 | 10.21 | none | B1 |
| 20 | 5823403087017696384 | 446919722 | 12.96 | none | sdB |
| 21 | 5872410931625754624 | 1035773311 | 17.46 | none | sdB |
| 22 | 5922070855307705472 | 388832080 | 12.58 | none | sdB |
| 23 | 6143764182206682112 | 22217594 | 15.16 | none | sdB |
| 24 | 6534581776366266752 | 224284872 | 13.53 | none | A0 |
4 New variables
As a by-product of the contamination analysis we report the true sources of variability preliminarily assigned to the targets listed in Papers I and II. In Tables 1-14 we provide a variable contaminator column which, in the case of a positive variability contamination, contains a name of a contaminator. In addition, we detected new variables that do not contaminate our pre-selected targets but are located within the target masks of our targets. For a practical reason, all these variable contaminators and new non-contaminating variables are listed in Table 16 in the online materials. In total, we report detection of 682 new variable stars, including two, listed last in Table 16, that have no Gaia (Gaia Collaboration et al., 2018) designation yet. To be precise, the discovery of the variability of the majority of these stars was presented in Papers I and II, so only 97 stars are found to be new variables (accounting for Papers I and II) while the remaining 585 stars now have the variability properly assigned (as compared to Paper I and II).
| G | ||||
|---|---|---|---|---|
| No. | Gaia DR2 | TIC | Name | [mag] |
| 1 | 1000847845211000960 | 14196021 | - | 16.65 |
| 2 | 1030011910101662336 | 467154863 | - | 12.56 |
| 3 | 1082306439760980224 | 284473271 | - | 16.95 |
| 4 | 1113516077316307328 | 468921975 | - | 17.32 |
| 5 | 1131845245388039296 | 459183003 | - | 14.38 |
5 Summary
We presented the results of our contamination analysis of stars included in Papers I and II. We identified 1 141 false positives, while 451 variables were not verified because, in most cases, the signal is of too low amplitude to be detected in individual pixels. The total number of targets, which are the sources of the signal we presented in Papers I and II is 721. As a by-product of our contamination analysis we found 97 new variables that happened to be within target masks of our original stars listed in Papers I and II. In total, we analysed 2 995 targets in TESS fields, where 2313 targets were presented in Papers I and II and the remaining 682 variable targets were found during the contamination check. Out of the 2 313 targets, we confirmed 721 as variable after contamination analysis. Hence the total number of variable targets we found is 1 403.
We pre-selected 78 uncontaminated targets that are pulsator candidates (that is, they show rich pulsation content close to the 277.7 Hz Nyquist frequency) for additional analysis using the 10 min FFI data collected during Years 3 and 4. We ended up with 24 targets for which those new data turned out to be beneficial – that is, more peaks either below, or especially beyond, the 277.7 Hz frequency were detected. For any of these 24 stars without spectral type, we used publicly available data and/or spectroscopic data collected with the 1.9 m telescope at the South African Astronomical Observatory to identify hot subdwarfs. In total, we found 11 new sdB pulsators. Details of the spectroscopic analysis will be provided in Worters et al. (in preparation).
One of the pulsator candidates, TIC 362098036, was a subject of a pulsation mode identification and the result was reported in Paper 1. Our analysis confirmed that the target is a main sequence B star, which makes the mode identification irrelevant.
Acknowledgements
Financial support from the National Science Center in Poland under projects No. UMO-2017/26/E/ST9/00703 and UMO-2017/25/B/ST9/02218 is acknowledged. PN acknowledges support from the Grant Agency of the Czech Republic (GAČR 22-34467S). The Astronomical Institute in Ondřejov is supported by the project RVO:67985815. This paper includes data collected by the TESS mission. Funding for the TESS mission is provided by the NASA Explorer Program. This work has made use of data from the European Space Agency (ESA) mission Gaia (https://www.cosmos.esa.int/gaia), processed by the Gaia Data Processing and Analysis Consortium (DPAC, https://www.cosmos.esa.int/web/gaia/dpac/consortium). Funding for the DPAC has been provided by national institutions, in particular, the institutions participating in the Gaia multilateral agreement. This research has used the services of www.Astroserver.org.
Data availability
The datasets were derived from MAST in the public domain archive.stsci.edu.
References
- Baran et al. (2021) Baran A. S., Sahoo S. K., Sanjayan S., Ostrowski J., 2021, Monthly Notices of the Royal Astronomical Society, 503, 3828
- Brasseur et al. (2019) Brasseur C. E., Phillip C., Fleming S. W., Mullally S. E., White R. L., 2019, Astrocut: Tools for creating cutouts of TESS images (ascl:1905.007)
- Gaia Collaboration et al. (2018) Gaia Collaboration et al., 2018, A&A, 616, A1
- Geier (2020) Geier S., 2020, A&A, 635, A193
- Geier et al. (2019) Geier S., Raddi R., Gentile Fusillo N. P., Marsh T. R., 2019, A&A, 621, A38
- Heber (2016) Heber U., 2016, PASP, 128, 2001
- Sahoo et al. (2020) Sahoo S. K., Baran A. S., Sanjayan S., Ostrowski J., 2020, Monthly Notices of the Royal Astronomical Society, 499, 5508