White Dwarfs with Infrared Excess from LAMOST Data Release 5
Abstract
Infrared excess is an important probe of sub-stellar companions and/or debris disks around white dwarfs (WDs). Such systems are still rare for in-depth understanding of their formation and long-term evolution. One of the largest spectroscopic surveys carried out by the Large sky Area Multi-Object fiber Spectroscopic Telescope (LAMOST) recently released more than WDs, a significant fraction of which have not undergone excess search. Here we present cross-correlation of LAMOST DR5 WD catalog with the Pan-STARRS, SDSS, UKIDSS, 2MASS, and WISE. By performing SED (spectral energy distribution) fitting for 846 WDs with detections, we identify 50 candidates with infrared excess, including 7 candidate WD+M dwarf binaries, 31 candidate WD+brown dwarf (BD) binaries and 12 candidate WD+dust disk systems. 8 of the dust disk systems are our new identifications. Utilizing a systematic survey with accurate stellar parameters derived from spectral fitting, our work is an important addition to previous searches for infrared excess from SDSS and Gaia WDs, and provides a significant () complement to current database of WDs with candidate BD companions and dust disks. The frequencies of WD+BD binaries and WD+dust disk systems are constrained to be and , respectively. The properties of candidate dust disk systems are discussed. All of our candidates require follow-up observations for confirmation owing to limited spatial resolution of WISE.
1 Introduction
White dwarfs (WDs) are the final evolutionary stage and remnants of most stars (; Iben et al., 1997). Infrared excess around a WD may come from an M dwarf companion, a brown dwarf (BD) companion, or a debris disk surrounding it. A statistical sample of WD+BD binaries and/or WD+debris disk systems are crucial for testing long-term evolutionary models of planetary systems around stars of .
BDs are substellar objects of Jupiter masses, too light to sustain nuclear fusion of hydrogen but sufficient for deuterium burning (e.g., Chabrier & Baraffe, 2000; Burrows et al., 2011). Observations of BD companions to main-sequence stars have revealed a paucity of separation within au, namely “BD desert” (e.g., Marcy & Butler, 2000; Grether & Lineweaver, 2006; Troup et al., 2016). Various explanations have been proposed, including orbital migration (e.g., Armitage & Bonnell, 2002), tidal interactions with the host star (e.g., Pätzold & Rauer, 2002; Damiani & Díaz, 2016), and different formation mechanisms for low- and high-mass BD companions (e.g., Ma & Ge, 2014). The formation of BDs itself is still an open question. Possible scenarios include a scaled-down version of star formation process (star-like; Bate et al., 2003), gravitational instabilities in the protoplanetary disk (planet-like; Chabrier et al., 2014), etc. Detached WDBD pairs offers a valuable opportunity to investigate the “BD desert” and the formation of BDs, as those BDs have survived the death of the host star via the poorly understood common-envelope phase of close binary evolution (Ivanova et al., 2013). The occurrent rate of WD+BD binaries is estimated to be percent (e.g., Steele et al., 2011; Girven et al., 2011), and to date less than a dozen have been confirmed (e.g., Casewell et al., 2018).
Debris disks are believed to form through tidal disruption of asteroids (or comets) perturbed from locations comparable to the Kuiper belt in our solar system (Bonsor et al., 2011) into the Roche lobe of the WD (; Davidsson, 1999) by a remnant planetary system (e.g., Jura, 2003; Debes et al., 2012; Veras, 2014). Theoretical studies predict that a fraction of planets can survive the red giant phase of the host star (e.g., Villaver & Livio, 2007, 2009; Nordhaus et al., 2010; Mustill & Villaver, 2012), which is supported by discoveries of debris disks (e.g., Gänsicke et al., 2006; Farihi et al., 2009; Barber et al., 2016), disintegrating planetary bodies (e.g., Vanderburg et al., 2015; Xu et al., 2016), and recently planets (Vanderburg et al., 2020; Blackman et al., 2021) orbiting around WDs. Dust grains in the disk will spiral in towards the WD via Poynting-Robert drag (Rafikov, 2011), and the sublimated dust will accrete onto the WD’s surface due to viscous torques (Rafikov & Garmilla, 2012; Veras et al., 2013). This results in a spectroscopically detectable pollution of the otherwise pristine WD atmosphere, since the gravitational settling time is short compared to the WD’s cooling age and the metals will rapidly diffuse out of the WD’s photosphere (e.g., Koester, 2009). Observations suggest that at least percent of WDs are polluted by metals (e.g., Zuckerman et al., 2003, 2010; Koester et al., 2014).
A typical observational feature of debris disks around WDs is an infrared excess over the WD photosphere. The first infrared excess around a WD was detected by Zuckerman & Becklin (1987) and was later interpreted as emission from circumstellar dust by Graham et al. (1990). Afterwards, lots of efforts have been put into searches of infrared excess around WDs (e.g., Debes et al., 2011; Xu et al., 2020; Lai et al., 2021). Currently, about 100 WDs have been identified to host debris disks (e.g., Hoard et al., 2013; Rocchetto et al., 2015; Guo et al., 2015a; Farihi, 2016; Rogers et al., 2020; Lai et al., 2021), largely owing to the sensitive infrared observations provided by Spitzer Space Telescope (Werner et al., 2004). However, Spitzer mostly focused its observations on WDs with polluted atmosphere (e.g., Farihi et al., 2009; Xu & Jura, 2012) or in a specific range of stellar effective temperature (e.g., Rocchetto et al., 2015; Wilson et al., 2019). The frequency of debris disks around WDs is constrained to be percent, and for heavily polluted WDs, the occurrent rate of dusty disks is found to exceed percent (e.g., Mullally et al., 2007; Farihi et al., 2009; Barber et al., 2012; Rocchetto et al., 2015; Wilson et al., 2019).
Infrared surveys such as Wide-field Infrared Survey Explorer (WISE; Wright et al., 2010) and UKIRT Infrared Deep Sky Survey (UKIDSS; Lawrence et al., 2007) provide opportunities for comprehensive searches of infrared excess around WDs. The first large and deep untargeted search for infrared excess were carried out by Steele et al. (2011) and Girven et al. (2011), via cross-correlating Sloan Digital Sky Survey (SDSS; York et al., 2000) WDs with UKIDSS catalog. The release of SDSS DR7 WD catalog (Kleinman et al., 2013) further triggered excess search via cross-correlation with WISE all-sky survey (Debes et al., 2011; Barber et al., 2014), although source confusion is unavoidable due to the poor spatial resolution () of WISE (e.g., Dennihy et al., 2020). More recently, Gaia released its second WD catalog (Gentile Fusillo et al., 2019), providing the largest photometric WD sample for infrared excess search via colors and/or magnitudes (Rebassa-Mansergas et al., 2019; Xu et al., 2020; Lai et al., 2021). These studies identified hundreds of candidates with infrared excess in total, and candidate WD+BD binaries and WD+dust disk systems are fewer (), since only part of the studies classified them further via detailed spectral energy distribution (SED) modeling.
The Large sky Area Multi-Object fiber Spectroscopic Telescope (LAMOST) is a powerful spectroscopic survey operated by National Astronomical Observatories, Chinese Academy of Sciences (Cui et al., 2012). In the past ten years, LAMOST has released thousands of spectroscopically identified WDs with stellar parameters (e.g., effective temperature , surface gravity ) derived from spectral fitting (Zhao et al., 2013; Zhang et al., 2013; Guo et al., 2015b, 2022), which should in principle be more accurate and reliable than that obtained from SED fitting if the signal-to-noise ratio (S/N) of the spectrum is above some criterion, e.g., S/N (Guo et al., 2022). The vast majority of LAMOST WDs locate at low Galactic latitudes (Zhao et al., 2012; Deng et al., 2012), providing a complement to SDSS DR7 WD catalog (Kleinman et al., 2013). Recently, LAMOST released its 5 spectroscopically identified WD catalog (Guo et al., 2022). More than of them have not been searched for infrared excess, offering opportunities for discoveries of new targets of interest, e.g., WDs with a debris disk or a BD companion. Without cut-off in the spectral type or effective temperature of the WDs, this catalog provides an unbiased sample in this point of view, although other selection effects may exist (see discussions in Section 5.3). In this paper, we present systematic search for infrared excess in the LAMOST DR5 WD catalog according to WISE photometry. The poor spatial resolution of WISE make background contamination unavoidable, which is a shortcoming of this work.
The paper is organized as follows. In Section 2, we present photometric data of our sample by cross-matching with various surveys in optical and infrared. Then we describe SED models of different components and search for infrared excess in Section 3. We further check the optical and infrard images of our candidates in Section 4 to exclude possible background contamination or M dwarf companions that are not the focus of this work. Results and discussion are presented in Section 5 and conclusions are given in Section 6.
2 Photometric data
LAMOST DR5 WD catalog contains 3064 unique sources (see Guo et al., 2022, Table 3). To search for infrared excess around those WDs via SED fitting in Section 3, prior information on stellar parameters (e.g., and ) is required to simultaneously model the radiation of the WD photosphere as well as an additional component (if any) with the lack of data at wavelengths longer than several mirons. Moreover, distance is adopted to convert the absolute magnitude to radiative flux for various photometric systems when applying WD cooling model (Bergeron et al., 1995). For these two reasons, we only select targets with , , and distance measurements. Some of the targets have multiple observations, and each spectrum has best-fit values of and . We adopt the fitting parameters derived from the highest S/N spectrum. This results in a sample of 1179 WDs (hereafter the parent sample), and all of them were classified as either DA or DB types111The stellar parameters of LAMOST WDs were fitted only for DA and DB types by Guo et al. (2022). For other spectral types, the modeling is more complicated and the spectral fitting was not performed. (Guo et al., 2022).
Then we search for optical and infrared data by cross-correlating the LAMOST coordinates of the parent sample with various surveys within a radius of (e.g., Debes et al., 2011). Our excess search mainly relies on WISE photometry, with , , , and bands centered at , , , and µm, respectively. Cross-correlating with AllWISE catalog results in , , and targets, respectively for detections. CatWISE2020 catalog (Marocco et al., 2021) provides an excellent alternative for and bands as the detection limit is fainter and the sample size is roughly twice larger than AllWISE. There are and of the parent sample having CatWISE2020 detections in and bands, respectively. For and photometry, we give priority to CatWISE2020 data, and if is not available, we adopt AllWISE data (the case for 18 targets). Since and data are not provided by CatWISE2020, we directly use AllWISE data if available.
We then cross-match the parent sample with the Two-Micron All Sky Survey (2MASS; ; Skrutskie et al., 2006). Considering the limited resolution of 2MASS, we further cross-match these targets with UKIDSS catalog from Galactic Plane, Galaxy Cluster, and Large Area Survey (YJHK; Lawrence et al., 2007). and of the parent sample are detected in the 2MASS and UKIDSS bands, respectively, and of the targets are detected by both filters. We notice that some of the WDs have inconsistent photometry for 2MASS and UKIDSS data. Since they have similar wavelength coverage and UKIDSS has better spatial resolution, we give priority to UKIDSS data and adopt 2MASS data only if the corresponding band UKIDSS data are not available.
In order to characterize the photospheric radiation of WDs, the parent sample are further cross-matched with Pan-STARRS (; Kaiser et al., 2010) catalog. As a consistency check, we also search for their SDSS DR12 detections (ugriz; Alam et al., 2015). This returns and detections for and bands of the two surveys, respectively, and most of these targets have the other four optical-bands observations.
Except for the above-mentioned cases of either CatWISE2020 or AllWISE, and either 2MASS or UKIDSS, all of these optical and infrared data are used in the SED fitting if the target is detected in that filter, i.e., the apparent magnitude is given with errors instead of upper limits. We add additional 2% in quadrature to the reported uncertainties in the radiative flux in each photometric band to account for systematic errors.
3 Models and SED fitting
In order to search for infrared excess around the WDs and distinguish among possible scenarios for their origin, we adopt and measurements of LAMOST WD catalog derived from spectral fitting of Balmer absorption lines (Guo et al., 2022) in the SED fitting, and our models involve (i) photospheric emission of a WD; (ii) the SED of a late-type (M/brown dwarfs) companion; and (iii) radiation spectrum of a dust disk, as detailed below.
-
(i)
Photospheric emission of WDs. For a grid of and , WD cooling models222The cooling model data are publicly available online: https://www.astro.umontreal.ca/bergeron/CoolingModels/. The model results are given for in the range of K for DA and K for DB type WDs, and for in the range of (cgs units) for both DA and DB WDs. (Bergeron et al., 1995) provide an estimate of the mass and cooling age for the WD as well as its synthetic photometry in all optical and infrared bands we studied. For a WD in the LAMOST catalog, we force if it is below , and force if it exceeds , since 7 and 9 are the lower and upper boundaries of the cooling models. of the parent sample have surface gravity out of this range.
-
(ii)
SED templates of M/brown dwarfs. For late-type dwarf companions, empirical relations have been constructed between the spectral type and SDSS colors as well as absolute -band magnitude (Hawley et al., 2002). Alternatively, We adopt the colors provided by Best et al. (2018) involving Pan-STARRS, 2MASS, and WISE as a function of the spectral type, and interpolate to get colors of SDSS and UKIDSS filters. Since the absolute -band magnitude is available only for dwarfs cooler than M6 type, we use the absolute magnitudes provided by Hawley et al. (2002) for all of the M-, L- and T-types dwarfs for consistency.
-
(iii)
Radiation spectra of dust disks. We adopt Jura (2003) model to describe the dust disk emission, which assumes a geometrically flat, optically thick disk illuminated by the central WD and re-radiating at infrared. The temperature of each annulus in the disk is determined by the effective temperature () of and its distance () to the WD, i.e.,
(1) where is the WD radius. Radiation from each annulus can be approximated as a blackbody spectrum, and its integration over the radius from the inner to outer edges of the disk gives the total disk flux:
(2) where is the inclination of the disk, is the WD distance to the observer, is the Boltzmann’s constant, is the Planck constant, c is the speed of light, and .
For the purpose of SED fitting, the magnitude in each photometric band is converted into the flux density according to the zero points provided by SVO Filter Profile Service (Rodrigo et al., 2012; Rodrigo & Solano, 2020). According to the measured and for each WD, we interpolate to obtain the absolute magnitude in various photometric bands according to WD cooling models (Bergeron et al., 1995). Then model flux is converted from the absolute magnitude by adopting Gaia distances of the WDs, and we add a free normalization to account for measurement errors of and distances. The cooling models are initially fit to the SDSS and Pan-STARRS fluxes of the WD by minimizing
| (3) |
where is the model flux for the th photometric band in optical, and and are the observed flux and its error, respectively.
Then an infrared excess with respect to the WD cooling model is searched with a significance expressed by the photometric and model uncertainties, i.e.,
| (4) |
where the model uncertainty is also considered and is assumed (e.g., Rocchetto et al., 2015; Xu et al., 2020). The criterion we adopt for an excess is for WISE band or longward, i.e., the excess is at a significance level. Besides that, it should also be satisfied that the source image in this WISE band is unaffected by any known artifacts, i.e., the quality flag (ccflag) of the band is zero.
Once an excess is detected, we add an additional model component, i.e., a late-type dwarf companion or a dust disk. For the case of a dwarf companion, we adopt the WD distance provided by , and for each spectral type from M1 to T6, is calculated, and the lowest value corresponds to the best-fit spectral type of the companion.
For the dust disk case, degeneracies exist between the inclination angle and inner disk boundary, especially for the case here that only one or two data points are available for excess modeling. Here we set the inclination and inner boundary of the disk as free parameters. The dust disk can extend to WD radii. Constraints on the outer disk boundary require photometric data at longer wavelengths, which is not the case here. We therefore take and assume an initial face-on inclination, i.e., (e.g., Debes et al., 2011). The inner disk radii is capped by , and the lower boundary is set by the sublimation temperature () of dust grains, as indicated by Equation (1). For silicate-dominated dust, K, and for pure carbon dust, (Debes et al., 2011). We adopt a more relaxed value of K, as it was pointed out that the sublimation temperature of the dust could be much higher due to the high metal vapor pressure in the inner disk (Rafikov & Garmilla, 2012).
The companion model is compared with the dust disk model via the reduced- () of SED fitting, and the model with lower value is preferred.
4 Images
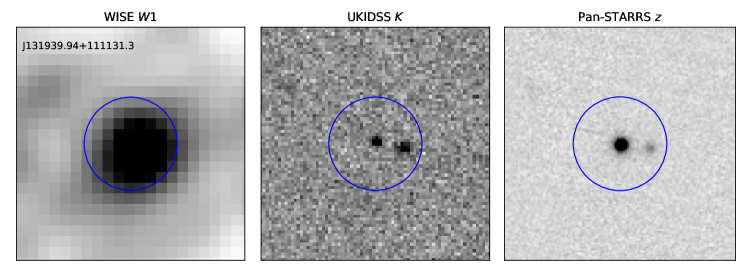
The infrared excess found in Section 3 are mainly based on WISE observations, and due to its poor spatial resolution, a significant fraction of the excess could arise from background contamination and/or late-type stellar companions (possibly M dwarfs). LAMOST DR5 WD catalog already identified some WD+M dwarf binaries, while a fraction of M dwarf companions may be too faint to exhibit features in WD spectra and could be missed in the classification. The contaminants radiating in WISE bands are expected to radiate at a little bit shorter wavelengths since the spectrum is continuous. If it is not as cool as BDs, it should be detected in the band, and possibly band.
UKIDSS image provides an effective tool to exclude background contamination owing to its superior spatial resolution. However, only a fraction of the WDs with infrared excess have UKIDSS observations. We notice that Pan-STARRS band data are also good in quality and may provide an alternative for contamination check, although the filters are even shorter in wavelength. As Figure 1 shows, the apparent two point-sources in the UKIDSS -band image are blended in the WISE image, and Pan-STARRS -band can clearly resolve the two point sources. The circle with a radius of can marginally enclose the central source in the image, which is also true for our other candidates with infrared excess. We checked the UKIDSS and Pan-STARRS images of all those WDs with infrared excess selected in Section 3, and those with multiple sources within a radius of are excluded. While WD+BD binaries are not expected to show two point-sources in the or band, some of the WDs with an M dwarf companion and having images similar to Figure 1 may be excluded in this process.
For the leftover candidates, we further compare their images and optical ones using the WISEView tool (http://byw.tools/wiseview), which is useful to look for possible contamination in the field. We remove those candidates with obvious contamination in the image.
5 Results and discussion
The SED fitting and image check result in a total of 50 candidates with infrared excess, including 7 candidate WD+M dwarf binaries, 31 candidate WD+BD binaries, and 12 candidate WD+dust disk systems. 37 out of the 50 candidates with infrared excess are new identifications, and 8 candidate dust disk systems are first reported as such systems.
Our results rely upon the accuracy of measurement. An incorrect will result in an inaccurate measurement of WD photospheric radiation, possibly leading to a false or magnified excess in infrared. Moreover, our results may still suffer from background contamination. While UKIDSS and/or Pan-STARRS image check is able to remove contamination mainly radiating at shorter wavelength, those redder contaminants (e.g., red galaxies) may still be missed due to the limited resolution of . These factors could lead to (very) high values in the SED fitting and should be treated with caution. Below we will list all selected candidates regardless of its value, and each of them waits for confirmation or refutation via follow-up observations.
5.1 WD+BD binary candidates
Table 1 lists the first part of WDs with candidate BD companions. Also listed are the 7 WDs with an M dwarf companion. WD+M dwarf binaries are not the focus of this paper, and our parent sample do not contain WDs spectroscopically classified as WD+M dwarf binaries by LAMOST, and the image check in Section 4 may have excluded some of such systems, leaving only a few here. However, considering that the uncertainties of the spectral type of the companion could be several dex, we also list WD+M dwarf candidates here for reference.
The second part of the WD+BD candidates are listed in Table 2. These candidates have comparable reduced- resulting from the companion and the dust disk models. As examples, Figure 2 shows the SED fitting results for three WD+BD binaries. The best-fit spectral type of the BD companion is L99.9, L00.9 and L55.9, respectively for the left, middle, and right panels.
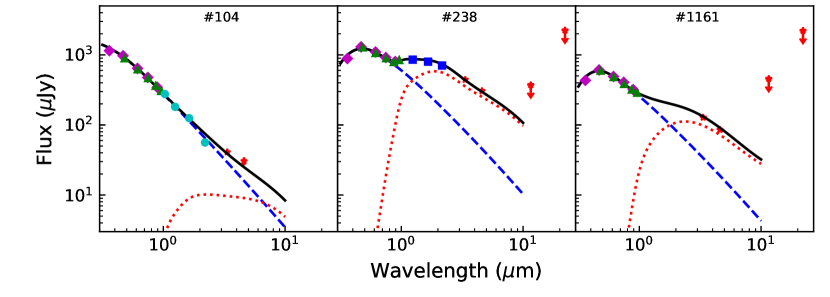
Two of previously known dust disk systems (WD 2328+107, ID: 470; and WD 0843+516, ID: 505) were misclassified as WD+BD binaries by our SED model fitting, mainly because given in the LAMOST catalog is higher than the best-fit value. An overestimated will shift blueward the model SED of the WD, creating spurious excess at shorter wavelengths, which mimics radiation from a late-type dwarf companion. When the best-fit is adopted, the resulting for the companion model and dust disk model are both reduced, and the dust disk model is now preferred. This suggests that the identification of infrared excess and the best-fit model are sensitive to the accuracy of measurement. We have moved these two targets to the WD+dust disk classification, and for this reason we also consider the candidates in Table 2 in the following statistical studies on dust disk properties.
| ID | R.A. | Dec | G | Type | T | g | Mass | Age | D | Spec. Type | |
|---|---|---|---|---|---|---|---|---|---|---|---|
| (deg) | (deg) | (mag) | (K) | () | (M⊙) | (Myr) | (pc) | ||||
| 162 | 236.821304 | 23.353057 | 16.5 | DA | 26345 | 7.84 | 0.56 | 14 | 145 | T0-T0.9 | 36.2 |
| 238bbThe WD was identified as exhibiting WISE excess by Xu et al. (2020). | 1.948394 | 19.856837 | 16.2 | DA | 12123 | 8.26 | 0.77 | 538 | 87 | L0-L0.9 | 2.7 |
| 343aaThe WD was reported by Debes et al. (2011) as candidate WD+M dwarf binaries. | 137.593884 | 27.478865 | 17.2 | DA | 78945 | 7.77 | 0.66 | 1 | 602 | M5-M5.9 | 7.2 |
| 769 | 186.738710 | 37.442958 | 17.4 | DA | 18042 | 7.67 | 0.46 | 60 | 240 | L6-L6.9 | 14.6 |
| 1059a,ba,bfootnotemark: | 240.693580 | 30.654022 | 16.3 | DA | 71274 | 7.78 | 0.65 | 1 | 377 | M6-M6.9 | 5.3 |
| 1080 | 241.631670 | 25.114203 | 17.6 | DA | 25836 | 7.92 | 0.59 | 16 | 266 | L4-L4.9 | 15.2 |
| 1161 | 51.704255 | 18.465891 | 17.1 | DA | 13803 | 8.06 | 0.65 | 279 | 126 | L5-L5.9 | 2.9 |
| 1278 | 65.135723 | -1.405366 | 17.5 | DA | 16783 | 7.98 | 0.60 | 132 | 166 | T1-T1.9 | 4.7 |
| 1345 | 5.956828 | 48.156015 | 16.7 | DA | 25314 | 8.06 | 0.67 | 25 | 170 | T0-T0.9 | 8.2 |
| 1762bbThe WD was identified as exhibiting WISE excess by Xu et al. (2020). | 158.903457 | -5.356090 | 16.9 | DA | 11209 | 8.62 | 1.00 | 1340 | 168 | M7-M7.9 | 13.3 |
| 1898 | 202.352900 | -0.945752 | 16.4 | DA | 23916 | 7.68 | 0.48 | 19 | 125 | L9-L9.9 | 17.5 |
| 1923 | 106.356590 | 27.128318 | 17.8 | DA | 8635 | 9.00 | 1.20 | 71 | 378 | M5-M5.9 | 36.9 |
| 2112 | 208.117270 | 9.177510 | 18.3 | DA | 36846 | 7.00 | 0.30 | 71 | 790 | M5-M5.9 | 18.5 |
| 2225 | 27.470080 | 10.535010 | 17.5 | DA | 24274 | 7.82 | 0.54 | 20 | 250 | L6-L6.9 | 27.4 |
| 2321 | 135.519260 | 26.137318 | 19.0 | DA | 9368 | 8.87 | 1.13 | 2530 | 550 | M6-M6.9 | 53.8 |
| 2325 | 25.835801 | 36.478634 | 17.3 | DA | 34018 | 7.87 | 0.59 | 6 | 424 | L0-L0.9 | 3.1 |
| 2423 | 114.262030 | 47.630261 | 17.8 | DA | 28584 | 7.59 | 0.46 | 11 | 444 | M6-M6.9 | 79.2 |
| 2477aaThe WD was reported by Debes et al. (2011) as candidate WD+M dwarf binaries. | 134.078957 | 16.184380 | 15.6 | DB | 31738 | 8.29 | 0.79 | 17 | 72 | T1-T1.9 | 25.7 |
| 2534 | 163.697033 | 34.003756 | 16.8 | DA | 15163 | 7.59 | 0.41 | 104 | 169 | L6-L6.9 | 4.1 |
Note. — Columns from left to right represent: (1)-(3) the unique ID (same as the Group ID in Guo et al., 2022) and LAMOST coordinate; (4) G band magnitude given by DR2; (5)-(9) spectral type, effective temperature, surface gravity, mass and cooling age of the WD given by LAMOST catalog; (10) Gaia distance of the WD; Columns (11)-(12): best-fit spectral type of the companion, and minimum reduced .
| Companion Model | Disk Model | ||||||||||||||
|---|---|---|---|---|---|---|---|---|---|---|---|---|---|---|---|
| ID | R.A. | Dec | G | Type | T | g | Mass | Age | D | Spec. Type | |||||
| (deg) | (deg) | (mag) | (K) | () | (M⊙) | (Myr) | (pc) | (RWD) | |||||||
| 63 | 178.028760 | 31.482751 | 17.9 | DA | 9205 | 7.95 | 0.57 | 706 | 112 | T1-T1.9 | 0.7 | 2.7 | 86.7 | 0.8 | |
| 104bbThe WD was confirmed to have Spitzer excess by Lai et al. (2021). | 184.690380 | 26.808820 | 16.7 | DA | 26844 | 7.79 | 0.53 | 12 | 197 | L9-L9.9 | 2.4 | 38.0 | 88.4 | 2.5 | |
| 204 | 246.978950 | 31.723409 | 18.5 | DA | 23372 | 7.70 | 0.48 | 20 | 370 | L5-L5.9 | 4.9 | 9.2 | 88.4 | 4.9 | |
| 217 | 255.985680 | 28.223106 | 18.1 | DA | 18429 | 8.12 | 0.69 | 124 | 271 | L6-L6.9 | 2.6 | 6.7 | 87.4 | 3.1 | |
| 272 | 166.892570 | 27.391105 | 18.4 | DA | 11273 | 8.25 | 0.76 | 643 | 256 | L7-L7.9 | 2.7 | 3.5 | 77.8 | 3.1 | |
| 476 | 352.692900 | 0.398787 | 18.5 | DA | 19043 | 8.30 | 0.80 | 157 | 305 | L4-L4.9 | 4.3 | 7.0 | 80.5 | 4.3 | |
| 534 | 58.001722 | 19.206418 | 17.7 | DA | 10635 | 8.69 | 1.03 | 1700 | 195 | T6-T6.9 | 8.4 | 13.9 | 0.0 | 8.4 | |
| 737a,ba,bfootnotemark: | 161.749090 | 37.765775 | 16.9 | DA | 21536 | 8.08 | 0.67 | 60 | 180 | L5-L5.9 | 3.7 | 8.3 | 86.2 | 4.8 | |
| 748 | 127.477780 | 48.874064 | 18.1 | DA | 19712 | 8.03 | 0.64 | 80 | 285 | L6-L6.9 | 2.8 | 7.3 | 87.5 | 3.2 | |
| 848 | 218.117523 | 28.823069 | 17.2 | DA | 18745 | 7.89 | 0.56 | 73 | 181 | L6-L6.9 | 5.2 | 6.9 | 88.9 | 6.5 | |
| 1163 | 50.610170 | 21.234753 | 17.8 | DA | 10704 | 8.37 | 0.84 | 892 | 134 | T1-T1.9 | 0.8 | 6.3 | 81.1 | 1.4 | |
| 1633 | 185.237050 | 15.565191 | 17.1 | DA | 19635 | 7.95 | 0.59 | 66 | 174 | L9-L9.9 | 3.3 | 50.0 | 64.7 | 4.1 | |
| 1714 | 190.110500 | 37.396327 | 17.3 | DA | 17971 | 7.93 | 0.58 | 93 | 181 | T2-T2.9 | 3.1 | 50.0 | 75.3 | 3.2 | |
| 1794 | 138.567563 | 42.174152 | 17.2 | DA | 14000 | 8.06 | 0.65 | 268 | 134 | L9-L9.9 | 8.6 | 4.7 | 86.7 | 10.0 | |
| 2020 | 155.261880 | 20.031298 | 17.4 | DA | 15170 | 8.04 | 0.64 | 205 | 155 | L9-L9.9 | 1.2 | 5.2 | 87.7 | 1.4 | |
| 2070 | 206.417440 | 16.936465 | 17.7 | DA | 28830 | 7.95 | 0.62 | 10 | 349 | L7-L7.9 | 2.1 | 12.2 | 89.1 | 2.2 | |
| 2351 | 136.410250 | 29.102879 | 17.1 | DB | 23448 | 7.89 | 0.55 | 27 | 184 | L9-L9.9 | 5.8 | 9.3 | 89.4 | 6.4 | |
| 2410 | 126.987885 | 56.067105 | 17.7 | DA | 11888 | 7.79 | 0.49 | 295 | 217 | L9-L9.9 | 2.6 | 18.4 | 70.1 | 2.8 | |
| 2810 | 140.478080 | 22.743359 | 17.6 | DA | 9347 | 7.97 | 0.58 | 695 | 104 | T0-T0.9 | 0.7 | 2.7 | 84.8 | 0.8 | |
Note. — Columns (1)-(10): similar to those in Table 1; (11)-(12): best-fit spectral type of the companion, and minimum reduced- for the companion model; (13)-(15): best-fit inner radius and inclination of the disk, and minimum reduced- for the dust disk model.
5.2 WD+dust disk candidates
Our WD+dust disk candidates are listed in Table 3. All these WDs have spectral types of either DA or DB as expected, since this is also the case for our parent sample. Although most of the dust disk candidates found by Debes et al. (2011) have similar stellar spectral types, WDs with known dust disks usually show metal absorption lines in WD spectra and are mostly classified as DAZ or DBZ. However, metal lines could be missed in the WD spectrum with a relatively low S/N. Three of the known WDs with a debris disk (WD 1018+410; ID: 282; WD 0843+516, ID: 505; and Ton 345, ID: 923) classified as DAZ or DBZ in the literature (see Table 1 of Xu et al., 2020) are classified as DA or DB in the LAMOST catalog (Guo et al., 2022). The effective temperatures of these WDs mostly locate at K, consistent with the expectation that dust grains may not survive around a too hot WD. Indeed, those published WD+dust disk systems all have similar WD temperatures (see Xu et al., 2020, and references therein).
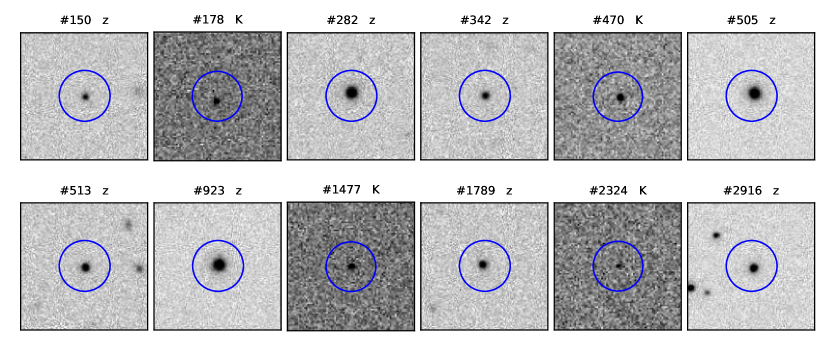
The cutout images of these candidate WD+dust disk systems are shown in Figure 3. The UKIDSS -band image is our first choice, and if it is not available, the Pan-STARRS -band image is shown. The blue circle centered at the LAMOST coordinate of the WD is to illustrate that there is no contamination within a radius of 6″.
| ID | R.A. | Dec | G | Type | T | g | Mass | Age | D | |||
|---|---|---|---|---|---|---|---|---|---|---|---|---|
| (deg) | (deg) | (mag) | (K) | () | (M⊙) | (Myr) | (pc) | (RWD) | (deg) | |||
| 150 | 189.683020 | 29.167623 | 18.8 | DA | 15000 | 8.59 | 0.98 | 520.0 | 227.1 | 8.1 | 65.8 | 0.9 |
| 178 | 158.522721 | 6.046522 | 16.3 | DA | 21360 | 7.97 | 0.61 | 46.0 | 137.6 | 11.4 | 89.4 | 3.4 |
| 282aaThe WD was identified to have WISE excess by Xu et al. (2020). | 155.481254 | 40.837750 | 16.4 | DA | 24431 | 8.21 | 0.76 | 49.2 | 135.7 | 9.8 | 87.9 | 8.2 |
| 342 | 130.685580 | 29.804366 | 18.5 | DA | 12705 | 8.24 | 0.76 | 460.0 | 284.3 | 4.8 | 77.7 | 1.6 |
| 470aaThe WD is a previously known dust disk system. | 352.673574 | 11.035077 | 15.6 | DA | 22675 | 7.84 | 0.55 | 26.7 | 98.0 | 8.8 | 89.6 | 12.2 |
| 505aaThe WD is a previously known dust disk system. | 131.759613 | 51.481411 | 16.1 | DA | 25259 | 7.96 | 0.61 | 19.6 | 139.0 | 10.2 | 87.7 | 5.9 |
| 513 | 142.004550 | 13.538704 | 17.9 | DA | 23788 | 7.88 | 0.57 | 22.9 | 286.7 | 9.4 | 85.6 | 1.0 |
| 923aaThe WD is a previously known dust disk system. | 131.413230 | 22.957784 | 15.9 | DB | 18806 | 8.15 | 0.68 | 125.0 | 105.2 | 6.9 | 82.2 | 1.3 |
| 1320 | 331.042745 | 2.558907 | 17.2 | DA | 16588 | 8.08 | 0.66 | 165.0 | 141.6 | 17.6 | 82.1 | 5.3 |
| 1477 | 28.959316 | 4.525195 | 16.8 | DA | 14000 | 7.94 | 0.58 | 224.0 | 125.3 | 4.7 | 88.7 | 1.9 |
| 1789 | 136.356200 | 39.727530 | 18.0 | DA | 15683 | 7.40 | 0.35 | 82.5 | 298.2 | 24.6 | 79.5 | 1.9 |
| 1953 | 164.532600 | 2.113474 | 16.9 | DA | 18667 | 8.05 | 0.65 | 103.0 | 163.8 | 46.8 | 73.2 | 1.8 |
| 2324bbThe WD was reported as a candidate WD+M dwarf binary by Debes et al. (2011). | 132.618090 | 27.332293 | 17.3 | DA | 20318 | 7.72 | 0.48 | 37.4 | 197.4 | 7.6 | 87.8 | 3.8 |
| 2916ccThe WD was identified with WISE excess by Xu et al. (2020). | 224.171390 | 17.070909 | 17.0 | DA | 31375 | 7.93 | 0.61 | 7.6 | 245.8 | 13.6 | 88.7 | 1.2 |
Note. — Columns (1)-(10): similar to those in Table 1; (11)-(13) best-fit inner radius and inclination of the dust disk, and minimum reduced-.
The SED fitting results of the dust disk candidates are shown in Figure 4. The disk inclinations of the candidates concentrate at and the inner disk radii cover a broad range from several to tens of WD radii. As the disk is illuminated by the central WD, the disk temperature declines from the inner to outer radii. The blue cutoff of the disk radiation is mainly set by the inner disk boundary and the declining rate at red end is determined by the outer disk boundary. The inclination can affect the normalization, peak, and shape of the disk SED and is difficult to uniquely constrain due to degeneracies with the inner disk radius, especially for those targets with excess only in band. Therefore, the best-fit parameters of those candidate dust disk systems should be treated as indicative if the dust disk is confirmed.
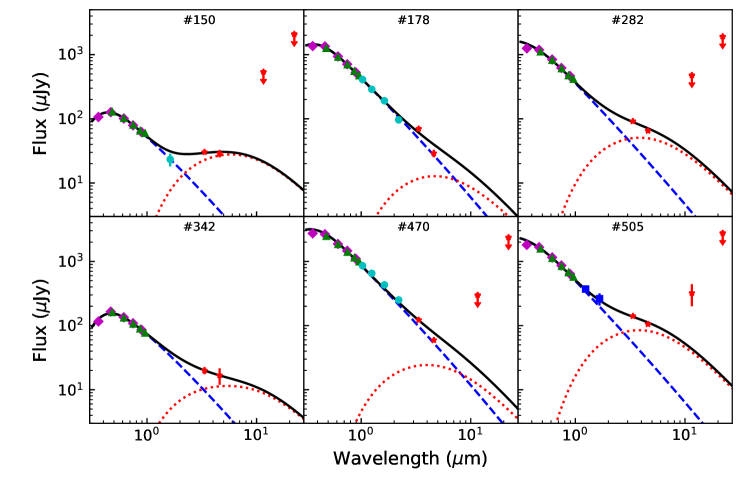
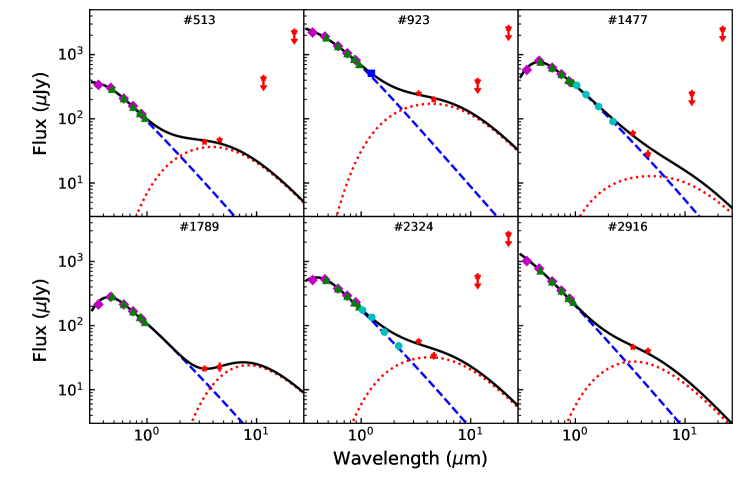
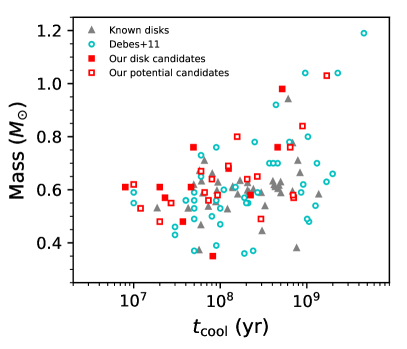
Figure 5 shows mass vs. cooling age distribution of the WDs for the dust disk candidates. Our candidates occupy similar parameter space to the WDs already known to host a dust disk. Including the targets with statistically similar fits between dust disk and companion models in Table 2 (red open squares) does not change the overall distribution.
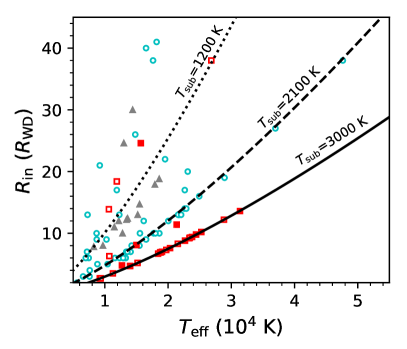
In Figure 6, we plot distribution of the inner disk radius () vs. effective temperature of the WDs for our candidates. According to Equation (1), we have , where the sublimation temperature of dust grains defines a power-law relation between and (black curves). A significant fraction of our candidates locate at K, higher than the previously known dust disks and candidate dust disks identified by Debes et al. (2011). This is simply caused by our settings of K, which is to account for possible effects that may elevate sublimation temperature of dust grains (Rafikov & Garmilla, 2012). Beside that, the distribution of our candidates are in general consistent with the literature.
The mass of the dust disk cannot be constrained if it is optically thick (e.g., Jura, 2003). However, if the disk is optically thin, under the assumption of a modified blackbody radiation, the dust disk mass can be roughly estimated via the dust temperature and the radiative flux of the disk at a specific wavelength , similar to the commonly used method to calculate the dust mass of protoplanetary disks and interstellar dust mass (e.g., Schuller et al., 2009; Utomo et al., 2019):
| (5) |
where is the WD distance, is the dust absorption cross-section per unit mass at , and is the Planck function for temperature at . We take and adopt (Shirley et al., 2011). We have assumed multi-color blackbody radiation in the SED models described in Section 3. Here the dust temperature is assumed to be constant across the disk, and can be roughly estimated via the peak radiation of the dust SED according to Wien’s displacement law. in Equation (5) is obtained from the model flux radiated by the dust disk, i.e., the red dotted lines in Figure 4.
Figure 7 shows the estimated dust disk mass vs. WD cooling age for our candidate WD+dust disk systems. For most of the candidate systems, the dust disk mass locates at , much lower than the total mass of Saturn’s rings (; Esposito, 1993). As comparison, the dust disk of G29-38, a well studied dust disk system, was estimated to have a mass of (the blue diamond in Figure 7), which is sensitive to parameters such as dust grain size and mostly relies on the optically-thin disk assumption (Jura, 2003; Reach et al., 2005; Farihi et al., 2008, 2009). For our candidates, the optically-thin disk assumption here will also underestimate the dust mass, and the red squares in Figure 7 should be treated as lower limits. Pearson correlation between the two parameters results in a coefficient of 0.57 (for the open and closed red squares), implying a positive correlation between the dust mass and WD cooling age. This might tentatively suggest disruption of planetesimals and settling of dust on the disk plane along the central WD’s cooling life if such a relation is confirmed in the future. Also shown is the dust disk candidates identified by Debes et al. (2011), where the dust mass is similarly calculated according to Equation (5). The dust mass for their candidates are in general orders higher than ours. The main reason is that the disk inclination is fixed at for most of their candidates.
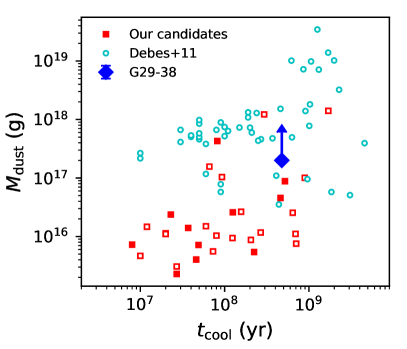
The blue diamond show the lower limit of dust mass given by the literature (see the text).
5.3 The occurrent rate
We found 31 candidate WD+BD binaries from an input of WDs in the LAMOST catalog. However, the requirement of band observations (in CatWISE or AllWISE), measurements and Gaia distances left only 846 targets for excess search via SED model fitting. The event rate of WD+BD binaries is therefore , about twice higher than value ( percent) reported in the literature (e.g., Steele et al., 2011; Girven et al., 2011). However, our frequency should be treated as an upper limit. Two of the previously known dust disk systems were originally identified as WD+BD binaries by us, with one listed in Table 1 and the other in Table 2. We expect that a significant fraction of the candidate WD+BD binaries, especially those listed in Table 2, could be dust disk systems if the excess is real. Follow-up observations such as radial velocity measurement of WDs (e.g., Maxted et al., 2006; Steele et al., 2013) or high resolution infrared imaging (e.g., Wilson et al., 2019) may confirm or refute such systems.
The twelve WD+dust disk candidates we identified convert to a frequency of for such systems, consistent with percent reported in the literature (e.g., Rocchetto et al., 2015). If we include the 19 potential dust disk candidates in Table 2 with comparable for dust disk and companion models, the frequency of dust disks will be . We reaffirm that for some of them, the infrared excess could still be spurious if measurement is inaccurate or could be caused by background contamination. Moreover, the final 846 sample left for SED model fitting may suffer from selection biases, since only WDs of DA or DB types with relatively high S/N spectra have measurements in the LAMOST catalog.
5.4 Comparison with the literature
The 50 candidates we found with infrared excess include 4 WDs with previously known dust disks, 5 targets already reported by Xu et al. (2020) as exhibiting unWISE excess, and 7 sources studied by Xu et al. (2020) yet no excess found by them. Our different results could arise from several factors, e.g., (i) the effective temperature of WDs is obtained by profile-fitting of Balmer absorption lines in LAMOST WD catalog, which could be different from that derived from Gaia’s auto fit; (ii) we set the excess criterion as exceeding the WD photospheric radiation at level, while they adopt a more significant level; (iii) the CatWISE and/or AllWISE photometric data we used are not exactly the same as the unWISE data they adopted. 2 out of the 5 targets commonly identified as exhibiting WISE excess by us were confirmed to have Spitzer excess (Lai et al., 2021).
Besides one WD with known dust disk, 4 of our candidates with infrared excess were also identified by Debes et al. (2011). We have 2 common candidate WD+M dwarf binaries. 2 candidates classified as WD+M dwarf binaries by them are WD+BD and WD+dust disk systems respectively in our classification. One of these two targets were also studied by Xu et al. (2020), who identified it as with no excess, neither in magnitudes nor in colors. An insignificant infrared excess may lead to different classifications by Debes et al. (2011) and us.
6 Conclusions
We search for infrared excess around 3064 WDs recently released by LAMOST via SED model fitting of 846 targets with detections, effective temperature and distance measurement. The WD’s effective temperature provided by LAMOST catalog is adopted in the SED fitting, and thus the identification of candidates with infrared excess relies on the accuracy of effective temperature measurement. Possible contamination have been preliminary excluded by visual check of optical and infrared images of these candidates. We identified 50 candidates with infrared excess, including 7 candidate WD+M dwarf binaries, 31 candidate WD+BD binaries, and 12 candidate WD+dust disk systems. The frequencies of WD+BD binaries and WD+dust disk systems are estimated to be and , respectively. 8 of these WD+dust disk candidates are first reported as such systems. Our dust disk candidates occupy similar parameter space to previously known dust disk systems in the WD mass vs. cooling age plot. The SED model fitting suggests that the temperatures of the inner dust disks locate at K, generally consistent with that reported in the literature. The dust masses are constrained to have a lower limit of under the assumption of optically-thin dust disks. Positive correlations are found between the dust mass and WD cooling age. We caution that all these candidates with infrared excess require follow-up infrared imaging or infrared spectroscopy for confirmation.
References
- Alam et al. (2015) Alam, S., Albareti, F. D., Allende Prieto, C., et al. 2015, ApJS, 219, 12, doi: 10.1088/0067-0049/219/1/12
- Armitage & Bonnell (2002) Armitage, P. J., & Bonnell, I. A. 2002, MNRAS, 330, L11, doi: 10.1046/j.1365-8711.2002.05213.x
- Astropy Collaboration et al. (2013) Astropy Collaboration, Robitaille, T. P., Tollerud, E. J., et al. 2013, A&A, 558, A33, doi: 10.1051/0004-6361/201322068
- Astropy Collaboration et al. (2018) Astropy Collaboration, Price-Whelan, A. M., Sipőcz, B. M., et al. 2018, AJ, 156, 123, doi: 10.3847/1538-3881/aabc4f
- Barber et al. (2016) Barber, S. D., Belardi, C., Kilic, M., & Gianninas, A. 2016, MNRAS, 459, 1415, doi: 10.1093/mnras/stw683
- Barber et al. (2014) Barber, S. D., Kilic, M., Brown, W. R., & Gianninas, A. 2014, ApJ, 786, 77, doi: 10.1088/0004-637X/786/2/77
- Barber et al. (2012) Barber, S. D., Patterson, A. J., Kilic, M., et al. 2012, ApJ, 760, 26, doi: 10.1088/0004-637X/760/1/26
- Bate et al. (2003) Bate, M. R., Bonnell, I. A., & Bromm, V. 2003, MNRAS, 339, 577, doi: 10.1046/j.1365-8711.2003.06210.x
- Bergeron et al. (1995) Bergeron, P., Wesemael, F., & Beauchamp, A. 1995, PASP, 107, 1047, doi: 10.1086/133661
- Best et al. (2018) Best, W. M. J., Magnier, E. A., Liu, M. C., et al. 2018, ApJS, 234, 1, doi: 10.3847/1538-4365/aa9982
- Blackman et al. (2021) Blackman, J. W., Beaulieu, J. P., Bennett, D. P., et al. 2021, Nature, 598, 272, doi: 10.1038/s41586-021-03869-6
- Bonsor et al. (2011) Bonsor, A., Mustill, A. J., & Wyatt, M. C. 2011, MNRAS, 414, 930, doi: 10.1111/j.1365-2966.2011.18524.x
- Burrows et al. (2011) Burrows, A., Heng, K., & Nampaisarn, T. 2011, ApJ, 736, 47, doi: 10.1088/0004-637X/736/1/47
- Casewell et al. (2018) Casewell, S. L., Littlefair, S. P., Parsons, S. G., et al. 2018, MNRAS, 481, 5216, doi: 10.1093/mnras/sty2599
- Chabrier & Baraffe (2000) Chabrier, G., & Baraffe, I. 2000, ARA&A, 38, 337, doi: 10.1146/annurev.astro.38.1.337
- Chabrier et al. (2014) Chabrier, G., Johansen, A., Janson, M., & Rafikov, R. 2014, in Protostars and Planets VI, ed. H. Beuther, R. S. Klessen, C. P. Dullemond, & T. Henning, 619, doi: 10.2458/azu_uapress_9780816531240-ch027
- Cui et al. (2012) Cui, X.-Q., Zhao, Y.-H., Chu, Y.-Q., et al. 2012, Research in Astronomy and Astrophysics, 12, 1197, doi: 10.1088/1674-4527/12/9/003
- Damiani & Díaz (2016) Damiani, C., & Díaz, R. F. 2016, A&A, 589, A55, doi: 10.1051/0004-6361/201527100
- Davidsson (1999) Davidsson, B. J. R. 1999, Icarus, 142, 525, doi: 10.1006/icar.1999.6214
- Debes et al. (2011) Debes, J. H., Hoard, D. W., Wachter, S., Leisawitz, D. T., & Cohen, M. 2011, ApJS, 197, 38, doi: 10.1088/0067-0049/197/2/38
- Debes et al. (2012) Debes, J. H., Walsh, K. J., & Stark, C. 2012, ApJ, 747, 148, doi: 10.1088/0004-637X/747/2/148
- Deng et al. (2012) Deng, L.-C., Newberg, H. J., Liu, C., et al. 2012, Research in Astronomy and Astrophysics, 12, 735, doi: 10.1088/1674-4527/12/7/003
- Dennihy et al. (2020) Dennihy, E., Farihi, J., Gentile Fusillo, N. P., & Debes, J. H. 2020, ApJ, 891, 97, doi: 10.3847/1538-4357/ab7249
- Esposito (1993) Esposito, L. W. 1993, Annual Review of Earth and Planetary Sciences, 21, 487, doi: 10.1146/annurev.ea.21.050193.002415
- Farihi (2016) Farihi, J. 2016, New A Rev., 71, 9, doi: 10.1016/j.newar.2016.03.001
- Farihi et al. (2009) Farihi, J., Jura, M., & Zuckerman, B. 2009, ApJ, 694, 805, doi: 10.1088/0004-637X/694/2/805
- Farihi et al. (2008) Farihi, J., Zuckerman, B., & Becklin, E. E. 2008, ApJ, 674, 431, doi: 10.1086/521715
- Gänsicke et al. (2006) Gänsicke, B. T., Marsh, T. R., Southworth, J., & Rebassa-Mansergas, A. 2006, Science, 314, 1908, doi: 10.1126/science.1135033
- Gentile Fusillo et al. (2019) Gentile Fusillo, N. P., Tremblay, P.-E., Gänsicke, B. T., et al. 2019, MNRAS, 482, 4570, doi: 10.1093/mnras/sty3016
- Girven et al. (2011) Girven, J., Gänsicke, B. T., Steeghs, D., & Koester, D. 2011, MNRAS, 417, 1210, doi: 10.1111/j.1365-2966.2011.19337.x
- Graham et al. (1990) Graham, J. R., Matthews, K., Neugebauer, G., & Soifer, B. T. 1990, ApJ, 357, 216, doi: 10.1086/168907
- Grether & Lineweaver (2006) Grether, D., & Lineweaver, C. H. 2006, ApJ, 640, 1051, doi: 10.1086/500161
- Guo et al. (2015a) Guo, J., Tziamtzis, A., Wang, Z., et al. 2015a, ApJ, 810, L17, doi: 10.1088/2041-8205/810/2/L17
- Guo et al. (2015b) Guo, J., Zhao, J., Tziamtzis, A., et al. 2015b, MNRAS, 454, 2787, doi: 10.1093/mnras/stv2104
- Guo et al. (2022) Guo, J., Zhao, J., Zhang, H., et al. 2022, MNRAS, 509, 2674, doi: 10.1093/mnras/stab3151
- Hawley et al. (2002) Hawley, S. L., Covey, K. R., Knapp, G. R., et al. 2002, AJ, 123, 3409, doi: 10.1086/340697
- Hoard et al. (2013) Hoard, D. W., Debes, J. H., Wachter, S., Leisawitz, D. T., & Cohen, M. 2013, ApJ, 770, 21, doi: 10.1088/0004-637X/770/1/21
- Hunter (2007) Hunter, J. D. 2007, Computing in Science & Engineering, 9, 90, doi: 10.1109/MCSE.2007.55
- Iben et al. (1997) Iben, Icko, J., Ritossa, C., & García-Berro, E. 1997, ApJ, 489, 772, doi: 10.1086/304822
- Ivanova et al. (2013) Ivanova, N., Justham, S., Chen, X., et al. 2013, A&A Rev., 21, 59, doi: 10.1007/s00159-013-0059-2
- Jura (2003) Jura, M. 2003, ApJ, 584, L91, doi: 10.1086/374036
- Kaiser et al. (2010) Kaiser, N., Burgett, W., Chambers, K., et al. 2010, in Society of Photo-Optical Instrumentation Engineers (SPIE) Conference Series, Vol. 7733, Ground-based and Airborne Telescopes III, ed. L. M. Stepp, R. Gilmozzi, & H. J. Hall, 77330E, doi: 10.1117/12.859188
- Kleinman et al. (2013) Kleinman, S. J., Kepler, S. O., Koester, D., et al. 2013, ApJS, 204, 5, doi: 10.1088/0067-0049/204/1/5
- Koester (2009) Koester, D. 2009, A&A, 498, 517, doi: 10.1051/0004-6361/200811468
- Koester et al. (2014) Koester, D., Gänsicke, B. T., & Farihi, J. 2014, A&A, 566, A34, doi: 10.1051/0004-6361/201423691
- Lai et al. (2021) Lai, S., Dennihy, E., Xu, S., et al. 2021, ApJ, 920, 156, doi: 10.3847/1538-4357/ac1354
- Lawrence et al. (2007) Lawrence, A., Warren, S. J., Almaini, O., et al. 2007, MNRAS, 379, 1599, doi: 10.1111/j.1365-2966.2007.12040.x
- Ma & Ge (2014) Ma, B., & Ge, J. 2014, MNRAS, 439, 2781, doi: 10.1093/mnras/stu134
- Marcy & Butler (2000) Marcy, G. W., & Butler, R. P. 2000, PASP, 112, 137, doi: 10.1086/316516
- Marocco et al. (2021) Marocco, F., Eisenhardt, P. R. M., Fowler, J. W., et al. 2021, ApJS, 253, 8, doi: 10.3847/1538-4365/abd805
- Maxted et al. (2006) Maxted, P. F. L., Napiwotzki, R., Dobbie, P. D., & Burleigh, M. R. 2006, Nature, 442, 543, doi: 10.1038/nature04987
- Mullally et al. (2007) Mullally, F., Kilic, M., Reach, W. T., et al. 2007, ApJS, 171, 206, doi: 10.1086/511858
- Mustill & Villaver (2012) Mustill, A. J., & Villaver, E. 2012, ApJ, 761, 121, doi: 10.1088/0004-637X/761/2/121
- Nordhaus et al. (2010) Nordhaus, J., Spiegel, D. S., Ibgui, L., Goodman, J., & Burrows, A. 2010, MNRAS, 408, 631, doi: 10.1111/j.1365-2966.2010.17155.x
- Pätzold & Rauer (2002) Pätzold, M., & Rauer, H. 2002, ApJ, 568, L117, doi: 10.1086/339794
- Rafikov (2011) Rafikov, R. R. 2011, ApJ, 732, L3, doi: 10.1088/2041-8205/732/1/L3
- Rafikov & Garmilla (2012) Rafikov, R. R., & Garmilla, J. A. 2012, ApJ, 760, 123, doi: 10.1088/0004-637X/760/2/123
- Reach et al. (2005) Reach, W. T., Kuchner, M. J., von Hippel, T., et al. 2005, ApJ, 635, L161, doi: 10.1086/499561
- Reback et al. (2022) Reback, J., jbrockmendel, McKinney, W., et al. 2022, pandas-dev/pandas: Pandas 1.4.2, v1.4.2, Zenodo, Zenodo, doi: 10.5281/zenodo.3509134
- Rebassa-Mansergas et al. (2019) Rebassa-Mansergas, A., Solano, E., Xu, S., et al. 2019, MNRAS, 489, 3990, doi: 10.1093/mnras/stz2423
- Rocchetto et al. (2015) Rocchetto, M., Farihi, J., Gänsicke, B. T., & Bergfors, C. 2015, MNRAS, 449, 574, doi: 10.1093/mnras/stv282
- Rodrigo & Solano (2020) Rodrigo, C., & Solano, E. 2020, in XIV.0 Scientific Meeting (virtual) of the Spanish Astronomical Society, 182
- Rodrigo et al. (2012) Rodrigo, C., Solano, E., & Bayo, A. 2012, SVO Filter Profile Service Version 1.0, IVOA Working Draft 15 October 2012, doi: 10.5479/ADS/bib/2012ivoa.rept.1015R
- Rogers et al. (2020) Rogers, L. K., Xu, S., Bonsor, A., et al. 2020, MNRAS, 494, 2861, doi: 10.1093/mnras/staa873
- Schuller et al. (2009) Schuller, F., Menten, K. M., Contreras, Y., et al. 2009, A&A, 504, 415, doi: 10.1051/0004-6361/200811568
- Shirley et al. (2011) Shirley, Y. L., Huard, T. L., Pontoppidan, K. M., et al. 2011, ApJ, 728, 143, doi: 10.1088/0004-637X/728/2/143
- Skrutskie et al. (2006) Skrutskie, M. F., Cutri, R. M., Stiening, R., et al. 2006, AJ, 131, 1163, doi: 10.1086/498708
- Steele et al. (2011) Steele, P. R., Burleigh, M. R., Dobbie, P. D., et al. 2011, MNRAS, 416, 2768, doi: 10.1111/j.1365-2966.2011.19225.x
- Steele et al. (2013) Steele, P. R., Saglia, R. P., Burleigh, M. R., et al. 2013, MNRAS, 429, 3492, doi: 10.1093/mnras/sts620
- Troup et al. (2016) Troup, N. W., Nidever, D. L., De Lee, N., et al. 2016, AJ, 151, 85, doi: 10.3847/0004-6256/151/3/85
- Utomo et al. (2019) Utomo, D., Chiang, I.-D., Leroy, A. K., Sandstrom, K. M., & Chastenet, J. 2019, ApJ, 874, 141, doi: 10.3847/1538-4357/ab05d3
- Vanderburg et al. (2015) Vanderburg, A., Johnson, J. A., Rappaport, S., et al. 2015, Nature, 526, 546, doi: 10.1038/nature15527
- Vanderburg et al. (2020) Vanderburg, A., Rappaport, S. A., Xu, S., et al. 2020, Nature, 585, 363, doi: 10.1038/s41586-020-2713-y
- Veras (2014) Veras, D. 2014, MNRAS, 442, L71, doi: 10.1093/mnrasl/slu053
- Veras et al. (2013) Veras, D., Mustill, A. J., Bonsor, A., & Wyatt, M. C. 2013, MNRAS, 431, 1686, doi: 10.1093/mnras/stt289
- Villaver & Livio (2007) Villaver, E., & Livio, M. 2007, ApJ, 661, 1192, doi: 10.1086/516746
- Villaver & Livio (2009) —. 2009, ApJ, 705, L81, doi: 10.1088/0004-637X/705/1/L81
- Virtanen et al. (2020) Virtanen, P., Gommers, R., Oliphant, T. E., et al. 2020, Nature Methods, 17, 261, doi: 10.1038/s41592-019-0686-2
- Werner et al. (2004) Werner, M. W., Roellig, T. L., Low, F. J., et al. 2004, ApJS, 154, 1, doi: 10.1086/422992
- Wilson et al. (2019) Wilson, T. G., Farihi, J., Gänsicke, B. T., & Swan, A. 2019, MNRAS, 487, 133, doi: 10.1093/mnras/stz1050
- Wright et al. (2010) Wright, E. L., Eisenhardt, P. R. M., Mainzer, A. K., et al. 2010, AJ, 140, 1868, doi: 10.1088/0004-6256/140/6/1868
- Xu & Jura (2012) Xu, S., & Jura, M. 2012, ApJ, 745, 88, doi: 10.1088/0004-637X/745/1/88
- Xu et al. (2016) Xu, S., Jura, M., Dufour, P., & Zuckerman, B. 2016, ApJ, 816, L22, doi: 10.3847/2041-8205/816/2/L22
- Xu et al. (2020) Xu, S., Lai, S., & Dennihy, E. 2020, ApJ, 902, 127, doi: 10.3847/1538-4357/abb3fc
- York et al. (2000) York, D. G., Adelman, J., Anderson, John E., J., et al. 2000, AJ, 120, 1579, doi: 10.1086/301513
- Zhang et al. (2013) Zhang, Y.-Y., Deng, L.-C., Liu, C., et al. 2013, AJ, 146, 34, doi: 10.1088/0004-6256/146/2/34
- Zhao et al. (2012) Zhao, G., Zhao, Y.-H., Chu, Y.-Q., Jing, Y.-P., & Deng, L.-C. 2012, Research in Astronomy and Astrophysics, 12, 723, doi: 10.1088/1674-4527/12/7/002
- Zhao et al. (2013) Zhao, J. K., Luo, A. L., Oswalt, T. D., & Zhao, G. 2013, AJ, 145, 169, doi: 10.1088/0004-6256/145/6/169
- Zuckerman & Becklin (1987) Zuckerman, B., & Becklin, E. E. 1987, Nature, 330, 138, doi: 10.1038/330138a0
- Zuckerman et al. (2003) Zuckerman, B., Koester, D., Reid, I. N., & Hünsch, M. 2003, ApJ, 596, 477, doi: 10.1086/377492
- Zuckerman et al. (2010) Zuckerman, B., Melis, C., Klein, B., Koester, D., & Jura, M. 2010, ApJ, 722, 725, doi: 10.1088/0004-637X/722/1/725