Impact of Sb degrees of freedom on the charge density wave phase diagram of the kagome metal CsV3Sb5
Abstract
Elucidating the microscopic mechanisms responsible for the charge density wave (CDW) instability of the AV3Sb5 (A=Cs, K, Rb) family of kagome metals is critical for understanding their unique properties, including superconductivity. In these compounds, distinct CDW phases with wave-vectors at the and points are energetically favorable, opening the possibility of tuning the type of CDW order by appropriate external parameters. Here, we shed light on the CDW landscape of CsV3Sb5 via a combination of first-principles calculations and phenomenology, which consists of extracting the coefficients of the CDW Landau free-energy expansion from density functional theory. We find that while the main structural distortions of the kagome lattice in the staggered tri-hexagonal CDW phase are along the nearest-neighbor V–V bonds, distortions associated with the Sb ions play a defining role in the energy gain in this and all other CDW states. Moreover, the coupling between ionic displacements from different unit cells is small, thus explaining the existence of multiple CDW instabilities with different modulations along the c-axis. We also investigate how pressure and temperature impact the CDW phase of CsV3Sb5. Increasing pressure does not change the staggered tri-hexagonal CDW ground state, even though the -point CDW instability disappears before the -point one, a behavior that we attribute to the large nonlinear coupling between the order parameters. Upon changing the temperature, we find a narrow regime in which another transition can take place, toward a tri-hexagonal Star-of-David CDW phase. We discuss the implications of our results by comparing them with experiments on this compound.
I Introduction
The family of metallic kagome compounds AV3Sb5, with A = K, Rb, Cs, exhibit pressure-tunable superconductivity with Tc ranging from 2-8 K Ortiz et al. (2020, 2021a); Li et al. (2021); Chen et al. (2021a), coexisting with a charge density wave (CDW) order which sets in at 80-100 K Ortiz et al. (2019, 2021b); Si et al. (2022); Zhu et al. (2022); Du et al. (2022); Consiglio et al. (2022). Despite concerted experimental and theoretical effort Jiang et al. (2022); Neupert et al. (2022), a complete understanding of how these electronic states change as the lattice and electronic structures are modified by pressure Chen et al. (2021b, c); Du et al. (2021), uniaxial strain Qian et al. (2021), and doping Oey et al. (2022) remains elusive.
Experimentally, X-ray diffraction studies at zero applied pressure show that the charge-ordered state induces a unit cell doubling along the in-plane a and b axes, and either a doubling or a quadrupling along the c axis Ortiz et al. (2021b); Li et al. (2021); Stahl et al. (2022). However, the exact nature of the symmetries broken by the CDW in AV3Sb5 as a function of temperature and pressure is still under investigation Wu et al. (2022). For instance, several experimental results have indicated that, upon application of pressure, there is a transition between different CDW ground states, which is indirectly manifested in the double-peak structure of the superconducting dome Chen et al. (2021b); Gupta et al. (2022); Li et al. (2022a). Different CDW states have also been reported as a function of temperature and doping Wu et al. (2022); Stahl et al. (2022); Li et al. (2022b); Kang et al. (2022a). Moreover, experiments have reported signatures of threefold rotational symmetry breaking either inside the CDW phase or at its onset Xiang et al. (2021); Zhao et al. (2021); Li et al. (2022c); Nie et al. (2022); Xu et al. (2022). Finally, time-reversal symmetry-breaking has been reported to coincide with the CDW transition temperature by SR experiments Mielke et al. (2022); Khasanov et al. (2022); Christensen and Birol (2022), whereas Kerr rotation measurements have given conflicting results Xu et al. (2022); Saykin et al. (2022); Hu et al. (2022).
Theoretically, the proximity of -point van Hove singularities to the Fermi level Kang et al. (2022b) have led to the proposal that the CDW is a correlation-driven instability Denner et al. (2021); Park et al. (2021); Lin and Nandkishore (2021); Christensen et al. (2021); Neupert et al. (2022); Tazai et al. (2022). On the other hand, the softening of several phonon modes along the - line, as seen by DFT calculations Ratcliff et al. (2021); Christensen et al. (2021); Tan et al. (2021); Subedi (2022); Tsirlin et al. (2022), indicate the importance of electron-phonon coupling in promoting the CDW phase. Time-reversal symmetry-breaking has been interpreted in terms of loop-current patterns arising from a so-called imaginary CDW (iCDW) instability Jiang et al. (2021); Park et al. (2021); Lin and Nandkishore (2021); Feng et al. (2021); Christensen et al. (2022). Importantly, even a pure iCDW instability is expected to generally induce a “real” CDW, making the investigation of the latter important to also shed light on the possible loop current patterns that can be established in these systems.
Therefore, elucidating the role played by structural and electronic degrees of freedom, particularly those not associated with the V ions at the kagome layer, is important and the subject of ongoing research Tsirlin et al. (2022); Jeong et al. (2022); Han et al. (2022). More specifically, predicting the evolution of the CDW with pressure and other tuning parameters is of critical importance to shed light on the microscopic mechanism responsible for the CDW phase, and thus to gain insight into the properties exhibited by this materials class.
In this paper, using first-principles density functional theory (DFT) in conjunction with a phenomenological Landau free-energy model, we investigate the role of the Sb degrees of freedom on the CDW instability of CsV3Sb5, as well as the evolution of the latter as a function of both pressure and temperature. DFT has been shown to correctly predict the CDW instabilities in this system Ratcliff et al. (2021); Tan et al. (2021); Subedi (2022); Tsirlin et al. (2022), whose electronic correlations do not seem to be strong enough to change the lattice energetics significantly. At the same time, phenomenological Landau models for the CDW instabilities at the and points have been analyzed to reveal the possible CDW phase diagrams in these compounds Park et al. (2021); Christensen et al. (2021).
Here, we combine these two approaches by extracting the free-energy coefficients from first-principles calculations, which allows us to “freeze” some degrees of freedom and focus on the contributions arising from different ions. We not only find that a fourth-order Landau free energy expansion is able to capture the energy landscape of CsV3Sb5 with respect to its charge ordering behavior towards a staggered tri-hexagonal CDW phase, but also that the distortions of the V-bonds alone are not enough to account for the energy gain in the CDW phase. In particular, our calculations show that the apical Sb displacements are significantly more important than previously assumed for the stabilization of any of the stable CDW phases, which may have important consequences for the mechanism of the CDW. Interestingly, the relative distortions between ions of different unit cells give only a small contribution to the CDW energetics, which addresses why there are multiple CDW instabilities along the - line in momentum space.
We take advantage of the Landau free energy expansion to establish how the CDW phase evolves with pressure and temperature. We show that there is a rather narrow parameter regime in which two well separated CDW transitions (corresponding in our calculations to the staggered tri-hexagonal and tri-hexagonal Star-of-David CDW phases) onset as a function of temperature, as suggested by some experiments Wu et al. (2022); Stahl et al. (2022); Khasanov et al. (2022); Guguchia et al. (2022). This result indicates that another ordered state not captured by DFT with the generalized gradient approximation, such as time-reversal symmetry-breaking iCDW order, may be necessary to account for two different transition temperatures in CsV3Sb5. By performing our calculations in the presence of hydrostatic pressure, we find that the staggered tri-hexagonal CDW ground state does not change, despite the fact that the -point instability is absent at high enough pressures. Combined with the pressure dependence of the Landau coefficients, this suggests that the nonlinear coupling between the two CDW order parameters with wave-vectors at the and points is essential to drive the CDW instability in the kagome metals.
This paper is organized as follows: In Section II, we give an overview of our methods. In Subsection III.1, we present the Landau free energy, and its coefficients as predicted from DFT. In Subsection III.2, we elucidate the effect of the apical Sb ion on the phase stability of CDW. We discuss the effect of pressure in Subsection III.3, and draw finite-temperature phase diagrams in Subsection III.4. We conclude with a summary and discussions in Section IV.
II Methods
All DFT calculations were performed using Projector Augmented Waves (PAW) as implemented in the Vienna Ab initio simulation package (VASP) version 5.4.4 Kresse and Hafner (1993); Kresse and Furthmüller (1996a, b). We used the PBEsol exchange correlation functional, with valence configurations of 5s25p66s1, 3s23p63d44s1, and 5s25p3 corresponding to Cs, V, and Sb, respectively. Lattice parameters were found to be converged to within 0.001 Å using a plane wave cutoff energy of 450 eV, a -centered Monkhorst-Pack k-point mesh of 202010, and a 2nd order Methfessel-Paxton smearing parameter of 10 meV.
Using DFT and the Landau free-energy derived in Ref. Christensen et al. (2021), we explore the CDW behavior of CsV3Sb5 at various pressures. The AV3Sb5 compounds are predicted to have phonon instabilities at the and points of their hexagonal Brillouin zones Cho et al. (2021); Qian et al. (2021). We use the eigenvectors of the force constant matrix (FCM) corresponding to the unstable modes that transform as irreducible representations (irreps) M and L as a basis, and use their amplitudes as the order parameter components and , respectively. At each pressure, the free-energy coefficients are found by freezing in selected combinations of the order parameters at various amplitudes and performing a least-squares fit to the data set. We confirmed that the signs and magnitudes of these coefficients do not qualitatively change when coefficients beyond fourth-order are included in the fit.
III Results
III.1 Electronic structure and free-energy coefficients at zero applied pressure and temperature
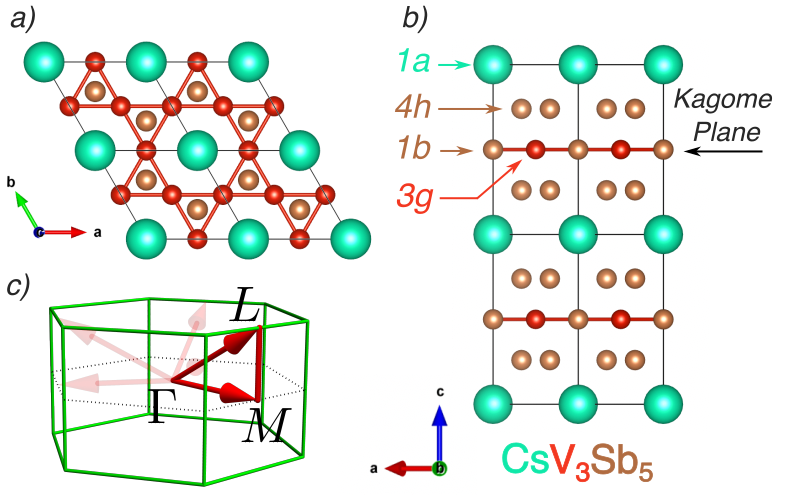
At room temperature and ambient pressure, CsV3Sb5 adopts the (#191) space group, with Cs occupying the Wyckoff site, V the site, and Sb the and sites. Using DFT structural relaxation, we predict lattice parameters Å and Å, as well as a coordinate for the apical Sb at the site with in fractional coordinates. We find phonon instabilities that lead to CDW driven structural distortions transforming as the and irreducible representations of the space group, in agreement with earlier reports Ratcliff et al. (2021); Christensen et al. (2021).
There are three distinct points and three distinct points in the hexagonal Brillouin zone, as shown in Fig. 1, which we denote as and . The point wavevectors have zero (out-of-plane) component, and they correspond to the face centers of the hexagonal Brillouin zone. have the same in-plane components as , but they also have a component of , which places them at the edge centers of the hexagon on the top or bottom faces, as illustrated in Fig. 1. The different components of the and CDW order parameters correspond to displacement patterns with different wavevectors, such that the component and have the wavevectors and respectively.
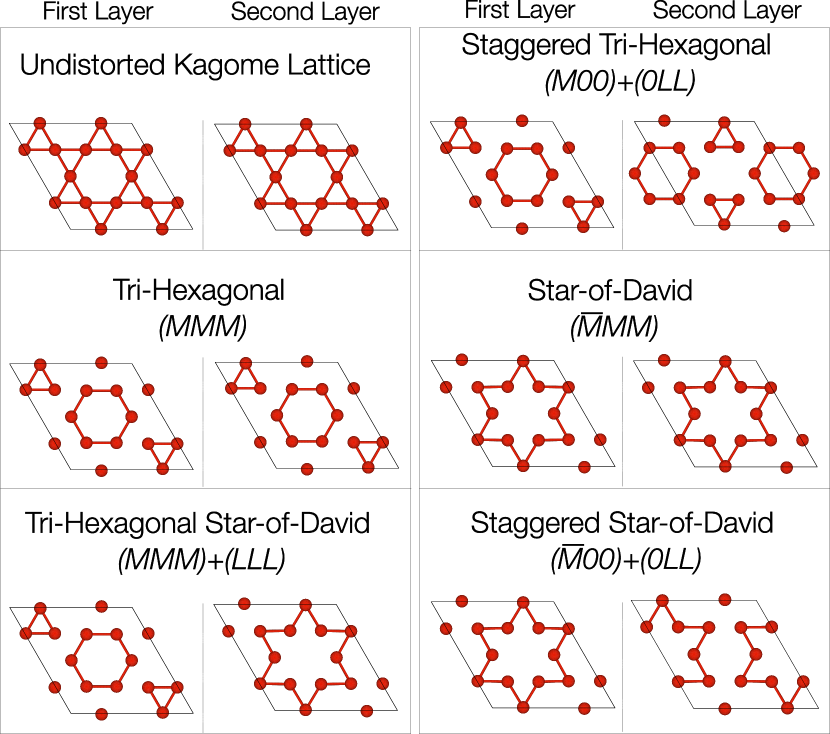
While for an isolated kagome plane there are only two types of in-plane triple- charge-order patterns (called tri-hexagonal and Star-of-David), there are several different possibilities for stacking them between consecutive layers. They correspond to distinct superpositions of the three and three CDW components, giving rise to a large number of different CDW phases with distinct symmetries Christensen et al. (2021). In the remainder of this paper, we denote the phases reached by different directions in parameter space using the notation , similar to the one employed in Ref. 38. As explained above, and refer to the amplitude of each and order parameter, respectively. For distortions where all of the or order parameters have zero amplitude, we use the notation and , respectively. Illustrations of the phases discussed in this study are shown in Fig. 2. In the notation used in this figure, we take all and values to be positive, with negative values denoted by an overbar. Note that for each phase, multiple equal-energy domains that are equivalent to each other up to a translation or rotation can be obtained from combinations of order parameter components that preserve the signs of the products and . For example, . We do not discuss different domains of each phase further since they are of no consequence in a single-domain system.
Following Ref. 38 (see also Ref. 36), the Landau free energy in terms of and takes the form of
| (1) |
where
| (2) |
| (3) |
and
| (4) |
Here, we defined and , with and defined analogously. The form of this free energy is determined by symmetry, and it is the most general fourth-order polynomial of and that transforms as a scalar under the symmetry operations of space group . A necessary, but not sufficient, condition for a term to appear in this expansion is that its total wavevector is zero, so that the free energy is invariant under lattice translations. The sum of the three point wavevectors is zero modulo a reciprocal lattice vector (), and hence the trilinear term is allowed 111We use the word ‘trilinear’ to refer to expressions which involve three different order parameter components to differentiate them from the more common cubic terms such as . This is a more general use the term than, for example, in the ferroelectrics community where the word ‘trilinear’ is used to refer to a combination of three different irreps (, etc.). For example, see Ref. [Etxebarria2010; Mulder2013; Li2020Barrier].. However, there is no trilinear term proportional to because . Accordingly, there are trilinear terms between two and one component proportional to because .
| Pressure | |||||||||||
|---|---|---|---|---|---|---|---|---|---|---|---|
| (GPa) | (eV/Å2) | (eV/Å2) | (eV/Å3) | (eV/Å3) | (eV/Å4) | (eV/Å4) | (eV/Å4) | (eV/Å4) | (eV/Å4) | (eV/Å4) | (eV/Å4) |
| 0.00 | -2.53 | -2.92 | -22.16 | -24.15 | 76.43 | 89.93 | -137.67 | -194.47 | 347.73 | 332.28 | 24.20 |
| 0.80 | -1.78 | -2.42 | -22.88 | -30.15 | 73.05 | 77.68 | -128.01 | -127.43 | 347.38 | 341.12 | 29.53 |
| 1.74 | -1.00 | -2.21 | -17.57 | -27.78 | 52.87 | 74.91 | -94.82 | -122.71 | 244.04 | 324.52 | 24.79 |
| 2.50 | -0.53 | -1.31 | -10.60 | -32.66 | 70.71 | 82.46 | -118.16 | -138.51 | 266.06 | 333.90 | 12.58 |
| 3.50 | 0.51 | -0.89 | -7.06 | -31.62 | 16.01 | 110.61 | 61.26 | -203.07 | 98.22 | 353.52 | 3.45 |
| 5.00 | 1.22 | -0.43 | 3.56 | -20.41 | 101.42 | 181.22 | -64.76 | -279.73 | 400.84 | 639.46 | -32.88 |
The Landau coefficients (Greek letters and ) in Eq. 4 are material-specific coefficients that can be obtained from DFT. We calculate these quantities by performing a simultaneous least-squares fit of the total energy extracted from DFT as a function of a selected combination of order parameters 222All numerical fits were performed using the SciPy Python library. In order to insure a good fit to the 11 coefficients in Equations 2-4, the energies associated with distortions in 13 directions in parameter space were calculated, then simultaneously fit using the non-linear least-squares method. These directions were selected to insure that the resulting system of least-squares normal equations spanned the space of all unknown coefficients, and consist of , , , , , , , , , , , and . A Landau free energy including terms up to 5th order showed no appreciable change in the 2nd- through 4th-order coefficients. Note that for the 3.50 GPa pressure data, the M-point phonons are stable (), but just barely so. This makes the energy surface highly sensitive to distortions of pure order, and leads to difficulties in distinguishing between even-order terms in the energy expansion that involve distortions only. Thus, the quantitative accuracy of , , and at this pressure value may be less robust than for other values in Table 1. In practice, we take the eigenvectors associated with each of the unstable eigenvalues of the force constant matrix that transform as and as the distortions associated with the and point order parameters, respectively. Then, we use DFT to calculate the energy associated with combinations of these distortions with various amplitudes and frozen into a 222 supercell commensurate with the stars of both the and points in reciprocal space. The coefficients obtained from these calculations at different values of hydrostatic pressure are shown in Table 1.
Since and are proportional to the square of the frequencies of the unstable phonon modes at and , respectively, these results show that at 3.50 GPa, the CDW instability has disappeared, whereas the CDW instability is suppressed at approximately 5.00-6.50 GPa. We note that the exact value of pressure where this suppression occurs is hard to pinpoint from DFT, as it also depends on the choice of exchange-correlation functional and van der Waals corrections. Nevertheless, the qualitative trends are expected to be reliable Gupta et al. (2022).
The “pure ” () and “mixed irrep” () trilinear coupling coefficients are significant at almost all pressures, and hence play an important role in determining the structure of the energy surface. Also of interest are the biquadratic terms and , which take negative values at all pressures explored. While other fourth-order terms ensure positive curvature at large displacement amplitudes that keep the free energy bounded, and the third-order terms are dominant in CsV3Sb5, and could play an important role in shaping the competition between CDW phases in other kagome systems, where their magnitude could be larger.
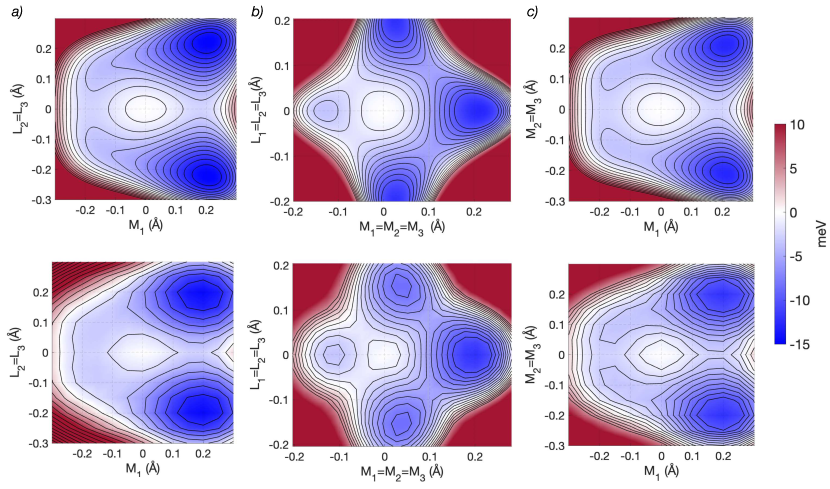
We show the energy contour plots along various cuts of the six-dimensional phase space in Fig. 3. In order to assess whether the fourth-order expansion is sufficient to capture the topography of the energy landscape, we show the energies calculated using the Landau free-energy expression and the coefficients from Table 1 on the top panels of the figure, whereas the bottom panels display the energies as obtained directly from DFT. The comparison reveals good qualitative and quantitative agreement between the fit and DFT, with the fitted free energy capable of capturing all local minima, as well as their relative amplitudes and energies. This suggests that a fourth-order free-energy expression is sufficient to capture the energetics of the CDW degrees of freedom. At zero temperature and zero applied pressure, a minimization of the free energy predicts the equilibrium phase to be the (staggered tri-hexagonal) phase, in agreement with our DFT structural relaxations, which take into account strain degrees of freedom as well. Earlier first principles studies also reported the same ground state structure from structural relaxations Ratcliff et al. (2021); Tan et al. (2021).
These energy surfaces provide insights about various unusual features of the coupling between the CDW order parameters. Fig. 3a is very asymmetric as a function of , which is solely due to the trilinear coupling term . This term breaks the symmetry between in this figure, and favors , which amounts to breaking the degeneracy between the staggered Star-of-David phase, , and the staggered tri-hexagonal phase, , by favoring the latter. Another interesting feature, visible in Fig. 3b, is that the pure phase (the minimum on the horizontal axis) is lower in energy than the mixed phase (the minimum slightly off of the vertical axis), despite the latter being a subgroup of the former. This is due to an interplay between third-order and fourth-order terms in the free energy expansion: The phase has a considerable energy gain from the pure trilinear coupling , whereas the phase only has a small gain from the mixed trilinear coupling because of the small amplitude of . A larger value of in the phase is disfavored because of the fourth-order couplings , which results in the relative stability of the phase over .
The similarity between Figs. 3a and c is also striking. For Fig. 3c, where only CDW orders at the -point are considered, the trilinear term drives the minimum of the free energy to a point in phase space where , regardless of the sign of , which only determines whether the Star-of-David () or the tri-hexagonal () phase is favored Christensen et al. (2021). Both of these phases retain the six-fold rotational symmetry in their point group, which would be broken if any of the were not equal to the others. However, Fig. 3a shows an energy minimum very close to , despite the fact that no similar symmetry conditions or constraints are enforced by the form of the free energy.
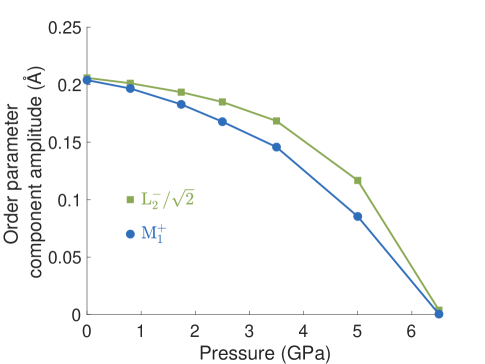
We explored the structural details of the tri-hexagonal CDW phase, with space group and which is the global minimum of the free energy, using DFT to relax all structural degrees of freedom in it. We then used ISODISTORT sto ; Stokes et al. (2006) to decompose the distortions from the parent kagome structure in terms of the irreps of space group . The relaxed structure hosts multiple distortions with different irreps, including -point strain modes. These uniform distortions are induced by their coupling to the and CDW distortions. For simplicity, we ignore them and focus only on the unstable and modes. We find that the total distortion can indeed be described by a superposition of and irreps of near-equal magnitudes (within 1% at zero pressure, see Fig. 6), which primarily takes the form of distortions of the V and Sb ions as seen from the decomposition of each irrep into separate ionic displacements (Fig. 4, discussed further in Section III.2). Note that neither the or irreps accommodate distortions of the Sb ions located in the kagome plane (Wyckoff site in space group ), nor are there any degrees of freedom in the Wyckoff sites corresponding to those ions in the CDW phase (sites , , of space group ). This means that all Sb distortions in Fig. 4 refer to the “apical” (Wyckoff site in ) Sb ions located above and below the kagome plane.
Taken together, these results suggest that, while the coupling between the -point and -point CDWs play an important role in determining the global energy minimum, it is intralayer interactions between ions in the same vanadium kagome sublattice, as well as their coupling to neighboring Sb ions, that dominates the behavior of the energy surface, with little coupling to layers in neighboring unit cells. This is supported by the similarity of pure- and pure- coefficients in Table 1 at 0.0GPa, especially the terms, which are proportional to the squared phonon frequencies and are within about 15% of each other. Since these values are so close, we conclude that the vibrational frequencies are fairly agnostic as to whether their associated distortions are in-phase or out-of-phase with respect to neighboring kagome layers, again supporting a physical picture of weak interaction between nearest-neighbor unit cells.
While this interpretation is consistent with the layered crystal structure of AV3Sb5 and is also in line with many studies that assume well isolated vanadium kagome layers that are stacked with some space-filling ions in between, in the following sections we argue that ions other than vanadium are also important for the CDW phase.
III.2 Importance of apical Sb displacement
While much of the theoretical work on AV3Sb5 has focused on the role of the V ions that form the kagome lattice, there is a growing body of evidence that points to the important role of the Sb ions Tsirlin et al. (2022); Jeong et al. (2022); Han et al. (2022); Oey et al. (2022). Importantly, the orbitals of both types of Sb anions (in-plane and apical) together give rise to a -centered Fermi surface pocket Tsirlin et al. (2022); Jeong et al. (2022); Oey et al. (2022). Moreover, certain types of imaginary CDW or loop current phases are predicted to induce magnetic moments on the in-plane Sb ions Christensen et al. (2022). As for the apical Sb ions, constrained random phase approximation calculations report that they give an important contribution to the correlation strength in CsV3Sb5 Jeong et al. (2022). Finally, as discussed in the previous section, both and CDW order parameters involve displacements of the apical Sb ions, while the planar Sb ions remain fixed by symmetry in many CDW phases.
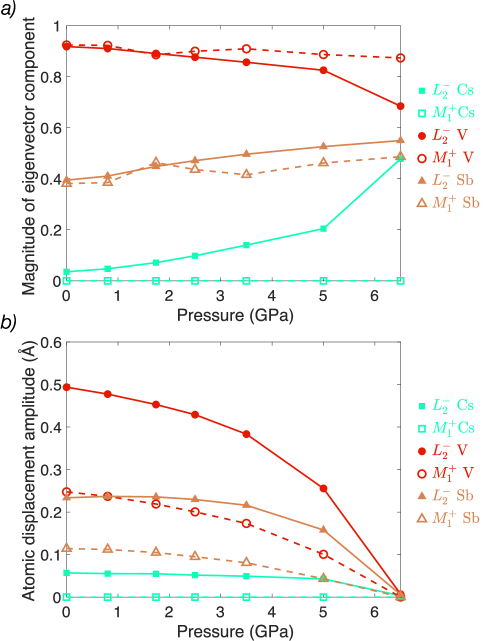
In addition to their role in the electronic structure, the Sb ions can also be important in determining the relative stability of different CDW phases. Indeed, while the ionic displacements associated with the unstable and modes obtained from phonon calculations are primarily dominated by the V ions, decomposition of force constant matrix (FCM) eigenvectors and the relaxed structures suggests that the displacements of other ions may play an important role in the energetics of the CDW phase. In Fig. 4a, we plot the components of the FCM eigenvectors of the unstable and modes. The FCM eigenvectors are conceptually similar to the dynamical matrix eigenvectors, which give the displacement pattern of phonon modes when multiplied by the square roots of the atomic masses. However, for unstable lattice modes, the FCM eigenvectors give a more precise description of the displacement pattern since they do not depend on the masses of the atoms. The FCM eigenvector of both and modes at zero pressure has the largest contribution from the V ions, with Sb atoms having a smaller total displacement despite the fact that there is a larger number of Sb ions being displaced. Under pressure, the most significant change is an increase in the out-of-plane Cs ion displacement in the mode, but the Sb contribution remains relatively flat.
The FCM eigenvectors only contain information about the nature of the instabilities in harmonic order, and cannot capture the effects of the higher order terms in the lattice Hamiltonian. As a result, they cannot explain which ions’ displacements lead to the largest energy gain, because the higher order interactions can give rise to a different ionic displacement pattern when the lattice is relaxed. In order to evaluate this possibility, in Fig. 4b, we plot the total amplitudes of ionic displacements in the staggered tri-hexagonal phase decomposed into different irreps and ions. We note that the Sb displacements with character in the relaxed structure are as large as the V displacements with character, and therefore, Sb displacements may be responsible of a significant energy gain in the CDW phase.
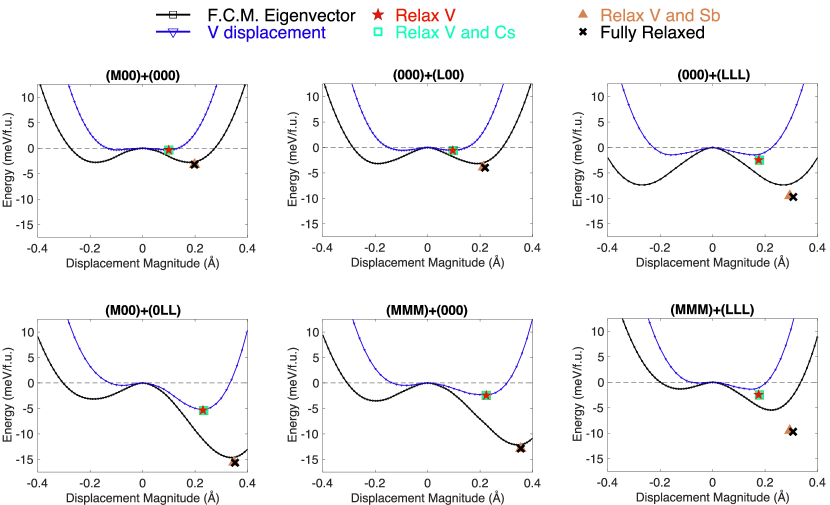
To investigate the importance of the degrees of freedom other than V displacements, we perform a series of DFT calculations, the results of which are shown in Fig. 5. Each panel of Fig. 5 shows the energy calculated for a different CDW phase [, , etc.] as a function of ionic displacements. For each phase, we consider two different displacement patterns: The black solid lines correspond to distortions according to the FCM eigenvectors, and thus include a displacement of Sb and Cs ions in addition to the V ions. The blue solid lines, on the other hand, are the energies when only the V ions are displaced according to the same pattern, but the positions of the Cs and Sb ions are kept fixed. In every case, we find that that black curve goes much deeper than the blue one. In other words, even though there is an energy gain even when only V ions are displaced, this energy gain is much less than that obtained when all ions are displaced. Thus, the greatest share of the free energy change is associated with degrees of freedom other than the vanadium displacement. These other degrees of freedom are not unstable by themselves, however, it is their interactions with the V displacements (i.e. the off-diagonal elements of the FCM) that lead to these large energy gains.
In order to further learn how these other degrees of freedom contribute to free energy, we also performed constrained ionic relaxations in DFT. In these calculations, the ionic positions are allowed to relax to the minimum energy configuration that preserves symmetry. As the starting point, we used the minimum of each V–V-only distortion pattern (i.e. the minimum of the blue curves), and performed four different types of relaxations while keeping certain ions’ positions fixed. The results of these calculations are shown by different symbols in Fig. 5. Keeping the Cs and Sb ions fixed while allowing the V ions to relax (red stars) gives rise to a marginal energy gain and additional displacements compared to the minimum of the blue curve. This indicates that, in this relaxed structure, the V displacements differ very little from the pattern obtained from the force constant matrix eigenvectors. Relaxing both the V and the Cs ions (green squares) makes almost no difference either, implying that the Cs ions have almost no effect in the stabilization of the CDW phase. Hence, we conclude that any difference between the CDW behavior in CsV3Sb5, RbV3Sb5 and KV3Sb5 is likely due to the size effects of the different alkali metals, which change the lattice parameter and hence the electronic structure, and not directly due to steric effects related with the alkali metal displacements.
Unlike the Cs ions, the relaxation of the Sb ions make a significant difference in the amount of energy gained. Relaxing both the V and the Sb ions (brown triangles) leads to both an energy and a mode amplitude that are close to the minimum of the curve where all ions are displaced according to the FCM eigenvector. Therefore, while the V-ion degrees of freedoms by themselves can explain the presence of the CDW instability and qualitatively capture the ground state symmetry, the displacements of the Sb ions are essential in obtaining the large energy gain that stabilizes the CDW phase at K. Finally, also relaxing Cs together with V and Sb (black crosses) makes very little difference, confirming the unimportance of Cs displacements.
III.3 Effect of Hydrostatic Pressure
CsV3Sb5 exhibits a rich phase diagram under hydrostatic pressure, where the CDW order is suppressed around 2 GPa, while superconductivy displays a double-peak dome behavior when it coexists with CDW Yu et al. (2021a); Zhang et al. (2021); Chen et al. (2021b, c); Du et al. (2022); Gupta et al. (2022); Qian et al. (2021). In this subsection, we study the evolution of the CDW under pressure by focusing on the coefficients of the Landau free-energy to predict any change in the CDW ground state of the system.
In Table 1, we show the values of the free energy coefficients for CsV3Sb5 under pressure. As the pressure increases, both quadratic coefficients and become less negative, which is consistent with the disappearance of the CDW under pressure in the experiments discussed above. Interestingly, changes sign and becomes positive while remains negative, indicating that, in the higher pressure regime, it is the instability that drives the CDW transition. However, as shown in Figure 6, the distortions continue to contribute significantly to the CDW phase, even in this regime.
We also find large changes in the the third-order coefficients and , with becoming less negative much faster than with increasing pressure, and even changing sign near 5.0 GPa. Despite these changes, the CDW phase is predicted by both DFT and the fitted free energy function to be the lowest enthalpy structure throughout the entire pressure range, as seen in Fig. 7a. However, the energy difference between the three lowest energy CDW phases shown in Fig. 7a is typically of the order of few meV per formula unit, which suggests that the vibrational entropy of the ions, which is not taken into account in our calculations, can be large enough to lead to a different ground state or even a phase transition under pressure. We also note that the critical pressure we predict for the complete suppression of the CDW, GPa, which we reported previously in Ref. Gupta et al. (2022), is higher than the experimentally reported value, which may in large part be due to the systematic errors in DFT and GGA approximations. The trends in the coefficients, which do not sensitively depend on the equilibrium lattice constants, are nevertheless reliable.
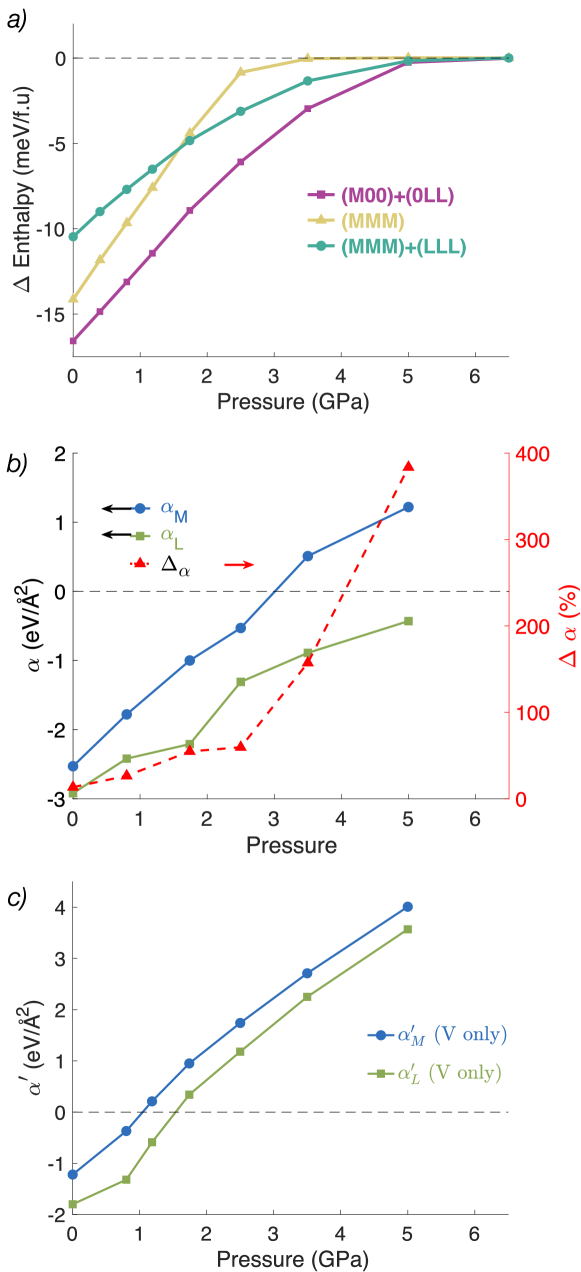
As discussed in Section III.1, the similarity between and can be interpreted as a measure of the weakness of the coupling between the displacements of ions in neighboring unit cells along the axis. Moreover, the CDW structural distortion patterns associated with the unstable modes are nearly the same as those associated with the modes, except that in the mode each kagome layer is out of phase from its neighbors Christensen et al. (2021). Thus, if the frequencies of the and phonon modes are close in value, it suggests that the frequencies are relatively indifferent to the relative phases between each layer. Since and are the two endpoints of the line in reciprocal space parameterized by , the similarity of and can be used as a rough measure of the sensitivity of a phonon frequency to , which modulates the phase relation between neighboring layers. Fig. 7b shows how the relative difference between the quadratic coefficients of the and modes, , changes as a function of pressure. becomes positive faster than , and as the latter approaches zero, increases sharply. This steady increase with pressure indicates an increased importance of the interlayer coupling under pressure. This may be due to the decrease of the out-of-plane axis, enhancing the possibility that the leading instability transforms like an irrep associated with another wave-vector on the line.
We also find that the the non-vanadium degrees of freedom discussed in Section III.2 play a critical role in the evolution of the structural instability with pressure. Fig. 7c shows the and values calculated using the distortion patterns associated only with V displacements rather than the eigenvectors of the force constant matrix. These are not only far less negative than the actual values show in Figure 7b, but also become positive at a much smaller pressure. As a result, in the absence of Sb and Cs displacements, the CDW instabilities are greatly weakened, in line with the results in Fig. 5. Thus, the displacements of Sb ions not only play an important role in the stability of the CDW phase of CsV3Sb5 at zero pressure, but also in controlling how the CDW instability evolves with pressure.
III.4 Finite Temperature Phase Diagrams
While the DFT analysis of the CDW energetics is valid only at , the Landau free-energy expansion allows us to also investigate the fate of the CDW transitions at finite temperatures. The close proximity between different CDW ground states at , as shown for instance in Fig. 7, suggests that multiple CDW transitions can take place as a function of temperature. While such a scenario was explored phenomenologically in Ref. Christensen et al. (2021) using the same free energy as in Eq. 1, our approach gives the Landau parameters of CsV3Sb5 directly from DFT. Experimentally, probes such as Raman spectroscopy Wu et al. (2022), SR Yu et al. (2021b); Khasanov et al. (2022), and elastoresistance Nie et al. (2022) report signatures consistent with multiple CDW transitions as temperature is changed, which may also involve time-reversal and threefold rotational symmetry-breaking.
In order to render the problem tractable, and following the spirit of a Landau expansion, we assume that only the quadratic coefficients and are temperature dependent. Thus, we define and , and set the zero temperature quadratic coefficients and equal to the and predicted by DFT, while treating the bare critical temperatures and as free parameters. For all third and fourth order coefficients, we use the values extracted from DFT at each pressure. Because, in general, , the temperature phase diagrams depend on the absolute values of both and , and not just on their difference. It is therefore convenient to define the average transition temperature , which sets the temperature scale of the transition, and the dimensionless temperature difference , such that and . For concreteness, we consider the range . This range is likely to include the actual value of given how close and are to each other at zero temperature.
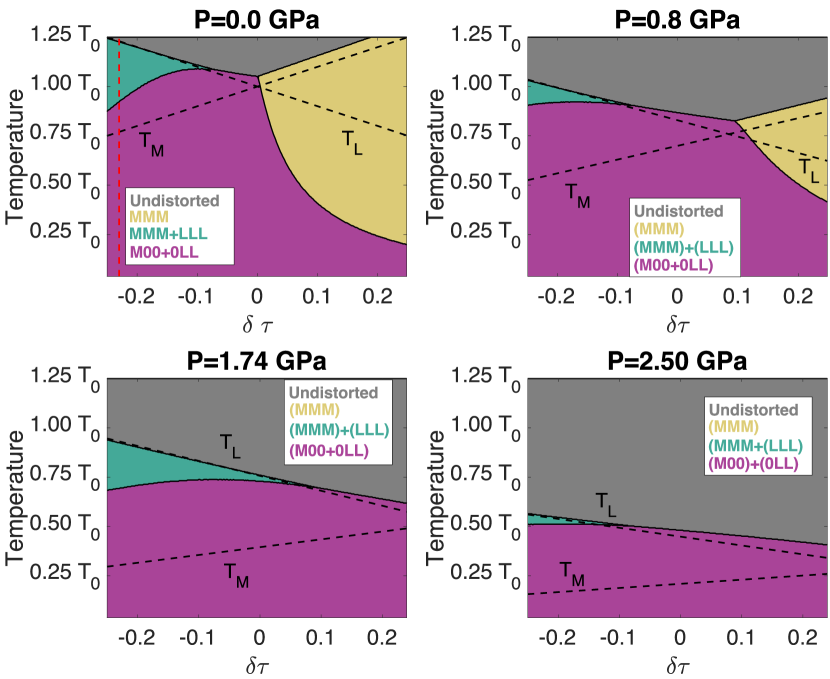
The CDW phase diagram is found by numerically minimizing the resulting free energy as a function of each of the six order parameter components and using the L-BFGS-G algorithm Liu and Nocedal (1989) and the SciPy Python library Virtanen et al. (2020), considering a grid of 300 values of and 400 values of at each pressure. In Fig. 8a, we show the zero pressure CDW phase diagram. There are three different possible CDW phases, which correspond to the three lowest energy CDW structures found in DFT. While the zero temperature CDW ground state is (staggered tri-hexagonal) for any value of , the CDW phase condensed immediately below the highest temperature transition can be either or a different phase – namely, (tri-hexagonal Star-of-David) or (planar tri-hexagonal). Since x-ray experiments find a CDW unit cell that is at least doubled along the axis, the phase cannot be the intermediate phase. Thus, the only scenario that gives two separate CDW transitions at zero pressure as a function of temperature, without invoking time-reversal symmetry-breaking, is a transition from an undistorted kagome lattice to the CDW phase, followed by a lower temperature transition to the CDW phase. This would restrict the parameter to . Moreover, it would be manifested by the breaking of threefold rotational symmetry below the second CDW transition Park et al. (2021); Christensen et al. (2021), in qualitative agreement with the experiments Nie et al. (2022); Xiang et al. (2021).
Following the Raman spectroscopy results of Ref. [Wu et al., 2022], we set the ratio between the first and second transition temperatures in CsV3Sb5 to be . Using the phase diagram at zero pressure, this sets , which implies and is indicated by the vertical dotted red line in Figure 8. This is to be contrasted with the zero-temperature DFT result that . While such a change in the proximity between the and CDW instabilities from zero temperature to finite temperature is possible, a perhaps more likely scenario would be that one of the transitions involves the condensation of a different order parameter not captured in our DFT analysis, such as the imaginary CDW (i.e. loop-current) order parameters discussed for instance in Ref. Christensen et al. (2022).
The DFT-extracted Landau coefficients in Table 1 can also be used to examine the behavior of the CDW phase as both temperature and pressure are changed simultaneously. As the quadratic coefficients become less negative under pressure, we can expect and to decrease and the undistorted kagome phase to become stable at a wider temperature range. We use a simple parametrization of and , assuming that they scale proportionally to the DFT quadratic coefficient at each finite pressure, such that
and
Thus, for a given value of (and thus a particular combination of and ) at 0 GPa, we can predict the change in the CDW behavior with pressure by combining and with the finite pressure coefficients found in Table 1, as shown in Figs. 8b-d. As the pressure increases, the area associated with the phase rapidly diminishes. This is consistent with a rapidly suppressed coefficient under pressure. The sequence of transitions from undistorted to and then to is possible throughout the studied pressure range. The CDW phase remains the lowest-energy low temperature structure for all pressures, due to the coefficient being significant even as the quadratic coefficients approach zero.
IV Conclusions
In summary, we performed a detailed first principles study of the lattice energetics of the kagome metal CsV3Sb5 by not only considering different metastable ground state candidates, but also extracting the coefficients of the Landau free-energy expansion. Using this approach, we drew finite-temperature phase diagrams under pressure, and showed that while a scenario with two lattice transitions is not explicitly inconsistent with the DFT results, it is not favored by it. We also performed constrained structural relaxations to show that while V-only displacements of atoms lead to an energy lowering, a large portion of the energy gain is obtained through Sb displacements for all ground state candidates. This shows that even though the lattice instability is driven by V displacements, its collective nature makes the apical Sb ions essential for understanding the relative stability of different CDW phases.
It is instructive to compare our results with experiments. Our finding that the Sb degrees of freedom give an important contribution to the energetics of the CDW phase is consistent with the conclusions of Ref. Han et al. (2022), which performed x-ray absorption experiments in CsV3Sb5. Moreover, our finding may also be connected to the strong sensitivity of the CDW transition temperature on the -axis parameter, as revealed by Ref. Qian et al. (2021). This is because modifications of the -axis lattice parameter promoted by hydrostatic or uniaxial pressure are expected to particularly impact the apical Sb ion displacements. This effect, in turn, should also affect the electronic structure by altering the overlap between the Sb -orbitals, which are known to contribute to the Fermi surface pocket centered at the point Tsirlin et al. (2022); Jeong et al. (2022); Oey et al. (2022), resulting in an interesting feedback between structural and electronic degrees of freedom.
Our analysis of the pressure dependence of the CDW phase reveals that the near-degeneracy between the and point instabilities, as reflected by their similar quadratic Landau coefficients, is lifted for high enough pressures. In particular, there is a range of pressures for which becomes positive while remains negative. Yet, the CDW ground state at these pressures remain the same as the one found at ambient pressure – namely, the staggered tri-hexagonal CDW phase. This highlights the importance of the coupling between the and CDW order parameters in promoting the CDW instability. Elucidating the microscopic origin of such a coupling will shed new light on the microscopic mechanism of the CDW instability. While a purely phononic mechanism is unlikely Christensen et al. (2021), our results highlighting the importance of the Sb degrees of freedom show that a mechanism relying only on the van Hove singularities arising from the V orbitals may not be enough either. Taking into account the dispersion of the saddle points that give rise to these van Hove singularities may be important to capture the coupling between the and CDW orders. Interestingly, one of these saddle points has a strong spectral weight contribution from the Sb orbitals Jeong et al. (2022). Moreover, for finite values, bands stemming from van Hove singularities even cross the Fermi level Oey et al. (2022).
Previous experiments have reported evidence for a pressure-induced transition between two different CDW phases Li et al. (2022a); Gupta et al. (2022), as reflected by the double-peak structure of the superconducting dome inside the coexistence state with CDW Yu et al. (2021a); Zhang et al. (2021); Chen et al. (2021b, c); Du et al. (2022). Our analysis, which extends the findings first reported by us in Ref. Gupta et al. (2022), reveals instead that the CDW ground state remains unchanged as a function of pressure. While effects not captured by DFT may impact the small energy differences between the stable CDW states and thus favor a different ground state, it is also plausible that a distinct type of charge order is at play, such as the so-called imaginary CDW, which breaks time-reversal symmetry.
Similarly, there is experimental evidence for two different CDW transitions as a function of temperature Wu et al. (2022); Xiang et al. (2021); Nie et al. (2022). Our finite-temperature analysis does find a narrow parameter regime in which the staggered tri-hexagonal CDW ground state is preceded by a transition to the tri-hexagonal Star-of-David CDW phase. Notwithstanding the rather restrictive conditions in this parameter range, it is not clear whether this scenario could explain the experimental observations. The main signature of the to transition would be the breaking of the threefold rotational symmetry of the kagome lattice. The transport data of Refs. Xiang et al. (2021); Nie et al. (2022) is consistent with such a transition, as threefold rotational symmetry breaking is observed only well below the CDW transition temperature. On the other hand, the optical data of Ref. Xu et al. (2022) shows threefold rotational symmetry being broken at the same temperature as the onset of CDW. Furthermore, the Raman data of Ref. Wu et al. (2022) is consistent with two CDW transitions between structures that share the same symmetries. As with the situation of the pressure-induced CDW-to-CDW transition, it is also possible that one of the finite-temperature transitions is related instead to an imaginary charge density wave (i.e. loop currents). As discussed above, while the reported SR data is characteristic of a time-reversal symmetry-breaking transition Mielke et al. (2022); Khasanov et al. (2022), there is disagreement on Kerr effect data Xu et al. (2022); Saykin et al. (2022); Hu et al. (2022). To shed more light on this issue, it would be interesting to be able to capture such loop current phases within a first-principles approach.
Acknowledgements.
We thank B. Andersen and M. Christensen for fruitful discussions. ETR and TB were supported by the NSF CAREER grant DMR-2046020. RMF was supported by the Air Force Office of Scientific Research under Award No. FA9550-21-1-0423.References
- Ortiz et al. (2020) B. R. Ortiz, S. M. Teicher, Y. Hu, J. L. Zuo, P. M. Sarte, E. C. Schueller, A. M. Abeykoon, M. J. Krogstad, S. Rosenkranz, R. Osborn, et al., Phys. Rev. Lett. 125, 247002 (2020).
- Ortiz et al. (2021a) B. R. Ortiz, P. M. Sarte, E. M. Kenney, M. J. Graf, S. M. Teicher, R. Seshadri, and S. D. Wilson, Phys. Rev. Mater. 5, 034801 (2021a).
- Li et al. (2021) H. Li, T. Zhang, T. Yilmaz, Y. Pai, C. Marvinney, A. Said, Q. Yin, C. Gong, Z. Tu, E. Vescovo, et al., Phys. Rev. X 11, 031050 (2021).
- Chen et al. (2021a) K. Chen, N. Wang, Q. Yin, Y. Gu, K. Jiang, Z. Tu, C. Gong, Y. Uwatoko, J. Sun, H. Lei, et al., Phys. Rev. Lett. 126, 247001 (2021a).
- Ortiz et al. (2019) B. R. Ortiz, L. C. Gomes, J. R. Morey, M. Winiarski, M. Bordelon, J. S. Mangum, I. W. Oswald, J. A. Rodriguez-Rivera, J. R. Neilson, S. D. Wilson, et al., Phys. Rev. Mater. 3, 094407 (2019).
- Ortiz et al. (2021b) B. R. Ortiz, S. M. Teicher, L. Kautzsch, P. M. Sarte, N. Ratcliff, J. Harter, J. P. Ruff, R. Seshadri, and S. D. Wilson, Phys. Rev. X 11, 041030 (2021b).
- Si et al. (2022) J.-G. Si, W.-J. Lu, Y.-P. Sun, P.-F. Liu, and B.-T. Wang, Phys. Rev. B 105, 024517 (2022).
- Zhu et al. (2022) C. Zhu, X. Yang, W. Xia, Q. Yin, L. Wang, C. Zhao, D. Dai, C. Tu, B. Song, Z. Tao, et al., Phys. Rev. B 105, 094507 (2022).
- Du et al. (2022) F. Du, R. Li, S. Luo, Y. Gong, Y. Li, S. Jiang, B. R. Ortiz, Y. Liu, X. Xu, S. D. Wilson, C. Cao, Y. Song, and H. Yuan, Phys. Rev. B 106, 024516 (2022).
- Consiglio et al. (2022) A. Consiglio, T. Schwemmer, X. Wu, W. Hanke, T. Neupert, R. Thomale, G. Sangiovanni, and D. Di Sante, Phys. Rev. B 105, 165146 (2022).
- Jiang et al. (2022) K. Jiang, T. Wu, J.-X. Yin, Z. Wang, M. Z. Hasan, S. D. Wilson, X. Chen, and J. Hu, Nat. Sci. Rev. (2022), 10.1093/nsr/nwac199.
- Neupert et al. (2022) T. Neupert, M. M. Denner, J.-X. Yin, R. Thomale, and M. Z. Hasan, Nat. Phys. 18, 137 (2022).
- Chen et al. (2021b) X. Chen, X. Zhan, X. Wang, J. Deng, X. B. Liu, X. Chen, J. G. Guo, and X. Chen, Chinese Phys. Lett. 38 (2021b), 10.1088/0256-307X/38/5/057402.
- Chen et al. (2021c) K. Y. Chen, N. N. Wang, Q. W. Yin, Y. H. Gu, K. Jiang, Z. J. Tu, C. S. Gong, Y. Uwatoko, J. P. Sun, H. C. Lei, J. P. Hu, and J. G. Cheng, Phys. Rev. Lett. 126 (2021c), 10.1103/PhysRevLett.126.247001.
- Du et al. (2021) F. Du, S. Luo, B. R. Ortiz, Y. Chen, W. Duan, D. Zhang, X. Lu, S. D. Wilson, Y. Song, and H. Yuan, Phys. Rev. B 103, L220504 (2021).
- Qian et al. (2021) T. Qian, M. H. Christensen, C. Hu, A. Saha, B. M. Andersen, R. M. Fernandes, T. Birol, and N. Ni, Phys. Rev. B 104, 144506 (2021).
- Oey et al. (2022) Y. M. Oey, B. R. Ortiz, F. Kaboudvand, J. Frassineti, E. Garcia, R. Cong, S. Sanna, V. F. Mitrović, R. Seshadri, and S. D. Wilson, Phys. Rev. Mater. 6, L041801 (2022).
- Stahl et al. (2022) Q. Stahl, D. Chen, T. Ritschel, C. Shekhar, E. Sadrollahi, M. C. Rahn, O. Ivashko, M. v. Zimmermann, C. Felser, and J. Geck, Phys. Rev. B 105, 195136 (2022).
- Wu et al. (2022) S. Wu, B. R. Ortiz, H. Tan, S. D. Wilson, B. Yan, T. Birol, and G. Blumberg, Phys. Rev. B 105, 155106 (2022).
- Gupta et al. (2022) R. Gupta, D. Das, C. Mielke, E. T. Ritz, F. Hotz, Q. Yin, Z. Tu, C. Gong, H. Lei, T. Birol, , R. M. Fernandes, Z. Guguchia, H. Luetkens, and R. Khasanov, Commun. Phys. 5, 1 (2022).
- Li et al. (2022a) H. Li, G. Fabbris, A. Said, J. Sun, Y.-X. Jiang, J.-X. Yin, Y.-Y. Pai, S. Yoon, A. R. Lupini, C. Nelson, et al., Nat. Commun. 13, 6348 (2022a).
- Li et al. (2022b) C. Li, X. Wu, H. Liu, C. Polley, Q. Guo, Y. Wang, X. Han, M. Dendzik, M. H. Berntsen, B. Thiagarajan, et al., Phys. Rev. Res. 4, 033072 (2022b).
- Kang et al. (2022a) M. Kang, S. Fang, J. Yoo, B. R. Ortiz, Y. M. Oey, J. Choi, S. H. Ryu, J. Kim, C. Jozwiak, A. Bostwick, et al., Nat. Mater. , 1 (2022a).
- Xiang et al. (2021) Y. Xiang, Q. Li, Y. Li, W. Xie, H. Yang, Z. Wang, Y. Yao, and H.-H. Wen, Nat. Commun. 12, 1 (2021).
- Zhao et al. (2021) H. Zhao, H. Li, B. R. Ortiz, S. M. Teicher, T. Park, M. Ye, Z. Wang, L. Balents, S. D. Wilson, and I. Zeljkovic, Nature 599, 216 (2021).
- Li et al. (2022c) H. Li, H. Zhao, B. R. Ortiz, T. Park, M. Ye, L. Balents, Z. Wang, S. D. Wilson, and I. Zeljkovic, Nat. Phys. 18, 265 (2022c).
- Nie et al. (2022) L. Nie, K. Sun, W. Ma, D. Song, L. Zheng, Z. Liang, P. Wu, F. Yu, J. Li, M. Shan, D. Zhao, S. Li, B. Kang, Z. Wu, Y. Zhou, K. Liu, Z. Xiang, J. Ying, Z. Wang, T. Wu, and X. Chen, Nature 604, 59 (2022).
- Xu et al. (2022) Y. Xu, Z. Ni, Y. Liu, B. R. Ortiz, Q. Deng, S. D. Wilson, B. Yan, L. Balents, and L. Wu, Nat. Phys. 18, 1470 (2022).
- Mielke et al. (2022) C. Mielke, D. Das, J.-X. Yin, H. Liu, R. Gupta, Y.-X. Jiang, M. Medarde, X. Wu, H. Lei, J. Chang, et al., Nature 602, 245 (2022).
- Khasanov et al. (2022) R. Khasanov, D. Das, R. Gupta, C. Mielke III, M. Elender, Q. Yin, Z. Tu, C. Gong, H. Lei, E. T. Ritz, et al., Phys. Rev. Res. 4, 023244 (2022).
- Christensen and Birol (2022) M. H. Christensen and T. Birol, Nature 602, 216 (2022).
- Saykin et al. (2022) D. R. Saykin, C. Farhang, E. D. Kountz, D. Chen, B. R. Ortiz, C. Shekhar, C. Felser, S. D. Wilson, R. Thomale, J. Xia, et al., arXiv preprint arXiv:2209.10570 (2022).
- Hu et al. (2022) Y. Hu, S. Yamane, G. Mattoni, K. Yada, K. Obata, Y. Li, Y. Yao, Z. Wang, J. Wang, C. Farhang, et al., arXiv preprint arXiv:2208.08036 (2022).
- Kang et al. (2022b) M. Kang, S. Fang, J.-K. Kim, B. R. Ortiz, S. H. Ryu, J. Kim, J. Yoo, G. Sangiovanni, D. Di Sante, B.-G. Park, et al., Nat. Phys. 18, 301 (2022b).
- Denner et al. (2021) M. M. Denner, R. Thomale, and T. Neupert, Phys. Rev. Lett. 127, 217601 (2021).
- Park et al. (2021) T. Park, M. Ye, and L. Balents, Phys. Rev. B 104, 035142 (2021).
- Lin and Nandkishore (2021) Y.-P. Lin and R. M. Nandkishore, Phys. Rev. B 104, 045122 (2021).
- Christensen et al. (2021) M. H. Christensen, T. Birol, B. M. Andersen, and R. M. Fernandes, Phys. Rev. B 104, 214513 (2021).
- Tazai et al. (2022) R. Tazai, Y. Yamakawa, S. Onari, and H. Kontani, Sci. Adv. 8, eabl4108 (2022).
- Ratcliff et al. (2021) N. Ratcliff, L. Hallett, B. R. Ortiz, S. D. Wilson, and J. W. Harter, Phys. Rev. Mater. 5, L111801 (2021).
- Tan et al. (2021) H. Tan, Y. Liu, Z. Wang, and B. Yan, Phys. Rev. Lett. 127, 046401 (2021).
- Subedi (2022) A. Subedi, Phys. Rev. Mater. 6, 015001 (2022).
- Tsirlin et al. (2022) A. Tsirlin, P. Fertey, B. R. Ortiz, B. Klis, V. Merkl, M. Dressel, S. Wilson, and E. Uykur, SciPost Phys. 12, 049 (2022).
- Jiang et al. (2021) Y.-X. Jiang, J.-X. Yin, M. M. Denner, N. Shumiya, B. R. Ortiz, G. Xu, Z. Guguchia, J. He, M. S. Hossain, X. Liu, et al., Nat. Mater. 20, 1353 (2021).
- Feng et al. (2021) X. Feng, K. Jiang, Z. Wang, and J. Hu, Sci. Bull. 66, 1384 (2021).
- Christensen et al. (2022) M. H. Christensen, T. Birol, B. M. Andersen, and R. M. Fernandes, Phys. Rev. B 106, 144504 (2022).
- Jeong et al. (2022) M. Y. Jeong, H.-J. Yang, H. S. Kim, Y. B. Kim, S. Lee, and M. J. Han, Phys. Rev. B 105, 235145 (2022).
- Han et al. (2022) S. Han, C. S. Tang, L. Li, Y. Liu, H. Liu, J. Gou, J. Wu, D. Zhou, P. Yang, C. Diao, et al., Adv. Mater. , 2209010 (2022).
- Guguchia et al. (2022) Z. Guguchia, C. Mielke III, D. Das, R. Gupta, J.-X. Yin, H. Liu, Q. Yin, M. Christensen, Z. Tu, C. Gong, et al., arXiv preprint arXiv:2202.07713 (2022).
- Kresse and Hafner (1993) G. Kresse and J. Hafner, Phys. Rev. B 47, 558 (1993).
- Kresse and Furthmüller (1996a) G. Kresse and J. Furthmüller, Comput. Mater. Sci. 6, 15 (1996a).
- Kresse and Furthmüller (1996b) G. Kresse and J. Furthmüller, Phys. Rev. B 54, 11169 (1996b).
- Cho et al. (2021) S. Cho, H. Ma, W. Xia, Y. Yang, Z. Liu, Z. Huang, Z. Jiang, X. Lu, J. Liu, Z. Liu, et al., Phys. Rev. Lett. 127, 236401 (2021).
- Note (1) We use the word ‘trilinear’ to refer to expressions which involve three different order parameter components to differentiate them from the more common cubic terms such as . This is a more general use the term than, for example, in the ferroelectrics community where the word ‘trilinear’ is used to refer to a combination of three different irreps (, etc.). For example, see Ref. [\rev@citealpnumEtxebarria2010, Mulder2013, Li2020Barrier].
- Note (2) All numerical fits were performed using the SciPy Python library. In order to insure a good fit to the 11 coefficients in Equations 2-4, the energies associated with distortions in 13 directions in parameter space were calculated, then simultaneously fit using the non-linear least-squares method. These directions were selected to insure that the resulting system of least-squares normal equations spanned the space of all unknown coefficients, and consist of , , , , , , , , , , , and . A Landau free energy including terms up to 5th order showed no appreciable change in the 2nd- through 4th-order coefficients. Note that for the 3.50 GPa pressure data, the M-point phonons are stable (), but just barely so. This makes the energy surface highly sensitive to distortions of pure order, and leads to difficulties in distinguishing between even-order terms in the energy expansion that involve distortions only. Thus, the quantitative accuracy of , , and at this pressure value may be less robust than for other values in Table 1.
- (56) H. T. Stokes, D. M. Hatch, and B. J. Campbell, ISODISTORT, ISOTROPY Software Suite, iso.byu.edu.
- Stokes et al. (2006) H. T. Stokes, D. M. Hatch, B. J. Campbell, and D. E. Tanner, J. Appl. Crystallogr. 39, 607 (2006).
- Yu et al. (2021a) F. H. Yu, D. H. Ma, W. Z. Zhuo, S. Q. Liu, X. K. Wen, B. Lei, J. J. Ying, and X. H. Chen, Nat. Commun. 12 (2021a), 10.1038/s41467-021-23928-w.
- Zhang et al. (2021) Z. Zhang, Z. Chen, Y. Zhou, Y. Yuan, S. Wang, J. Wang, H. Yang, C. An, L. Zhang, X. Zhu, Y. Zhou, X. Chen, J. Zhou, and Z. Yang, Phys. Rev. B 103 (2021), 10.1103/PhysRevB.103.224513.
- Yu et al. (2021b) L. Yu, C. Wang, Y. Zhang, M. Sander, S. Ni, Z. Lu, S. Ma, Z. Wang, Z. Zhao, H. Chen, et al., arXiv preprint arXiv:2107.10714 (2021b).
- Liu and Nocedal (1989) D. C. Liu and J. Nocedal, Math. Program. 45, 503 (1989).
- Virtanen et al. (2020) P. Virtanen, R. Gommers, T. E. Oliphant, M. Haberland, T. Reddy, D. Cournapeau, E. Burovski, P. Peterson, W. Weckesser, J. Bright, S. J. van der Walt, M. Brett, J. Wilson, K. J. Millman, N. Mayorov, A. R. J. Nelson, E. Jones, R. Kern, E. Larson, C. J. Carey, İ. Polat, Y. Feng, E. W. Moore, J. VanderPlas, D. Laxalde, J. Perktold, R. Cimrman, I. Henriksen, E. A. Quintero, C. R. Harris, A. M. Archibald, A. H. Ribeiro, F. Pedregosa, P. van Mulbregt, and SciPy 1.0 Contributors, Nat. Methods 17, 261 (2020).