IndicMT Eval: A Dataset to Meta-Evaluate
Machine Translation Metrics for Indian Languages
Abstract
The rapid growth of machine translation (MT) systems necessitates meta-evaluations of evaluation metrics to enable selection of those that best reflect MT quality. Unfortunately, most meta-evaluation studies focus on European languages, the observations for which may not always apply to other languages. Indian languages, having over a billion speakers, are linguistically different from them, and to date, there are no such systematic studies focused solely on English to Indian language MT. This paper fills this gap through a Multidimensional Quality Metric (MQM) dataset consisting of 7000 fine-grained annotations, spanning 5 Indian languages and 7 MT systems. We evaluate 16 metrics and show that, pre-trained metrics like COMET have the highest correlations with annotator scores as opposed to n-gram metrics like BLEU. We further leverage our MQM annotations to develop an Indic-COMET metric and show that it outperforms COMET counterparts in both human scores correlations and robustness scores in Indian languages. Additionally, we show that the Indic-COMET can outperform COMET on some unseen Indian languages. We hope that our dataset and analysis will facilitate further research in Indic MT evaluation.
1 Introduction
Natural language generation (NLG) has seen rapid progress in the past few years due to advancements in the field of large language models (LLMs) Lewis et al. (2020); Liu et al. (2020); Dabre et al. (2022); Scao et al. (2022). Although initial research had focused on high-resource languages, recently the focus has shifted to middle-resource and low-resource languages. In the context of machine translation (MT), there is increasing interest in building massively multilingual models supporting numerous translation directions. For example, Costa-jussà et al. (2022) release a model which supports around 200 languages (40K directions). While this is commendable, to make MT truly inclusive, it is important that various design choices in the MT life-cycle are evaluated for low-resource languages and not simply transferred and adapted from English. One such important choice is of the correct evaluation metric to be used for evaluating MT systems.
A recent survey by Sai et al. (2022) has shown that over the last decade, many evaluation metrics have been proposed for MT. In parallel, several works Callison-Burch et al. (2006); Sai et al. (2021); Mathur et al. (2020a); Tan et al. (2015); Fabbri et al. (2021) have shown the inadequacy of popular metrics, such as BLEU Papineni et al. (2002), ROUGE Lin (2004). However, many languages are not represented in these works and most of the focus is on European languages. On the other hand, there is a growing body of work on machine translation focused on language groups such as Indian Dabre et al. (2022), Indonesian Cahyawijaya et al. (2021), and African Reid et al. (2021). However, these works rely on English centric metrics due to lack of sufficient studies with tried and tested recommendations for their evaluation of the languages. While techniques like MQM (Multidimensional Quality Metric) are being used for collecting better quality human-evaluation data for English and a select few other languages Freitag et al. (2021a), such multidimensional evaluations and analyses are not available for several language groups.
We narrow our focus to evaluation of one of these language groups, namely Indian languages which have more than a billion speakers worldwide. Indian languages are morphologically rich, especially Dravidian languages, which exhibit agglutination. Furthermore, they have relatively free-word order Murthy et al. (2019); Kunchukuttan and Bhattacharyya (2020) as compared to European languages which means that frequently used metrics such as BLEU may not always be reliable. This calls for an independent focused study on the evaluation of metrics for Indic languages in order to understand whether these conclusions drawn hold true for the Indian languages.
In this paper, we aim to bridge this gap by focusing on the evaluation of MT (from English) into 5 Indian languages from 2 different families and make significant contributions towards designing MT evaluation metrics for these languages. Our main contribution is in the form of the MQM dataset for Indian languages created by taking outputs generated by 7 popular MT systems and asking human annotators to judge the quality of the translations using the MQM style guidelines Lommel et al. (2014). With the help of language experts who are experienced in translation, we generate an MQM dataset consisting of 7000 annotated sentences, 1400 per language.
We use the aforementioned dataset to establish correlations between the annotator scores and existing automatic metrics scores belonging to the following classes: (i) n-gram and character based such as BLEU, METEOR, chrF++, (ii) embeddings based such as Vector Extrema, BERTScore, (iii) pre-trained metrics like BLEURT-20, COMET. We observe that pre-trained metrics show the highest correlations with the annotator scores, with the COMET metric performing the best (§5.1). Additionally, we also observe that the metrics are not capable of capturing the fluency-based errors for Indian languages (§5.4). Finally, we use our data to train an Indic-COMET metric which not only shows stronger correlations with human judgement on Indian languages, but is also more robust to perturbations (§6). We hope that our dataset and metric, which are publicly available111https://github.com/AI4Bharat/IndicMT-Eval, will help spur research in this field.
2 Related Work
Meta-evaluation studies:
Evaluation metrics have been under intense scrutiny in order to establish their reliability. Mathur et al. (2020b) discuss that studying evaluation metrics needs to be a meticulous task by showing many potential issues and oversights that could lead to wrong conclusions. Other works focus on extending the resources for meta-evaluations Sai et al. (2021); Karpinska et al. (2022) and different genres van der Wees et al. (2018). While most of these works focus on English, there are works that evaluate the efficacy of metrics on other languages such as German, Chinese, Spanish, etc. Rivera-Trigueros and Olvera-Lobo (2021); Freitag et al. (2021b). On the other hand, we focus on Indian languages, which have not received much attention.
Collecting human annotations:
Meta-evaluation studies rely heavily on human-annotated translations of various systems. Since humans are better at providing relative ranking (i.e., comparing the qualities of 2 or more items) rather than providing absolute scores to quantify the quality of an item, WMT15-17 collected Relative Rankings Bojar et al. (2015, 2016a, 2017). However, since they require a quadratic number of ratings, Direct Assessment (DA) scores, which are quality assessment scores over each output on a scale of 0-100, are easier and faster to collect Kocmi et al. (2021). More recently, the Multidimensional Quality Metric (MQM) approach for collecting human judgments was adopted for Machine Translation by Freitag et al. (2021b). They obtained annotations from professional raters with MQM training, which Clark et al. (2021) recommend. On a related note, Klubicka et al. (2018) conduct human studies for Croatian, whereas Fabbri et al. (2021) followed systematic approaches to collect and provide multidimensional scores for other tasks such as summarization.
3 Indic-MT Eval Dataset
Following Freitag et al. (2021b), we collect MQM annotations for 5 Indian languages, i.e., Tamil (ta), Gujarati (gu), Hindi (hi), Marathi (mr), and Malayalam (ml). We sample 200 sentences from the FLORES-101 dataset (Goyal et al., 2022) and obtain the translation outputs from 7 machine translation systems (§3.1) for each of the 5 Indian languages.
3.1 MT Systems Considered
We use state-of-the-art models to obtain translation outputs in the 5 languages. These include English-XX translation outputs obtained from open-sourced pre-trained models like mBART (Liu et al., 2020), mT5 (Xue et al., 2021), IndicTrans (Ramesh et al., 2022), cvit (Philip et al., 2019), NLLB (Costa-jussà et al., 2022), as well as outputs obtained222Collected in February 2022 from Microsoft Azure Cognitive Services API333Bing API and Google translation API444Google API (additional details in Appendix B.1). Note that for Gujarati, we find all mBART outputs to be unintelligible and filled with a mixture of characters from several languages. We hence re-allocate the budget corresponding to these sentences for Gujarati to collect annotations on the references instead. Similar to the findings of Clark et al. (2021), we observe that the references are not always perfect, and these sentences also have errors. However, we find that these errors are often of lower severity.
3.2 Methodology
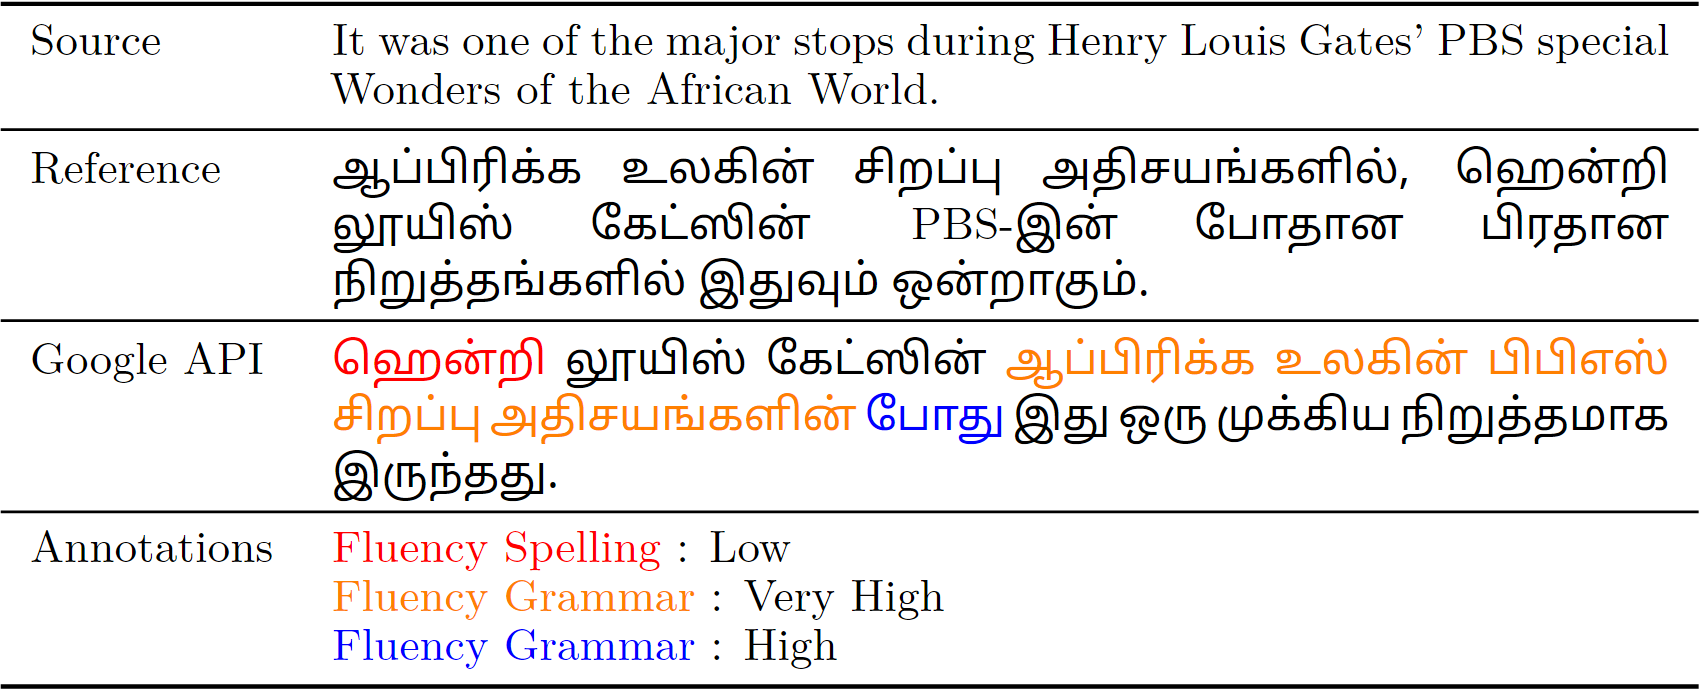
We adopt the MQM-framework Lommel et al. (2014) for collecting human annotations on the data at the segment level. In general, a segment may contain one or more sentences. Bilingual language experts, proficient in English and a native language, were employed as annotators for the task of identifying and marking errors in each segment. As shown in Figure 2, the source segment in English and the translated segment are presented to the annotators, along with provisions to mark up to 5 errors of various categories and severity (§3.4). If there are more than five errors, the annotators are asked to identify only the five most severe ones. In cases where there are more than five severe errors, or if it is not possible to reliably identify distinct errors because the translation is unrelated to the source, then the translation is marked as non-translation, a special category error spanning the entire segment. Depending on the quality of the translation and the errors identified, the annotators were also asked to provide a score out of 25 for each translation after marking all the errors (if any) for that translation. More detailed guidelines are presented in Appendix A.
3.3 Quality Assurance
We first performed pilot studies on collecting data via crowd-sourced annotators who are native speakers of the languages we use in this study. In a pilot which directly asked for the final scores, similar to DA scores used in WMT in a few years Bojar et al. (2016c, b), we found the scores to be highly subjective, similar to Clark et al. (2021). We also found that displaying the reference translations, which are not always perfect, was biasing the annotators to ignore some errors. Another pilot task involved MQM instead of DA scores in the same crowd-sourced setting. However, we found it difficult to achieve consistency in annotations with crowd-sourced raters. We tried the following strategies to improve the quality (i) We provided the same set of segments to 3 annotators per language and then organized a discussion among them to resolve disagreements. The idea was to eventually converge to a consistent marking scheme after a few initial sets of different markings, Nema and Khapra (2018). (ii) We collected annotations from 3 annotators per language and provided all the 3 annotations to a different fourth annotator to aggregate them. However, neither yielded fruitful results in terms of agreement with MQM annotations.
Finally, we employed language experts who have experience in translation tasks and observe that we were able to achieve better consistency among annotators. We use the first 50 sentences (sampled randomly from various models and of various lengths) as a pilot to help the annotator get an idea of the variety and kind of translations in the dataset. Note that MQM-style annotations use a formula to automatically compute scores for each segment based on the errors identified. The score, , for each segment with a set of identified errors, , is given by , where is the penalty associated with the severity of the error and is the penalty associated with the type of error. Appendix A provides more details on the penalties used for the different error types and severities, following Lommel et al. (2014).
In addition to the formula-based score, we also ask the annotator to provide an overall score after marking the errors for that segment. We then verify the correlations between the formula-based scores and the scores provided by the annotator and found them to be highly correlated (i.e., Kendall-tau correlation) for all languages. In order to compute the Inter Annotator agreement score, we sample 200 segments for each language and compute the Kendall-tau correlation between the scores given by two annotators. For all the languages, we observe high correlation scores of 0.61, 0.57, 0.55, 0.538, and 0.52 for Malayalam, Gujarati, Tamil, Hindi, and Marathi respectively.
3.4 Analysis
Distribution of Error types:
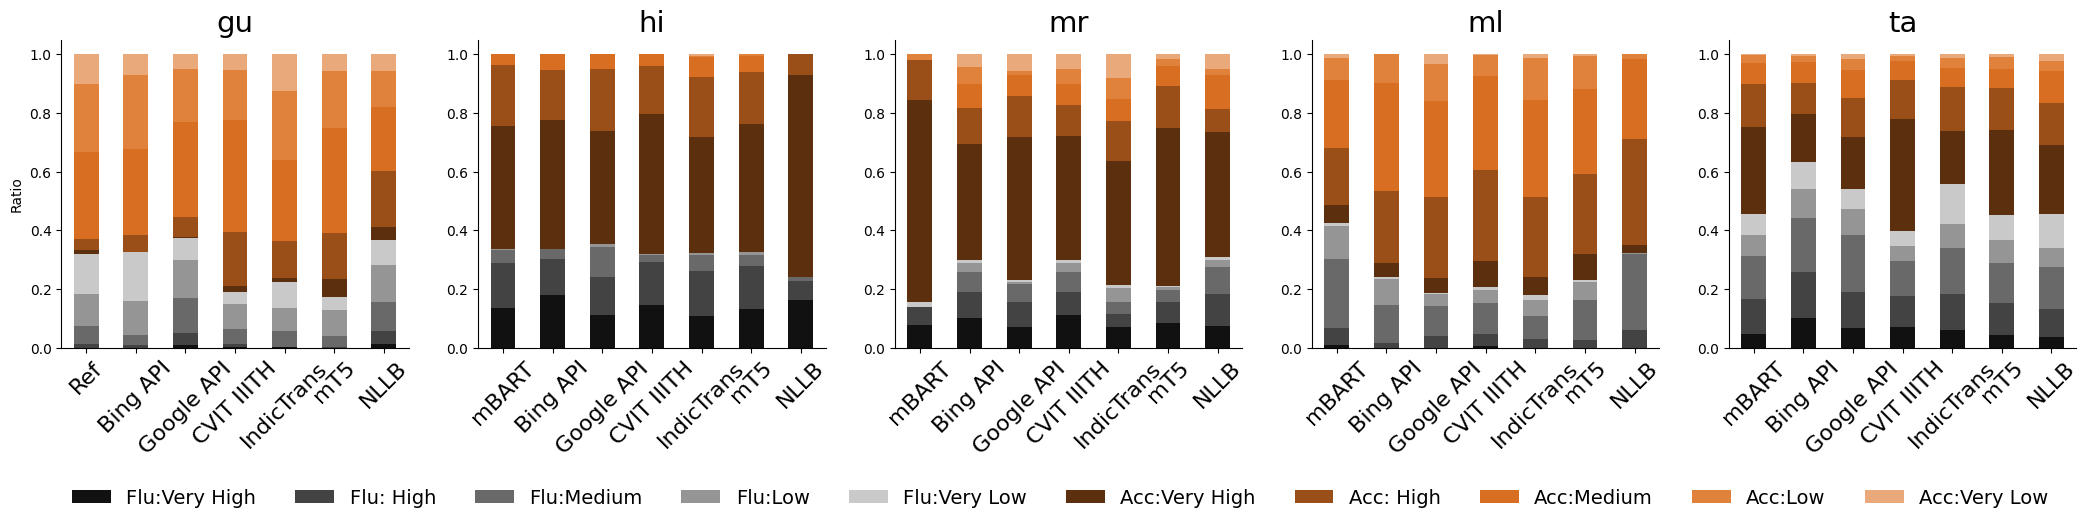
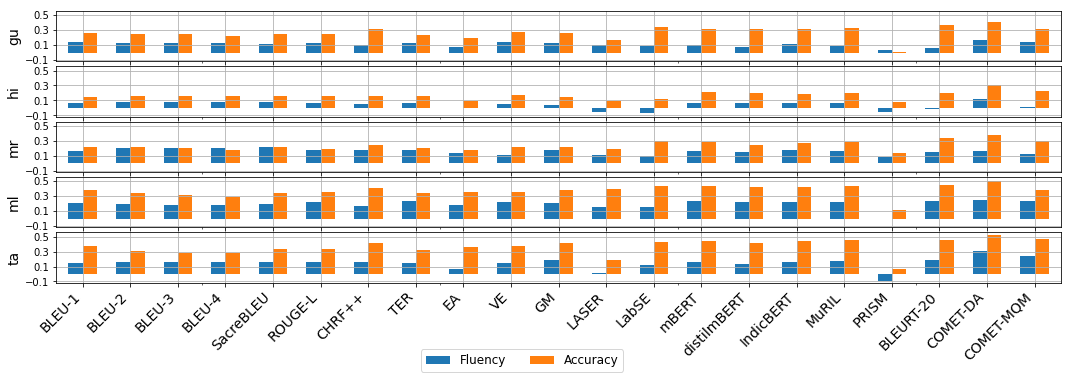
Following the MQM guidelines and prior work on MQM Freitag et al. (2021b), we have 13 categories of errors, including 4 sub-categories under fluency and 5 under accuracy, style error, source error, non-translation (a special case to mark segments that are extremely poor translations or have more than 5 high severity errors) and an ‘other’ category for any error types that are not accounted for in the list of error types. The error types are listed in Appendix A. On all languages except Tamil, we found ‘Accuracy Mistranslation’ to have the highest error count among all error types. More generally, on average, the machine translation models today primarily err on accuracy-based errors and make fewer fluency-based mistakes as seen in Figure 1.
Severity of Errors:
We plot all the fluency and accuracy errors graded by error severities for all languages in Figure 1. As depicted, there are 5 error severity types: Very High, High, Medium, Low, and Very Low. For all the Indo-Aryan languages (gu, hi and mr), the majority of the errors observed are accuracy-based errors. For Tamil, a Dravidian language, we find the accuracy errors and fluency errors in almost equal proportions. We find Malayalam, another Dravidian language, to have more accuracy errors than fluency errors, with majority medium-severity errors, as shown in Figure 1.
MT systems:
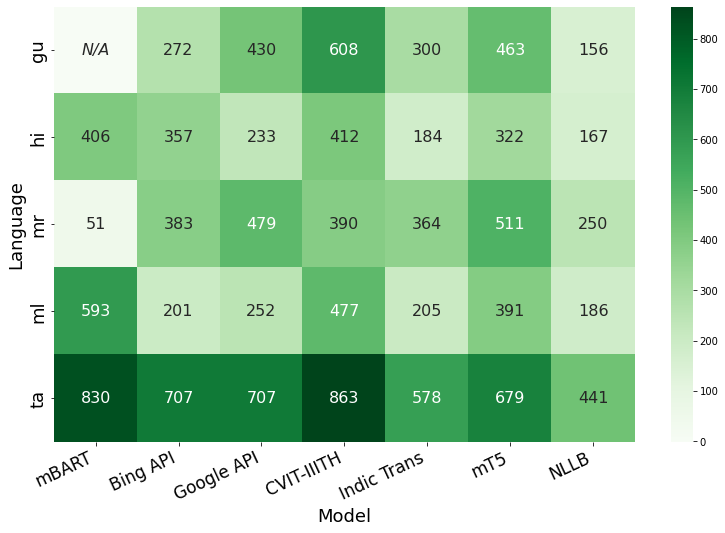
Figure 3 shows the total number of errors per model (inclusive of all severities) for each language. We find that the recent MT models (NLLB, IndicTrans) have fewer errors compared to the relatively older models (CVIT). Table 9 in Appendix provides a more detailed picture which also inherently takes into account the severities of the errors. It shows the average score of each system computed as the mean of the human scores obtained on all the outputs from that system. We find that IndicTrans model, which focuses on Indian languages, has the highest scores on Hindi, Malayalam and Tamil. NLLB is the best performing model on Marathi and Bing API for Gujarati. Considering the average performance across all languages, the best performing models in descending order are IndicTrans, NLLB, Google API, Bing API, mT5, CVIT, and mBART.
4 Experimental Setup
In this section, we discuss the various evaluation metrics under consideration (§4.1) and evaluating strategies (§4.2) followed.
| gu | hi | mr | ml | ta | Average | |||||||
| Metric | ||||||||||||
| BLEU 1 | 0.364 | 0.255 | 0.266 | 0.187 | 0.228 | 0.148 | 0.393 | 0.331 | 0.316 | 0.213 | 0.314 | 0.227 |
| BLEU 2 | 0.329 | 0.247 | 0.280 | 0.192 | 0.190 | 0.135 | 0.331 | 0.302 | 0.291 | 0.205 | 0.284 | 0.216 |
| BLEU 3 | 0.294 | 0.234 | 0.265 | 0.186 | 0.134 | 0.119 | 0.250 | 0.271 | 0.227 | 0.182 | 0.234 | 0.198 |
| BLEU 4 | 0.235 | 0.215 | 0.245 | 0.171 | 0.091 | 0.103 | 0.180 | 0.246 | 0.171 | 0.168 | 0.184 | 0.181 |
| SacreBLEU | 0.293 | 0.239 | 0.255 | 0.168 | 0.164 | 0.132 | 0.274 | 0.298 | 0.244 | 0.189 | 0.246 | 0.205 |
| ROUGE-L | 0.350 | 0.251 | 0.295 | 0.204 | 0.206 | 0.132 | 0.376 | 0.322 | 0.308 | 0.206 | 0.307 | 0.223 |
| chrF++ | 0.408 | 0.287 | 0.299 | 0.205 | 0.260 | 0.170 | 0.411 | 0.338 | 0.361 | 0.250 | 0.348 | 0.250 |
| TER | 0.304 | 0.237 | 0.263 | 0.196 | 0.203 | 0.135 | 0.343 | 0.307 | 0.272 | 0.199 | 0.277 | 0.215 |
| EA | 0.331 | 0.181 | 0.086 | 0.066 | 0.143 | 0.054 | 0.397 | 0.301 | 0.203 | 0.149 | 0.232 | 0.150 |
| VE | 0.380 | 0.265 | 0.274 | 0.183 | 0.234 | 0.153 | 0.412 | 0.331 | 0.337 | 0.227 | 0.327 | 0.232 |
| GM | 0.394 | 0.266 | 0.234 | 0.162 | 0.241 | 0.147 | 0.426 | 0.338 | 0.382 | 0.264 | 0.335 | 0.235 |
| LASER embs | 0.094 | 0.156 | 0.135 | 0.123 | 0.159 | 0.069 | 0.357 | 0.295 | 0.126 | 0.099 | 0.174 | 0.148 |
| LabSE embs | 0.504 | 0.319 | 0.149 | 0.185 | 0.319 | 0.204 | 0.416 | 0.337 | 0.339 | 0.286 | 0.345 | 0.266 |
| mBERT | 0.448 | 0.297 | 0.337 | 0.231 | 0.301 | 0.194 | 0.462 | 0.367 | 0.413 | 0.281 | 0.392 | 0.274 |
| distilmBERT | 0.431 | 0.289 | 0.316 | 0.220 | 0.281 | 0.181 | 0.465 | 0.371 | 0.415 | 0.278 | 0.382 | 0.268 |
| IndicBERT | 0.456 | 0.308 | 0.346 | 0.235 | 0.281 | 0.182 | 0.440 | 0.357 | 0.402 | 0.282 | 0.385 | 0.273 |
| MuRIL | 0.465 | 0.322 | 0.353 | 0.243 | 0.292 | 0.184 | 0.449 | 0.369 | 0.410 | 0.290 | 0.394 | 0.282 |
| PRISM | 0.114 | 0.024 | 0.178 | 0.124 | 0.131 | 0.084 | 0.089 | 0.064 | -0.040 | -0.040 | 0.094 | 0.051 |
| BLEURT-20 | 0.509 | 0.371 | 0.296 | 0.300 | 0.409 | 0.286 | 0.496 | 0.390 | 0.491 | 0.374 | 0.440 | 0.344 |
| COMET-QE-DA | 0.417 | 0.324 | 0.535 | 0.404 | 0.551 | 0.430 | 0.386 | 0.341 | 0.531 | 0.391 | 0.414 | 0.378 |
| COMET-QE-MQM | 0.387 | 0.309 | 0.590 | 0.403 | 0.577 | 0.392 | 0.438 | 0.392 | 0.571 | 0.399 | 0.513 | 0.379 |
| COMET-DA | 0.557 | 0.403 | 0.581 | 0.390 | 0.426 | 0.306 | 0.531 | 0.419 | 0.529 | 0.412 | 0.525 | 0.386 |
| COMET-MQM | 0.465 | 0.360 | 0.529 | 0.370 | 0.686 | 0.459 | 0.508 | 0.392 | 0.597 | 0.432 | 0.557 | 0.402 |
4.1 Evaluation Metrics Used for MT
We consider the most popular metrics being used in Barrault et al. (2021, 2020) along with other variants to suit the languages under consideration. In total, we study 16 metrics belonging to different classes (Sai et al., 2022) of either word overlap-based, embedding-based, or trained metrics.
- •
-
•
For the embedding-based metrics, we use (i) Vector Extrema (VE) Forgues and Pineau (2014), (ii) Greedy Matching (GM) Rus and Lintean (2012), (iii) Embedding Averaging (EA) Landauer and Dumais (1997), (iv) LabSE Feng et al. (2020) & (v) LASER Artetxe and Schwenk (2019) embeddings and (vi) BERTScore Zhang et al. (2020).
- •
- •
4.2 Meta Evaluation
For evaluating the evaluation metrics we measure how well the metrics correlate with human judgments on two granularities i.e.: segment-level and system-level. We use Pearson correlation () which measures the linear correlation between two sets of data and Kendall’s Tau () to measure the ordinal association between two quantities.
5 Results and Discussions
In this section, we present the segment-level correlations in §5.1 and system-level correlations in §5.2, followed by analyzing metrics in §5.3, §5.4.
5.1 Segment-level Evaluation
| gu | hi | mr | ml | ta | ||||||
| Metric | ||||||||||
| BLEU 1 | 0.927∗ | 0.600 | 0.684 | 0.429 | 0.949∗ | 0.143 | 0.913∗ | 0.619 | 0.698 | 0.429 |
| BLEU 2 | 0.922∗ | 0.600 | 0.697 | 0.524 | 0.922∗ | 0.143 | 0.885∗ | 0.619 | 0.714 | 0.619 |
| BLEU 3 | 0.930∗ | 0.600 | 0.687 | 0.524 | 0.891∗ | 0.143 | 0.829∗ | 0.619 | 0.674 | 0.619 |
| BLEU 4 | 0.914∗ | 0.600 | 0.651 | 0.429 | 0.793∗ | 0.143 | 0.772∗ | 0.619 | 0.598 | 0.524 |
| SacreBLEU | 0.926∗ | 0.600 | 0.648 | 0.429 | 0.912∗ | 0.143 | 0.849∗ | 0.619 | 0.656 | 0.619 |
| ROUGE-L | 0.928∗ | 0.600 | 0.741 | 0.524 | 0.949∗ | 0.143 | 0.909∗ | 0.619 | 0.697 | 0.524 |
| chrF++ | 0.923∗ | 0.600 | 0.67 | 0.429 | 0.9∗ | 0.429 | 0.895∗ | 0.524 | 0.756∗ | 0.619 |
| TER | -0.931∗ | -0.600 | -0.757∗ | -0.524 | -0.977∗ | -0.143 | -0.911∗ | -0.619 | -0.696 | -0.619 |
| EA | 0.927∗ | 0.600 | 0.547 | 0.411 | 0.968∗ | 0.238 | 0.919∗ | 0.586 | 0.739 | 0.429 |
| VE | 0.952∗ | 0.733 | 0.654 | 0.524 | 0.967∗ | 0.143 | 0.958∗ | 0.619 | 0.766∗ | 0.524 |
| GM | 0.942∗ | 0.733 | 0.636 | 0.524 | 0.977∗ | 0.143 | 0.949∗ | 0.619 | 0.777∗ | 0.524 |
| LASER | 0.273 | 0.067 | 0.372 | 0.143 | 0.797∗ | 0.048 | 0.873∗ | 0.429 | 0.67 | 0.333 |
| LabSE | 0.931∗ | 0.600 | 0.253 | 0.048 | 0.968∗ | 0.238 | 0.823∗ | 0.333 | 0.725 | 0.429 |
| mBERT | 0.947∗ | 0.600 | 0.705 | 0.524 | 0.978∗ | 0.143 | 0.940∗ | 0.683 | 0.798∗ | 0.524 |
| distilmBERT | 0.945∗ | 0.600 | 0.629 | 0.429 | 0.976∗ | 0.143 | 0.946∗ | 0.683∗ | 0.825∗ | 0.524 |
| IndicBERT | 0.949∗ | 0.733 | 0.747 | 0.524 | 0.971∗ | 0.143 | 0.938∗ | 0.619 | 0.758∗ | 0.524 |
| MuRIL | 0.957∗ | 0.733 | 0.742 | 0.524 | 0.976∗ | 0.143 | 0.926∗ | 0.619 | 0.777∗ | 0.524 |
| PRISM | 0.810 | 0.467 | 0.583 | 0.238 | 0.979∗ | 0.238 | 0.877∗ | 0.619 | 0.611 | 0.238 |
| BLEURT-20 | 0.978∗ | 1.000∗ | 0.582 | 0.714∗ | 0.993∗ | 0.619 | 0.952∗ | 0.39 | 0.927∗ | 0.905∗ |
| COMET-QE-DA | 0.852∗ | 0.866∗ | 0.878∗ | 0.714∗ | 0.854∗ | 0.714∗ | 0.986∗ | 0.809∗ | 0.911∗ | 0.714∗ |
| COMET-QE-MQM | 0.657 | 0.733 | 0.831∗ | 0.809∗ | 0.971∗ | 0.619 | 0.798∗ | 0.428 | 0.892∗ | 0.714∗ |
| COMET-DA | 0.986∗ | 1.000∗ | 0.970∗ | 1.000∗ | 0.994∗ | 0.781∗ | 0.936∗ | 0.333 | 0.868∗ | 0.619∗ |
| COMET-MQM | 0.932∗ | 0.733 | 0.759∗ | 0.809∗ | 0.991∗ | 0.904∗ | 0.953∗ | 0.523 | 0.892 | 0.714 |
The correlation between MQM-based scores and metric scores, measured using Pearson and Kendall-tau correlations on 1400 segments per language as shown in Table 1. We observe that out of the overlap-based metrics, chrF++ has the highest correlation across all languages, but overall overlap-based metrics are the worst performing which is in line with the findings of Kocmi et al. (2022). Among the embedding-based metrics, LabSE embeddings yields better correlations than any of the other embedding-based approaches. The correlations improve further when we use BERTscore with embeddings obtained from different multilingual models. The results in this case are mixed, with MuRIL showing the best correlations on average. Overall, we observe that neural-network-based, end-to-end trained metrics with exposure to Indian languages are the best-performing metrics on average. The trained metric PRISM, which has been trained on 39 languages, out of which the only Indian language is Bengali, performs very poorly on all the 5 Indian languages in our study, partially owing to the minimal Bengali data used for training. On the other hand, BLEURT-20, a metric finetuned on ratings from the WMT Metrics Shared Task and synthetic data from the WMT corpus, has fairly good correlations on all languages except Hindi. COMET-metric variants have the highest overall correlations for all the languages.
5.2 System-level Evaluation
Table 2 shows the Pearson and Kendall-tau correlations at the system-level following Louis and Nenkova (2013). Since Kendall-tau is based on pairwise score comparisons, it reflects a common ranking use case and is more reliable for system-level correlations. The metric rankings remain consistent across both granularities, with more variability observed in the segment-level task. Similar to the segment-level correlations, trained metrics show the highest correlations across all languages. COMET shows the highest correlations, followed by BLEURT-20. Although on the segment level COMET-QE was not at par with the COMET reference-based metrics, for system ranking the reference-free COMET-QE metrics show high correlations and are well suited for ranking system pairs. Although Kocmi et al. (2021) already observed this for other languages, with the help of our dataset and experiments we are able to provide empirical evidence to confirm this for Indian languages.
5.3 Spread of Metric Scores
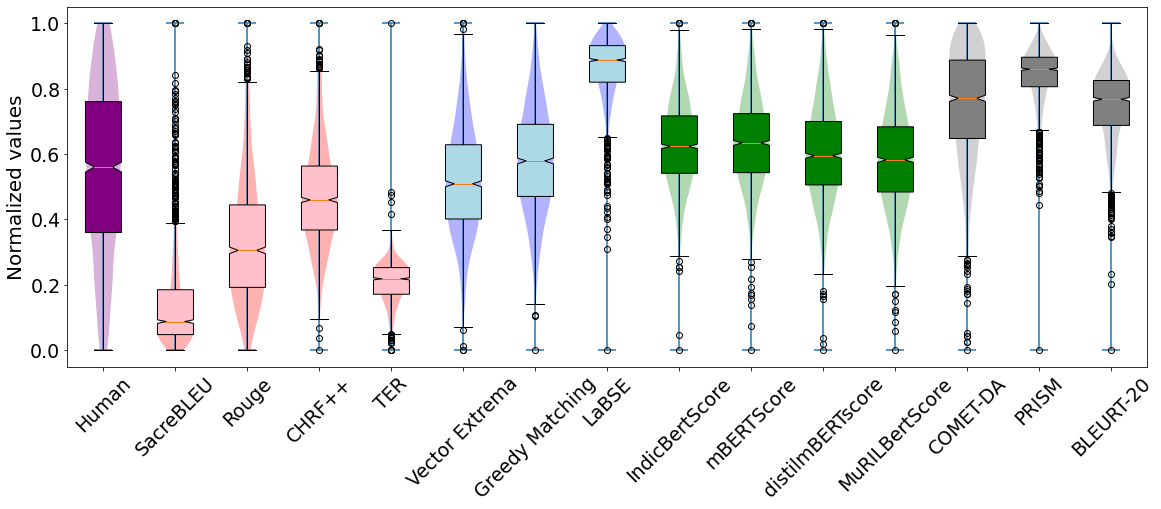
While the correlations of metrics are good, we still find that the range of metric scores is skewed. That is, most of the metrics do not utilise their entire scoring range, and often provide scores in a narrow range. This skew in the spread hinders the interpretability of the scores provided by the metric. For example, SacreBLEU has a scoring range between 0 to 100. However, the scores are almost always in the lower half of the scoring range as seen in Figure 4 containing the spread of normalised scores of each metric555Some of the metrics, such as the trained metrics and edit-distance-based metrics, are not bounded to a scoring range. We normalize such metrics using their maximum and minimum values in the current dataset.. This is not a case of an issue with the data being always poor as we can see in Figure 4 that the human scores for Tamil show a spread through-out the scale. On the other hand, the embedding-based metrics, which use cosine similarity, have a theoretical maximum of 1 and minimum of 0; however, the scores are concentrated at the higher end of the scale, rendering the individual scores uninterpretable despite decent correlations.
5.4 Correlations Conditioned on Error Type
Mathur et al. (2020b); Sai et al. (2021) show that correlations do not convey the true picture and it is important to perform in-depth analysis to understand the true ability of the metrics. Hence we perform the following experiment to examine the performance of metrics on the two primary error categories in the MQM framework, i.e, fluency and accuracy. We select those annotated segments that contain only a single error type in order to clearly separate the two error types. This gives us two MQM data subsets, one containing only fluency errors and the other only accuracy errors. Since the dataset size could be different, we control for the size by sampling an equal number of segments from both sets. Figure 5 contains the correlation values for the various metrics. Splitting the dataset based on the error types shows a more nuanced picture. The majority of the metrics show a higher correlation with human scores when only accuracy errors are annotated. This implies that the metrics are able to capture the accuracy errors well but fail on fluency-based errors. We hope that future works on designing better evaluation metrics for Indian languages focus more on developing metrics that can capture fluency-based errors.
| Metrics | gu | hi | mr | ml | ta | Avg. | ||||||
| COMET-DA | 0.487 | 0.359 | 0.380 | 0.319 | 0.422 | 0.302 | 0.529 | 0.421 | 0.525 | 0.410 | 0.469 | 0.362 |
| COMET-MQM | 0.422 | 0.346 | 0.528 | 0.370 | 0.455 | 0.314 | 0.493 | 0.380 | 0.588 | 0.429 | 0.497 | 0.367 |
| IndicCOMETXLM | 0.437 | 0.353 | 0.609 | 0.397 | 0.413 | 0.311 | 0.559 | 0.418 | 0.585 | 0.426 | 0.521 | 0.381 |
| IndicCOMETDA | 0.431 | 0.339 | 0.554 | 0.384 | 0.436 | 0.310 | 0.526 | 0.410 | 0.587 | 0.433 | 0.507 | 0.375 |
| IndicCOMETMQM | 0.446 | 0.360 | 0.616 | 0.419 | 0.463 | 0.331 | 0.566 | 0.416 | 0.597 | 0.441 | 0.537 | 0.393 |
6 Indic COMET
Having analyzed various metrics, we fine-tune the best performing metric – COMET – using our MQM dataset (§6.1) and show that the new fine-tuned metric not only outperforms the COMET metric on the majority of the languages but also is more robust to perturbations (§6.2). Additionally, we also test the zero-shot evaluation ability of the Indic-COMET metric in §6.3.
6.1 Training
We build our metric with the architecture of COMET Rei et al. (2020). We use the Estimator model, which uses XLM-RoBERTa Conneau et al. (2019) backbone to encode the source, hypothesis, and reference. We use the same training process and hyper-parameters as COMET for a fair comparison (additional details in Appendix B.2). Following Rei et al. (2021), we experiment with initializing the model with different checkpoints, namely, XLM-R, COMET-DA, and COMET-MQM, and fine-tune it on our MQM dataset.
6.2 Evaluation
Table 3 compares the correlation values of our fine-tuned Indic-COMET with the best-performing COMET baselines. Since no other evaluation datasets for Indian languages are available, we use our own MQM dataset for both training and testing. Hence to perform a throughout evaluation we perform a 3-fold cross-evaluation by splitting the dataset into 3 independent training and testing datasets and report the mean correlation values across the 5 languages in consideration. We observe that Indic-COMET fine-tuned from the COMET-MQM checkpoint shows higher correlations across all languages, compared to the other variants on average. Indic-COMET-MQM outperforms both the COMET baselines on 3 out of the 5 languages and shows higher correlations than COMET-MQM across all languages. The most notable gains are in Hindi. Inspired by recent works on meta-evaluation Kocmi et al. (2022); Sai et al. (2021), we also analyze the robustness of metrics on challenge sets. We make use of the challenge set created by Amrhein et al. (2022) since it contains Indian languages. We use the subset of the dataset that only contains Indian languages and follow Amrhein et al. (2022) to report performance with Kendall’s tau-like correlations. Indic-COMET-MQM has a correlation score of 0.306 and is more robust than the COMET counterpart which has a score of 0.272. Overall, we observe that fine-tuning the COMET metric on our MQM dataset not only improves correlations with human scores but also increases the robustness to perturbations.
| Metrics | gu | hi | mr | ml | ta |
| COMETDA | 0.359 | 0.319 | 0.302 | 0.421 | 0.410 |
| COMETMQM | 0.346 | 0.370 | 0.314 | 0.380 | 0.429 |
| IndicCOMETMQM | 0.355 | 0.395 | 0.322 | 0.394 | 0.430 |
6.3 Zero-shot Evaluation
Since we evaluate only 5 Indian languages, out of the 22 official languages (and over a hundred major languages that are spoken in the country666https://www.britannica.com/topic/Indian-languages), we investigate whether the metric has the potential to perform better in other Indian languages as well. In order to test this ability, we finetune on only 4 languages and test on the unseen one. We use the same evaluation setup as discussed in §6.2. Table 4 contains the comparison between the best performing Indic-COMET variant i.e.: Indic-COMETMQM and COMET baselines. We observe that Indic-COMET still outperforms both the COMET baselines on the majority of languages even though it is not trained on the specific Indian languages. It also shows higher correlations than COMET-MQM across all languages. This suggests that collecting annotations for some Indian languages is key for progress in Indic evaluation as it can benefit other low-resource languages too.
7 Conclusion
We present a large-scale MQM dataset consisting of 7000 fine-grained annotations, spanning 5 Indian languages and 7 MT systems, for evaluating machine translation metrics for Indian languages. With the help of this dataset, we show that the current pre-trained metrics outperform the overlap-based metrics (§5.1) in terms of correlations with the human scores. Additionally, we also perform an in-depth study (§5.4) to identify the drawbacks of the current metrics. We then use our dataset to train an Indic specific COMET metric that outperforms existing metrics in terms of both correlations and robustness scores (§6.2). We hope that our dataset and analysis will help promote further research in Indic MT evaluation.
8 Acknowledgements
We thank the Ministry of Electronics and Information Technology (MeitY), Government of India, for setting up the ambitious Digital India Bhashini Mission with the goal of advancing Indian language technology. The annotators and language experts who worked on this project were supported by the generous grant given by Digital India Bhashini Mission to IIT Madras to serve as the Data Management Unit for the mission. We are indebted to Shri Nandan Nilekani and Shrimati Rohini Nilekani for supporting our work through generous grants from EkStep Foundation and Nilekani Philanthropies. These grants were used for (i) supporting many of the students, research associates and developers who worked on this project, (ii) fulfilling many of our compute needs and (iii) recruiting project managers to oversee the massive pan-India data collection activity undertaken as a part of this work. We thank the Centre for Development and Advancement of Computing, Pune (CDAC Pune) for access to its Param Siddhi super-computer which was used for mining bitext pairs at scale. We thank the Google India Ph.D. Fellowship Program and the Prime Minister’s Fellowship Scheme for Doctoral Research for supporting Ananya Sai.
9 Limitations
The approach to collect our dataset is expensive and laborious. This along with the dependence on expert annotators makes the transfer of such an approach challenging for other low-resource languages. We however, find this a necessary endeavor to develop initial resources that can help provide a starting point to extend access to more languages and iteratively improve research, technologies and services across languages.
10 Ethical Considerations
For the human annotations on the dataset, the language experts were paid a competitive monthly salary to help with the task. The salary was determined based on the skill set and experience of the expert and adhered to the norms of the government of our country. The dataset has no harmful content. The annotations are collected on a publicly available dataset and will be released publicly for future use. All the datasets created as part of this work will be released under a CC-0 license777https://creativecommons.org/publicdomain/zero/1.0 and all the code and models will be release under an MIT license888https://opensource.org/licenses/MIT.
References
- Amrhein et al. (2022) Chantal Amrhein, Nikita Moghe, and Liane Guillou. 2022. Aces: Translation accuracy challenge sets for evaluating machine translation metrics. arXiv preprint arXiv:2210.15615.
- Artetxe and Schwenk (2019) Mikel Artetxe and Holger Schwenk. 2019. Massively multilingual sentence embeddings for zero-shot cross-lingual transfer and beyond. Transactions of the Association for Computational Linguistics, 7:597–610.
- Barrault et al. (2020) Loïc Barrault, Magdalena Biesialska, Ondřej Bojar, Marta R. Costa-jussà, Christian Federmann, Yvette Graham, Roman Grundkiewicz, Barry Haddow, Matthias Huck, Eric Joanis, Tom Kocmi, Philipp Koehn, Chi-kiu Lo, Nikola Ljubešić, Christof Monz, Makoto Morishita, Masaaki Nagata, Toshiaki Nakazawa, Santanu Pal, Matt Post, and Marcos Zampieri. 2020. Findings of the 2020 conference on machine translation (WMT20). In Proceedings of the Fifth Conference on Machine Translation, pages 1–55, Online. Association for Computational Linguistics.
- Barrault et al. (2021) Loic Barrault, Ondrej Bojar, Fethi Bougares, Rajen Chatterjee, Marta R. Costa-jussa, Christian Federmann, Mark Fishel, Alexander Fraser, Markus Freitag, Yvette Graham, Roman Grundkiewicz, Paco Guzman, Barry Haddow, Matthias Huck, Antonio Jimeno Yepes, Philipp Koehn, Tom Kocmi, Andre Martins, Makoto Morishita, and Christof Monz, editors. 2021. Proceedings of the Sixth Conference on Machine Translation. Association for Computational Linguistics, Online.
- Bojar et al. (2017) Ondřej Bojar, Rajen Chatterjee, Christian Federmann, Yvette Graham, Barry Haddow, Shujian Huang, Matthias Huck, Philipp Koehn, Qun Liu, Varvara Logacheva, Christof Monz, Matteo Negri, Matt Post, Raphael Rubino, Lucia Specia, and Marco Turchi. 2017. Findings of the 2017 conference on machine translation (WMT17). In Proceedings of the Second Conference on Machine Translation, pages 169–214, Copenhagen, Denmark. Association for Computational Linguistics.
- Bojar et al. (2016a) Ondřej Bojar, Rajen Chatterjee, Christian Federmann, Yvette Graham, Barry Haddow, Matthias Huck, Antonio Jimeno Yepes, Philipp Koehn, Varvara Logacheva, Christof Monz, Matteo Negri, Aurélie Névéol, Mariana Neves, Martin Popel, Matt Post, Raphael Rubino, Carolina Scarton, Lucia Specia, Marco Turchi, Karin Verspoor, and Marcos Zampieri. 2016a. Findings of the 2016 conference on machine translation. In Proceedings of the First Conference on Machine Translation: Volume 2, Shared Task Papers, pages 131–198, Berlin, Germany. Association for Computational Linguistics.
- Bojar et al. (2015) Ondřej Bojar, Rajen Chatterjee, Christian Federmann, Barry Haddow, Matthias Huck, Chris Hokamp, Philipp Koehn, Varvara Logacheva, Christof Monz, Matteo Negri, Matt Post, Carolina Scarton, Lucia Specia, and Marco Turchi. 2015. Findings of the 2015 workshop on statistical machine translation. In Proceedings of the Tenth Workshop on Statistical Machine Translation, pages 1–46, Lisbon, Portugal. Association for Computational Linguistics.
- Bojar et al. (2016b) Ondrej Bojar, Christian Federmann, Barry Haddow, Philipp Koehn, Matt Post, and Lucia Specia. 2016b. Ten years of wmt evaluation campaigns: Lessons learnt. Translation Evaluation: From Fragmented Tools and Data Sets to an Integrated Ecosystem, page 27.
- Bojar et al. (2016c) Ondrej Bojar, Yvette Graham, Amir Kamran, and Milos Stanojevic. 2016c. Results of the WMT16 metrics shared task. In Proceedings of the First Conference on Machine Translation, WMT 2016, colocated with ACL 2016, August 11-12, Berlin, Germany, pages 199–231. The Association for Computer Linguistics.
- Cahyawijaya et al. (2021) Samuel Cahyawijaya, Genta Indra Winata, Bryan Wilie, Karissa Vincentio, Xiaohong Li, Adhiguna Kuncoro, Sebastian Ruder, Zhi Yuan Lim, Syafri Bahar, Masayu Khodra, Ayu Purwarianti, and Pascale Fung. 2021. IndoNLG: Benchmark and resources for evaluating Indonesian natural language generation. In Proceedings of the 2021 Conference on Empirical Methods in Natural Language Processing, pages 8875–8898, Online and Punta Cana, Dominican Republic. Association for Computational Linguistics.
- Callison-Burch et al. (2006) Chris Callison-Burch, Miles Osborne, and Philipp Koehn. 2006. Re-evaluating the role of Bleu in machine translation research. In 11th Conference of the European Chapter of the Association for Computational Linguistics, Trento, Italy. Association for Computational Linguistics.
- Clark et al. (2021) Elizabeth Clark, Tal August, Sofia Serrano, Nikita Haduong, Suchin Gururangan, and Noah A. Smith. 2021. All that’s ‘human’ is not gold: Evaluating human evaluation of generated text. In Proceedings of the 59th Annual Meeting of the Association for Computational Linguistics and the 11th International Joint Conference on Natural Language Processing (Volume 1: Long Papers), pages 7282–7296, Online. Association for Computational Linguistics.
- Conneau et al. (2019) Alexis Conneau, Kartikay Khandelwal, Naman Goyal, Vishrav Chaudhary, Guillaume Wenzek, Francisco Guzmán, Edouard Grave, Myle Ott, Luke Zettlemoyer, and Veselin Stoyanov. 2019. Unsupervised cross-lingual representation learning at scale. arXiv preprint arXiv:1911.02116.
- Costa-jussà et al. (2022) Marta R Costa-jussà, James Cross, Onur Çelebi, Maha Elbayad, Kenneth Heafield, Kevin Heffernan, Elahe Kalbassi, Janice Lam, Daniel Licht, Jean Maillard, et al. 2022. No language left behind: Scaling human-centered machine translation. arXiv preprint arXiv:2207.04672.
- Dabre et al. (2022) Raj Dabre, Himani Shrotriya, Anoop Kunchukuttan, Ratish Puduppully, Mitesh Khapra, and Pratyush Kumar. 2022. IndicBART: A pre-trained model for indic natural language generation. In Findings of the Association for Computational Linguistics: ACL 2022, pages 1849–1863, Dublin, Ireland. Association for Computational Linguistics.
- Fabbri et al. (2021) Alexander R. Fabbri, Wojciech Kryściński, Bryan McCann, Caiming Xiong, Richard Socher, and Dragomir Radev. 2021. SummEval: Re-evaluating summarization evaluation. Transactions of the Association for Computational Linguistics, 9:391–409.
- Feng et al. (2020) Fangxiaoyu Feng, Yinfei Yang, Daniel Cer, Naveen Arivazhagan, and Wei Wang. 2020. Language-agnostic bert sentence embedding. arXiv preprint arXiv:2007.01852.
- Forgues and Pineau (2014) Gabriel Forgues and Joelle Pineau. 2014. Bootstrapping dialog systems with word embeddings. In NeurIPS, modern machine learning and natural language processing workshop.
- Freitag et al. (2021a) Markus Freitag, George Foster, David Grangier, Viresh Ratnakar, Qijun Tan, and Wolfgang Macherey. 2021a. Experts, errors, and context: A large-scale study of human evaluation for machine translation. Transactions of the Association for Computational Linguistics, 9:1460–1474.
- Freitag et al. (2021b) Markus Freitag, George Foster, David Grangier, Viresh Ratnakar, Qijun Tan, and Wolfgang Macherey. 2021b. Experts, errors, and context: A large-scale study of human evaluation for machine translation. Transactions of the Association for Computational Linguistics, 9:1460–1474.
- Goyal et al. (2022) Naman Goyal, Cynthia Gao, Vishrav Chaudhary, Peng-Jen Chen, Guillaume Wenzek, Da Ju, Sanjana Krishnan, Marc’Aurelio Ranzato, Francisco Guzmán, and Angela Fan. 2022. The Flores-101 evaluation benchmark for low-resource and multilingual machine translation. Transactions of the Association for Computational Linguistics, 10:522–538.
- Kakwani et al. (2020) Divyanshu Kakwani, Anoop Kunchukuttan, Satish Golla, Gokul N.C., Avik Bhattacharyya, Mitesh M. Khapra, and Pratyush Kumar. 2020. IndicNLPSuite: Monolingual Corpora, Evaluation Benchmarks and Pre-trained Multilingual Language Models for Indian Languages. In Findings of EMNLP.
- Karpinska et al. (2022) Marzena Karpinska, Nishant Raj, Katherine Thai, Yixiao Song, Ankita Gupta, and Mohit Iyyer. 2022. DEMETR: diagnosing evaluation metrics for translation. CoRR, abs/2210.13746.
- Khanuja et al. (2021) Simran Khanuja, Diksha Bansal, Sarvesh Mehtani, Savya Khosla, Atreyee Dey, Balaji Gopalan, Dilip Kumar Margam, Pooja Aggarwal, Rajiv Teja Nagipogu, Shachi Dave, et al. 2021. Muril: Multilingual representations for indian languages. arXiv preprint arXiv:2103.10730.
- Klubicka et al. (2018) Filip Klubicka, Antonio Toral, and Víctor M. Sánchez-Cartagena. 2018. Quantitative fine-grained human evaluation of machine translation systems: a case study on english to croatian. Mach. Transl., 32(3):195–215.
- Kocmi et al. (2022) Tom Kocmi, Rachel Bawden, OndÅ™ej Bojar, Anton Dvorkovich, Christian Federmann, Mark Fishel, Thamme Gowda, Yvette Graham, Roman Grundkiewicz, Barry Haddow, Rebecca Knowles, Philipp Koehn, Christof Monz, Makoto Morishita, Masaaki Nagata, Toshiaki Nakazawa, Michal Novák, Martin Popel, Maja Popović, and Mariya Shmatova. 2022. Findings of the 2022 conference on machine translation (wmt22). In Proceedings of the Seventh Conference on Machine Translation, pages 1–45, Abu Dhabi. Association for Computational Linguistics.
- Kocmi et al. (2021) Tom Kocmi, Christian Federmann, Roman Grundkiewicz, Marcin Junczys-Dowmunt, Hitokazu Matsushita, and Arul Menezes. 2021. To ship or not to ship: An extensive evaluation of automatic metrics for machine translation. In Proceedings of the Sixth Conference on Machine Translation, pages 478–494, Online. Association for Computational Linguistics.
- Kunchukuttan and Bhattacharyya (2020) Anoop Kunchukuttan and Pushpak Bhattacharyya. 2020. Utilizing language relatedness to improve machine translation: A case study on languages of the indian subcontinent. arXiv preprint arXiv:2003.08925.
- Lacoste et al. (2019) Alexandre Lacoste, Alexandra Luccioni, Victor Schmidt, and Thomas Dandres. 2019. Quantifying the carbon emissions of machine learning. arXiv preprint arXiv:1910.09700.
- Landauer and Dumais (1997) Thomas K Landauer and Susan T Dumais. 1997. A solution to plato’s problem: The latent semantic analysis theory of acquisition, induction, and representation of knowledge. Psychological review, 104(2):211.
- Lewis et al. (2020) Mike Lewis, Yinhan Liu, Naman Goyal, Marjan Ghazvininejad, Abdelrahman Mohamed, Omer Levy, Veselin Stoyanov, and Luke Zettlemoyer. 2020. BART: Denoising sequence-to-sequence pre-training for natural language generation, translation, and comprehension. In Proceedings of the 58th Annual Meeting of the Association for Computational Linguistics, pages 7871–7880, Online. Association for Computational Linguistics.
- Lin (2004) Chin-Yew Lin. 2004. ROUGE: A package for automatic evaluation of summaries. In Text Summarization Branches Out, pages 74–81, Barcelona, Spain. Association for Computational Linguistics.
- Liu et al. (2020) Yinhan Liu, Jiatao Gu, Naman Goyal, Xian Li, Sergey Edunov, Marjan Ghazvininejad, Mike Lewis, and Luke Zettlemoyer. 2020. Multilingual denoising pre-training for neural machine translation. Transactions of the Association for Computational Linguistics, 8:726–742.
- Lommel et al. (2014) Arle Lommel, Hans Uszkoreit, and Aljoscha Burchardt. 2014. Multidimensional quality metrics (mqm): A framework for declaring and describing translation quality metrics. Revista Tradumàtica: tecnologies de la traducció, (12):455–463.
- Louis and Nenkova (2013) Annie Louis and Ani Nenkova. 2013. Automatically Assessing Machine Summary Content Without a Gold Standard. Computational Linguistics, 39(2):267–300.
- Mathur et al. (2020a) Nitika Mathur, Timothy Baldwin, and Trevor Cohn. 2020a. Tangled up in BLEU: Reevaluating the evaluation of automatic machine translation evaluation metrics. In Proceedings of the 58th Annual Meeting of the Association for Computational Linguistics, pages 4984–4997, Online. Association for Computational Linguistics.
- Mathur et al. (2020b) Nitika Mathur, Timothy Baldwin, and Trevor Cohn. 2020b. Tangled up in BLEU: reevaluating the evaluation of automatic machine translation evaluation metrics. In Proceedings of the 58th Annual Meeting of the Association for Computational Linguistics, ACL 2020, Online, July 5-10, 2020, pages 4984–4997. Association for Computational Linguistics.
- Murthy et al. (2019) Rudra Murthy, Anoop Kunchukuttan, and Pushpak Bhattacharyya. 2019. Addressing word-order divergence in multilingual neural machine translation for extremely low resource languages. In Proceedings of the 2019 Conference of the North American Chapter of the Association for Computational Linguistics: Human Language Technologies, Volume 1 (Long and Short Papers), pages 3868–3873, Minneapolis, Minnesota. Association for Computational Linguistics.
- Nema and Khapra (2018) Preksha Nema and Mitesh M. Khapra. 2018. Towards a better metric for evaluating question generation systems. In Proceedings of the 2018 Conference on Empirical Methods in Natural Language Processing, Brussels, Belgium, October 31 - November 4, 2018, pages 3950–3959. Association for Computational Linguistics.
- Papineni et al. (2002) Kishore Papineni, Salim Roukos, Todd Ward, and Wei-Jing Zhu. 2002. BLEU: a method for automatic evaluation of machine translation. In Proceedings of the 40th Annual Meeting of the Association for Computational Linguistics, pages 311–318, Philadelphia, Pennsylvania, USA. Association for Computational Linguistics.
- Philip et al. (2019) Jerin Philip, Shashank Siripragada, Upendra Kumar, Vinay Namboodiri, and C V Jawahar. 2019. CVIT’s submissions to WAT-2019. In Proceedings of the 6th Workshop on Asian Translation, pages 131–136, Hong Kong, China. Association for Computational Linguistics.
- Popovic (2017) Maja Popovic. 2017. chrf++: words helping character n-grams. In Proceedings of the Second Conference on Machine Translation, WMT 2017, Copenhagen, Denmark, September 7-8, 2017, pages 612–618. Association for Computational Linguistics.
- Post (2018) Matt Post. 2018. A call for clarity in reporting BLEU scores. In Proceedings of the Third Conference on Machine Translation: Research Papers, pages 186–191, Belgium, Brussels. Association for Computational Linguistics.
- Ramesh et al. (2022) Gowtham Ramesh, Sumanth Doddapaneni, Aravinth Bheemaraj, Mayank Jobanputra, Raghavan AK, Ajitesh Sharma, Sujit Sahoo, Harshita Diddee, Mahalakshmi J, Divyanshu Kakwani, Navneet Kumar, Aswin Pradeep, Srihari Nagaraj, Kumar Deepak, Vivek Raghavan, Anoop Kunchukuttan, Pratyush Kumar, and Mitesh Shantadevi Khapra. 2022. Samanantar: The Largest Publicly Available Parallel Corpora Collection for 11 Indic Languages. Transactions of the Association for Computational Linguistics, 10:145–162.
- Rei et al. (2021) Ricardo Rei, Ana C Farinha, Chrysoula Zerva, Daan van Stigt, Craig Stewart, Pedro Ramos, Taisiya Glushkova, André F. T. Martins, and Alon Lavie. 2021. Are references really needed? unbabel-IST 2021 submission for the metrics shared task. In Proceedings of the Sixth Conference on Machine Translation, pages 1030–1040, Online. Association for Computational Linguistics.
- Rei et al. (2020) Ricardo Rei, Craig Stewart, Ana C Farinha, and Alon Lavie. 2020. COMET: A neural framework for MT evaluation. In Proceedings of the 2020 Conference on Empirical Methods in Natural Language Processing (EMNLP), pages 2685–2702, Online. Association for Computational Linguistics.
- Reid et al. (2021) Machel Reid, Junjie Hu, Graham Neubig, and Yutaka Matsuo. 2021. AfroMT: Pretraining strategies and reproducible benchmarks for translation of 8 African languages. In Proceedings of the 2021 Conference on Empirical Methods in Natural Language Processing, pages 1306–1320, Online and Punta Cana, Dominican Republic. Association for Computational Linguistics.
- Rivera-Trigueros and Olvera-Lobo (2021) Irene Rivera-Trigueros and María-Dolores Olvera-Lobo. 2021. Building a corpus for corporate websites machine translation evaluation. a step by step methodological approach. In Proceedings of the Translation and Interpreting Technology Online Conference, pages 93–101, Held Online. INCOMA Ltd.
- Rus and Lintean (2012) Vasile Rus and Mihai C. Lintean. 2012. A comparison of greedy and optimal assessment of natural language student input using word-to-word similarity metrics. In BEA@NAACL-HLT.
- Sai et al. (2021) Ananya B. Sai, Tanay Dixit, Dev Yashpal Sheth, Sreyas Mohan, and Mitesh M. Khapra. 2021. Perturbation CheckLists for evaluating NLG evaluation metrics. In Proceedings of the 2021 Conference on Empirical Methods in Natural Language Processing, pages 7219–7234, Online and Punta Cana, Dominican Republic. Association for Computational Linguistics.
- Sai et al. (2022) Ananya B Sai, Akash Kumar Mohankumar, and Mitesh M Khapra. 2022. A survey of evaluation metrics used for nlg systems. ACM Computing Surveys (CSUR), 55(2):1–39.
- Scao et al. (2022) Teven Le Scao, Angela Fan, Christopher Akiki, Ellie Pavlick, Suzana Ilić, Daniel Hesslow, Roman Castagné, Alexandra Sasha Luccioni, François Yvon, Matthias Gallé, et al. 2022. Bloom: A 176b-parameter open-access multilingual language model. arXiv preprint arXiv:2211.05100.
- Sellam et al. (2020) Thibault Sellam, Dipanjan Das, and Ankur P. Parikh. 2020. BLEURT: learning robust metrics for text generation. In Proceedings of the 58th Annual Meeting of the Association for Computational Linguistics, ACL 2020, Online, July 5-10, 2020, pages 7881–7892. Association for Computational Linguistics.
- Snover et al. (2006) Matthew Snover, Bonnie Dorr, Richard Schwartz, Linnea Micciulla, and John Makhoul. 2006. A study of translation edit rate with targeted human annotation. In In Proceedings of Association for Machine Translation in the Americas, pages 223–231.
- Tan et al. (2015) Liling Tan, Jon Dehdari, and Josef van Genabith. 2015. An awkward disparity between BLEU / RIBES scores and human judgements in machine translation. In Proceedings of the 2nd Workshop on Asian Translation (WAT2015), pages 74–81, Kyoto, Japan. Workshop on Asian Translation.
- Thompson and Post (2020) Brian Thompson and Matt Post. 2020. Automatic machine translation evaluation in many languages via zero-shot paraphrasing. In Proceedings of the 2020 Conference on Empirical Methods in Natural Language Processing (EMNLP), Online. Association for Computational Linguistics.
- van der Wees et al. (2018) Marlies van der Wees, Arianna Bisazza, and Christof Monz. 2018. Evaluation of machine translation performance across multiple genres and languages. In Proceedings of the Eleventh International Conference on Language Resources and Evaluation, LREC 2018, Miyazaki, Japan, May 7-12, 2018. European Language Resources Association (ELRA).
- Wolf et al. (2020) Thomas Wolf, Lysandre Debut, Victor Sanh, Julien Chaumond, Clement Delangue, Anthony Moi, Pierric Cistac, Tim Rault, Remi Louf, Morgan Funtowicz, Joe Davison, Sam Shleifer, Patrick von Platen, Clara Ma, Yacine Jernite, Julien Plu, Canwen Xu, Teven Le Scao, Sylvain Gugger, Mariama Drame, Quentin Lhoest, and Alexander Rush. 2020. Transformers: State-of-the-art natural language processing. In Proceedings of the 2020 Conference on Empirical Methods in Natural Language Processing: System Demonstrations, pages 38–45, Online. Association for Computational Linguistics.
- Xue et al. (2021) Linting Xue, Noah Constant, Adam Roberts, Mihir Kale, Rami Al-Rfou, Aditya Siddhant, Aditya Barua, and Colin Raffel. 2021. mT5: A massively multilingual pre-trained text-to-text transformer. In Proceedings of the 2021 Conference of the North American Chapter of the Association for Computational Linguistics: Human Language Technologies, pages 483–498, Online. Association for Computational Linguistics.
- Zhang et al. (2020) Tianyi Zhang, Varsha Kishore, Felix Wu, Kilian Q. Weinberger, and Yoav Artzi. 2020. Bertscore: Evaluating text generation with BERT. In 8th International Conference on Learning Representations, ICLR 2020, Addis Ababa, Ethiopia, April 26-30, 2020. OpenReview.net.
Appendix A MQM Guidelines to Annotators, Error types & Severities
| Error Category | Explanation | |
| Accuracy | Addition | Translation includes information not present in the source. |
| Omission | Translation is missing content from the source. | |
| Mistranslation | Translation does not accurately represent the source. | |
| Untranslated text | Source text has been left untranslated | |
| Fluency | Spelling | Incorrect spelling or capitalization. |
| Grammar | Problems with grammar, other than orthography. | |
| Register | Wrong grammatical register (eg, inappropriately informal pronouns). | |
| Character Encoding | Characters are garbled due to incorrect encoding. Example: Sink ->$ink | |
| Terminology Inappropriate | Terminology is non-standard or does not fit context. | |
| Style Awkward | The style of the text does not feel very apt. (Example: 1. The source sentence feels formal like in a newspaper, but the translation doesn’t. 2. Sentences are correct, but simply too long, etc..) | |
| Transliteration | If it transliterates instead of translating words/ phrases, where it should not. | |
| Other | Any other issues. | |
| Source Error | An error in the source. | |
| Non Translation | Impossible to reliably characterize the 5 most severe errors. | |
| Error Severity | Description |
| Very High | Errors that may confuse or mislead the reader due to significant changes in meaning or because they appear in a visible or important part of the content. |
| Very Low | Errors that don’t lead to loss of meaning and wouldn’t confuse or mislead the reader but would be noticed, would decrease stylistic quality, fluency, or clarity, or would make the content less appealing. |
The annotators assess translations at the segment level, where a segment may contain one or more sentences. Each translated segment is aligned with a corresponding source segment, and both the source and translated segments are displayed. Table 5 shows the error hierarchies for all the error types. Each category has severity levels ranging from very high to very low on a 5-point scale of (Very low, Low, Medium, High, and Very-high). Table 6 shows the descriptions of the end-points of the scale, as shown to the annotators. For computing scores for each segment based on the annotations, we use the following weights/penalties: very low: 1, low: 2, medium: 3, high: 4, very high: 5. Each of the sub-categories under Accuracy, Fluency, Terminology Inappropriate, Style have equal weightage since each of these are accompanied with a corresponding severity marking. Non-translation errors, by definition, elicit a score of 0. Sentences that are marked with a source error are discarded.
The following guidelines were provided to the annotators:
-
•
Identify all errors within each translated segment, up to a maximum of five. If there are more than five errors, identify only the five most severe.
-
•
To identify an error, highlight the relevant span of text using text colors, and select a category/sub-category and severity level from the available options. (The span of text may be in the source segment if the error is a source error or an omission.)
-
•
When identifying errors, be as fine-grained as possible. For example, if a sentence contains two words that are each mistranslated, two separate mistranslation errors should be recorded.
-
•
If a single stretch of text contains multiple errors, (that is, if there are overlapping errors) one only needs to indicate the one that is most severe. If all have the same severity, choose the first matching category listed in the error typology (eg, Accuracy, then Fluency, then Terminology, etc).
-
•
There are two special error categories: Source error and Non-translation. Source errors should be annotated separately, highlighting the relevant span in the source segment. A sentence that has a source error need not be scored but the error in the source segment is to be highlighted.
-
•
If it is not possible to reliably identify distinct errors because the translation is too badly garbled or is unrelated to the source, then mark a single Non-translation error that spans the entire segment. There can be at most one Non-translation error per segment, which should span the entire segment. No other errors should be identified if Non-Translation is selected.
-
•
Depending on the quality of the translation and the errors identified, provide a score out of 25 for each translation. Indicate the score in the final score column, after marking all the errors (if any) for that translation.
Appendix B Additional details
B.1 MT systems Considered
For the mBART we use the Huggingface Transformers Wolf et al. (2020) for generating the outputs for the various languages. Specifically, we use the facebook/mbart-large-50-many
-to-many-mmt model. For mT5 we finetune the pre-trained mTBASE model for the translation task using all existing sources of parallel data provided by Ramesh et al. (2022). We finetune one model for every language pair. For IndicTrans and CVIT, we use the models released by Ramesh et al. (2022) and Philip et al. (2019) respectively.
B.2 Indic COMET Training
All experiments were conducted using a private infrastructure, which has a carbon efficiency of 0.432 kgCO2eq/kWh. A cumulative of 10 hours of computation was performed on a single RTX A4000 GPU. Total emissions are estimated to be 0.6 kgCO2eq of which 0 percent were directly offset. Estimations were conducted using the MachineLearning Impact calculator presented in Lacoste et al. (2019).
| Hyperparameters | Value |
| batch size | 16 |
| dropout | 0.1 |
| encoder learning rate | 1.0e-05 |
| encoder model | XLM-RoBERTa |
| hidden sizes | 3072, 1536 |
| layer | mix |
| layerwise decay | 0.95 |
| learning rate | 3.0e-05 |
| no. of frozen epochs | 1 |
| optimizer | AdamW |
| pool | avg |
| Metric | Min | Max |
| Human | 0 | 25 |
| COMET | -1.6 | 1.3 |
| IndicBERT | 0.46 | 1.0 |
| Vector Extrema | 0.3 | 1.0 |
| GM | 0.4 | 1.0 |
| mBERT | 0.56 | 1.0 |
| MurIL | 0.29 | 1.0 |
| TER | 0.0 | 361.1 |
| chrF++ | 1.7 | 100.0 |
| sacreBLEU | 0.0 | 100.0 |
| ROUGE | 0.0 | 100.0 |
| BLEU1 | 0.0 | 100.0 |
| Average computed human scores for each system | |||||||
| lang | IndicTrans | Bing API | CVIT-IIITH | Google API | mBART | mT5 | NLLB |
| gu | 22.639 | 23.179 | 19.034 | 21.686 | 0.000 | 20.067 | 22.490 |
| hi | 20.120 | 14.405 | 14.962 | 19.484 | 15.703 | 18.012 | 18.445 |
| mr | 18.484 | 17.934 | 17.586 | 15.750 | 5.773 | 14.441 | 18.618 |
| ml | 22.676 | 22.617 | 17.844 | 21.955 | 17.355 | 20.169 | 21.515 |
| ta | 17.978 | 16.516 | 11.933 | 16.651 | 13.522 | 15.994 | 17.578 |
| avg | 20.379 | 18.930 | 16.272 | 19.105 | 10.471 | 17.737 | 19.729 |
For training, we follow the same process as Rei et al. (2020). We load the pretrained encoder and initialize it with either XLM-Roberta, COMET-DA or COME-MQM weights. During training, we divide the model parameters into two groups: the encoder parameters, that include the encoder model and the regressor parameters, that include the parameters from the top feed-forward network. We apply gradual unfreezing and discriminative learning rates, meaning that the encoder model is frozen for one epoch while the feed-forward is optimized with a learning rate. After the first epoch, the entire model is fine-tuned with a different learning rate. Since we are fine-tuning on a small dataset, we make use of early stopping with a patience of 3. The best saved checkpoint is decided using the overall Kendall-tau correlation on the test set. The training hyper-parameters used are given in Table 7. Since we have a total of 7000 annotated segments, we perform a 3 fold cross validation split (500 training and 2000 testing) and ensure that the English sentences in the test set are not present during training. We report the mean correlation values for each language. The variance was observed to be less than 0.02. A similar experiment setup was followed for the zero shot evaluation of Indic-COMET, where additionally training segments belonging to a particular language was dropped from the training dataset.
Appendix C Additional Results
Table 8 shows the maximum and minimum values of each metric on our dataset, across all languages. Note that while some of the metrics are bounded by a theoretical minimum and maximum, some others (especially the trained metrics) are not strictly restricted to a specific scoring range. It would be possible to see a lower minimum value or a higher maximum value on other datasets with such metrics.
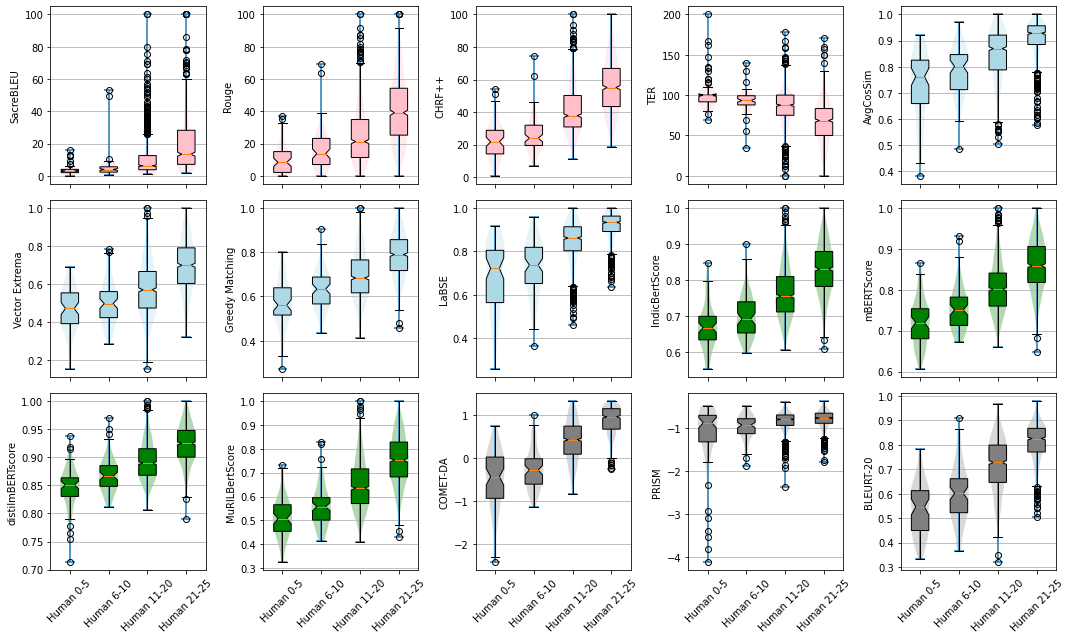
Figure 6 shows metric scores for different human score intervals (0-5, 6-10, 11-20, 21-25). This helps analyse whether the metric scores are roughly in the same buckets or same range as human-scores without focusing on the fine-grained ratings that might not always be of significance. From the plots, we observe that high-performing metrics such as BERTScores and COMET-DA correlate positively with the metric scores as the human scores increase. However, poor-performing metrics on Indic languages such as PRISM (due to lack of training data for Indic languages) do not have correlated metric v/s human spreads even at a coarse-level.
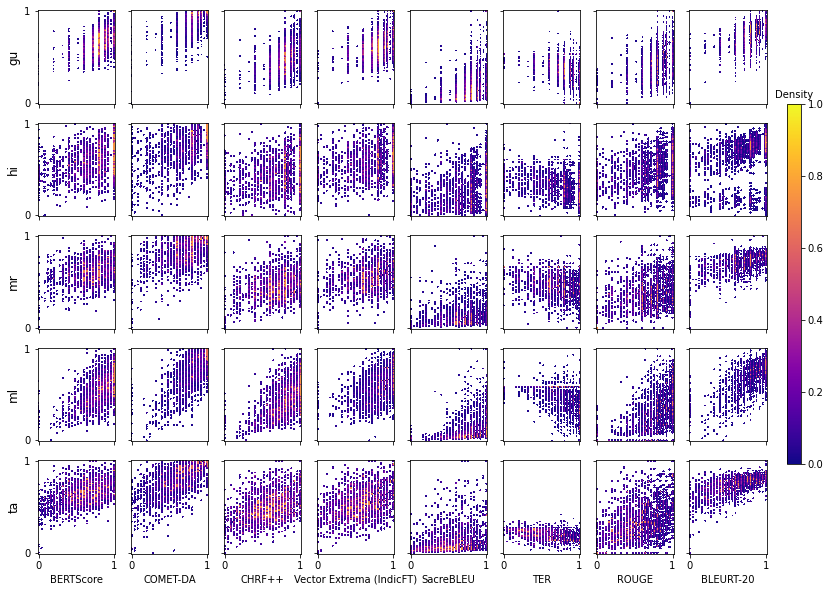
Figure 7 depicts a scatter plot of metric scores on the y-axis against human scores on the x-axis. The scatter plots provide more insights than just the correlation values Mathur et al. (2020b). We note that the metrics falter by producing some false high and false-low scores.
However, the metrics produce a higher density of decently correlated scores to produce a net positive correlation trend in most cases.
Table 9 shows the average scores per system considering the scores provided by the annotator on all the outputs from that system. We find that the best performing model changes across the 5 languages. For Hindi, Malayalam and Tamil, IndicTrans outputs are found to get higher scores on average. For Malayalam Bing API is a close-second and NLLB for Tamil. For Gujarati Bing-API is the best performing, with IndicTrans and NLLB performances being very close. In case of Marathi, NLLB outputs are better, followed by IndicTrans. Averaging further across all 5 languages, IndicTrans is found to be the highest scoring model.
Table 10 contains the correlation values for the various metrics on the Fluency-only and Accuracy-only error subsets discussed in section 5.4. We observe that all the metrics on average correlate better with the human scores when only accuracy errors are annotated compared to having only fluency errors.
| gu | hi | mr | ml | ta | ||||||
| Metric | Flu | Acc | Flu | Acc | Flu | Acc | Flu | Acc | Flu | Acc |
| BLEU-1 | 0.138 | 0.268 | 0.067 | 0.151 | 0.162 | 0.215 | 0.212 | 0.388 | 0.145 | 0.371 |
| BLEU-2 | 0.123 | 0.249 | 0.074 | 0.155 | 0.199 | 0.211 | 0.192 | 0.348 | 0.161 | 0.312 |
| BLEU-3 | 0.126 | 0.242 | 0.077 | 0.159 | 0.202 | 0.203 | 0.18 | 0.313 | 0.162 | 0.275 |
| BLEU-4 | 0.13 | 0.227 | 0.078 | 0.156 | 0.208 | 0.18 | 0.186 | 0.29 | 0.158 | 0.28 |
| SacreBLEU | 0.112 | 0.246 | 0.076 | 0.156 | 0.224 | 0.212 | 0.194 | 0.338 | 0.154 | 0.331 |
| ROUGE-L | 0.126 | 0.247 | 0.061 | 0.154 | 0.182 | 0.196 | 0.22 | 0.352 | 0.164 | 0.334 |
| chrF++ | 0.1 | 0.309 | 0.047 | 0.164 | 0.171 | 0.25 | 0.169 | 0.413 | 0.161 | 0.413 |
| TER | 0.127 | 0.232 | 0.072 | 0.154 | 0.18 | 0.209 | 0.237 | 0.341 | 0.15 | 0.317 |
| EA | 0.076 | 0.19 | -0.004 | 0.091 | 0.135 | 0.171 | 0.184 | 0.363 | 0.069 | 0.362 |
| VE | 0.143 | 0.27 | 0.052 | 0.172 | 0.115 | 0.214 | 0.217 | 0.356 | 0.146 | 0.376 |
| GM | 0.13 | 0.265 | 0.038 | 0.142 | 0.18 | 0.219 | 0.214 | 0.383 | 0.187 | 0.42 |
| LASER | 0.102 | 0.171 | -0.056 | 0.099 | 0.111 | 0.186 | 0.161 | 0.393 | 0.011 | 0.189 |
| LabSE | 0.086 | 0.342 | -0.064 | 0.116 | 0.093 | 0.292 | 0.155 | 0.44 | 0.127 | 0.427 |
| mBERT | 0.099 | 0.313 | 0.068 | 0.209 | 0.168 | 0.278 | 0.23 | 0.434 | 0.159 | 0.435 |
| distilmBERT | 0.075 | 0.309 | 0.063 | 0.196 | 0.145 | 0.249 | 0.226 | 0.42 | 0.14 | 0.409 |
| IndicBERT | 0.111 | 0.31 | 0.063 | 0.184 | 0.18 | 0.276 | 0.217 | 0.425 | 0.158 | 0.437 |
| MuRIL | 0.093 | 0.331 | 0.063 | 0.203 | 0.165 | 0.283 | 0.229 | 0.436 | 0.18 | 0.461 |
| PRISM | 0.04 | 0.006 | -0.051 | 0.078 | 0.078 | 0.133 | 0.001 | 0.115 | -0.087 | 0.068 |
| BLEURT-20 | 0.066 | 0.367 | -0.016 | 0.194 | 0.155 | 0.341 | 0.232 | 0.451 | 0.193 | 0.457 |
| COMET-DA | 0.174 | 0.412 | 0.121 | 0.313 | 0.167 | 0.38 | 0.254 | 0.503 | 0.308 | 0.525 |
| COMET-MQM | 0.140 | 0.317 | 0.017 | 0.221 | 0.130 | 0.298 | 0.242 | 0.379 | 0.240 | 0.466 |