Toward Human-Like Evaluation for Natural Language Generation with Error Analysis
Abstract
The state-of-the-art language model-based automatic metrics, e.g. BARTScore, benefiting from large-scale contextualized pre-training, have been successfully used in a wide range of natural language generation (NLG) tasks, including machine translation, text summarization, and data-to-text. Recent studies show that considering both major errors (e.g. mistranslated tokens) and minor errors (e.g. imperfections in fluency) can produce high-quality human judgments. This inspires us to approach the final goal of the evaluation metrics (human-like evaluations) by automatic error analysis. To this end, we augment BARTScore by incorporating the human-like error analysis strategies, namely BARTScore++, where the final score consists of both the evaluations of major errors and minor errors. Experimental results show that BARTScore++ can consistently improve the performance of vanilla BARTScore and outperform existing top-scoring metrics in 20 out of 25 test settings. We hope our technique can also be extended to other pre-trained model-based metrics. We will release our code and scripts to facilitate the community.
1 Introduction
Implementations of large pre-trained language models (PLMs) have been proven effective in evaluating natural language generation (NLG) tasks (Mathur et al., 2020b; Ma et al., 2019). Metrics like BERTScore (Zhang et al., 2020b) and Moverscore (Zhao et al., 2019) leverage contextual embeddings provided by PLMs to evaluate the semantic similarity of sentences. Regression-based metrics like COMET (Rei et al., 2020) and BLEURT (Sellam et al., 2020) introduce a regression layer following PLMs to learn a supervised prediction using human evaluation. Recently, another line of research focuses on generation probabilities of seq2seq PLMs (consisting of both encoder and decoder) to measure the quality of generated texts, such as PRISM (Thompson and Post, 2020) and BARTScore (Yuan et al., 2021).
It is commonly agreed that the ultimate goal of automatic evaluation is to achieve consistency with humans, namely human-like evaluation. However, most recent studies show that the quality of human judgments can be improved through error analysis, incorporated in an error-based framework Multidimensional Quality Metric (MQM) (Freitag et al., 2021a). MQM requires evaluators to identify errors and categorize them into different levels according to their severity. For instance, mistranslation (Weng et al., 2020) and hallucination (Zhou et al., 2021) are mostly considered as Major errors, and imperfections in fluency (Chow et al., 2019) are often marked as Minor errors. Different weights are then assigned to Major/ Minor errors, resulting in high-quality human evaluation scoring.
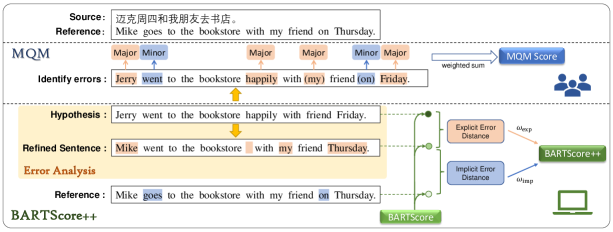
Analogous to Major/ Minor errors in MQM, we incorporate the evaluation of Explicit/ Implicit Errors into BARTScore, a state-of-the-art metric for NLG by Yuan et al. (2021) and propose a metric called BARTScore++. We present an overview of our proposed method in Figure 1. Since explicit errors can be easily identified, we design an error analysis framework to generate a refined sentence where explicit errors are corrected. This helps to measure the distance of explicit/ implicit errors in vanilla BARTScore. BARTScore++ finally integrates these two types of errors by assigning weights to them respectively.
We experiment on machine translation (MT), text summarization (SUM), and data-to-text (D2T) tasks, and show that BARTScore++ consistently improves the performance of vanilla BARTScore, and surpass existing top-scoring metrics in 20 out of 25 test settings, even exceeding human performance on summarization dataset Rank19. We give further analyses to confirm that the consistent improvements come from the human-like (specifically, MQM-like) error judgment.
Our main contributions are as follows:
-
•
To the best of our knowledge, we take the first step toward human-like evaluation by incorporating error analysis mechanisms into existing advanced automatic metrics, e.g. BARTScore.
-
•
We propose BARTScore++ using a novel error analysis framework to refine sentences and consider both the influence of explicit and implicit errors.
-
•
We validate the effectiveness and universality of our BARTScore++ on a broad range of NLG evaluation tasks, achieving the SOTA in 20 out of 25 settings.
2 Preliminaries
2.1 Problem Formulation
For evaluation tasks of NLG mentioned in this paper, the goal is to acquire a score measuring the quality of generated text given a reference signal . Unless otherwise stated, represents the sentence properly created by human experts to assist in evaluation, and , called hypothesis in this paper, refers to the generated text to be evaluated111Note that in text summarization evaluations, BARTScore may use the source sentence as the reference signal..
2.2 BARTScore
BARTScore is a state-of-the-art metric proposed by Yuan et al. (2021) for universal NLG evaluation. The idea of BARTScore is to utilize the generation probabilities of a large pre-trained model BART (Lewis et al., 2020) to measure the quality of sentences. It autoregressively computes the log probabilities of each token in the hypothesis, and then averages them as the overall score. This evaluation process can be formally written as:
Based on this formulation, BARTScore creates specific variants for different evaluation scenarios. We summarize their usage in Appendix A. For simplification, we use the notation of when vanilla BARTScore is further applied in this paper.
| Source: | 迈克周四和我朋友去书店。 | |||||||||||
| Reference: | Mike goes to the bookstore with my friend on Thursday. | |||||||||||
| Iteration | Refined Sentence | BARTScore () | ||||||||||
| 0 | Jerry -15.90 | went -2.82 | to -0.47 | the -0.71 | bookstore -2.27 | happily -13.33 | with -0.55 | friend -4.69 | Friday -4.78 | . -0.24 | -3.81 | |
| 1 | Mike -4.44 | went -2.67 | to -0.49 | the -0.71 | bookstore -2.30 | happily -13.21 | with -0.62 | friend -4.70 | Friday -4.82 | . -0.23 | -2.85 | |
| 2 | Mike -4.44 | went -2.67 | to -0.49 | the -0.71 | bookstore -2.30 | with -0.61 | friend -4.78 | Friday -4.51 | . -0.26 | -1.89 | ||
| 3 | Mike -4.44 | went -2.67 | to -0.49 | the -0.71 | bookstore -2.30 | with -0.61 | my -0.96 | friend -0.10 | Thursday -2.42 | . -0.13 | -1.24 | |
2.3 MQM
MQM is an error-based human evaluation framework, which is commonly agreed to be more reliable than traditional human evaluation techniques (Freitag et al., 2021b). In MQM framework, each evaluator is asked to identify all errors in a sentence and categorize them into Major and Minor levels indicating their severities. Sentences will be marked an Non-translation Error if they are not possible to reliably identify errors. Major/ Minor errors are then assigned with different weights, and the final MQM score is computed through the weighted sum of errors (Freitag et al., 2021a). Inspired by the mechanism of MQM, we take a step toward human-like evaluation by incorporating error analysis into BARTScore.
3 BARTScore++
To better understand how BARTScore++ works, we show an example of our method in Figure 1.
3.1 Explicit/ Implicit Error Distance
Analogous to major errors in MQM, we define Explicit Errors to refer to errors that can be easily identified. In our example, mistranslations of name ("Mike" "Jerry") and date ("Thursday" "Friday"), omission of "my", and addition of "happily" are all considered explicit errors. Analogous to minor errors, we define Implicit Errors to indicate the semantic imperfections (e.g. disfluency, awkwardness) that may not influence the overall meanings. In our example, the replacement of "goes" with "went", and the omission of the preposition "on" are considered implicit errors because they are smaller imperfections in grammar.
To measure the influence of Explicit/ Implicit errors in the hypothesis , we define Refined Sentence as a better hypothesis, where explicit errors are corrected. In this way, the distance of explicit/ implicit error can be computed by222We set when multiple references are provided because this makes uncertain and causes damage to the final score in our experiments.:
We then focus on how to 1) obtain the refined sentence and 2) take both explicit/ implicit errors into consideration and obtain the final score.
3.2 Error Analysis Framework
We introduce an automatic error analysis framework to generate the refined sentence by correcting explicit errors in the hypothesis . We first adopt a simple non-translation test to decide whether will be refined or not. Then, a detect-correct algorithm is performed iteratively, in each round one token is detected and then corrected. An example of this is shown in Table 1. This algorithm repeats for a determined number of iterations , where at the end of each round the refined sentence is updated and becomes a new refining target. In our example, the hypothesis is refined for times, where the mistranslated token "Jerry" is detected in Round 1, and the addition of "happily" is detected and deleted in Round 2. Afterwards, "friend" and "Friday" are detected one at a time, with the former corrected by adding "my" and the latter corrected by replacing with "Thursday".
Test Non-Translation Error
Non-Translation Error is used in MQM (Freitag et al., 2021a) to refer to the translation which is too badly garbled or is unrelated to the source. If the hypotheses contain severe problems such as off-target issues (Zhang et al., 2020a), directly refining them will consume excessive computational cost. To avoid this problem, we run a test beforehand as a rough measure to filter these hypotheses with low quality. We consider two kinds of strategies:
-
1.
Token-level overlap ratio w.r.t the reference. Inspired by overlap-based metrics like BLEU (Papineni et al., 2002) or TER (Snover et al., 2006), the hypothesis with non-translation errors is quite different from its reference, resulting in a low overlap ratio. Since good translations like paraphrased sentences (Freitag et al., 2020) may not have significant overlap with the reference, we adopt the other strategy as a double-check.
-
2.
Percentage of tokens with low generation probability. Token-level log generation probability can be directly obtained from vanilla BARTScore as . If most tokens’ generation probabilities are lower than the average score (vanilla BARTScore), we mark this sentence as non-translation. This strategy is more stable but less efficient.
Detect
In this step, we choose one token with the lowest generation probabilities as the token to be corrected. This procedure can be denoted as:
Correct
In this step, we leverage the distribution of generation to propose several refining options from vocabulary . We apply a top- sampling method (Fan et al., 2018) to obtain a set of candidate tokens () with the highest generation probability:
Then, a set of refined sentences is proposed. Following Snover et al. (2006), we apply three types of editing strategies, including insertion of a candidate token , deletion of token , and substitution of for a candidate token . Finally, we use vanilla BARTScore to select the best sentence as the refining strategy.
After each cycle, the hypothesis will be temporarily replaced by and used as the input of the next iteration.
This detect-correct algorithm repeatedly detects the worst token and corrects it. It starts with the original hypothesis and ends after a constant number of edits. We also set an early-stop mechanism if the BARTScore of the refined sentence is lower than the hypothesis of the last iteration.
In this way, we obtain the refined sentence , which is also a by-product of our method.
3.3 Assigning Error Weights
With the help of the error analysis framework, explicit errors in the hypothesis are refined, resulting in a refined sentence . We simply use a weighted sum method to achieve the final score:
where and weigh the importance of explicit and implicit errors respectively.333Following the same pattern as in Yuan et al. (2021), we reverse the score to ensure BARTScore++ ranging from to 0, with a higher score being a better quality of the sentence.
4 Experiment Setup
4.1 Tasks and Datasets
| Metrics | High-Resource | Low-Resource | ||||||||||
| cs | de | ja | ru | zh | Avg. | iu | km | pl | ps | ta | Avg. | |
| Supervised Baselines | ||||||||||||
| \hdashline[3pt/3pt] BLEURT | 12.97 | 6.61 | 12.82 | 6.55 | 11.62 | 10.12 | 26.78 | 31.09 | 2.76 | 18.05 | 16.88 | 19.11 |
| COMET | 11.02 | 9.04 | 12.47 | 12.07 | 14.50 | 11.82 | 27.19 | 29.84 | 9.90 | 15.71 | 15.81 | 19.69 |
| Unsupervised Baselines | ||||||||||||
| \hdashline[3pt/3pt] BLEU | 3.90 | -2.93 | 7.00 | -3.47 | 6.39 | 2.18 | 15.41 | 22.72 | -5.25 | 10.47 | 7.19 | 10.11 |
| BERTScore | 11.60 | 4.03 | 12.85 | 5.21 | 10.58 | 8.85 | 24.74 | 30.01 | 2.78 | 14.29 | 13.41 | 17.04 |
| PRISM | 12.42 | 2.67 | 13.46 | 7.22 | 11.65 | 9.48 | 25.37 | 30.44 | 5.70 | 16.51 | 14.78 | 18.56 |
| BARTScore | ||||||||||||
| \hdashline[3pt/3pt] Vanilla BARTScore | 11.81 | 5.55 | 13.62 | 9.22 | 13.12 | 10.66 | 26.93 | 32.27 | 7.64 | 15.54 | 16.63 | 19.80 |
| + Prompt | 12.31 | 7.26 | 14.16 | 11.13 | 13.13 | 11.60 | 27.11 | 32.16 | 9.44 | 16.05 | 16.05 | 20.32 |
| Ours - BARTScore++ | ||||||||||||
| \hdashline[3pt/3pt] + Error Analysis | 12.06 | 7.23‡ | 15.08‡ | 9.98‡ | 13.32‡ | 11.54 | 27.37† | 32.38† | 8.44‡ | 15.94 | 17.09‡ | 20.24 |
| + Prompt + Error Analysis | 12.65† | 8.75‡ | 15.40‡ | 11.76‡ | 13.35‡ | 12.38 | 27.60‡ | 32.33† | 10.14‡ | 16.40 | 17.39‡ | 20.77 |
Tasks
We follow Yuan et al. (2021) to consider three different tasks: summarization (SUM), machine translation (MT), and data-to-text (D2T).
Datasets for Translation
We obtain the machine-translated texts and reference texts from the WMT20 metrics shared task (Mathur et al., 2020b). We use the DARR corpus and consider 10 language pairs, which are cs-en, de-en, ja-en, ru-en, zh-en, iu-en, km-en, pl-en, ps-en, ta-en. For human evaluation, we also consider Multidimensional Quality Metric (MQM) for zh-en provided by Freitag et al. (2021a) in §6, comprising human evaluations of 8 best-performing systems of WMT20 (excluding human translations).
Datasets for Summarization
(1) REALSumm (Bhandari et al., 2020) is a meta-evaluation dataset for text summarization which measures pyramid-recall of each system-generated summary. (2) SummEval (Fabbri et al., 2021) is a collection of human judgments of model-generated summaries on the CNNDM dataset annotated by both expert judges and crowd-source workers. Each system-generated summary is gauged through the lens of coherence, factuality, fluency, and informativeness. (3) NeR18 The NEWSROOM dataset (Grusky et al., 2018) contains 60 articles with summaries generated by 7 different methods are annotated with human scores in terms of coherence, fluency, informativeness, relevance.
Datasets for Factuality
(1) Rank19 (Falke et al., 2019) is used to meta-evaluate factuality metrics. It is a collection of 373 triples of a source sentence with two summary sentences, one correct and one incorrect. (2) QAGS20 (Wang et al., 2020) collected 235 test outputs on CNNDM dataset from Gehrmann et al. (2018) and 239 test outputs on XSUM dataset (Narayan et al., 2018) from BART fine-tuned on XSUM. Each summary sentence is annotated with correctness scores w.r.t. factuality.
Datasets for Data-to-Text
We consider the following datasets which target utterance generation for spoken dialogue systems. (1) BAGEL (Mairesse et al., 2010) provides information about restaurants. (2) SFHOT (Wen et al., 2015) provides information about hotels in San Francisco. (3) SFRES (Wen et al., 2015) provides information about restaurants in San Francisco. They contain 202, 398, and 581 samples respectively, each sample consists of one meaning representation, multiple references, and utterances generated by different systems.
4.2 Baselines and Meta-evaluation
Baselines
We compare our method with several commonly used baseline metrics for evaluating text generation, including BLEU (Papineni et al., 2002), BERTScore (Zhang et al., 2020b), MoverScore (Zhao et al., 2019) and PRISM (Thompson and Post, 2020). For MT task, we also consider supervised metrics that leverage human judgments to train, including COMET (Rei et al., 2020) and BLEURT (Sellam et al., 2020). For factuality evaluation on the summarization task, we compare BARTScore++ with the best-performing factuality metrics FactCC (Kryscinski et al., 2020) and QAGS (Wang et al., 2020). We reproduce BARTScore and their variants using the official codes released by Yuan et al. (2021).
Meta-evaluation
For the meta-evaluation of all experiments, we follow the same settings as Yuan et al. (2021). Specifically, We apply Kendall’s for MT task to measure the correlation of metrics with human evaluation.444Since the meta-evaluation method is very sensitive to outliers (systems whose scores are far away from the rest of the systems) (Mathur et al., 2020a), we remove these outlier systems when computing correlations. For SUM and D2T tasks, we use Spearman correlation except for the Rank19 dataset, where Accuracy is used to measure the percentage of correct ranking between factual texts and non-factual texts.
Significance Tests
4.3 Setup
Settings of BARTScore
As for the backbone BART, we use the same settings in BARTScore (Yuan et al., 2021) for specific tasks, including BART-large, BART-CNN (fine-tuned on CNNDM) and BART-CNN-PARA (further fine-tuned on ParaBank2). We also perform the same prompting strategy as in BARTScore (Yuan et al., 2021). We report the detail settings in Appendix A.
Hyper Parameters
We set when applying the top- sampling method to find candidate tokens. For a fair comparison, we set the batch size to 4 for all experiments.
5 Experimental Results
| Metrics | REALSumm | SummEval | NeR18 | |||||||
| COV | COH | FAC | FLU | INFO | COH | FLU | INFO | REL | Avg. | |
| Baselines | ||||||||||
| \hdashline[3pt/3pt] ROUGE | 49.75 | 16.68 | 15.96 | 11.50 | 32.64 | 9.46 | 10.36 | 13.04 | 14.73 | 19.35 |
| BERTScore | 44.04 | 28.38 | 10.97 | 19.26 | 31.20 | 14.75 | 17.03 | 13.09 | 16.34 | 21.67 |
| MoverScore | 37.24 | 15.91 | 15.71 | 12.86 | 31.77 | 16.15 | 11.97 | 18.80 | 19.54 | 19.99 |
| PRISM | 41.10 | 24.88 | 34.52 | 25.36 | 21.16 | 57.28 | 53.20 | 56.13 | 55.34 | 41.00 |
| BARTScore | ||||||||||
| \hdashline[3pt/3pt] Vanilla BARTScore | 47.42 | 44.67 | 38.11 | 35.64 | 35.53 | 67.89 | 67.00 | 64.67 | 60.51 | 51.27 |
| + Prompt | 48.71 | 40.75 | 37.76 | 33.74 | 36.89 | 70.14 | 67.89 | 68.60 | 62.04 | 51.83 |
| Ours - BARTScore++ | ||||||||||
| \hdashline[3pt/3pt] + Error Analysis | 47.76 | 44.67† | 38.48† | 35.66† | 35.53† | 68.62‡ | 67.79† | 68.60‡ | 61.15‡ | 51.73 |
| + Prompt + Error Analysis | 49.00 | 40.83† | 38.08† | 33.88† | 37.01† | 70.44‡ | 68.75‡ | 69.66‡ | 63.04‡ | 52.30 |
| Metrics | Rank19 | Q-CNN | Q-XSUM |
| Acc.(%) | Pearson(%) | ||
| Baselines | |||
| \hdashline[3pt/3pt] ROUGE | 63.00 | 45.91 | 9.70 |
| BERTScore | 71.31 | 57.60 | 2.38 |
| MoverScore | 71.31 | 41.41 | 5.41 |
| PRISM | 78.02 | 47.87 | 2.50 |
| Factuality Metrics | |||
| \hdashline[3pt/3pt] FactCC | 70.00 | - | - |
| QAGS | 71.20 | 54.50 | 17.50 |
| Human | 83.90 | - | - |
| BARTScore | |||
| \hdashline[3pt/3pt] Vanilla BARTScore | 83.65 | 73.47 | 18.38 |
| + Prompt | 79.62 | 71.85 | 9.40 |
| Ours - BARTScore++ | |||
| \hdashline[3pt/3pt] + Error Analysis | 84.18† | 73.97‡ | 19.33‡ |
| + Prompt + Error Analysis | 80.70‡ | 72.60‡ | 10.55 |
5.1 Machine Translation
Table 2 shows segment-level Kendall correlation of metrics on WMT20. We can observe that BARTScore++ can achieve state-of-the-art performance on all language pairs (most significantly outperform vanilla BARTScore except ps-en). The average correlation of BARTScore can surpass all supervised and unsupervised metrics by a large margin in both high-resource and low-resource scenarios. This confirms our intuition that with analysis of explicit/implicit errors, BARTScore++ will agree more with human evaluations compared with vanilla BARTScore.
Regarding the prompting strategy, we also observe that 1) our proposed error analysis mechanism in BARTScore++ can achieve a similar amount of correlation improvement as that of prompting, and 2) incorporating both prompting and error analysis can further push SOTA results, confirming the orthogonality of error analysis and prompting strategies upon BARTScore.
5.2 Text Summarization
Results on REALSumm, SummEval and NeR18 are showed in Table 3. We observe that: 1) BARTScore++ surpasses all other metrics including BARTScore variants for all test settings except REALSumm. In most aspects, our purposed method can significantly improve the performance of vanilla BARTScore; 2) Also, error analysis mechanism in BARTScore++ can achieve a similar amount of correlation improvement as that of prompting, which testify the importance of considering errors in summarization evaluation.
| Metrics | BAGEL | SFRES | SFHOT | Avg. |
| Baselines | ||||
| \hdashline[3pt/3pt] ROUGE | 23.43 | 11.57 | 11.75 | 15.58 |
| BERTScore | 28.91 | 15.64 | 13.54 | 19.36 |
| MoverScore | 28.37 | 15.27 | 17.23 | 20.29 |
| PRISM | 30.49 | 15.47 | 19.64 | 21.87 |
| BARTScore | ||||
| \hdashline[3pt/3pt] Vanilla BARTScore | 31.89 | 19.52 | 21.65 | 24.35 |
| + Prompt | 33.28 | 23.74 | 23.81 | 26.94 |
| Ours - BARTScore++ | ||||
| \hdashline[3pt/3pt] + Error Analysis | 32.67† | 19.74† | 25.63‡ | 26.00 |
| + Prompt + Error Analysis | 34.12‡ | 23.99‡ | 26.04‡ | 28.02 |
Analysis on factuality datasets
As shown in Table 4, we observe that BARTScore++ significantly outperforms all other metrics on all three datasets. Strikingly, BARTScore++ can even surpass human baseline on Rank19 by a large margin. This further confirms the universality of our proposed error analysis strategy.
5.3 Data-to-Text
Results on Data-to-Text datasets are shown in Table 5. We can see that BARTScore++ can again surpass existing methods and significantly outperform vanilla BARTScore on SFRES and SFHOT. We further find weights on explicit errors are consistently larger than implicit errors on all three datasets. This suggests that we should focus more on explicit errors when evaluating Data-to-Text tasks.
6 Analysis
To better understand the mechanism by which BARTScore++ achieves these promising results, we take a closer look at BARTScore++ by testing their correlation with MQM human evaluations, an error-based evaluation framework annotated by human experts (Freitag et al., 2021a) and answer three questions:
-
Q1:
How reliable is our BARTScore++ when evaluating top-performing systems?
-
Q2:
How do explicit/ implicit error weights influence the accuracy of BARTScore++?
-
Q3:
How does error analysis make BARTScore++ more human-like?
6.1 BARTScore++ is Reliable When Evaluating Top- Systems
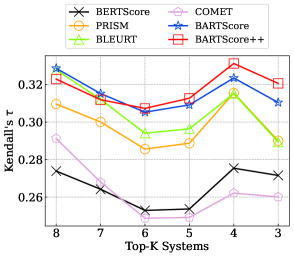
Previous studies have shown that most metrics are unreliable for evaluating best-performing systems, showing a sharp degradation of correlation with human evaluation (Mathur et al., 2020a).
To answer Q1, we assess our method shown in Figure 2 with several baseline metrics on Top- MT systems by computing Kendall’s respectively .555Note that the explicit/implicit error weight is fixed to for fair comparison. We can see that BARTScore++ can further improve BARTScore’s performance by a large margin, especially when evaluating top-performing systems (). This verifies the reliability of our purposed method.
6.2 BARTScore++ is Stable When Adjusting Error Weights
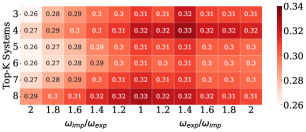
To answer Q2, we present an analysis on adjusting hyperparameters of BARTScore++. In Figure 3, as the number of systems decreases, the ratio of error weights according to the best performing BARTScore++ is fluctuating from to . This suggests the importance of adjusting the error weights according to the overall qualities of MT systems before evaluating them.
6.3 BARTScore++ is More Human-Like on Discriminating Errors
To answer Q3, we perform a case study in Appendix B to further show the advantage of our error analysis strategies incorporated in BARTScore++.
In Table 7, we can see that human evaluators consistently assign low MQM scores to explicit errors (e.g. mistranslation of "delivery" in WeChat AI in example 1, mistranslation of "yuan" in VolcTrans in example 2), but BARTScore produces contrary judgments, ignoring these errors that should be punished strictly. Through our proposed error analysis, BARTScore++ becomes more discriminative on explicit errors and reaches agreement with human judgments, while BARTScore fails to discriminate against such errors.
7 Related Work
Automatic Metrics
Automatic Evaluation Metrics are of crucial importance to the development of NLG systems. Recent research has shown great success in language model-based metrics, which can significantly outperform traditional surface-based metrics such as BLEU (Papineni et al., 2002). For example, BERTScore (Zhang et al., 2020b) and MoverScore (Zhao et al., 2019) leverage contextual embeddings to measure semantic distance between reference and hypothesis. COMET (Rei et al., 2020) and BLEURT (Sellam et al., 2020) rely on human evaluations to train. In this paper, we choose BARTScore (Yuan et al., 2021) as the testbed because of its SOTA performance and universality on NLG tasks. Note that our error analysis strategies can also be extended to other metrics, such as PRISM (Thompson and Post, 2020).
Human Evaluation
Human evaluation techniques, such as Direct Assessment (Graham et al., 2017), are often served as ‘golden standard’. However, there is increasing evidence that inadequate evaluation will lead to wrong decisions (Toral, 2020). This motivates elaborate evaluation proposals (Popović, 2020; Gladkoff and Han, 2021) and MQM is one of these methodologies, grounded in explicit error analysis (Freitag et al., 2021a). In this work, We extend error analysis strategies to BARTScore, making it trigger more human-like judgments.
Error Analysis
Existing automatic metrics tend to simplify the error detection procedure, such as edit distance in TER (Snover et al., 2006) and mismatch in BERTScore (Zhang et al., 2020b). In this work, we try to reveal the token-level judgments in BARTScore and analyze these errors through refining operations, making metrics "think" like a human, and providing more accurate evaluations. Our error analysis framework functionalizes like token-level quality estimation (Specia et al., 2021) or automatic post-editing (Freitag et al., 2019). With the reference signal provided, our proposed method is more accurate and universal for NLG evaluation.
8 Conclusion
In this paper, we present an automatic metric BARTScore++ for evaluating natural language generation. Inspired by the advanced human evaluation MQM, BARTScore++ incorporates error analysis strategies to give a comprehensive score considering explicit and implicit errors. Experimental results show that our proposed method consistently improves the performance of BARTScore and achieves competitive results on a broad range of tasks. Our work is an early step toward human-like evaluation for automatic metrics, and we hope our BARTScore++ can motivate researchers working on NLG evaluation to focus more on human evaluation procedures such as error analysis.
Limitations
Limitations of BARTScore++ are three-fold:
-
•
In §3.1, we propose Explicit/Implicit errors to better distinguish different types of errors in generated texts. However, explicit errors only contain token-level errors that can be detected and corrected by error analysis, not involving all error types mentioned in MQM (e.g. severe fluency errors). We hope future studies can take these situations into account.
-
•
In §3.2 we can see that our proposed error analysis framework fully relies on the generation probabilities of BART to decide how to refine the hypothesis. Still, we see that this framework may lead to false judgments due to unfaithful content. Further research can explore how to calibrate the pre-trained models during error analysis.
-
•
In §3.3 we integrate the distance of explicit and implicit errors by simply computing their weighted sum. This can be improved by considering more factors, e.g. the overall quality of the generated text, refining iterations, and external signals. We will leave the exploration of combining these factors and designing better weighting schemes as future work.
References
- Bhandari et al. (2020) Manik Bhandari, Pranav Narayan Gour, Atabak Ashfaq, Pengfei Liu, and Graham Neubig. 2020. Re-evaluating evaluation in text summarization. In Proceedings of the 2020 Conference on Empirical Methods in Natural Language Processing (EMNLP), pages 9347–9359, Online. Association for Computational Linguistics.
- Chow et al. (2019) Julian Chow, Lucia Specia, and Pranava Madhyastha. 2019. WMDO: Fluency-based word mover’s distance for machine translation evaluation. In Proceedings of the Fourth Conference on Machine Translation (Volume 2: Shared Task Papers, Day 1), pages 494–500, Florence, Italy. Association for Computational Linguistics.
- Fabbri et al. (2021) Alexander R. Fabbri, Wojciech Kryściński, Bryan McCann, Caiming Xiong, Richard Socher, and Dragomir Radev. 2021. SummEval: Re-evaluating summarization evaluation. Transactions of the Association for Computational Linguistics, 9:391–409.
- Falke et al. (2019) Tobias Falke, Leonardo F. R. Ribeiro, Prasetya Ajie Utama, Ido Dagan, and Iryna Gurevych. 2019. Ranking generated summaries by correctness: An interesting but challenging application for natural language inference. In Proceedings of the 57th Annual Meeting of the Association for Computational Linguistics, pages 2214–2220, Florence, Italy. Association for Computational Linguistics.
- Fan et al. (2018) Angela Fan, Mike Lewis, and Yann Dauphin. 2018. Hierarchical neural story generation. In Proceedings of the 56th Annual Meeting of the Association for Computational Linguistics (Volume 1: Long Papers), pages 889–898, Melbourne, Australia. Association for Computational Linguistics.
- Freitag et al. (2019) Markus Freitag, Isaac Caswell, and Scott Roy. 2019. APE at scale and its implications on MT evaluation biases. In Proceedings of the Fourth Conference on Machine Translation (Volume 1: Research Papers), pages 34–44, Florence, Italy. Association for Computational Linguistics.
- Freitag et al. (2021a) Markus Freitag, George Foster, David Grangier, Viresh Ratnakar, Qijun Tan, and Wolfgang Macherey. 2021a. Experts, errors, and context: A large-scale study of human evaluation for machine translation. Transactions of the Association for Computational Linguistics, 9:1460–1474.
- Freitag et al. (2020) Markus Freitag, David Grangier, and Isaac Caswell. 2020. BLEU might be guilty but references are not innocent. In Proceedings of the 2020 Conference on Empirical Methods in Natural Language Processing (EMNLP), pages 61–71, Online. Association for Computational Linguistics.
- Freitag et al. (2021b) Markus Freitag, Ricardo Rei, Nitika Mathur, Chi-kiu Lo, Craig Stewart, George Foster, Alon Lavie, and Ondřej Bojar. 2021b. Results of the WMT21 metrics shared task: Evaluating metrics with expert-based human evaluations on TED and news domain. In Proceedings of the Sixth Conference on Machine Translation, pages 733–774, Online. Association for Computational Linguistics.
- Gehrmann et al. (2018) Sebastian Gehrmann, Yuntian Deng, and Alexander Rush. 2018. Bottom-up abstractive summarization. In Proceedings of the 2018 Conference on Empirical Methods in Natural Language Processing, pages 4098–4109, Brussels, Belgium. Association for Computational Linguistics.
- Gladkoff and Han (2021) Serge Gladkoff and Lifeng Han. 2021. Hope: A task-oriented and human-centric evaluation framework using professional post-editing towards more effective mt evaluation. arXiv preprint arXiv:2112.13833.
- Graham et al. (2017) Yvette Graham, Timothy Baldwin, Alistair Moffat, and Justin Zobel. 2017. Can machine translation systems be evaluated by the crowd alone. Natural Language Engineering, 23(1):3–30.
- Grusky et al. (2018) Max Grusky, Mor Naaman, and Yoav Artzi. 2018. Newsroom: A dataset of 1.3 million summaries with diverse extractive strategies. In Proceedings of the 2018 Conference of the North American Chapter of the Association for Computational Linguistics: Human Language Technologies, Volume 1 (Long Papers), pages 708–719, New Orleans, Louisiana. Association for Computational Linguistics.
- Koehn (2004) Philipp Koehn. 2004. Statistical significance tests for machine translation evaluation. In Proceedings of the 2004 Conference on Empirical Methods in Natural Language Processing, pages 388–395, Barcelona, Spain. Association for Computational Linguistics.
- Kryscinski et al. (2020) Wojciech Kryscinski, Bryan McCann, Caiming Xiong, and Richard Socher. 2020. Evaluating the factual consistency of abstractive text summarization. In Proceedings of the 2020 Conference on Empirical Methods in Natural Language Processing (EMNLP), pages 9332–9346, Online. Association for Computational Linguistics.
- Lewis et al. (2020) Mike Lewis, Yinhan Liu, Naman Goyal, Marjan Ghazvininejad, Abdelrahman Mohamed, Omer Levy, Veselin Stoyanov, and Luke Zettlemoyer. 2020. BART: Denoising sequence-to-sequence pre-training for natural language generation, translation, and comprehension. In Proceedings of the 58th Annual Meeting of the Association for Computational Linguistics, pages 7871–7880, Online. Association for Computational Linguistics.
- Ma et al. (2019) Qingsong Ma, Johnny Wei, Ondřej Bojar, and Yvette Graham. 2019. Results of the WMT19 metrics shared task: Segment-level and strong MT systems pose big challenges. In Proceedings of the Fourth Conference on Machine Translation (Volume 2: Shared Task Papers, Day 1), pages 62–90, Florence, Italy. Association for Computational Linguistics.
- Mairesse et al. (2010) François Mairesse, Milica Gašić, Filip Jurčíček, Simon Keizer, Blaise Thomson, Kai Yu, and Steve Young. 2010. Phrase-based statistical language generation using graphical models and active learning. In Proceedings of the 48th Annual Meeting of the Association for Computational Linguistics, pages 1552–1561, Uppsala, Sweden. Association for Computational Linguistics.
- Mathur et al. (2020a) Nitika Mathur, Timothy Baldwin, and Trevor Cohn. 2020a. Tangled up in BLEU: Reevaluating the evaluation of automatic machine translation evaluation metrics. In Proceedings of the 58th Annual Meeting of the Association for Computational Linguistics, pages 4984–4997, Online. Association for Computational Linguistics.
- Mathur et al. (2020b) Nitika Mathur, Johnny Wei, Markus Freitag, Qingsong Ma, and Ondřej Bojar. 2020b. Results of the WMT20 metrics shared task. In Proceedings of the Fifth Conference on Machine Translation, pages 688–725, Online. Association for Computational Linguistics.
- Narayan et al. (2018) Shashi Narayan, Shay B. Cohen, and Mirella Lapata. 2018. Don’t give me the details, just the summary! topic-aware convolutional neural networks for extreme summarization. In Proceedings of the 2018 Conference on Empirical Methods in Natural Language Processing, pages 1797–1807, Brussels, Belgium. Association for Computational Linguistics.
- Papineni et al. (2002) Kishore Papineni, Salim Roukos, Todd Ward, and Wei-Jing Zhu. 2002. Bleu: a method for automatic evaluation of machine translation. In Proceedings of the 40th Annual Meeting of the Association for Computational Linguistics, pages 311–318, Philadelphia, Pennsylvania, USA. Association for Computational Linguistics.
- Popović (2020) Maja Popović. 2020. Informative manual evaluation of machine translation output. In Proceedings of the 28th International Conference on Computational Linguistics, pages 5059–5069, Barcelona, Spain (Online). International Committee on Computational Linguistics.
- Rei et al. (2020) Ricardo Rei, Craig Stewart, Ana C Farinha, and Alon Lavie. 2020. COMET: A neural framework for MT evaluation. In Proceedings of the 2020 Conference on Empirical Methods in Natural Language Processing (EMNLP), pages 2685–2702, Online. Association for Computational Linguistics.
- Sellam et al. (2020) Thibault Sellam, Dipanjan Das, and Ankur Parikh. 2020. BLEURT: Learning robust metrics for text generation. In Proceedings of the 58th Annual Meeting of the Association for Computational Linguistics, pages 7881–7892, Online. Association for Computational Linguistics.
- Snover et al. (2006) Matthew Snover, Bonnie Dorr, Rich Schwartz, Linnea Micciulla, and John Makhoul. 2006. A study of translation edit rate with targeted human annotation. In Proceedings of the 7th Conference of the Association for Machine Translation in the Americas: Technical Papers, pages 223–231, Cambridge, Massachusetts, USA. Association for Machine Translation in the Americas.
- Specia et al. (2021) Lucia Specia, Frédéric Blain, Marina Fomicheva, Chrysoula Zerva, Zhenhao Li, Vishrav Chaudhary, and André F. T. Martins. 2021. Findings of the WMT 2021 shared task on quality estimation. In Proceedings of the Sixth Conference on Machine Translation, pages 684–725, Online. Association for Computational Linguistics.
- Thompson and Post (2020) Brian Thompson and Matt Post. 2020. Automatic machine translation evaluation in many languages via zero-shot paraphrasing. In Proceedings of the 2020 Conference on Empirical Methods in Natural Language Processing (EMNLP), pages 90–121, Online. Association for Computational Linguistics.
- Toral (2020) Antonio Toral. 2020. Reassessing claims of human parity and super-human performance in machine translation at WMT 2019. In Proceedings of the 22nd Annual Conference of the European Association for Machine Translation, pages 185–194, Lisboa, Portugal. European Association for Machine Translation.
- Wang et al. (2020) Alex Wang, Kyunghyun Cho, and Mike Lewis. 2020. Asking and answering questions to evaluate the factual consistency of summaries. In Proceedings of the 58th Annual Meeting of the Association for Computational Linguistics, pages 5008–5020, Online. Association for Computational Linguistics.
- Wen et al. (2015) Tsung-Hsien Wen, Milica Gašić, Nikola Mrkšić, Pei-Hao Su, David Vandyke, and Steve Young. 2015. Semantically conditioned LSTM-based natural language generation for spoken dialogue systems. In Proceedings of the 2015 Conference on Empirical Methods in Natural Language Processing, pages 1711–1721, Lisbon, Portugal. Association for Computational Linguistics.
- Weng et al. (2020) Rongxiang Weng, Heng Yu, Xiangpeng Wei, and Weihua Luo. 2020. Towards enhancing faithfulness for neural machine translation. In Proceedings of the 2020 Conference on Empirical Methods in Natural Language Processing (EMNLP), pages 2675–2684, Online. Association for Computational Linguistics.
- Yuan et al. (2021) Weizhe Yuan, Graham Neubig, and Pengfei Liu. 2021. Bartscore: Evaluating generated text as text generation. In Advances in Neural Information Processing Systems, volume 34, pages 27263–27277. Curran Associates, Inc.
- Zhang et al. (2020a) Biao Zhang, Philip Williams, Ivan Titov, and Rico Sennrich. 2020a. Improving massively multilingual neural machine translation and zero-shot translation. In Proceedings of the 58th Annual Meeting of the Association for Computational Linguistics, pages 1628–1639, Online. Association for Computational Linguistics.
- Zhang et al. (2020b) Tianyi Zhang, Varsha Kishore, Felix Wu, Kilian Q. Weinberger, and Yoav Artzi. 2020b. Bertscore: Evaluating text generation with bert. In International Conference on Learning Representations.
- Zhao et al. (2019) Wei Zhao, Maxime Peyrard, Fei Liu, Yang Gao, Christian M. Meyer, and Steffen Eger. 2019. MoverScore: Text generation evaluating with contextualized embeddings and earth mover distance. In Proceedings of the 2019 Conference on Empirical Methods in Natural Language Processing and the 9th International Joint Conference on Natural Language Processing (EMNLP-IJCNLP), pages 563–578, Hong Kong, China. Association for Computational Linguistics.
- Zhou et al. (2021) Chunting Zhou, Graham Neubig, Jiatao Gu, Mona Diab, Francisco Guzmán, Luke Zettlemoyer, and Marjan Ghazvininejad. 2021. Detecting hallucinated content in conditional neural sequence generation. In Findings of the Association for Computational Linguistics: ACL-IJCNLP 2021, pages 1393–1404, Online. Association for Computational Linguistics.
Appendix A Variants of Vanilla BARTScore
BARTScore Variants
We summarize variants of BARTScore in Table 6. score is applied for Machine Translation and Data-to-Text tasks; recall-based BARTScore is applied in REALSumm due to recall-based pyramid human evaluation; BARTScore on faithfulness is applied to other summarization tasks. In our experiments, we follow the same settings as in BARTScore (Yuan et al., 2021).
| Variants | Computation using BARTScore |
| score | |
| Recall | |
| Faithfulness |
Prompt Design
Prompting is a parameter-free method to elicit more accurate results by combining texts with a set of short phrases (prompts). BARTScore applies this method through two basic approaches: suffixing prompts on the encoder or prefixing prompts on the decoder of BART (Lewis et al., 2020). If multiple prompts are provided, the final BARTScore of a hypothesis is computed by averaging the score of all its generation scores using different prompts. When vanilla BARTScore is used in our method, we perform the same prompting strategy as in BARTScore (Yuan et al., 2021).
Appendix B Case Study
| Example 1 | ||||
| Source | 9月25日,北京大兴国际机场投运仪式隆重举行。 | |||
| Reference | On September 25th, agrandopeningceremony was held for the Beijing Daxing International Airport. | |||
| MT system | Output | BARTScore | BARTScore++ | MQM |
| VolcTrans | On September 25, thecommissioningceremony of Beijing Daxing International Airport was heldceremoniously. | -1.544 | -0.827 | -2.000 |
| WeChat AI | On September 25, the delivery ceremony of Beijing Daxing International Airport was held. | -1.375 | -0.855 | -5.333 |
| MT system | Revised output | BARTScore | ||
| VolcTrans | On September 25, thecommissioningceremony of Beijing Daxing International Airport was heldceremoniously. | -1.544 | 0.000 | 0.827 |
| WeChat AI | On September 25, thegrandopeningceremony for Beijing Daxing International Airport was held. | -0.884 | 0.491 | 0.168 |
| Example 2 | ||||||
| Source | 中国将实施更加积极主动的开放战略,创造更全面、更深入、更多元的对外开放格局,… | |||||
| Reference |
|
|||||
| MT system | Output | BARTScore | BARTScore++ | MQM | ||
| VolcTrans | China will implement a more proactive opening-up strategy, create a more comprehensive, more in-depth and more yuanpattern of opening up to the outside world, … | -2.324 | -2.091 | -6.367 | ||
| WeChat AI | China will implement a more proactive opening strategy, create a more comprehensive, deeper and diversified pattern of opening up to the outside world, … | -2.339 | -2.085 | -2.067 | ||
| MT system | Revised output | BARTScore | ||||
| VolcTrans | China will implement a more proactive opening-up strategy, work to create a more comprehensive, more diverse-depth and more deeper layout of opening up, … | -1.429 | 0.895 | 0.838 | ||
| WeChat AI | China will implement a more proactive opening up strategy, work to create a more comprehensive, diverse and more diversified layout of opening up, … | -1.497 | 0.842 | 0.907 | ||
We also show two evaluation examples of machine translation in Table 7 to further explain how error analysis makes BARTScore++ more human-like. We show generated texts, MQM scores, and Explicit/Implicit error distance of BARTScore++ from two out-performing systems, VolcTrans and WeChat AI, on WMT20.
Example 1
We can see that WeChat AI produces a mistranslation error and an omission error (marked in green and yellow respectively). However, vanilla BARTScore seems to "ignore" this error and give a higher score than a better translation by VolcTrans. BARTScore++ applies an error analysis and gives a more discriminative evaluation by detecting these errors and recording them as explicit errors. Explicit error distances for both translations (0.491 vs. 0.000) are enlarged by a larger error weight, resulting in an agreement with human judgment.
Example 2
Although vanilla BARTScore gives similar scores to these two results, we can see that VolcTrans makes an explicit error which should lead to a lower level of judgment. Specifically, VolcTrans literally translates word "多元" into more yuan (marked in yellow), which is improper because this word means diverse in English. Fortunately, this error can be detected through error analysis, resulting in a relatively large explicit distance (0.05 compared with 0.01). Therefore, BARTScore++ can better distinguish major errors and become more human-like.