Photometric and Spectroscopic Observations of GRB 210104A: Bright Reverse shock Emission and Dense Circumburst Environment
Abstract
Early afterglow observations of gamma-ray bursts (GRBs) are valuable for exploring the properties of their jets and ambient medium. We report our photometric and spectroscopic observations of GRB 210104A and discuss its jet properties with multiwavelength data. Our spectroscopic observation reveals several absorption features and a tentative redshift of 0.46 is identified. A bright optical flare that has a peak brightness of mag at s was observed in the band during seconds post the GRB trigger. The flux of the -band afterglow decays with a slope of at s. The early X-ray afterglow lightcurve is a smooth bump, and it decays with a slope of at late epoch. Our joint spectral fit to the optical-X-ray afterglows during s yields a photon index . The derived host galaxy extinction is . Attributing the early optical flare to the reverse-shock (RS) emission and the late optical-X-ray emission to the forward shock emission; the optical and X-ray lightcurves at s can be well fit adopting an Markov Chain Monte Carlo algorithm. Comparing the properties of GRB 210104A with other GRBs that have detection of bright RS emission, we show that its jet is mildly magnetized (), with high radiation efficiency (), is sub-energetic ( erg), and moderately relativistic () in a density medium (). It follows the tight relation as with typical GRBs.
1 Introduction
Gamma-ray bursts (GRBs) and their afterglows are the most luminous transients in the universe. Their isotropic prompt gamma-ray energy is typically erg, and their bright X-ray afterglows were detected with the X-Ray Telescope (XRT) for almost of GRBs triggered with the Burst Alert Telescope (BAT) on board the Swift mission (e.g., Gehrels et al., 2009). Their optical afterglow can even can be seen by eyes. The record holder so far is GRB 080319B, the so-called naked-eye GRB, which has an extremely bright optical afterglow with a peak visual magnitude of 5.3 at redshift of (Racusin et al., 2008). Early bright optical flares were detected in some GRBs, such as GRB 990123 ( mag in the band at ; Akerlof et al., 1999), GRB 080129 ( mag in the band at ; Greiner et al., 2009), GRB 090102 ( in the band at ; Klotz et al., 2009; Mangano et al., 2009), GRB 130427A ( mag in the band at ; Vestrand et al., 2014), and GRB 140512A ( mag in the band at ; Huang et al., 2016). These flare-like optical afterglows are thought to be the external reverse-shock (RS) emission of the GRB jets (e.g., Mészáros & Rees, 1999; Sari & Piran, 1999a, b; Kobayashi & Sari, 2000). They are powerful probes for investigating the physical properties of the radiating region and its surrounding medium (e.g., Sari & Piran, 1999b; Kobayashi & Zhang, 2003; Japelj et al., 2014; Gao et al., 2015; Yi et al., 2020).
Comparing to the onset peak of the forward shock (FS) emission, the optical flares produced by the RS are rarely detected. It was suggested that the RS emission could be suppressed by strong magnetization of the RS region (Zhang & Kobayashi, 2005; Mimica et al., 2009; Mizuno et al., 2009) or the RS emission peaks at a lower energy band (Mundell et al., 2007; Melandri et al., 2010; Resmi & Zhang, 2016). Alternately, the RS emission may also be masked by the prompt emission from the internal shocks (Kopač et al., 2013). RS emission is a critical probe to study the magnetization of the jet (e.g., Chen & Liu, 2021). With detection of RS emission in some GRBs, it is found that the magnetization of the RS region is stronger than that in the FS region by a magnetization parameter of , where and are the magnetic equipartition parameters of the FS and RS regions (Zhang et al., 2003; Japelj et al., 2014). The RS emission could dominate the early optical afterglow emission if the typical value of (Gao et al., 2015).
As a cosmic beacon, the GRB afterglows are probes for the ambient medium surrounding GRB jets (e.g., Levesque et al., 2010; Covino et al., 2013). The medium density surrounding a short GRBs, which are produced by the mergers of compact stars, is expected to be low (Panaitescu et al., 2001; Perna & Belczynski, 2002; Xin et al., 2011). Long GRBs originate from the collapse of massive stars and they usually occur in the star formation region. It is found that long GRB host galaxies generally have a low-metallicity interstellar medium (ISM) environment (e.g., Fruchter et al., 2006). The medium density profile of some GRBs can be parameterized as , where is the distance to the progenitor, implying the surrounding medium should be wind medium (e.g., Dai & Lu, 1998; Mészáros et al., 1998; Panaitescu et al., 1998; Chevalier & Li, 1999, 2000). By analyzing the temporal feature of the optical afterglow onset bumps for a sample of GRBs, it is found that the medium density profile at the early stage is with a typical value as 1 (e.g., Liang et al., 2013). Some unusual temporal features, such as a bump or the transition of a flux decaying slope, may also hint at the unique properties of the ambient density, e.g., a medium density jump or the transition of the medium profile, or the preheated and ionized medium (e.g., Dai & Lu, 2002; Beloborodov, 2005; Zhang et al., 2021).
This paper reports our photometric and spectroscopic observations of GRB 210104A with the GWAC-F60, 0.8 m TNT telescopes, and 2.16 m telescope at Xinglong observatory. A bright optical flare was observed in its very early optical afterglows. It is a valuable case for enlarging our GRB sample with detection of a very early optical flare for studying the GRB jet properties and ambient density. Our observations and data reduction is reported in § 2, and the data analysis is present in § 3. Discussion of our analysis results and implications for the GRB jet properties are reported in § 5. We summarize our results in § 6. Throughout, the convention in the cgs units and are adopted. We take the cosmology parameters as , and (Planck Collaboration et al., 2016).
2 Observations and Data Reduction
At 11:26:59.87 UT on 2021 January 4 , the Fermi Gamma-Ray Burst Monitor (GBM) triggered and located GRB 210104A, which was also detected by Swift/BAT (Malacaria et al., 2021; Troja et al., 2021). The Fermi/GBM final real-time localization is consistent with the Swift position (Fermi GBM Team, 2021). Its X-ray afterglows were detected with Swift/XRT since s after the BAT trigger. We download the Swift/XRT lightcurve data from the website of Swift Burst Analyzer111 https://www.swift.ac.uk/xrt_curves/01015873/.
We carried out photometric follow-up observations by both GWAC-F60A222 The GWAC-F60A telescope with a diameter of 60 cm is a follow-up facility belonging to the GWAC system. and 0.8 m TNT telescopes333 TNT is a 0.8 m Tsinghua University - National Astronomical Observatory of China Telescope at Xinglong Observatory runs by a custom-designed automation system for GRB follow-up observations (Zheng et al., 2008). A PI CCD and filters in the standard Johnson Bessel system are equipped for TNT. located at Xinglong observatory, National Astronomical Observatories of Chinese Academy of Sciences. The follow-ups were started by GWAC-F60A and 0.8 m TNT about 61 and 11246 s after the BAT trigger, respectively. Note that optical afterglow observation with the Swift/UVOT began at 71 s after the BAT trigger (Breeveld et al., 2021). Our optical detection is earlier than UVOT. The standard Johnson-Cousins , and bands are used for GWAC-F60A, and the and bands for TNT. The exposure times range from 10 to 2100 s depending on the filters and the evolution of the brightness (Xin et al., 2021). Raw images taken by both telescopes were reduced by following the standard routine in the IRAF package, including bias, dark, flat-field corrections. The standard aperture photometry was adopted for building the lightcurves, in which the absolute calibration of the brightness was performed by using the Sloan Digital Sky Survey (SDSS) catalog (Adelman-McCarthy et al., 2008), with flux/mag conversion of the SDSS system into the Johnson-Cousins system444 http://www.sdss.org/dr6/algorithms/sdssUBVRITransform.html#Lupton2005. Moreover, the band was observed by using the NEXT-0.6 m optical telescope located at Nanshan, Xinjiang, China. Observations started at 11:59:19 UT and ended at 22:34:07 UT on 2021 January 4 (Zhu et al., 2021). The observation log and the resulting absolutely calibrated magnitudes of our photometric observations are listed in Table LABEL:Tab:opt-data.
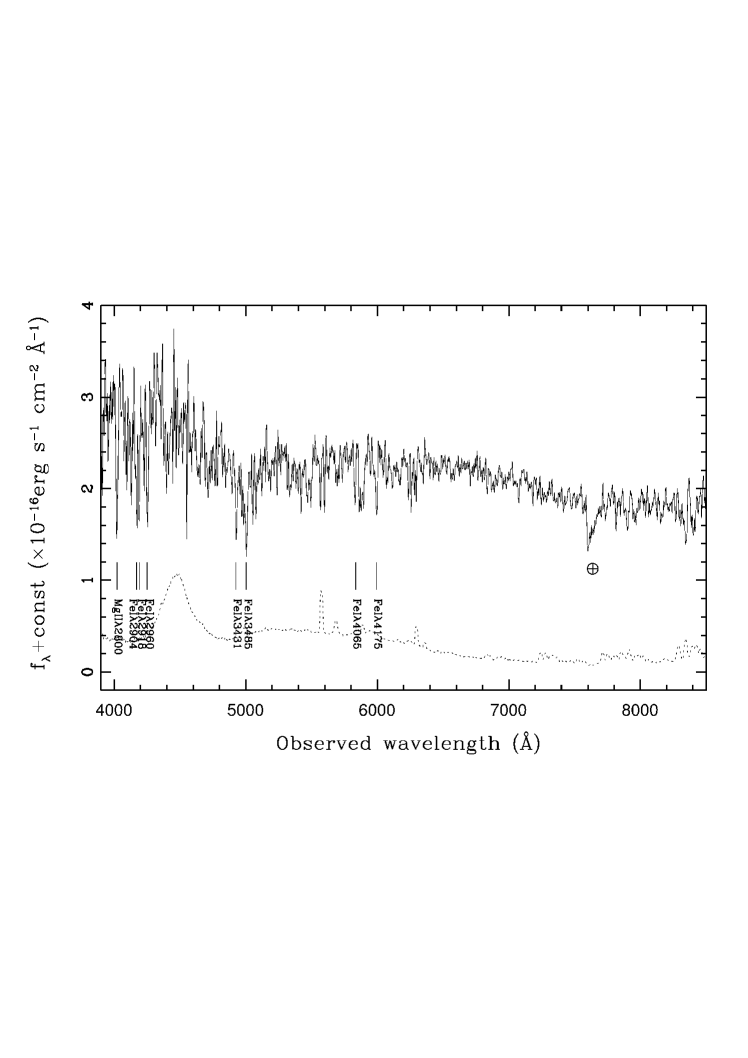
We carried out spectroscopic observations at 11:28:00 UT on 2021 Jan 4 , about hr after the burst trigger, with the 2.16 m telescope in Xinglong Observatory (Fan et al., 2016). The optical spectrum of afterglow of the burst was taken by the Beijing Faint Object Spectrograph and Camera (BFOSC) that is equipped with a back-illuminated E2V55-30 AIMO CCD. The grism G4 was used in the observation, which provides a wavelength coverage of Å in the observer frame. A slit width of 1.8″ oriented in the south-north direction was adopted. The spectral resolution was resulted to be Å as measured from the sky lines. The exposure time is 3600 seconds. The wavelength calibration was carried out with the iron-argon comparison lamps, and the flux calibrations with the observations of the Kitt Peak National Observatory standard stars (Massey & Johnson, 1998). The observed two-dimensional spectrum was reduced by the standard procedures, including bias subtraction and the flat-field correction using the IRAF package. The extracted one-dimensional spectrum was calibrated in wavelength and in flux by the corresponding comparison lamp and standards. The accuracy of the wavelength calibration is Å.
Figure 1 shows the extracted spectrum from our spectroscopic observations in the observer frame after smoothing by a box size of 3Å. Although the signal-to-noise ratio of the continuum is low, one can potentially identify a few absorption features due to Mg II 2800 and Fe II multiplets. This identification returns an estimation of redshift of .
3 Data Analysis
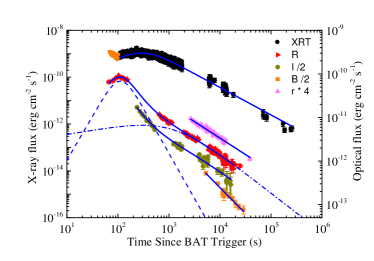
We convert the magnitude of the optical data to the cgs units with the zero-point flux of each band from Bessell et al. (1998). Note that the optical data are corrected for the extinction of our Galaxy with , and (Schlafly & Finkbeiner, 2011). We show the optical and X-ray afterglow lightcurves in the left panel of Figure 2. We empirically fit the lightcurves with a single power-law function or a smooth broken power-law (BPL) function , where depicts the conjunction sharpness of the two segments. Note that the slopes derived from the smooth broken power-law model depend on , especially for a very smooth, broad bump like the X-ray afterglow lightcurve. We fix as in our analysis. We adopt the least-square algorithm for our fit and evaluate the goodness with the reduced .
Our results are shown in the left panel of Figure 2. The of our best fit to the -band lightcurve is 1.74. Our fit shows that the early -band flare peaks at s, and its rising and decaying slopes are and , respectively. The slopes are similar to that usually seen in the early optical flares (e.g., Gao et al., 2015; Huang et al., 2016). The -band lightcurve at s is dominated by another smooth BPL component, and the decaying slope at the late epoch is . The decaying phase of the early optical flare is also well observed in the -band, but the rising part and the peak are missed. By rescaling the flux level, we found that the -band lightcurve fit can apply to the band lightcurve, i.e., and , with . The afterglows in the and bands are detected only at seconds, and their decay slopes are () and ().
The early X-ray afterglow lightcurve is completely different from the optical afterglow. Following an initial rapid decaying phase, the lightcurve shows a very smooth bump. The initial rapid decaying X-ray emission would be resulted from the prompt gamma-ray tail emission being due the curvature effect (e.g. Liang et al., 2006). Ignoring this component, our fit gives , , and s by fixing . The of the fit is 1.45.
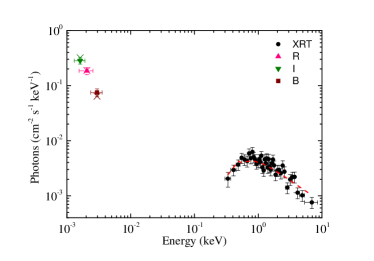
We make a joint spectral analysis of the optical and X-ray data in the time interval from to s. Simultaneous observations in the X-ray, , , and bands are available in this selected time interval. We extract the X-ray spectrum observed with Swift/XRT and adopt the XSPEC (version 12.12.1) package for making the spectral fit. Extinction and H I absorption of both our Galaxy and host galaxy are taken into account. The Galactic H I column density at the GRB direction is . The extinction of our Galaxy in the GRB direction is (Schlegel et al., 1998). The extinction curve of the host galaxy is taken as the same as our Galaxy (Pei, 1992) by setting . We find that an absorbed power-law model is equated to fit the spectrum and the derived photon index is . The reduced is . The hydrogen absorption of the host galaxy is . The color index of the host galaxy is , inferring an extinction in the band of the host galaxy as mag. This indicates that the burst environment is dusty.
4 Theoretically Modeling Optical and X-Ray afterglow LightCurves
Our above analysis shows that the early optical flare seems to be attributed to the RS emission, and the late optical and X-ray emission should could be the FS emission of the GRB fireball. It is uncertain whether the early X-ray bump can be explained with the external shock model. We fit the X-ray and optical lightcurves with the FS+RS afterglow model in this section. The details of our FS model are present in Sari et al. (1998), Huang et al. (2000), Fan & Piran (2006), and Ren et al. (2020). The RS model is referred to Yi et al. (2013) and Gao et al. (2015). The model parameters are the initial bulk Lorentz factor (), the isotropic kinetic energy (), the medium number density (), the energy partitions of the electrons ( and ) and magnetic fields ( and ) as well as the electron energy distribution power-law indices ( and ) of the FS and RS regions, where the superscripts “” and “” indicate the parameters of the FS and RS regions, respectively.
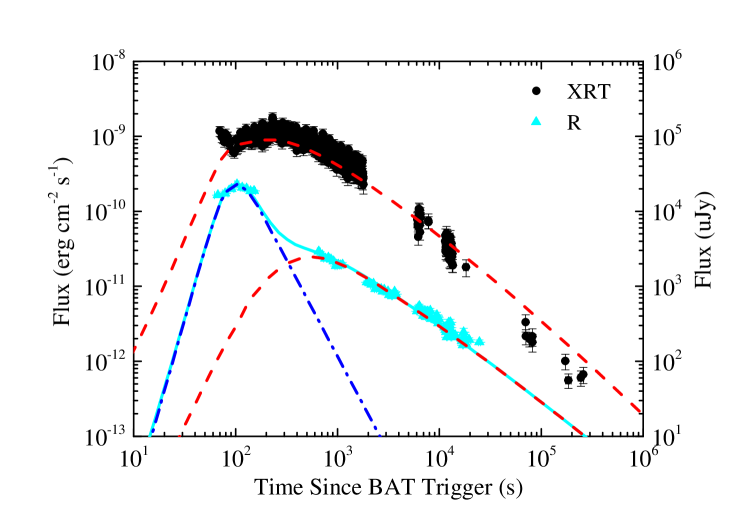
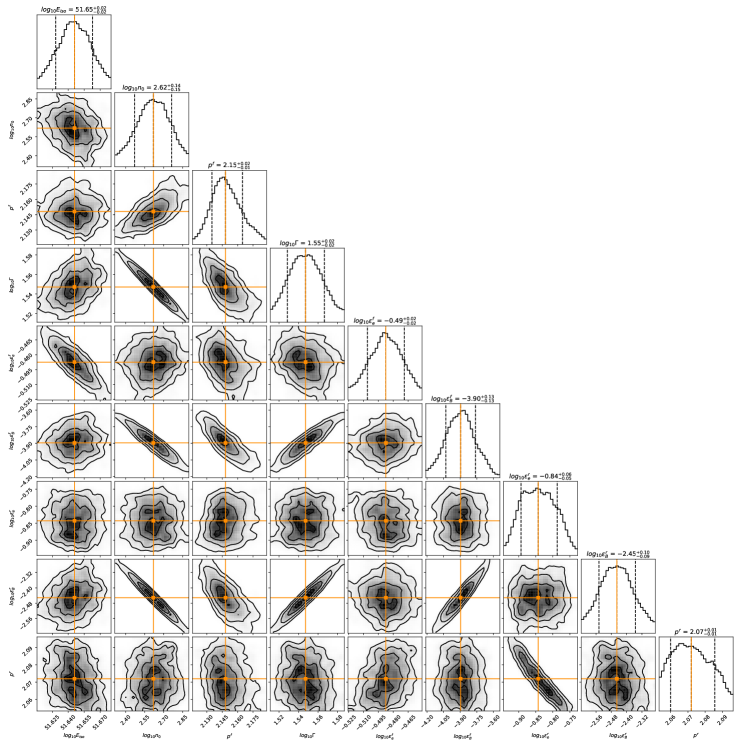
We fit the -band and X-ray afterglow lightcurves with our model by adopting a Markov Chain Monte Carlo (MCMC) algorithm available in the Python package emcee (Foreman-Mackey et al., 2013). Note that the -band lightcurve is corrected by the extinctions of both the host galaxy and our Galaxy. The probability contours of the model parameters derived from out fit are shown in Figure 4. The best fit yields the parameters and their uncertainty are: , , , , , , , , and .
Our best fit is shown in Figure 3. It is found that the optical and X-ray afterglow lightcurves at s can be well fitted with our model. However, the model predicted X-ray flux at s is higher than the observed one. As shown in the left panel of Figure 2, the decay slope of the late X-ray afterglow index is , convincingly ruling out the possibility that the discrepancy results from the jet break effect. Our joint spectral analysis for the optical-X-ray afterglows around s suggests that the X-ray and optical afterglows are in the same spectral regime, as shown in the right panel of Figure 2. It is possible that the late X-ray and optical afterglows are in different spectral regimes. is steeper than that of the R-band afterglow (), with a difference of . The flux decay slope of the synchrotron emission depends on the spectral regime (e.g., Sari et al., 1998; Zhang et al., 2006). In a constant-density medium, we have in the spectral regime and in the spectral regime by taking . Thus, the late optical afterglow should be in the spectral regime and the X-ray afterglows are in the regime. Our best theoretical fit with the MCMC algorithm models the late X-ray and optical afterglows in the same spectral regimes since the late X-ray data are spare and largely uncertain.
5 Discussion
GRB 2101014A is of interest with its bright early optical flash. As mentioned in § 1, bright RS optical emission only detected in several GRBs (e.g., Japelj et al., 2014; Gao et al., 2015, and references therein). The lack might be explained with the suppression by strong magnetization of the RS region (Zhang & Kobayashi, 2005; Mimica et al., 2009; Mizuno et al., 2009), the RS emission peak at a lower frequency than the optical band (Mundell et al., 2007; Melandri et al., 2010; Resmi & Zhang, 2016), and/or masked by the prompt optical and forward shock emission components (Kopač et al., 2013). Different from the bright optical flash observed in GRB 090727 (Mundell et al., 2007), the optical flash of GRB 210104A is not associated with prompt gamma-ray and/or X-ray flare. It could not be originated from the internal shock. We attributed it to the RS emission of the GRB jet in our analysis. Detection of bright RS emission in the band indicates that the typical frequency () of the electron synchrotron emission in the RS region should be in the band. We calculate the value of at the peak time of optical flash through (e.g., Sari et al., 1998; Yost et al., 2003). We obtain Hz, which is closed to the band .
We compare the properties of GRB 210104A with a sample of GRBs available in Japelj et al. (2014). We derive the properties of GRB 210104A from the data observed with the GBM (8-1000 keV) on board the Fermi mission. Its duration is s in the keV band (Malacaria et al., 2021). We extract the GBM spectrum accumulated in the time interval from to s since the GBM trigger with the tool gtburst555 The Fermi/GBM data are downloaded from the Fermi website https://heasarc.gsfc.nasa.gov/FTP/fermi/data/gbm/triggers/2021/bn210104477/current/.. We use the data of two NaI detectors (na and nb) and one BGO detector (b1) based on the angle between each detector and the source. We fit the spectrum by using the Band function (Band et al., 1993) with the XSPEC package. We obtain a low-energy photon index as , a high-energy photon index as , and a spectrum peak energy keV. The reduced of the fit is 474/343. The derived in the keV band is erg, and its peak luminosity is erg s-1. The prompt and afterglow emission properties, including , , , , and of GRB 210104A together with other GRBs from Japelj et al. (2014)666GRBs 021004 and 060908 are not included in our comparison since they are detected with Swift/BAT only and no broadband observations are available for constraining its prompt gamma-ray spectrum. are summarized in Table 2. These properties are dramatically different from each other, and each parameter is in a broad range among these GRBs, i.e., , , , and keV. These results imply that these GRBs do not have any universal features of their prompt gamma-ray and afterglow emission. They are not distinct from typical GRBs.
Measuring the magnetization of the jet with 777 is defined as in Zhang et al. (2003). Here we adopt the definition as ., we calculate the values of GRB 210104A and other GRBs in Table 2. In addition, the radiation efficiency, which is defined as , is also a key probe for the jet composition (e.g., Zhang et al., 2007; Wang et al., 2015). We also calculate their gamma-ray radiation efficiencies. Our results are also reported in Table 2. One can observe that and values are dramatically different among these GRBs, i.e. and . The radiation efficiency of GRB 210104A is the largest one among these GRBs, i.e., . The high radiation efficiency is consistent with the expectation of a magnetized jet (e.g., Zhang et al., 2007; Wang et al., 2015). Gao et al. (2015) reported a typical value of for a sample of GRBs with detection of RS optical emission. GRB 210104A has a relative low value among these GRBs. Its value is 28, indicating that its jet is only moderately magnetized.
The derived of GRB 210104A from our fit is 35, indicating that the jet is middle relativistic. We test whether such a value violates the lower limit derived from the pair production opacity constraint. The spectrum of GRB 2101014A can be fitted with the Band function. Its high-energy spectrum is for , where and . The minimum bulk Lorentz factor for the detection of maximum photon with energy sets a lower limit of as (e.g., Lithwick & Sari, 2001; see also Abdo et al., 2009)
| (1) |
where is the Thompson scattering area, is speed of light, is the luminosity distance, is the electron mass, is a dimensionless function , where , and is the minimum variation timescale of prompt emission, which is taken as a typical value of s (MacLachlan et al., 2013). The Konus-Wind mission detected the highest photon energy up to from GRB 210104A (Frederiks et al., 2021). Thus, we have . The value derived from our fit is close to , but still does not violate the pair production opacity constraint.
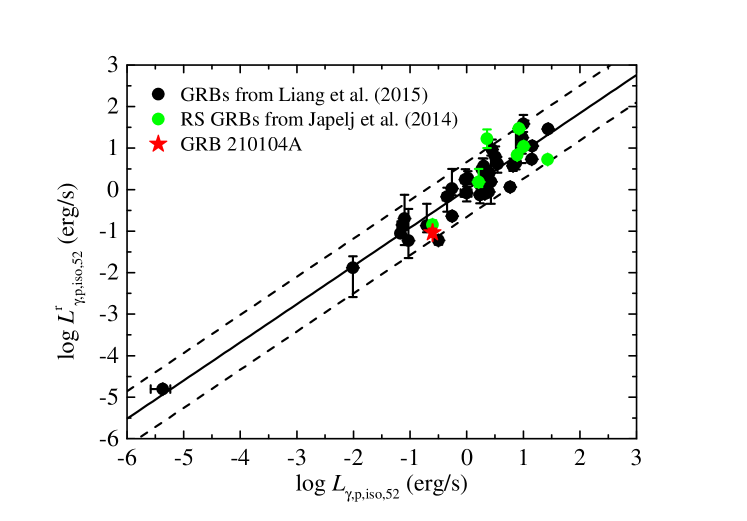
Liang et al. (2015) found a tight correlation, i.e., , where . This relation combines the jet luminosity (or energy), the initial Lorentz factor, and the radiation spectrum. It significantly reduces the intrinsic scatters of the (Liang et al., 2004; Amati, 2006) and (Liang et al., 2010; Lü et al., 2012) relations, resulting in a much tighter relations than the and relation. This relation, which combines the observed luminosity with the properties of the GRB central engine, the medium density, and the radiation physics, should be an intrinsic feature of GRB jets (see also Huang et al., 2020). We examine whether GRB 210104A and other GRBs in Table 2 satisfy the correlation. We calculate the values and show as a function of in Figure 5. It is found that these GRBs follow well this relation. The RS GRBs taken from Japelj et al. (2014) tend to locate at the high luminosity end of this relation, indicating that their prompt gamma-ray luminosities are averagely brighter than typical LGRBs. This would be due to the sample selection effect. GRB 210104A is a relatively low-luminosity, subenergetic GRB among the RS GRBs.
6 Summary
We have reported our spectroscopic and photometric observations of GRB 210104A and present our analysis on its properties of the jet and ambient medium. Our results are summarized below.
-
•
The afterglow spectrum obtained from our spectroscopic observations at about 1 hr after the burst trigger reveals several absorption line features due to absorptions by Mg II 2800 and Fe II, and the redshift is estimated as .
-
•
A bright early optical flare is observed in the band in the time interval s post the GRB trigger. The flash has a peak brightness of mag at s. The slope of the -band afterglow lightcurve is at s. The X-ray afterglow lightcurve features as a smooth onset bump at the early epoch and decays with a slope of . Our joint optical-X-ray spectral analysis in the time slice of s shows that a power-law with a photon index of is equated to fit the spectrum. The derived H I absorption and dust extinction of the host galaxy are and mag by adopting an extinction curve as our Galaxy.
-
•
The -band and X-ray afterglow lightcurves of GRB 210104A at s can be fitted with the standard RS and FS models by adopting an MCMC algorithm. The early bright optical flare is attributed to the RS emission of the jet. The best fit yields the parameters and their uncertainties are: , , , , , , , , and . The derived is very closed to the band. Our theoretical analysis shows that the RS region is mildly magnetized (), suggesting that the jet is only moderately magnetized. The gamma-ray radiating efficiency is 77%. The jet is moderately relativistic (). Such a low value does not violate the the lower limit derived from the pair production opacity constraint ( ).
-
•
We compare the properties of GRB 210104A with a sample of GRBs whose RS emission is detected in their early optical afterglows from Japelj et al. (2014). We do not find any universal features of their prompt gamma-ray and forward shock emission. They are not distinct from typical GRBs. They follow the relation derived from typical GRBs.
References
- Abdo et al. (2009) Abdo, A. A., Ackermann, M., Arimoto, M., et al. 2009, Science, 323, 1688, doi: 10.1126/science.1169101
- Adelman-McCarthy et al. (2008) Adelman-McCarthy, J. K., Agüeros, M. A., Allam, S. S., et al. 2008, ApJS, 175, 297, doi: 10.1086/524984
- Akerlof et al. (1999) Akerlof, C., Balsano, R., Barthelmy, S., et al. 1999, Nature, 398, 400, doi: 10.1038/18837
- Amati (2006) Amati, L. 2006, MNRAS, 372, 233, doi: 10.1111/j.1365-2966.2006.10840.x
- Band et al. (1993) Band, D., Matteson, J., Ford, L., et al. 1993, ApJ, 413, 281, doi: 10.1086/172995
- Bellm et al. (2006) Bellm, E., Bandstra, M., Boggs, S., et al. 2006, GRB Coordinates Network, 5867, 1
- Beloborodov (2005) Beloborodov, A. M. 2005, ApJ, 627, 346. doi: 10.1086/430166p
- Bessell et al. (1998) Bessell, M. S., Castelli, F., & Plez, B. 1998, A&A, 333, 231
- Breeveld et al. (2021) Breeveld, A. A., Troja, E., & Swift/UVOT Team. 2021, GRB Coordinates Network, 29247, 1
- Briggs et al. (1999) Briggs, M. S., Band, D. L., Kippen, R. M., et al. 1999, ApJ, 524, 82, doi: 10.1086/307808
- Chen & Liu (2021) Chen, Q., & Liu, X.-W. 2021, MNRAS, 504, 1759, doi: 10.1093/mnras/stab946
- Chevalier & Li (1999) Chevalier, R. A., & Li, Z.-Y. 1999, ApJ, 520, L29, doi: 10.1086/312147
- Chevalier & Li (2000) —. 2000, ApJ, 536, 195, doi: 10.1086/308914
- Covino et al. (2013) Covino, S., Melandri, A., Salvaterra, R., et al. 2013, MNRAS, 432, 1231. doi: 10.1093/mnras/stt540
- Dai & Lu (2002) Dai, Z. G. & Lu, T. 2002, ApJ, 565, L87. doi: 10.1086/339418p
- Dai & Lu (1998) Dai, Z. G., & Lu, T. 1998, MNRAS, 298, 87, doi: 10.1046/j.1365-8711.1998.01681.x
- Fan & Piran (2006) Fan, Y., & Piran, T. 2006, MNRAS, 369, 197, doi: 10.1111/j.1365-2966.2006.10280.x
- Fan et al. (2016) Fan, Z., Wang, H., Jiang, X., et al. 2016, PASP, 128, 115005, doi: 10.1088/1538-3873/128/969/115005
- Fermi GBM Team (2021) Fermi GBM Team. 2021, GRB Coordinates Network, 29232, 1
- Foreman-Mackey et al. (2013) Foreman-Mackey, D., Hogg, D. W., Lang, D., & Goodman, J. 2013, PASP, 125, 306, doi: 10.1086/670067
- Frederiks et al. (2021) Frederiks, D., Golenetskii, S., Lysenko, A., et al. 2021, GRB Coordinates Network, 29258, 1
- Fruchter et al. (2006) Fruchter, A. S., Levan, A. J., Strolger, L., et al. 2006, Nature, 441, 463, doi: 10.1038/nature04787
- Gao et al. (2015) Gao, H., Wang, X.-G., Mészáros, P., & Zhang, B. 2015, ApJ, 810, 160, doi: 10.1088/0004-637X/810/2/160
- Gehrels et al. (2009) Gehrels, N., Ramirez-Ruiz, E., & Fox, D. B. 2009, ARA&A, 47, 567. doi: 10.1146/annurev.astro.46.060407.145147
- Golenetskii et al. (2009) Golenetskii, S., Aptekar, R., Mazets, E., et al. 2009, GRB Coordinates Network, 8776, 1
- Greiner et al. (2009) Greiner, J., Krühler, T., McBreen, S., et al. 2009, ApJ, 693, 1912, doi: 10.1088/0004-637X/693/2/1912
- Guidorzi et al. (2005) Guidorzi, C., Frontera, F., Montanari, E., et al. 2005, MNRAS, 363, 315, doi: 10.1111/j.1365-2966.2005.09450.x
- Huang et al. (2020) Huang, X.-L., Liang, E.-W., Liu, R.-Y., Cheng, J.-G., & Wang, X.-Y. 2020, ApJ, 903, L26, doi: 10.3847/2041-8213/abc330
- Huang et al. (2016) Huang, X.-L., Xin, L.-P., Yi, S.-X., et al. 2016, ApJ, 833, 100, doi: 10.3847/1538-4357/833/1/100
- Huang et al. (2000) Huang, Y. F., Gou, L. J., Dai, Z. G., & Lu, T. 2000, ApJ, 543, 90, doi: 10.1086/317076
- Japelj et al. (2014) Japelj, J., Kopač, D., Kobayashi, S., et al. 2014, ApJ, 785, 84, doi: 10.1088/0004-637X/785/2/84
- Jin et al. (2013) Jin, Z.-P., Covino, S., Della Valle, M., et al. 2013, ApJ, 774, 114, doi: 10.1088/0004-637X/774/2/114
- Klotz et al. (2009) Klotz, A., Gendre, B., Boer, M., & Atteia, J. L. 2009, GRB Coordinates Network, 8764, 1
- Kobayashi & Sari (2000) Kobayashi, S., & Sari, R. 2000, ApJ, 542, 819, doi: 10.1086/317021
- Kobayashi & Zhang (2003) Kobayashi, S., & Zhang, B. 2003, ApJ, 597, 455, doi: 10.1086/378283
- Kopač et al. (2013) Kopač, D., Kobayashi, S., Gomboc, A., et al. 2013, ApJ, 772, 73, doi: 10.1088/0004-637X/772/1/73
- Kumar & Panaitescu (2003) Kumar, P., & Panaitescu, A. 2003, MNRAS, 346, 905, doi: 10.1111/j.1365-2966.2003.07138.x
- Levesque et al. (2010) Levesque, E. M., Berger, E., Kewley, L. J., et al. 2010, AJ, 139, 694. doi: 10.1088/0004-6256/139/2/694
- Liang et al. (2004) Liang, E. W., Dai, Z. G., & Wu, X. F. 2004, ApJ, 606, L29, doi: 10.1086/421047
- Liang et al. (2006) Liang, E. W., Zhang, B., O’Brien, P. T., et al. 2006, ApJ, 646, 351. doi: 10.1086/504684
- Liang et al. (2015) Liang, E.-W., Lin, T.-T., Lü, J., et al. 2015, ApJ, 813, 116, doi: 10.1088/0004-637X/813/2/116
- Liang et al. (2010) Liang, E.-W., Yi, S.-X., Zhang, J., et al. 2010, ApJ, 725, 2209, doi: 10.1088/0004-637X/725/2/2209
- Liang et al. (2013) Liang, E.-W., Li, L., Gao, H., et al. 2013, ApJ, 774, 13, doi: 10.1088/0004-637X/774/1/13
- Lithwick & Sari (2001) Lithwick, Y., & Sari, R. 2001, ApJ, 555, 540, doi: 10.1086/321455
- Lü et al. (2012) Lü, J., Zou, Y.-C., Lei, W.-H., et al. 2012, ApJ, 751, 49, doi: 10.1088/0004-637X/751/1/49
- MacLachlan et al. (2013) MacLachlan, G. A., Shenoy, A., Sonbas, E., et al. 2013, MNRAS, 432, 857, doi: 10.1093/mnras/stt241
- Malacaria et al. (2021) Malacaria, C., Fletcher, C., Meegan, C., & Fermi GBM Team. 2021, GRB Coordinates Network, 29246, 1
- Mangano et al. (2009) Mangano, V., La Parola, V., & Sbarufatti, B. 2009, GRB Coordinates Network, 8767, 1
- Massey & Johnson (1998) Massey, P., & Johnson, O. 1998, ApJ, 505, 793, doi: 10.1086/306199
- Melandri et al. (2010) Melandri, A., Kobayashi, S., Mundell, C. G., et al. 2010, ApJ, 723, 1331, doi: 10.1088/0004-637X/723/2/1331
- Mészáros & Rees (1999) Mészáros, P., & Rees, M. J. 1999, MNRAS, 306, L39, doi: 10.1046/j.1365-8711.1999.02800.x
- Mészáros et al. (1998) Mészáros, P., Rees, M. J., & Wijers, R. A. M. J. 1998, ApJ, 499, 301, doi: 10.1086/305635
- Mimica et al. (2009) Mimica, P., Giannios, D., & Aloy, M. A. 2009, A&A, 494, 879, doi: 10.1051/0004-6361:200810756
- Mizuno et al. (2009) Mizuno, Y., Zhang, B., Giacomazzo, B., et al. 2009, ApJ, 690, L47, doi: 10.1088/0004-637X/690/1/L47
- Mundell et al. (2007) Mundell, C. G., Steele, I. A., Smith, R. J., et al. 2007, Science, 315, 1822, doi: 10.1126/science.1138484
- Panaitescu et al. (2001) Panaitescu, A., Kumar, P., & Narayan, R. 2001, ApJ, 561, L171, doi: 10.1086/324678
- Panaitescu et al. (1998) Panaitescu, A., Mészáros, P., & Rees, M. J. 1998, ApJ, 503, 314, doi: 10.1086/305995
- Pei (1992) Pei, Y. C. 1992, ApJ, 395, 130, doi: 10.1086/171637
- Perna & Belczynski (2002) Perna, R., & Belczynski, K. 2002, ApJ, 570, 252, doi: 10.1086/339571
- Planck Collaboration et al. (2016) Planck Collaboration, Ade, P. A. R., Aghanim, N., et al. 2016, A&A, 594, A13, doi: 10.1051/0004-6361/201525830
- Racusin et al. (2008) Racusin, J. L., Karpov, S. V., Sokolowski, M., et al. 2008, Nature, 455, 183, doi: 10.1038/nature07270
- Ren et al. (2020) Ren, J., Lin, D.-B., Zhang, L.-L., et al. 2020, ApJ, 901, L26, doi: 10.3847/2041-8213/abb672
- Resmi & Zhang (2016) Resmi, L., & Zhang, B. 2016, ApJ, 825, 48, doi: 10.3847/0004-637X/825/1/48
- Sari & Piran (1999a) Sari, R., & Piran, T. 1999a, ApJ, 520, 641, doi: 10.1086/307508
- Sari & Piran (1999b) —. 1999b, ApJ, 517, L109, doi: 10.1086/312039
- Sari et al. (1998) Sari, R., Piran, T., & Narayan, R. 1998, ApJ, 497, L17, doi: 10.1086/311269
- Schlafly & Finkbeiner (2011) Schlafly, E., & Finkbeiner, D. P. 2011, ApJ, 737, 103 doi: 10.1088/0004-637X/737/2/103
- Schlegel et al. (1998) Schlegel, D. J., Finkbeiner, D. P., & Davis, M. 1998, ApJ, 500, 525, doi: 10.1086/305772
- Tody (1986) Tody, D. 1986, in Society of Photo-Optical Instrumentation Engineers (SPIE) Conference Series, Vol. 627, Instrumentation in astronomy VI, ed. D. L. Crawford, 733, doi: 10.1117/12.968154
- Tody & Davis (1992) Tody, D., & Davis, L. E. 1992, in Astronomical Society of the Pacific Conference Series, Vol. 25, Astronomical Data Analysis Software and Systems I, ed. D. M. Worrall, C. Biemesderfer, & J. Barnes, 484
- Troja et al. (2021) Troja, E., Bernardini, M. G., Breeveld, A. A., et al. 2021, GRB Coordinates Network, 29233, 1
- Ukwatta et al. (2010) Ukwatta, T. N., Stamatikos, M., Dhuga, K. S., et al. 2010, ApJ, 711, 1073, doi: 10.1088/0004-637X/711/2/1073
- Vestrand et al. (2014) Vestrand, W. T., Wren, J. A., Panaitescu, A., et al. 2014, Science, 343, 38, doi: 10.1126/science.1242316
- Wang et al. (2015) Wang, X.-G., Zhang, B., Liang, E.-W., et al. 2015, ApJS, 219, 9, doi: 10.1088/0067-0049/219/1/9
- Wei (2003) Wei, D. M. 2003, A&A, 402, L9, doi: 10.1051/0004-6361:20030371
- Xin et al. (2011) Xin, L.-P., Liang, E.-W., Wei, J.-Y., et al. 2011, MNRAS, 410, 27. doi: 10.1111/j.1365-2966.2010.17419.x
- Xin et al. (2021) Xin, L. P., Wang, J., Han, X. H., et al. 2021, GRB Coordinates Network, 29235, 1
- Yi et al. (2013) Yi, S.-X., Wu, X.-F., & Dai, Z.-G. 2013, ApJ, 776, 120, doi: 10.1088/0004-637X/776/2/120
- Yi et al. (2020) Yi, S.-X., Wu, X.-F., Zou, Y.-C., & Dai, Z.-G. 2020, ApJ, 895, 94, doi: 10.3847/1538-4357/ab8a53
- Yost et al. (2003) Yost, S. A., Harrison, F. A., Sari, R., & Frail, D. A. 2003, ApJ, 597, 459, doi: 10.1086/378288
- Zhang et al. (2006) Zhang, B., Fan, Y. Z., Dyks, J., et al. 2006, ApJ, 642, 354, doi: 10.1086/500723
- Zhang et al. (2021) Zhang, L.-L., Ren, J., Huang, X.-L., et al. 2021, ApJ, 917, 95. doi: 10.3847/1538-4357/ac0c7f
- Zhang & Kobayashi (2005) Zhang, B., & Kobayashi, S. 2005, ApJ, 628, 315, doi: 10.1086/429787
- Zhang et al. (2003) Zhang, B., Kobayashi, S., & Mészáros, P. 2003, ApJ, 595, 950, doi: 10.1086/377363
- Zhang et al. (2007) Zhang, B., Liang, E., Page, K. L., et al. 2007, ApJ, 655, 989, doi: 10.1086/510110
- Zheng et al. (2008) Zheng, W.-K., Deng, J.-S., Zhai, M., et al. 2008, Chinese J. Astron. Astrophys., 8, 693, doi: 10.1088/1009-9271/8/6/08
- Zhu et al. (2021) Zhu, Z. P., Fu, S. Y., Liu, X., et al. 2021, GRB Coordinates Network, 29252, 1
| (mid,sec) | Exposure (sec) | Mag | Merr | Filter | Telescope |
|---|---|---|---|---|---|
| 67 | 10 | 14.14 | 0.03 | F60A | |
| 79 | 10 | 14.08 | 0.02 | F60A | |
| 91 | 10 | 13.93 | 0.03 | F60A | |
| 103 | 10 | 13.78 | 0.02 | F60A | |
| 116 | 10 | 13.89 | 0.02 | F60A | |
| 128 | 10 | 13.92 | 0.03 | F60A | |
| 140 | 10 | 14.01 | 0.03 | F60A | |
| 152 | 10 | 14.00 | 0.03 | F60A | |
| 656 | 50 | 16.02 | 0.03 | F60A | |
| 708 | 50 | 16.14 | 0.05 | F60A | |
| 760 | 50 | 16.25 | 0.04 | F60A | |
| 813 | 50 | 16.22 | 0.04 | F60A | |
| 865 | 50 | 16.28 | 0.04 | F60A | |
| 917 | 50 | 16.35 | 0.05 | F60A | |
| 969 | 50 | 16.50 | 0.05 | F60A | |
| 1021 | 50 | 16.46 | 0.05 | F60A | |
| 1073 | 50 | 16.48 | 0.06 | F60A | |
| 1125 | 50 | 16.46 | 0.08 | F60A | |
| 1950 | 100 | 17.04 | 0.04 | F60A | |
| 2053 | 100 | 17.07 | 0.04 | F60A | |
| 2155 | 100 | 17.12 | 0.05 | F60A | |
| 2257 | 100 | 17.09 | 0.04 | F60A | |
| 2359 | 100 | 17.27 | 0.05 | F60A | |
| 2461 | 100 | 17.23 | 0.05 | F60A | |
| 2681 | 100 | 17.27 | 0.05 | F60A | |
| 2783 | 100 | 17.35 | 0.06 | F60A | |
| 2885 | 100 | 17.29 | 0.06 | F60A | |
| 3127 | 100 | 17.35 | 0.05 | F60A | |
| 3229 | 100 | 17.47 | 0.06 | F60A | |
| 3331 | 100 | 17.46 | 0.06 | F60A | |
| 3433 | 100 | 17.50 | 0.05 | F60A | |
| 3638 | 100 | 17.36 | 0.05 | F60A | |
| 3740 | 100 | 17.44 | 0.06 | F60A | |
| 6047 | 150 | 18.01 | 0.09 | F60A | |
| 6199 | 150 | 17.88 | 0.07 | F60A | |
| 6351 | 150 | 17.84 | 0.07 | F60A | |
| 6504 | 150 | 17.90 | 0.08 | F60A | |
| 6656 | 150 | 17.95 | 0.08 | F60A | |
| 6938 | 150 | 18.16 | 0.09 | F60A | |
| 7091 | 150 | 18.16 | 0.10 | F60A | |
| 7243 | 150 | 18.01 | 0.08 | F60A | |
| 7395 | 150 | 18.20 | 0.10 | F60A | |
| 7547 | 150 | 18.02 | 0.09 | F60A | |
| 7699 | 150 | 18.02 | 0.09 | F60A | |
| 7851 | 150 | 18.11 | 0.09 | F60A | |
| 8003 | 150 | 18.15 | 0.10 | F60A | |
| 8156 | 150 | 17.99 | 0.08 | F60A | |
| 8308 | 150 | 18.26 | 0.10 | F60A | |
| 9316 | 150 | 18.30 | 0.10 | F60A | |
| 9468 | 150 | 18.14 | 0.10 | F60A | |
| 9620 | 150 | 18.22 | 0.10 | F60A | |
| 9772 | 150 | 18.41 | 0.13 | F60A | |
| 9924 | 150 | 18.28 | 0.10 | F60A | |
| 11240 | 150 | 18.55 | 0.16 | F60A | |
| 11392 | 150 | 18.55 | 0.14 | F60A | |
| 11545 | 150 | 18.63 | 0.17 | F60A | |
| 11697 | 150 | 18.70 | 0.18 | F60A | |
| 11849 | 150 | 18.87 | 0.24 | F60A | |
| 12070 | 250 | 18.68 | 0.16 | F60A | |
| 12322 | 250 | 18.39 | 0.12 | F60A | |
| 12574 | 250 | 18.46 | 0.13 | F60A | |
| 12849 | 250 | 18.38 | 0.11 | F60A | |
| 13102 | 250 | 18.88 | 0.17 | F60A | |
| 13354 | 250 | 18.70 | 0.15 | F60A | |
| 17026 | 300 | 19.14 | 0.20 | F60A | |
| 17328 | 300 | 18.71 | 0.14 | F60A | |
| 17630 | 300 | 18.86 | 0.17 | F60A | |
| 18235 | 300 | 19.10 | 0.24 | F60A | |
| 12451 | 200 | 18.56 | 0.10 | TNT | |
| 14037 | 300 | 18.82 | 0.10 | TNT | |
| 14353 | 300 | 18.81 | 0.11 | TNT | |
| 16588 | 300 | 19.00 | 0.11 | TNT | |
| 16905 | 300 | 18.94 | 0.11 | TNT | |
| 19600 | 1200 | 18.96 | 0.07 | TNT | |
| 24704 | 1200 | 19.04 | 0.08 | TNT | |
| 237 | 30 | 14.15 | 0.02 | F60A | |
| 269 | 30 | 14.39 | 0.03 | F60A | |
| 301 | 30 | 14.56 | 0.09 | F60A | |
| 334 | 30 | 14.69 | 0.04 | F60A | |
| 366 | 30 | 14.91 | 0.09 | F60A | |
| 398 | 30 | 14.94 | 0.04 | I | F60A |
| 430 | 30 | 15.04 | 0.06 | I | F60A |
| 462 | 30 | 15.20 | 0.05 | F60A | |
| 494 | 30 | 15.26 | 0.07 | F60A | |
| 526 | 30 | 15.42 | 0.10 | F60A | |
| 1238 | 60 | 16.25 | 0.10 | F60A | |
| 1300 | 60 | 16.22 | 0.08 | F60A | |
| 1362 | 60 | 16.23 | 0.07 | F60A | |
| 1424 | 60 | 16.32 | 0.09 | F60A | |
| 1486 | 60 | 16.42 | 0.10 | F60A | |
| 1549 | 60 | 16.45 | 0.10 | F60A | |
| 1611 | 60 | 16.25 | 0.07 | F60A | |
| 1673 | 60 | 16.42 | 0.09 | F60A | |
| 1735 | 60 | 16.56 | 0.09 | F60A | |
| 1797 | 60 | 16.39 | 0.08 | F60A | |
| 3844 | 100 | 16.95 | 0.09 | F60A | |
| 3946 | 100 | 16.86 | 0.08 | F60A | |
| 4048 | 100 | 17.14 | 0.11 | F60A | |
| 4150 | 100 | 17.13 | 0.11 | F60A | |
| 4355 | 100 | 17.16 | 0.10 | F60A | |
| 4457 | 100 | 17.20 | 0.11 | F60A | |
| 4559 | 100 | 17.20 | 0.10 | F60A | |
| 4661 | 100 | 17.53 | 0.17 | F60A | |
| 4865 | 100 | 17.02 | 0.08 | F60A | |
| 5587 | 60 | 17.20 | 0.15 | F60A | |
| 5649 | 60 | 17.39 | 0.17 | F60A | |
| 5711 | 60 | 17.39 | 0.18 | F60A | |
| 5773 | 60 | 17.31 | 0.17 | F60A | |
| 5835 | 60 | 17.00 | 0.13 | F60A | |
| 8966 | 150 | 17.83 | 0.16 | F60A | |
| 9118 | 150 | 17.73 | 0.12 | F60A | |
| 10798 | 200 | 17.94 | 0.15 | F60A | |
| 11001 | 200 | 17.82 | 0.14 | F60A | |
| 13332 | 200 | 18.38 | 0.13 | TNT | |
| 13549 | 200 | 18.48 | 0.13 | TNT | |
| 13766 | 200 | 18.28 | 0.12 | TNT | |
| 15633 | 300 | 18.39 | 0.10 | TNT | |
| 15950 | 300 | 18.37 | 0.11 | TNT | |
| 16267 | 300 | 18.59 | 0.13 | TNT | |
| 5305 | 500 | 18.72 | 0.09 | F60A | |
| 9047 | 1000 | 19.31 | 0.08 | F60A | |
| 11246 | 200 | 19.91 | 0.17 | TNT | |
| 11463 | 200 | 19.83 | 0.15 | TNT | |
| 11794 | 200 | 19.73 | 0.17 | TNT | |
| 12011 | 200 | 20.03 | 0.22 | TNT | |
| 12529 | 800 | 19.83 | 0.08 | TNT | |
| 14975 | 900 | 20.04 | 0.10 | TNT | |
| 17527 | 900 | 20.16 | 0.13 | TNT | |
| 20079 | 900 | 20.45 | 0.20 | TNT | |
| 23230 | 1800 | 20.64 | 0.16 | TNT | |
| 28932 | 2100 | 20.80 | 0.23 | TNT | |
| 2678 | … | 17.20 | 0.04 | NEXT | |
| 2902 | … | 17.35 | 0.03 | NEXT | |
| 3128 | … | 17.36 | 0.04 | NEXT | |
| 3351 | … | 17.45 | 0.04 | NEXT | |
| 3572 | … | 17.49 | 0.04 | NEXT | |
| 3794 | … | 17.59 | 0.03 | NEXT | |
| 4019 | … | 17.62 | 0.04 | NEXT | |
| 4243 | … | 17.54 | 0.05 | NEXT | |
| 4465 | … | 17.61 | 0.04 | NEXT | |
| 4692 | … | 17.72 | 0.04 | NEXT | |
| 4923 | … | 17.76 | 0.03 | NEXT | |
| 5146 | … | 17.73 | 0.04 | NEXT | |
| 5367 | … | 17.63 | 0.04 | NEXT | |
| 5591 | … | 17.94 | 0.04 | NEXT | |
| 5815 | … | 17.81 | 0.04 | NEXT | |
| 6039 | … | 17.87 | 0.05 | NEXT | |
| 6261 | … | 17.81 | 0.05 | NEXT | |
| 6484 | … | 17.87 | 0.04 | NEXT | |
| 6707 | … | 17.96 | 0.04 | NEXT | |
| 6929 | … | 17.95 | 0.05 | NEXT | |
| 7272 | … | 18.17 | 0.04 | NEXT | |
| 7594 | … | 17.96 | 0.05 | NEXT | |
| 7918 | … | 18.06 | 0.04 | NEXT | |
| 8241 | … | 18.15 | 0.05 | NEXT | |
| 8563 | … | 18.16 | 0.05 | NEXT | |
| 8885 | … | 18.22 | 0.05 | NEXT | |
| 9209 | … | 18.30 | 0.05 | NEXT | |
| 9532 | … | 18.24 | 0.05 | NEXT | |
| 9854 | … | 18.27 | 0.05 | NEXT | |
| 10843 | … | 18.30 | 0.05 | NEXT | |
| 11170 | … | 18.44 | 0.05 | NEXT | |
| 11493 | … | 18.51 | 0.05 | NEXT | |
| 11816 | … | 18.58 | 0.05 | NEXT | |
| 12140 | … | 18.61 | 0.05 | NEXT | |
| 12463 | … | 18.44 | 0.05 | NEXT | |
| 12786 | … | 18.42 | 0.05 | NEXT | |
| 38520 | … | 19.52 | 0.07 | NEXT |
| GRBs | References aaReferences for and : (1) Briggs et al. (1999), Guidorzi et al. (2005); (2) Kumar & Panaitescu (2003), Wei (2003); (3) Bellm et al. (2006); (4) Racusin et al. (2008); (5) Golenetskii et al. (2009); (6) Ukwatta et al. (2010), Jin et al. (2013); (7) Huang et al. (2020). | ||||||||
|---|---|---|---|---|---|---|---|---|---|
| () | () | (keV) | () | ||||||
| 210104A | |||||||||
| 990123 | |||||||||
| 021211 | |||||||||
| 061126 | |||||||||
| 080319B | |||||||||
| 090102 | |||||||||
| 090424 | |||||||||
| 130427A |