JWST and ALMA Multiple-Line Study in and around a Galaxy at :
Optical to FIR Line Ratios and the Onset of an Outflow Promoting Ionizing Photon Escape
Abstract
We present ALMA deep spectroscopy for a lensed galaxy at with whose optical nebular lines and stellar continuum are detected by JWST/NIRSpec and NIRCam Early Release Observations in SMACS0723. Our ALMA spectrum shows [O iii]88 m and [C ii]158 m line detections at and , respectively. The redshift and position of the [O iii] line coincide with those of the JWST source, while the [C ii] line is blue-shifted by 90 km s-1 with a spatial offset of ( kpc in source plane) from the centroid of the JWST source. The NIRCam F444W image, including [O iii]5007 and H line emission, spatially extends beyond the stellar components by a factor of . This indicates that the galaxy has already experienced strong outflows as traced by extended [O iii]5007 and offset [C ii] emission, which would promote ionizing photon escape and facilitate reionization. With careful slit-loss corrections and removals of emission spatially outside the galaxy, we evaluate the [O iii]88m/5007 line ratio, and derive the electron density by photoionization modeling to be cm-3, which is comparable with those of –3 galaxies. We estimate an [O iii]88m/[C ii]158m line ratio in the galaxy of , as high as those of known 6–9 galaxies. This high [O iii]88 m/[C ii]158 m line ratio is generally explained by the high as well as the low metallicity (), high ionization parameter (), and low carbon-to-oxygen abundance ratio ((C/O) ) obtained from the JWST/NIRSpec data; further [C ii] follow-up observations will constrain the covering fraction of photodissociation regions.
1 Introduction
Studying early systems in the Epoch of Reionization (EoR; ) is key to understanding fundamental cosmological questions such as the development of large-scale structure, the processes of cosmic reionization, and the first galaxy formation in the universe. In the last decades, deep Hubble Space Telescope (HST) surveys provided thousands of EoR galaxies and initial characterization of their stellar component, in terms of un-obscured star formation and sizes in the rest-frame ultra-violet (UV) wavelengths (e.g., Ellis et al. 2013; Bouwens et al. 2015; Finkelstein et al. 2015; Oesch et al. 2016).
The Atacama Large Millimeter/submillimeter Array (ALMA) offers a unique rest-frame far-infrared (FIR) window on EoR galaxies to characterize the dust and gas properties of their interstellar media (ISMs), where the major cooling lines (e.g., [C ii] 158m, [O iii] 88m) and underlying dust continuum are probes of key mechanisms in the ISM such as disk rotation (e.g., Smit et al. 2018; Rizzo et al. 2020), gravitational instability (e.g., Tadaki et al. 2018), formation of the bulge, disk, and spiral arms (e.g., Tsukui & Iguchi 2021; Lelli et al. 2021), galaxy mergers (e.g., Le Fèvre et al. 2020), outflows (e.g., Spilker et al. 2018), and dust-obscured star-forming activities (e.g., Bowler et al. 2022; Inami et al. 2022), which strongly complements rest-UV studies with HST. Since elements produced in stars are returned to the ISM, the metal gas properties traced by the fine-structure lines, with their different ionization potentials and critical densities, provide powerful probes on the star-formation history and related physical conditions of the ISM, such as the temperature, density, ionization, and metal enrichment (e.g., Maiolino & Mannucci 2019).
Previous ALMA observations have also raised questions about what causes large diversity in EoR galaxies and the difference from local galaxies. Early deep ALMA [C ii] spectroscopy of some EoR galaxies has shown low /SFR values (e.g., Ota et al. 2014; Knudsen et al. 2016), suggesting that they have characteristic ISM conditions such as high ionization parameter, low metallicity, or low gas density (e.g., Ferrara et al. 2019). However, recent ALMA observations detected dust continuum (e.g., Watson et al. 2015; Inami et al. 2022) and bright [C ii] lines (e.g., Bouwens et al. 2022), pointing to a /SFR relation similar to that of local main-sequence galaxies (e.g., Schaerer et al. 2020) and even low-mass sub- galaxies at (e.g., Fujimoto et al. 2021; Molyneux et al. 2022). Moreover, while ALMA observations of EoR galaxies have also shown high / ratios (e.g., Inoue et al. 2016; Harikane et al. 2020; Carniani et al. 2020; Witstok et al. 2022) that are comparable or even higher than local dwarf galaxies (e.g., Cormier et al. 2015), the main driver for the high ratios is still under debate (e.g., Harikane et al. 2020; Vallini et al. 2021; Katz et al. 2022; Witstok et al. 2022). While promising, past HST and ALMA results have yet to provide a clear picture of the ISM physics in EoR galaxies.
To understand ISM physics, one of the key quantities is the gas-phase metallicity (), which is a direct probe of chemical enrichment and, thus, the evolutionary stage of galaxies. The flux of each metal line is determined by the abundance of that element and its emissivity (Aller 1984). Therefore, we can accurately estimate the abundance once we measure the emissivity based on the electron temperature , i.e., the so-called direct method (e.g., Pilyugin & Thuan 2005; Andrews & Martini 2013). However, since the direct method requires the detection of very faint auroral lines (e.g., [O iii]4363), this has until recently only been possible for a handful of sources up to (e.g., Christensen et al. 2012; Kojima et al. 2017; Sanders et al. 2020).
Our observational landscape has been revolutionized by the advent of JWST. As part of the Early Release observation (ERO) programs of JWST, deep NIRSpec multi shutter array (MSA) observations have been performed towards the massive lensing cluster SMACSJ0723, successfully detecting multiple nebular emission lines in the rest-frame UV to optical wavelengths and determining spectroscopic redshifts for distant lensed galaxies out to (e.g., Carnall et al. 2023; Schaerer et al. 2022; Trump et al. 2022; Curti et al. 2022). Remarkably, the deep NIRSpec spectra also show the detection of the auroral line [O iii]4363, enabling the first direct temperature method estimates at such high redshifts (e.g., Schaerer et al. 2022; Trump et al. 2022; Curti et al. 2022). With the powerful JWST and ALMA combination, we are finally in a position to fully reveal how the elements of galaxies – gas, stellar, and dust – interplay with each other and what governs the growth of galaxies in the infant Universe.
In this paper, we present ALMA deep follow-up of two major coolant lines, [C ii] 158m and [O iii] 88m, and underlying continuum for the lensed galaxy at , whose warm ISM properties are best characterized by the latest deep JWST observations, including the [O iii]4363 line. This is the first FIR characterization of an EoR galaxy with a robust metallicity measurement via the direct method, setting the benchmark to understand and interpret previous results from ALMA EoR galaxy studies over the last decade and providing a timely, unique reference for future follow-up of EoR galaxies in the coming decade.
The structure of this paper is as follows. In Section 2, we describe the observations and the data processing of both JWST and ALMA. Section 3 outlines the analyses related to the mass model for the lensing cluster, measurements of flux, size, and morphology, and the optical–mm SED fitting. In Section 4, we present the results from the multiple-line studies and discuss the physical origins of these results. A summary of this study is presented in Section 5. Throughout this paper, we assume a flat universe with 0.3, 0.7, 70 km s-1 Mpc-1, and the Chabrier initial mass function (IMF; Chabrier 2003). We adopt an angular scale of kpc for the target redshift at . We take the cosmic microwave background (CMB) effect into account and correct the flux measurements at submm and mm bands, following the recipe presented by da Cunha et al. (2013) (see also e.g., Pallottini et al. 2015; Zhang et al. 2016; Lagache et al. 2018).
2 Observations & Data Processing
| Target line | Band | Obs Date | Baseline | PWV | beam | |||||
| (m) | (YYYY-MM-DD) | (m) | (min) | (mm) | () | (Jy/beam) | (Jy/beam) | |||
| (1) | (2) | (3) | (4) | (5) | (6) | (7) | (8) | (9) | (10) | (11) |
| [C ii] 158 m | 5 | 1540 | 2022-10-17 | 15.1–629.3 (C3) | 44 | 85.7 | 0.5 | 225 | 11.6 | |
| [O iii] 88 m | 7 | 854 | 2022-10-14 | 15.1–629.3 (C3) | 44 | 99.8 | 0.4 | 420 | 20.9 |
2.1 SMACS J0723.3-7327
The target field, SMACS J0723.3-7327 (hereafter SM0723), is a massive galaxy cluster at (, ), initially discovered via the Sunyaev-Zel’dovich effect in the Planck survey (Planck Collaboration et al. 2011). The galaxy cluster mass is estimated to be . SM0723 was observed as part of the HST Reionization Lensing Cluster Survey (RELICS, #GO-14096, PI: D. Coe, Coe et al. 2019) treasury program and the subsequent Spitzer S-RELICS program (#12005, PI: M. Bradac).
2.2 ALMA
ALMA Band 5 and Band 7 follow-up observations of [C ii] and [O iii] spectroscopy were carried out on October 17th and 14th 2022, respectively, as a Cycle 8 DDT program (#2022.A.00022.S, PI: S. Fujimoto). The target was a strongly lensed star-forming galaxy, ID4590, spectroscopically confirmed at with the robust detection of rest-frame optical emission lines including the [O iii]4363 line (e.g., Carnall et al. 2023; Schaerer et al. 2022; Trump et al. 2022; Curti et al. 2022). Both observations used the Frequency Division Mode, and baseline ranges 15–457 m in the C-3 configuration. The mean precipitable water vapour (PWV) was 0.5 mm and 0.4 mm, and the on-source integration times were 85.7 mins and 99.8 mins in Band 5 and Band 7, respectively. J0519-4546 was observed as a flux and bandpass calibrator in both observations, while the phase calibration was performed with J0601-7036 and J0635-7516 in Band 5 and Band 7 observations, respectively.
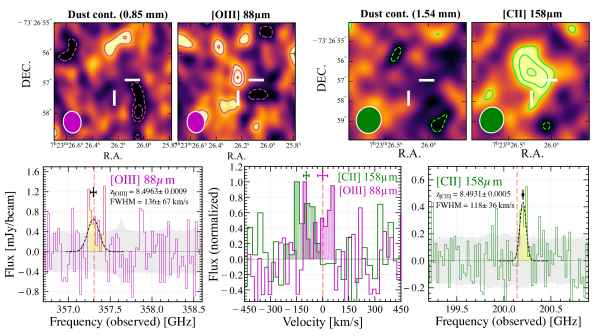
The ALMA data were reduced and calibrated with the Common Astronomy Software Applications package version 6.4.1.12 (CASA; THE CASA TEAM et al. 2022) with the pipeline script in the standard manner. We imaged the calibrated visibilities using natural weighting, a pixel scale of , and a primary beam limit down to 0.2 by running the CASA task tclean. For cubes, we adopted spectral channel bins of 20, 30, and 40 km s-1 and performed the CLEAN algorithm. We confirmed the results unchanged much (10 %) in the following analyses via the choice of the spectral resolutions, and we used 20 km/s resolution cubes in the following analyses. For continuum maps, the tclean routines were executed down to the 1 level with a maximum iteration number of 100,000 in the automask mode (Kepley et al. 2020). We mask the central km s-1 channels to avoid contamination from the [C ii] and [O iii] lines in the continuum map. The natural weighted images, which maximize the S/N, resulted in the full-width-half-maximum (FWHM) size of the synthesized beam of and with sensitivities for the continuum (line in a 20 km s-1 channel) of 11.6 (225) Jy beam-1 and 20.9 (420) Jy beam-1 in Band 5 and Band 7, respectively. Figure 1 shows the reduced continuum maps and the line cubes for both ALMA Band 5 and Band 7. We summarize the data properties of the continuum maps and the line cubes in Table 1.
2.3 JWST
As part of the JWST ERO (#ERO-2736; Pontoppidan et al. 2022), SM0723 was observed with JWST/NIRCam, NIRSpec, MIRI, and NIRISS in June 2022. In the NIRCam and MIRI observations, six (F090W, F150W, F200W, F277W, F356W, F444W) and four (F770W, F1000W, F1500W, F1800W) different filters were used with 7540 sec and 5600 sec exposure per filter, reaching 5 limiting magnitudes of 29.4–30.0 AB and 23–26.3 AB, respectively (Pontoppidan et al. 2022).
For NIRCam and MIRI, we use publicly available reduced and calibrated imaging products via the grizli pipeline.111 https://s3.amazonaws.com/grizli-v2/JwstMosaics/v4/index.html The detailed calibration and reduction procedures will be presented in Brammer et al. (in prep.) (see also, e.g., Bradley et al. 2022; Fujimoto et al. 2023). Briefly, the JWST pipeline calibrated level-2 NIRCam imaging products were retrieved and processed with the grizli pipeline (Brammer & Matharu 2021; Brammer 2023), where the photometric zero-point correction was applied, including other corrections for “snowballs”222 https://jwst-docs.stsci.edu/data-artifacts-and-features/snowballs-artifact, “wisps”333 https://jwst-docs.stsci.edu/jwst-near-infrared-camera/nircam-features-and-caveats/nircam-claws-and-wisps, and detector variations.444 https://github.com/gbrammer/grizli/pull/107 We include a systematic error of 10% on the observed flux values in the following analyses as a conservative measure in the same manner as other recent NIRCam studies (e.g., Naidu et al. 2022; Finkelstein et al. 2023), while the derived photometric zeropoints are consistent with those derived by other teams for JWST ERS programs (Boyer et al. 2022; Nardiello et al. 2022). The fully-calibrated images in each filter were aligned with the GAIA DR3 catalog (Gaia Collaboration et al. 2021), co-added, and drizzled at a 20 mas and 40 mas pixel scale for the short-wavelength (SW: F090W, F150W, F200W) and long-wavelength (LW: F277W, F356W, F444W) NIRCam band images, respectively. For the produced maps, we also additionally correct the proper motion effects of the GAIA sources. In the Appendix, we show the residual astrometric offsets of the GAIA sources. We confirm the residual astrometric offset with respect to the GAIA DR3 frame is close to zero with the uncertainty of 10–20 mas. All the MIRI images (F770W, F1000W, F1500W, F1800W) are aligned, co-added, and drizzled at 40 mas pixel scale in the same manner. Existing multi-wavelength WFC3 archival imaging from HST was also processed with grizli, being aligned, co-added, and drizzled at 40 mas pixel scale in the same manner (see also Kokorev et al. 2022). We include all MIRI and HST/F105W, F125W, F140W, and F160W data in our analysis. Given the existence of nearby objects (Section 3.4), we adopt -diameter aperture photometry which is corrected to the total flux measurement by MAG_AUTO. We also correct for the Galactic dust reddening in the target direction. The JWST and HST photometry used in this paper are summarized in the Appendix.
For NIRSpec, there are several studies applying the latest reduction and calibration (Heintz et al. 2023; Nakajima et al. 2023), compared to previous studies (e.g., Schaerer et al. 2022; Curti et al. 2022; Trump et al. 2022; Brinchmann 2022; Arellano-Córdova et al. 2022). In our paper, we use results from Nakajima et al. (2023) due to requirements of specific parameter sets for the photoionization model analysis in Section 4.5 that are self-consistently derived in Nakajima et al. (2023). We confirm that the measurements and the derived physical parameters are generally consistent with the previous studies within the errors (e.g., Schaerer et al. 2022; Curti et al. 2022; Trump et al. 2022; Brinchmann 2022; Arellano-Córdova et al. 2022) as well as the similarly latest calibration and reduction efforts presented in Heintz et al. (2023). Briefly, the NIRSpec 1D spectra are re-created by using four of the six exposures after removing one with no signal and another with a noisy 2D spectrum around H+[O iii]. Some improvements are also implemented, including the background residual subtractions, hot pixel removals, optimal 1D extractions, as well as flux calibrations by referring to the standard star observations taken during commissioning. Using the improved NIRSpec spectrum, Nakajima et al. confirm the rest-frame UV and optical emission line detection at from ID4590, including [O iii], [O iii], H, H, H, and C iii], and evaluate their relative line fluxes after applying a slit-loss correction555 The slit-loss is corrected by convolving and integrating the 1D spectrum with the filter response of F444W to match it with the total magnitude of the NIRCam photometry, which is derived with a -diameter circular aperture and the corresponding aperture correction. . On the other hand, Nakajima et al. find that the [O ii]3727 doublet is not clearly detected in every nod and visit, and they place a conservative 3 upper limit, which provides a lower limit for the ionization parameter (U) based on Kewley & Dopita (2002). The electron temperature and the gas-phase oxygen abundance are estimated to be K and 12+(O/H) = (equal to by assuming the solar metallicity of 12+(O/H)=8.69) via the direct method (e.g., Pilyugin et al. 2012) by assuming a negligible contribution from O+/H+ ( dex at ; Nakajima et al. 2023). The lower and upper boundaries of the C/O abundance are also estimated to be (C/O) = (Isobe et al. 2023b). These physical parameters are derived including the dust correction based on the best-fit value in this paper (Section 3.6).
| Target line | [O iii]88m | [C ii]158m |
|---|---|---|
| R.A. | 07:23:26.242 | 07:23:26.243 |
| Dec. | :26:56.824 | :26:56.514 |
| S/Nline | 4.0 | 4.5 |
| Frequency center [GHz] | ||
| Line width [km s-1] | 118 36 | |
| Line intensity [Jy km s-1] | ||
| Line luminosity [] | ||
| Continuum [Jy] | (0.85 mm) | (1.54 mm) |
We add a possible uncertainty by 20% due to the velocity-integration range for the [O iii] line (see text).
Given the spatial and velocity offsets of the [C ii] line, we place a 3 upper limit of at the galaxy position from the residual map of imfit.
3 Data analysis
3.1 Mass Model
Several mass models are publicly available in SM0723, including those developed by using Lenstool (Jullo et al. 2007) and Glafic (Oguri 2010) with the HST data from the RELICS team (Coe et al. 2019)666 https://archive.stsci.edu/prepds/relics/ . More models have been constructed for SM0723 with the JWST ERO data, using Lenstool (Mahler et al. 2022; Caminha et al. 2022), the light-traces-mass approach (LTM; Broadhurst et al. 2005; Zitrin et al. 2009, 2015) presented in Pascale et al. (2022), and an updated version of Glafic (Oguri 2021) presented in Harikane et al. (2022).
In this paper, we use the latest Glafic model. The magnification factor for ID4590 is estimated to be , which is consistent with the latest Lenstool model prediction () based on the JWST ERO and the latest MUSE data (Caminha et al. 2022). We define the systematic uncertainty due to the choice of the mass model by
| (1) |
where and indicate the magnification factor evaluated by the updated version of Glafic and other models, respectively. Among the mass models constructed with the JWST ERO data, the value is estimated to be 15–30% for ID4590. In the following analyses when we correct for the gravitationally lensing effect on ID4590, we use and add a systematic uncertainty from the mass models of 30%. When correcting physical values for lensing, we do not account for differential magnification in the following analysis, as we confirm it to be much less than the above systematic uncertainty across the positions in the galaxy. However, when we discuss the intrinsic morphology and size (Section 3.3 and 3.4), we do consider the difference between the radial () and tangential () magnifications that are estimated to be and with position angle (PA) in East of North of deg.
3.2 Continuum & Line Measurements
In the top panels of Figure 1, we show the continuum maps of ALMA Band 7 (left) and Band 5 (right). In both bands, we find that the relevant pixels show negative counts. We assume that the emission is unresolved in the continuum maps with the current ALMA beam (–) and place 2 upper limits of 41.8 Jy beam-1 and 23.2 Jy beam-1 in Band 7 and Band 5, respectively, based on the standard deviation of the maps.
In the bottom panels of Figure 1, we also present the line spectra for the [O iii]88m (left) and [C ii]158m lines (right). In the spectra, we identify positive signals in several consecutive channels at around 357.3 GHz and 200.2 GHz in Band 7 and Band 5, respectively, that are both consistent with the expected frequencies of the [O iii]88m and [C ii]158m lines based on the source redshift spectroscopically determined by NIRSpec. In the top panels, we show the velocity-integrated (moment 0) maps by using these line-detected channels that are highlighted by the yellow shades in the bottom spectra. In the moment 0 maps, we find that the S/N in the peak pixel shows 4.0 and 4.1 for the [O iii] and [C ii] lines, respectively. The latter is spatially resolved, especially in the Northwest to Southeast direction, where the S/N increases to 4.5 with a -diameter aperture. On the other hand, [O iii] line is compact and not spatially resolved with the current beam size and data depth. Note that the [O iii] line shows a potential double peak profile, which is typical among rotation-supported systems with inclinations (e.g., Kohandel et al. 2019), while the other possibility is that the noise fluctuation skews the line profile from a single Gaussian. We confirm that removing the three channels around the secondary peak (357.45 GHz) from the integration range for the mom 0 map provides the same peak S/N of 4.0. This suggests that the significance level of the [O iii] line detection is not unchanged regardless of whether it is truly the double peak profile or not.
From a single Gaussian fit in the spectra, we estimate the frequency center and the line redshifts as and with the line width of FWHM km s-1 and FWHM km s-1. The redshift of [O iii]88m is in excellent agreement with the source redshift determined by NIRSpec, while the [C ii] line appears blue-shifted by km s-1 beyond the errors. The line widths are consistent with each other within the errors.
Given a possibility that the chance projection of the noise fluctuation (e.g., Kaasinen et al. 2022) causes the [C ii] velocity offset, we quantify its probability in our [C ii] line identification by running a blind line search algorithm of Findclump implemented in a Python library of Interferopy (Boogaard et al. 2021a) for observational radio–mm interferometry data analysis777 https://interferopy.readthedocs.io/en/latest/index.html . We use a 20-km -1 channel width cube of Band 5 and adopt the spatial tolerance of (= beam size) and the frequency tolerance of 100 MHz (150 km s-1) to match the detection in the cube. We find that line features are identified with similar or higher S/N in the entire data cube within a 20′′-radius circular area and 274 channels, which is equal to 259793 independent beams in the cube. Given that the 200.2 GHz line is identified within the spatial and frequency tolerances from the expectations of the target, we estimate the chance projection of the random noise is 0.07% (= 180 / 259793 1), indicating that the purity of the line detection is . Therefore, we conclude that [C ii] line identification is unlikely explained by the noise fluctuation, and its velocity and spatial offsets are real. The reason for the blue-shifted [C ii] would be differential distributions of the multi-phase gases and their associated kinematics (e.g., Pallottini et al. 2019; Arata et al. 2020; Kohandel et al. 2020; Katz et al. 2022; Akins et al. 2022; Valentino et al. 2022); the rest-frame optical emission lines observed with NIRSpec and the [O iii]88m line originate from the ionized gas, while the [C ii]158m line mostly arises in the photodissociation regions (PDRs). The [C ii] peak position shows a spatial offset from the JWST source position by beyond the uncertainty of its positional accuracy (Section 3.4), which also supports the differential distributions of these multi-phase gases.
With a 2′′-diameter aperture in the moment 0 maps, we measure the line intensities and convert them to the [C ii] line luminosity of in the observed frame (i.e., no lens correction). Given its spatial and velocity offsets, we also place a upper limit at the galaxy position of by taking the line width from [O iii] line. From its compact morphology of [O iii] 88m, we assume that [O iii] is spatially unresolved and infer the [O iii] line luminosity of from the peak pixel count. Note that this [O iii] line flux estimate decreases by if we remove the three channels around the secondary peak from the integration range when generating the moment 0 map. We thus add a systematic uncertainty of 20% for the [O iii] line flux estimate in the following analyses. We summarize these continuum and line properties in Table 2.
3.3 Sizes
We also measure the spatial sizes of [C ii]158m and [O iii]88m lines with ALMA as well as the rest-frame UV and optical continuum with JWST/NIRCam. In both data, we measure the sizes in the image plane.
First, for the [C ii] and [O iii] lines, we perform CASA imfit task to apply the 2D elliptical Gaussian fitting. We do not fix any parameters in the fitting. We obtain the best-fit FWHM of and in the major and minor axis, respectively, for the [C ii] line. Although we cannot exclude the possibility that these best-fit sizes are affected by the noise fluctuation with the current S/N, we confirm that no significant positive/negative signals remain in the residual map. On the other hand, the imfit output suggests that [O iii] is not spatially resolved. We subtract the ALMA synthesized beam profile re-scaled to the [O iii] peak count from the observed [O iii] map and confirm that no significant positive/negative signals remain in the residual map. We thus place a upper limit of FWHM based on the limit of the reliable size measurement with interferometric data according to the data sensitivity and the beam size (Martí-Vidal et al. 2012). The trend of the larger [C ii] line size than that of the [O iii] line is consistent with recent ALMA observation results for galaxies at similar redshifts (Carniani et al. 2020; Akins et al. 2022; Witstok et al. 2022). We list the circularized effective radii 888 The effective radius is almost FWHM / 2.0 in Gaussian. of the [C ii] and [O iii] lines in Table 3. The observed, best-fit model and residual maps are summarized in the Appendix.
Second, for the rest-frame UV and optical continuum, we use the NIRCam/F150W and F356W maps, respectively, that are not affected by strong emission line contributions. We conduct a 2D Sérsic profile fitting with galfit (Peng et al. 2010). The pixel of the F356W map is rebinned to a pixel scale of , which is the same pixel scale as the F150W map. We use NIRCam PSFs for the ERO data of SM0723 publicly available999 https://github.com/gbrammer/grizli-psf-library , which are generated from the WebbPSF model and drizzled to a grid of in the same manner as the mosaic maps in the grizli pipeline. Note that these PSFs are generated with the latest version of WebbPSF, including the correction of the optical path difference101010 https://webbpsf.readthedocs.io/en/latest/jwst_measured_opds.html , where it mitigates the potential difference from the empirical PSFs (e.g., Ono et al. 2022). In the F150W fit for the rest-frame UV continuum, we do not fix any parameters, while we adopt the initial parameter set based on the lensing distortion with the axis ratio of and the PA of deg. We obtain the best-fit effective radius of pixel ( kpc) in the major axis with the axis ratio of . The best-fit axis ratio exceeds the prediction from the lensing distortion (), indicating that ID4590 is well resolved in the radial magnification axis. We also obtain the PA of deg, which is consistent with the lensing distortion (). This supports the strong magnification factor in ID4590 of () and suggests that the observed rest-frame UV morphology is mostly dominated by the lensing distortion. In the F356W fit for the rest-frame optical continuum, we fix the best-fit axis ratio, PA, and Seŕsic index from the F150W results, given the worse spatial resolution than that of F150W. We obtain the best-fit of pixel ( kpc) in the major axis. Given the best-fit axis ratio of , we list the circularized values for these stellar continua also in Table 3. The observed, best-fit model, and residual maps for these NIRCam results are also summarized in the Appendix.
3.4 Morphology
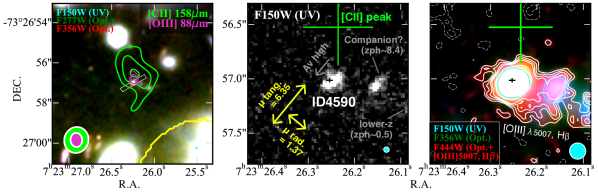
In Figure 2, we compare the spatial distribution of each emission from ID4590. The left panel shows the [C ii]158m and [O iii]88m line contours overlaid on the RGB color image with NIRCam filters. The middle and right panels display zoom-in ( ) F150W image (middle) and RGB color image (right) with NIRCam filters of F150W, F356W, and F444W, where the first two filters trace the rest-frame UV and optical continuum, while the last filter includes the [O iii]5007 and H lines in addition to the underlying rest-frame optical continuum. For the RGB images, the maps are PSF-matched to the F444W filter, and the white and cyan contours in the right panel represent the flux distribution in the F444W and F150W filters, respectively. The green and black crosses indicate the peak position of the [C ii]158m line and the F444W emission, where the bar sizes of the cross are equal to the uncertainty of the positional accuracy based on its beam size and S/N111111 The positional accuracy of ALMA (posacc) can be approximated by the relationship of / SNR / 0.9, where SNR is the signal-to-noise ratio of the image target peak (https://help.almascience.org/kb/articles/what-is-the-absolute-astrometric-accuracy-of-alma). . The yellow arrows in the middle panel denote the radial () and tangential magnifications () to understand the distortion of ID4590 due to the lensing effect. To investigate faint tails of the emission, we additionally subtract the local background in all NIRCam filters by evaluating the median pixel count in a black field near from ID4590.
We find that the peak position of the [O iii]88m is consistent with the JWST source position of ID4590, while the [C ii]158m has an offset of beyond the uncertainty of the positional accuracy. In the source-plane reconstruction of the JWST and [C ii] source positions, we find that the intrinsic offset decreases down to , which is equal to kpc. Because of the significantly low probability of the chance projection of the noise (Section 3.2), the spatial offset in [C ii] indicates that physical origins of the emission is associated with ID4590, while it arises outside the galaxy (e.g., Maiolino et al. 2015; Carniani et al. 2017). We further discuss the physical origins of the [C ii] offset in Section 4.4.
We also find that the emission in the F444W filter is extended more than the rest-frame UV and optical continuum observed in F150W and F356W filters. We interpret this extended emission attributed to strong emission lines of [O iii]5007 and H from ID4590, implying that a powerful mechanism of forming the extended ionized gas structure is taking place. Note that there are two nearby objects towards the East with offsets of and . We run the SED fitting code EAZY (Brammer et al. 2008) for these two nearby objects with the available JWST/NIRCam, MIRI, and HST photometry in the public grizli catalog (Section 2.3) by using the default template set of tweak_fsps_QSF_12_v3. The results suggest the photometric redshifts of and each from the nearest. Therefore, the nearest object might be a companion galaxy associated with ID4590. However, if the presence of nearby objects is the cause of the extended structure, the same structure should also be observed in the other NIRCam filters, which is not the case. Besides, the structure is also extended towards South Southeast, where no rest-frame UV continuum is identified. Furthermore, the PSF size of the NIRCam/F444W filter is , where the emission should be individually resolved if the extended ionized gas is caused by individual further faint satellites. We thus conclude that this diffuse, extended structure in the F444W filter is hardly explained either by these two nearby objects or further faint satellites. The structure extends to towards the Southeast most. Given the circularized rest-frame optical effective radius of (Section 3.3), the structure extends out to times more than the stellar distribution of the galaxy. If we take the differential magnification effects into account, the structure is aligned to the radial magnification axis (), indicating that the intrinsic physical distance after the lens correction is kpc. For the same direction, the rest-frame optical effective radius after the lens correction is estimated to be kpc. These results suggest that the ionized gas distribution over the effective radius of the stellar distribution even increases to a factor of 15. The relative ratio of is well beyond the diffused ionized gas (DIG) structure observed among local galaxies (10% of the galaxy size; see e.g., Rossa & Dettmar 2003). We further discuss the physical origins of the extended ionized gas in Section 4.4.
By comparing the total flux correction factors in F356W and F444W filters (Section 2.3), we find that the extended component in F444W contributes to the total flux measurement by %. In the following analyses when studying the same emitting regions121212 We correct the 8% contribution from the extended region in the full SED analysis (Section 3.6). By assuming that [O iii]5007 emission also has the same flux contribution from the extended region, we apply the same correction to the [O iii]88m/[O iii]5007 line ratio analysis (Section 4.1). , we remove this 8% contribution of the extended ionized gas to the total flux measurement in the F444W filter. With the same motivation for analyses that assume the emission originated from the same regions, we also use the 3 upper limit for the [C ii] luminosity at the galaxy position imfit (Section 3.2).
3.5 FIR SED
From the upper limits of the dust continuum both in Band 5 and Band 7, we attempt to constrain the FIR SED of ID4590. Recent FIR SED studies for high- dusty star-forming galaxies at –4, including Herschel and ALMA photometry, suggest the typical dust temperature of K (e.g., Swinbank et al. 2014; Sun et al. 2022). For UV-selected galaxy populations such as Lyman-break galaxies (LBGs) at –7, ALMA multiple band observations show a higher dust temperature distribution typically ranging from 40 K even out to 80 K (e.g., Faisst et al. 2020; Bakx et al. 2020; Akins et al. 2022; Witstok et al. 2022), where several analytical models have been developed and well reproduced the observation results, including the potential redshift evolution of (e.g., Inoue et al. 2020; Fudamoto et al. 2022a; Sommovigo et al. 2022b).
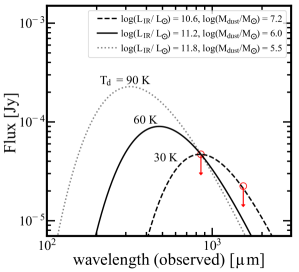
Because of the limited constraints due to lack of the detection in both ALMA Bands, we assume the single modified black body (MBB) for the FIR SED of ID4590. We adopt a fiducial estimate of 60 K based on the extrapolation of the best-fit redshift evolution model of following the decrease of the gas depletion time scale () derived in Sommovigo et al. (2022b), while we include the uncertainty of by 30 K given the distribution so far observed in high- LBGs with ALMA. We fix dust spectral index at a typical value of 1.8 (Chapin et al. 2009; Planck Collaboration et al. 2011) and take the CMB temperature effect (e.g., da Cunha et al. 2013) into account in the MBB model.
In Figure 3, we show three MBB models with K, 60 K, and 90 K normalized to the upper limit of Band 7. The inset labels show the derived IR luminosity , integrated over 8–1000 m, and the dust mass , with the dust opacity coefficient of . In the observed frame (i.e. no lens correction), we obtain the upper limits of and with the fiducial value of 60 K. This indicates that ID4590 has the observed-frame dust-obscured SFR of SFR yr-1. The FIR SED properties are summarized in Table 3.
3.6 Full SED analysis and physical properties
| Name | ID4590 |
|---|---|
| R.A. | 07:23:26.255 |
| Dec. | :26:57.041 |
| 8.496 | |
| 8.69 | |
| SFR [ yr-1] | 26 |
| [] | 5.3 |
| [1010 ] | |
| [] | |
| [] | |
| [] | |
| [arcsec] | |
| [arcsec] | |
| [arcsec] | |
| [arcsec] | |
| [cm-3] | 220 |
| [104 K] | |
| 12 + (O/H) | |
| (C/O) |
From the mass model with Glafic (Oguri 2010, 2021) using the JWST ERO data presented in Harikane et al. (2022). For the lens corrected values, we add a systematic uncertainty of 30% throughout the paper (Section 3.1).
Based on the single MBB with K and without the energy balance, where a difference by K changes the estimates by 0.5–1.0 dex (see also Figure 3).
Circularized effective radius. The best-fit axis ratio is .
Heintz et al. (2023)
Nakajima et al. (2023)
Isobe et al. (2023b)
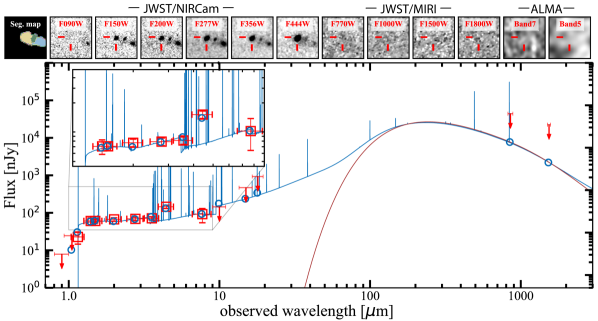
Figure 4 shows the JWST and ALMA image cutouts, including the segmentation map (top), and the optical–mm photometry in the observed frame (i.e. no lens correction) measured with HST, JWST, and ALMA for ID4590 (bottom). A significant flux enhancement is observed in the F444W filter (rest-frame 4000–5000). Some remarkably massive early galaxy candidates have been reported at –11 whose SED shape shows a secondary peak, likely because of the strong Balmer break in the NIRCam LW filters (Labbe et al. 2022). However, the secondary peak might be explained by contributions from strong emission lines of [O iii]5007+H (Endsley et al. 2022), where the lack of the longer wavelength data challenges drawing a definitive conclusion. In contrast, the presence of the MIRI photometry in ID4590 shows the flux enhancement only occurs in the F444W filter, which helps conclude that the flux enhancement in the F444W filter is caused by strong [O iii]+H emission lines, rather than a large stellar mass. Such strong contributions of the [O iii]+H lines also agree with the extended morphology observed in the F444W filter, which is interpreted as the presence of the extended ionized gas emission (Section 3.4).
To perform a panchromatic characterization of ID4590, we perform SED fitting to the optical–mm photometry using cigale (Burgarella et al. 2005; Noll et al. 2009; Boquien et al. 2019). While we examine the FIR SED in Section 3.5, the SED modelling with cigale allows us to take the energy balance between the dust absorption and re-emission into account, which is complementary with the independent FIR SED analysis. The fitting was performed similarly as in Fujimoto et al. (2023), and we summarize the details of the fitting and parameter ranges used in the fitting in the Appendix.
In the bottom panel of Figure 4, the blue curve shows the best-fit SED, where the brown curve highlights the re-emission of the dust in the rest-frame FIR wavelength based on the Casey (2012) model. The inset panel shows the zoom-in spectrum of the best-fit SED at 1–9 m. Our best-fit SED reproduces the observed photometry, including the flux enhancement in the F444W filter with the reduced value of 0.99. We obtain the best-fit values of SFR = 26 yr-1, , UV continuum slope , and in the observed-frame (i.e. no lens correction), respectively, that are generally consistent with previous NIRcam and/or NIRspec based measurements (e.g., Carnall et al. 2023; Schaerer et al. 2022; Tacchella et al. 2022), as well as an independent NIRCam and NIRISS based measurements in the separated paper of Heintz et al. (2023). The value is estimated to be , which is consistent with the upper limit obtained from the independent FIR SED analysis (Section 3.5). This indicates that the current non-detection of the dust continuum with ALMA does not violate the energy balance with the SMC dust attenuation curve, while the and values suggest that ID4590 is a certainly dust-attenuated system, in contrast to very blue galaxies observed in recent JWST observations at similar redshifts (e.g., Nanayakkara et al. 2022; Furtak et al. 2022; Cullen et al. 2022; Topping et al. 2022a; Finkelstein et al. 2023; Atek et al. 2022; Fujimoto et al. 2023; Robertson et al. 2022). Note that we confirm that the SED outputs are unchanged beyond 5–10% with and without the ALMA upper limits in the above SED fitting with cigale. We further examine the dust and the obscured properties of ID4590 in Section 4.3 and discuss the potential underlying physical mechanisms in Section 4.4.
Because several Balmer emission lines are detected in ID4590 with NIRSpec, we compare our best-fit with the measurement from the Balmer decrement. The line flux measurements from the latest NIRSpec reduction and calibration (Section 2.3) yield and from H/H and H/H, respectively, by assuming the SMC dust attenuation law. Our SED-based estimate falls between those estimates from the Balmer decrement approach, suggesting the general consistency between the photometry- and spectroscopic-based approaches. However, caution remains in the different suggested between H/H and H/H, where the difference can change the H-based SFR estimate (e.g., Kennicutt & Evans 2012) by a factor of 3 after the dust correction. We confirm that similarly different values are obtained by assuming other dust attenuation laws (e.g., LMC, Calzetti et al. 2000), and thus the difference is unlikely caused by an improper choice of the dust attenuation law. We speculate that it is caused by the difficulty of the optimal wavelength-dependent slit-loss correction for each emission, taking their potential differential distributions. We thus use the SED-based physical properties in the following analysis.
We note that Giménez-Arteaga et al. (2023) discuss the potential underestimate of by 0.5–1 dex in the spatially-integrated SED analysis, compared to the sum of the spatially-resolved SED analysis, especially in strong optical emission line systems 131313 This is because the young bursty stellar populations, causing the strong optical emission lines, dominate the emission in the spatially-integrated photometry, hiding the possible presence of underlying older stellar populations, and yield extremely young ages ( Myr) and therefore lower masses in the SED fit. . However, we confirm that our estimate is consistent with the results from the spatially-resolved SED analysis in Giménez-Arteaga et al. (2023), owing to the additional constraints from the MIRI bands (Bisigello et al. 2019; Papovich et al. 2023).
4 Results & Discussions
4.1 Electron density at via [O iii]88m/[O iii]5007
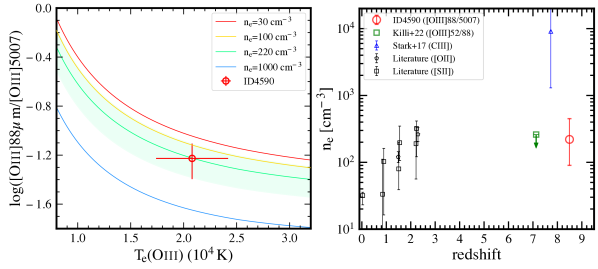
Owing to the same species and ionized state with different critical densities, the line ratio of [O iii]88m/[O iii]5007 is regulated by the electron density and temperature . In the left panel of Figure 5, we show the line ratio of [O iii]88m/[O iii]5007 as a function of with different assumptions for the electron density , drawn by using the nebular emission code PyNeb141414 http://research.iac.es/proyecto/PyNeb// . The relations show monotonic decreasing functions towards the increase of or . This indicates that we can evaluate with a secure measurement (or vice versa – evaluate with a secure measurement).
The NIRSpec observations successfully detect the multiple nebular emission lines from ID4590 in rest-frame UV to optical wavelength, including [O iii]5007 and [O iii]4363, which provides us with the robust measure of (e.g., Schaerer et al. 2022; Curti et al. 2022; Trump et al. 2022; Heintz et al. 2023; Nakajima et al. 2023). In conjunction with the secure measurement and our ALMA measurements (Section 3.2), we derive the [O iii]88m/5007 line ratio for ID4590, and the red circle in the left panel of Figure 5 shows the relation. Based on the 1 uncertainties, we evaluate cm-3.
The value has been typically measured by using density-sensitive line ratios such as [S ii]6716/6731, [O ii]3729/3726, and C iii]1907/1909 (e.g., Kewley et al. 2019). Previous spectroscopic surveys have found the presence of the redshift evolution of : the typical in local galaxies has increased from cm-3 at (e.g., Herrera-Camus et al. 2016) to 100–200 cm-3 at (e.g., Kaasinen et al. 2017; Kashino et al. 2017), and to 200–300 cm-3 at –3 (Steidel et al. 2014; Sanders et al. 2016; Davies et al. 2021).
Because of the required high spectral resolution and subsequently high sensitivity to resolve those rest-frame UV and optical doublet lines, the results have been generally limited at , while recent rest-frame FIR observations have been exploring the measurement even out to the EoR. By using a FIR fine-structure line ratio of [O iii]52m and [O iii]88m detected with ALMA, Killi et al. (2022) estimate cm-3 in a dusty lensed star-forming galaxy at , A1689-zD1 (Watson et al. 2015). Our measurement of a high electron density provides a new determination of at EoR and is consistent with the results in A1689-zD1. For several –9 galaxies with the [O iii]88m and [C ii]158m line measurements, Vallini et al. (2021) show that their gas density generally fall within –1000 cm-3 by advancing analytical models for these FIR emission lines (Ferrara et al. 2019; Vallini et al. 2020). Although systematic uncertainties remain in this approach due to the C/O abundance and the different emitting regions of the [O iii] and [C ii] lines that suggest and are not identical, these measurements at similar redshift also in line with our measurement for ID4590. Our measurement is also broadly consistent with recent NIRSpec measurements for galaxies using the [O ii] doublet (Isobe et al. 2023a). In contrast, Stark et al. (2017) use the C iii] doublet and estimate cm-3 in EGS-zs8-1, a UV-luminous star-forming galaxy at , which is much higher than those of our and recent measurements with the [O iii]88m line.
In the right panel of Figure 5, we summarize the measurement as a function of redshift. The value of ID4590 is similar to –3 star-forming galaxies. This might suggest that the physical mechanisms responsible for driving the high values observed at 2–3 initially took place in the EoR, and there was a little redshift evolution between and 2–3, albeit the diversity observed with EGS-zs8-1. However, this redshift trend strongly depends on the galaxy types selected, and similarly high measurements ( cm-3) are also obtained in compact star-forming galaxies at –0.4 (Guseva et al. 2020). Moreover, given the similar high ionization potentials between C iii] and [O iii]88m emission lines, but much lower critical density of [O iii]88m ( cm-3), the different results between the C iii] and [O iii]88m measurements might indicate these emission lines generally arise from different regions with different values, where we are witnessing the differential distributions inside H ii regions. The upcoming JWST/NIRSpec observations in the high-resolution spectrograph mode () will sufficiently resolve the rest-frame UV and optical doublet lines, statistically evaluate based on a mass-complete sample, verify the presence of its redshift evolution and/or differential distributions traced by different emission lines, and determine what key mechanisms regulate out to the EoR.
4.2 SFR–, , and Relations
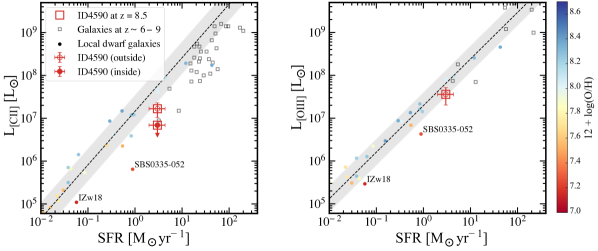
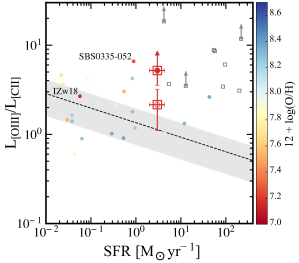
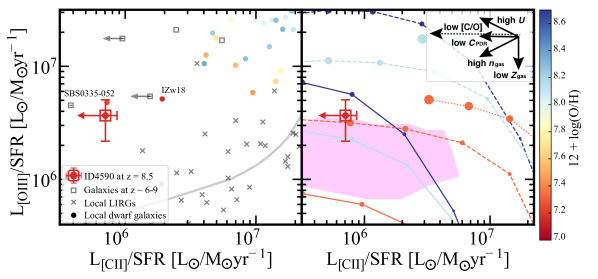
In Figure 6 and 7, we present , , and as a function of SFR for ID4590. We show the results after the lens correction, where the systematic uncertainty of 30% for the magnification factor (Section 3.1) is propagated in the error bars. In SFR– (SFR–) relation, we also show the upper limit (lower limit) for () at the JWST source position, given its spatial offset (Section 3.4), and separate the results inside and outside the galaxy with filled and open circles, respectively. For comparison, we also present compilations of recent ALMA results for –9 galaxies in literature (e.g., Harikane et al. 2020; Fujimoto et al. 2021) with black squares, and local dwarf galaxy results with the gas-phase metallicity () measurements (De Looze et al. 2014; Cormier et al. 2015) with color circles. The color scale is equal to 12+(O/H) denoted in the color bar, except for the –9 galaxy results whose values have not been constrained. The average relation for the local dwarf galaxies is shown in the dashed black line with the 1 range in the grey shade. In all relations, ID4590 are generally consistent with the results estimated in other –9 galaxies. In addition, ID4590 explores the faint-end of the 6–9 galaxy results, owing to the aid of the gravitational lensing effect. Therefore, ID4590 is a faint, thus abundant, and representative early galaxy with physical properties similar to other galaxies so far observed with ALMA at similar redshifts. This indicates that ID4590 is a unique laboratory to study what regulates the FIR major coolant lines of [C ii]158m and [O iii]88m in EoR galaxies.
In the SFR– relation, we find that ID4590 falls below the typical relation of the local dwarf galaxies in both results obtained inside and outside the galaxy. Among the local dwarf galaxies, there are two galaxies of IZw18 and SBS0335-052 whose measurements are similarly low as ID4590 (12+(O/H) 7.1–7.3). We confirm that the /SFR) ratio inside the galaxy shows , which is consistent with these two very metal-poor local galaxies (). This might indicate that the low [C ii] line emissivity of ID4590 is explained by the low ISM condition (e.g., Vallini et al. 2015), while there are also other key factors which reduce the [C ii] emissivity such as high ionization parameter or low gas density (see Section 1). In fact, ID4590 shows strong [O iii]5007+H emission (Section 3.6), which generally represents recent young bursty stellar populations (e.g., Topping et al. 2022b; Witstok et al. 2022), where the high ionization parameter, as a result, might be a more critical driver. The [C ii] emission outside the galaxy shows /SFR), being higher than these very metal-poor local galaxies but still lower than the typical relation. This might be explained by a huge amount of gas around ID4590 which efficiently uses all the photons to boost the [C ii] emission eventually. With an analytical model, Ferrara et al. (2019) predict that the surface density of [C ii] luminosity becomes almost constant around yr-1 kpc-1 at a high SFR surface density regime of yr-1 kpc-2 with a linear scale dependence on the gas density, regardless of in 0.1–1.0 (see eq. 42 in Ferrara et al. 2019). Based on our size and full SED analyses in Section 3, ID4590 indeed shows yr-1 kpc-2 with yr-1 kpc-2, which agrees with the prediction from the analytical model. For more discussions related to the rich gas aspect around ID4590, we refer the reader to a separate paper by Heintz et al. (2023).
In the SFR– relation, we find that ID4590 is consistent with the local relation within the errors but likely falls slightly below it. This would also be explained by the low [O iii] line emissivity with low values (e.g., Popping 2022), which is also shown in the monotonic decreasing function in the [O iii]88/[O iii]5007– relation, regardless of (Figure 5). In fact, the slightly low /SFR) ratio of ID4590 is consistent with those of the two very metal-poor local galaxies of IZw18 and SBS0335-052 () within the errors. We also confirm that the SFR- relation of ID4590 is consistent with the serra zoom-in simulation results (e.g., Pallottini et al. 2022; Kohandel et al. 2022) for galaxies whose values are similar to that of ID4590 (; Section 2.3).
In the SFR– relation, we find that ID4590 shows higher ratios both inside and outside the galaxies than the local relation. In particular, the lower limit of obtained inside the galaxy is similarly high to other –9 galaxies so far observed (e.g., Harikane et al. 2020; Witstok et al. 2022). We discuss the physical origins of the high [O iii]/[C ii]line ratio in Section 4.5.
4.3 IRX- relation
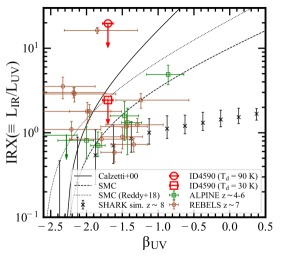
Figure 8 presents the infrared excess ( IRX) and the UV continuum slope relation of ID4590. Although we adopt the fiducial value of K in Section 3.5, here we show two extreme cases for ID4590, with 30 K and 90 K, by assuming the potential uncertainty of K. For comparison, we also show the relations based on several dust attenuation laws (Reddy et al. 2018; Calzetti et al. 2000), a semi-analytical model of SHARK151515 The dust extinction and re-emission are modeled with Charlot & Fall (2000) and the templates of Dale et al. (2014), respectively, while the final IRX– relation is also regulated by dust surface density, , , and galaxy structure. for galaxies at (Lagos et al. 2020), and the recent measurements for 4–7 star-forming galaxies observed in the ALPINE (Le Fèvre et al. 2020) and REBELS surveys (Bouwens et al. 2021) taken from Fudamoto et al. (2021) and Inami et al. (2022), respectively. While several Balmer emission lines are detected in ID4590, we note that concluding which dust attenuation law fits the best with ID4590 is still challenging with their current S/N and the potential difficulty of the proper aperture correction for each Balmer emission (Section 3.6).
In Figure 8, ID4590 falls in a moderately red UV color regime, where the dust continuum is detected from the previous ALMA observations for the 4–7 galaxies. If ID4590 has a relatively low (30–40 K) and follows a dust attenuation law similar to Calzetti et al. (2000) or SMC in Reddy et al. (2018), the upper limit suggests that the dust continuum should be detected from ID4590 with the current ALMA depth161616 In the energy balance between the dust attenuation and re-emission, a lower makes the FIR SED peak wavelength longer at a given , where the ALMA sensitivity limit may reach the FIR SED peak at some point.. This indicates that ID4590 has a value higher than 30–40 K or an SMC-like steep dust attenuation law with the intrinsic UV continuum slope of (e.g., Meurer et al. 1999; McLure et al. 2018). Given the low dust content implied from the low metallicity of ID4590 from the NIRSpec results (Section 2.3) and the high from the compact rest-frame UV size (Section 3.3), the dust is efficiently heated at a given UV field (e.g., Behrens et al. 2018; Sommovigo et al. 2022b, a), and the former high scenario might be plausible. We also find that the semi-analytical model of SHARK predicts the IRX– relation even lower than the SMC relation for the simulated galaxies with similar redshift and as ID4590, the non-detection of the dust could be simply because of the difference of the dust attenuation law between local and high- galaxies.
Future ALMA high-frequency follow-up observations (e.g., Band 8, 9, and 10) will confirm or rule out the high scenario in ID4590. Furthermore, the detection of the rest-frame UV–optical continuum and/or multiple high-significance detection of Balmer and Paschen emission lines in upcoming JWST/NIRSpec and MIRI observations will help us to directly constrain the dust attenuation curve in high-redshift galaxies, including ID4590.
4.4 Onset of outflow at , facilitating reionization
In Figure 2, we find the spatial offset of [C ii] from the JWST source position (Section 3.4). The spatial offset suggests the presence of the accreting/satellite gas clump(s) (e.g., Maiolino et al. 2015) or the extended [C ii] gas beyond the stellar distribution (e.g., Fujimoto et al. 2019, 2020; Ginolfi et al. 2020; Carniani et al. 2020; Herrera-Camus et al. 2021; Akins et al. 2022; Lambert et al. 2022), tracing the diffuse neutral hydrogen (Heintz et al. 2021, 2022). The [C ii] size measurement result, almost times larger than the stellar distribution of ID4590 (Section 3.3), supports the latter scenario of the presence of the extended [C ii] gas. Although we cannot rule out the possibility that the noise fluctuation makes the [C ii] morphology look extended with the current S/N, it is worth mentioning that similarly extended [C ii] morphology with spatial offsets have also been observed in other galaxies at –9 (Carniani et al. 2020). The other possibility could be nearby faint, dusty objects (e.g., Fujimoto et al. 2016, 2022) emitting [C ii] (e.g., Romano et al. 2020; Fudamoto et al. 2022b). However, no counterparts are identified down to a 3 upper limit in F150W of 32.5 mag (with -diameter; Harikane et al. 2022) after the lens correction, which corresponds to SFR yr-1 at (e.g., Kennicutt & Evans 2012). Similarly, no counterparts in F444W place a upper limit of by scaling the best-fit SED of ID4590. A pixel-based SED analysis in Giménez-Arteaga et al. (2023) shows the gradient of the dust obscuration decreasing towards the [C ii]-emitting region, which also supports the absence of the counterparts at the [C ii] peak position.
Whichever the [C ii]-emitting gas is compact clump(s) diffuse & extended, these results suggest that the carbon in the gas is illuminated not by local star-forming activities, but by i) the ionizing photon escaped from inside the galaxy, ii) shock heating of the outflowing gas, or iii) a cooling process of the hot outflowing gas (see also discussions in e.g., Fujimoto et al. 2019, 2020; Pizzati et al. 2020; Akins et al. 2022). In Figure 6, we find that the /SFR ratio of this [C ii] emission outside of galaxy is consistent with other local dwarf galaxies whose values are similarly low as ID4590 (IZw18 and SBS0335-052). This suggests that the input energy from i) is enough to explain the observed . In fact, the high ionization parameter of observed in ID4590 is in line with the scenario of i).
In Figure 2, we also find the extended ionized gas ([O iii]5007, H) structure in the deep NIRCam/F444W filter (Section 3.4). Similar to the [C ii] emission, no NIRCam counterparts are identified in the extended ionized gas regions. In addition, the extended ionized gas regions are also not matched with the direction of the high dust obscuration gradient, which denies the possibility that the obscured star-forming regions cause the extended ionized emission. Based on the size measurement results in the image plane (Section 3.3) and the different radial and tangential magnifications (see middle panel of Figure 2), the ionized [O iii]5007+H structure extends out to times more than the effective radius of the stellar distribution of ID4590 (Section 3.4). Same as [C ii], i)–iii) are the possible physical origins of the extended ionized gas emission. Interestingly, from the center of ID4590, the regions of the extended ionized gas distribution (Southeastern) and the peak position of the [C ii] emission (Northern) are in different directions. This might indicate that the differential distributions of the nebular parameters, such as , , , and C/O abundance cause these differential distributions, even if the same physical process is taking place, either of i)—iii). The different morphology between [O iii]8̃8m and [O iii]5007+H might also be attributed to the differential distributions of the nebular parameters, although the insufficient depth in the ALMA 88m map could be another plausible cause.
Importantly, regardless of the true physical processes to give rise to an offset-[C ii] and extended [O iii]5007+H gas emission, the presence of the metal-enriched gas away from the galaxy is strong evidence of past and/or ongoing outflow activities already taking place in a low-mass (), metal-poor () nascent galaxy at . The presence of the extended carbon gas structure, so-called [C ii] Halo, has been reported around more massive (–10) star-forming galaxies at (e.g., Fujimoto et al. 2019, 2020; Ginolfi et al. 2020; Herrera-Camus et al. 2021; Akins et al. 2022; Lambert et al. 2022), which is challenging to the current cosmological galaxy formation models (Fujimoto et al. 2019; see also e.g., Pizzati et al. 2020; Arata et al. 2020; Katz et al. 2022). Our results in ID4590 provide new insight that such metal enrichment beyond the galaxy ISM scale starts to occur even in the very early phase of the galaxy assembly just 580 Myr after the Big Bang, which is likely linked to the origin of the [C ii] halo at a later epoch of the Universe.
Another important fact is that the presence of diffuse extended ionized gas around ID4590 directly indicates the high filling factor of the ionized gas, where the ionizing photons escaping from the galaxy may contribute to the Reionization. After the lens correction, ID4590 is fainter than the characteristic UV luminosity of the UV luminosity function (UVLF) at ( mag; e.g., Harikane et al. 2022). Once we confirm the high escape fraction of the ionizing photons from faint, low-mass galaxies, probably related to the onset of the outflow from the early stage of the galaxy assembly, it also provides us with a new insight into the process of the Reionization, in contrast to the scenario that huge ionized bubbles are formed around UV-bright galaxies () at similar redshifts (e.g., Mason et al. 2018). The significantly low metallicity of ID4590, falling below the mass–metallicity relations predicted from current galaxy formation models (e.g., Curti et al. 2022), despite the dust obscuration in ID4590 (), may suggest that dust obscuration occurs in a part of the galaxy with a very low dust content. This may also be caused by the past or ongoing outflow activities (Ferrara et al. 2022; Ziparo et al. 2022) that carry the dust away from the galaxy and make it diffuse, cold, and undetectable in the observations (e.g., Akins et al. 2022), while the dust in regions that are not invested by the outflow, or that are shielded by Giant Molecular Clouds, could survive (see also Martínez-González et al. 2019; Nath et al. 2022). This small amount of surviving dust may be responsible for a certain amount of dust obscuration. In any case, the low dust content in the galaxy is also helpful for ionizing photons to escape from the system.
Note that diffuse ionized gases (DIGs) have been observed in local galaxies, from inter-arm regions (e.g., Zurita et al. 2000) to areas above the galactic mid-plane out to 1–2 kpc scales (e.g., Rossa & Dettmar 2000). However, even in the latter case, the sizes of these DIGs are only about % relative to the size of the host galaxy (e.g., Rossa & Dettmar 2003). In contrast, the extended ionized gas structure around ID4590 is well beyond the central galaxy size (Section 3.4). Therefore, the physical origins of the extended ionized gas structure around ID4590 are likely different from those of the DIGs in the local Universe.
Another note is that we do not find evidence of the ongoing outflow via the broad-wing feature in the NIRSpec spectrum. However, the slit of the NIRSpec MSA is aligned perpendicular to the extended ionized gas structure (See the white rectangle in Figure 2), which might be the reason for the absence of the broad-wing feature in the current NIRSpec spectrum.
4.5 Physical origins of the high [OIII]88m/[CII]158m ratio
Previous ALMA observations reported the detections of the luminous [O iii]88m line from star-forming galaxies at 6–9, showing their [O iii]88m/[C ii]158m line ratio of –10 that are higher than local dwarf galaxies and/or local Luminous Infrared Galaxies (LIRGs) with similar SFRs (Inoue et al. 2016; Harikane et al. 2020; Witstok et al. 2022). The origin of such high ratios is still unclear. Major solutions that have been argued include a) observational bias (e.g., Carniani et al. 2020), b) low C/O abundance ratio (Katz et al. 2022), c) low covering fraction of PDRs171717 This is equal to the high filling factor of the ionized gas relative to dense PDRs. (Cormier et al. 2015; Harikane et al. 2020), and d) the characteristic ISM parameters in early galaxies such as the high ionization parameter (Katz et al. 2017; Harikane et al. 2020) probably caused by recent strong bursts of star-formation (Ferrara et al. 2019; Arata et al. 2020; Vallini et al. 2021; Witstok et al. 2022; Sugahara et al. 2022) and/or low stellar-to-gaseous metallicity ratio (Sugahara et al. 2022).
In Section 6, we find that ID4590 also shows a similarly high [O iii]88m/[C ii]158m line ratio of at the galaxy position. In addition to the accurate measures of and (Section 4.1), the deep NIRSpec observations also cover the [O ii]3729 and C iii]1909 emission lines from ID4590, which allow us to constrain the ionization parameter (e.g., Schaerer et al. 2022; Curti et al. 2022; Brinchmann 2022; Trump et al. 2022; Heintz et al. 2023; Nakajima et al. 2023) and the C/O abundance in ID4590 (e.g., Arellano-Córdova et al. 2022; Isobe et al. 2023b). This indicates that we can investigate the physical origins of the high [O iii]88m/[C ii]158m line ratio, taking the possible solutions of b) and d) into account via the actual observed measurements for ID4590. Besides, the spatial offset of the [C ii] line (Section 3.4) allows us to separate the emission arising inside and outside the galaxy and fairly compare the line ratio, also managing the observational bias of point a). Therefore, with this best optical–mm characterization of an early galaxy owing to the joint JWST and ALMA analysis, we are ready to address the physical origins of the high [C ii]/[O iii] and verify whether the remaining possible solution of c) is critical or other solutions can answer already.
In Figure 9, we show the SFR and SFR relation of ID4590. Given the purpose of the analysis, we use the [C ii] results at the galaxy position. For comparison, we also present the relations from observations (left panel) and the predictions from the photoionization model with cloudy (right panel) drawn in the same manner as Harikane et al. (2020) (see also Sugahara et al. 2022), where the possible shifts on the plane by b), c), and d) are presented with black arrows (Harikane et al. 2020). We also show the magenta-shaded region that corresponds to the possible space for ID4590 calculated by Cloudy with our fiducial estimates of , cm-3, , and (C/O)=. Following Harikane et al. (2020), we use the SFR value based on the dust-corrected H luminosity estimated from NIRSpec (Section 2.3), instead of the SED-based value, for this analysis.
In the left panel, we find that ID4590 shows the /SFR ratio much higher than local LIRGs, falling on the high [O iii]/[C ii] line ratio regime similar to other –9 galaxies. We also find that several metal-poor galaxies (12+) among the local dwarf galaxies are located in the similarly high [O iii]/[C ii] line ratio regime to these –9 galaxies. This may suggest that the ISM conditions of these –9 galaxies are similar to those of the local metal-poor galaxies, while an important note is that these local metal-poor galaxies have much lower SFRs than these –9 galaxies by 1–2 orders of magnitudes.
In the right panel, we find that the observed /SFR and /SFR relation of ID4590 is consistent with the magenta-shaded region within the errors. This indicates that the [C ii] and [O iii] emissivities at a given input energy in ID4590 are generally explained by the combination of high , high , low , and low (C/O). Therefore, the physical origin of the high [O iii]/[C ii] ratio observed among –9 galaxies may be sufficiently explained by b) and d).
As discussed in Harikane et al. (2020), another possible origin of c) – the low – could also be the additional reason to boost the [O iii]/[C ii] ratio. As indicated in the black arrow, this effect makes the data points horizontally to move to the left in Figure 9 (i.e., towards low [C ii]/SFR). Because the current estimate provides the upper limit alone, the possible parameter space of ID4590 extends to the low /SFR regime, where we cannot disentangle the contributions from and . Once the upper boundary of is constrained, the lower limit of the /SFR ratio in the possible parameter space will be determined, where the additional contribution will be evaluated if the observed /SFR upper limit is lower than the possible parameter space. With future deep [C ii] follow providing a much more stringent upper limit or the faint detection of [C ii], we may be able to investigate further the additional contribution from .
5 Summary
In this paper, we present the ALMA Band 7 and Band 5 deep spectroscopy for the two major coolant FIR lines of [O iii]88 m and [C ii]158 m from ID4590, a metal-poor, low-mass, strongly lensed sub- galaxy at , whose warm interstellar medium and stellar properties have been the best characterized with the JWST Early Release Observations (ERO) for the SMACS0723 field. The JWST ERO observations include the deep imaging with NIRCam and MIRI at 1–20 m as well as deep spectroscopy with NIRSpec at 2–5 m which detects multiple rest-frame optical emission lines, including [O iii]4363 line, and provides us with the robust measure of the gas-phase metallicity via the direct temperature method for the first time at . Combining these rich JWST data with HST and ALMA, the high-spatial-resolution, homogeneous data set from optical to mm wavelengths enables us to perform a panchromatic characterization of an early galaxy in and out, which sets the benchmark for synergetic studies of ALMA and JWST in the coming decades. The main findings of this paper are summarized as follows:
-
1.
We detect both [C ii]158m and [O iii]88m lines at 4.0 and 4.5 levels, respectively. The redshift and the spatial position of the [O iii] line exactly coincide with those of the JWST source. On the other hand, the [C ii] line is blue-shifted by 90 km -1 and has a spatial offset by ( kpc in source plane) beyond the errors, where the chance projection of the noise fluctuation is very unlikely (%) from a blind line search analysis in the same data cube. This indicates that [C ii] velocity and spatial offsets are real and associated with some physical mechanisms of ID4590.
-
2.
We evaluate the sizes of [C ii], [O iii], rest-frame UV, and rest-frame optical continuum by using ALMA and JWST/NIRCam images. With the 2D profile fitting in the image plane, we obtain the best-fit circularized effective radii of , , and for [C ii], rest-frame UV, and rest-frame optical continuum, respectively. The [O iii] line is not spatially resolved with the current resolution and sensitivity, and we place its upper limit of . We find that the position angle estimated in the F150W filter shows an excellent agreement with the lensing distortion predicted from the mass model, validating the high magnification of in ID4590. The extended [C ii] distribution relative to the stellar continuum is reminiscent of the [C ii] Halo reported in recent ALMA studies, while we cannot exclude the possibility that the [C ii] size estimate is affected by the noise fluctuation with the current S/N.
-
3.
The dust continuum is not detected in neither Band 7 or Band 5, and we place 2 upper limits of 41.8 Jy and 23.2 Jy at 0.85 mm and 1.54 mm, respectively. By assuming a single modified black body with the dust temperature K and the dust spectral index of , we estimate the upper limits of infrared luminosity over 8–1000 m of and the dust mass of after the lens correction, while a different assumption by K changes these constraints by 0.5–1.0 dex. The upper limit of infrared excess (IRX) in ID4590 suggests that is higher than –40 K or that steep dust attenuation laws similar to SMC are favored.
-
4.
The NIRCam/F444W filter, including the contributions from [O iii]5007 and H emission lines, shows an extended structure where the rest-frame UV and optical continuum are invisible and the 3 upper limit in the rest-frame UV continuum after the lens correction are placed at 32.5 mag ( yr-1). Given the high-spatial-resolution of the F444W filter (), the smooth morphology of the extended structure is the direct evidence of the presence of the extended, diffuse ionized gas structure around ID4590. The structure extends towards the radial magnification axis out to . After the lens correction, this corresponds to kpc and at least eight times larger than the rest-frame optical effective radius of ID4590.
-
5.
We perform the optical–mm SED analysis with HST, JWST/NIRCam+MIRI, and ALMA photometry. We exclude the emission outside of the galaxy observed in the F444W filter, and the remaining contribution of the strong emission lines of [O iii]5007+H and the stellar continuum is well separated by the rich filter sets of NIRCam and MIRI. After the lens correction, we estimate the stellar mass of , the total star-formation of SFR yr-1, UV continuum slope of , suggesting that ID4590 is a low-mass, but a little dust attenuated galaxy, in contrast to very blue galaxies () that have been observed in recent JWST observations at similar redshifts.
-
6.
Regardless of the ongoing physical mechanisms, past outflow activities are required to make the surrounding pristine gas of ID4590 metal-enriched and produce the [C ii] offset and the extended ionized gas structure traced by [O iii]5007+H. This would also help produce high ionizing photon escape from ID4590 and contribute to reionization at .
-
7.
With careful slit-loss correction and the separation of the emission inside and outside of the galaxy, we evaluate the electron density of cm-3 via the [O iii]88m/[O iii]5007 line ratio. This is much higher than that of local galaxies ( cm-3), but consistent with –3 galaxies ( cm-3). This is also consistent with the upper limit of cm-3 obtained in a lensed dusty galaxy at .
-
8.
We examine relations between the line luminosities of [C ii]158m, [O iii]88m, and SFR. ID4590 shows –SFR and –SFR relations generally consistent with other –9 galaxies and explores the faint-end of the relations, owing to the aid of the lensing support. The /SFR ratio of ID4590 falls below the typical relation estimated among the local dwarf galaxies beyond the errors. Still, it is consistent with similarly metal-poor local galaxies of IZw18 and SBS0335-052. The same result is obtained in the SFR– relation, while the relation of ID4590 is still consistent with the typical range of the local dwarf galaxies within the errors. ID4590 shows a ratio of , which is also as high as other 6–9 galaxies, falling above the typical relation of the local dwarf galaxies in the SFR– relation.
-
9.
We investigate the physical origins of the high ratio with the photoionization model of Cloudy. The /SFR–/SFR relation of ID4590 is generally reproduced by the high , low gas-phase metallicity (), high ionization parameter (), and low carbon-to-oxygen abundance ratio (C/O) obtained from the JWST/NIRSpec data. While the other potential mechanism of the low covering fraction of the photodissociation region is not constrained by the current data, it will be achieved by further deep ALMA [C ii] follow-up.
We thank the anonymous referee for constructive comments and suggestions. We also thank Catherine Vlahakis and Holly Sheets for their kind support in the processing of the ALMA data, despite the unusual circumstances due to the cyberattack. We are grateful to Pablo Albalo Halo for sharing deep insights into the NIRSpec data analysis and to Caitlin Casey, Steven Finkelstein, and Daniel Stark for helpful discussions for this paper. This paper makes use of the ALMA data: ADS/JAO. ALMA #2022.A.00022.S. ALMA is a partnership of the ESO (representing its member states), NSF (USA) and NINS (Japan), together with NRC (Canada), MOST and ASIAA (Taiwan), and KASI (Republic of Korea), in cooperation with the Republic of Chile. The Joint ALMA Observatory is operated by the ESO, AUI/NRAO, and NAOJ. This work is based on observations and archival data made with the Spitzer Space Telescope, which is operated by the Jet Propulsion Laboratory, California Institute of Technology, under a contract with NASA, along with archival data from the NASA/ESA Hubble Space Telescope. This research also made use of the NASA/IPAC Infrared Science Archive (IRSA), which is operated by the Jet Propulsion Laboratory, California Institute of Technology, under contract with the National Aeronautics and Space Administration. The Early Release Observations181818 https://www.stsci.edu/jwst/science-execution/approved-programs/webb-first-image-observations and associated materials were developed, executed, and compiled by the ERO production team: Hannah Braun, Claire Blome, Matthew Brown, Margaret Carruthers, Dan Coe, Joseph DePasquale, Nestor Espinoza, Macarena Garcia Marin, Karl Gordon, Alaina Henry, Leah Hustak, Andi James, Ann Jenkins, Anton Koekemoer, Stephanie LaMassa, David Law, Alexandra Lockwood, Amaya Moro-Martin, Susan Mullally, Alyssa Pagan, Dani Player, Klaus Pontoppidan, Charles Proffitt, Christine Pulliam, Leah Ramsay, Swara Ravindranath, Neill Reid, Massimo Robberto, Elena Sabbi, Leonardo Ubeda. The EROs were also made possible by the foundational efforts and support from the JWST instruments, STScI planning and scheduling, and Data Management teams. This project has received funding from the European Union’s Horizon 2020 research and innovation program under the Marie Sklodowska-Curie grant agreement No. 847523 ‘INTERACTIONS’ and from NASA through the NASA Hubble Fellowship grant HST-HF2-51505.001-A awarded by the Space Telescope Science Institute, which is operated by the Association of Universities for Research in Astronomy, Incorporated, under NASA contract NAS5-26555. The project leading to this publication has received support from ORP, that is funded by the European Union’s Horizon 2020 research and innovation programme under grant agreement No 101004719 [ORP]. F.S. acknowledges support from the NRAO Student Observing Support (SOS) award SOSPA7-022. The Cosmic Dawn Center is funded by the Danish National Research Foundation under grant No. 140. K. Kohno acknowledges the support by JSPS KAKENHI Grant Number 17H06130 and the NAOJ ALMA Scientific Research Grant Number 2017-06B. The National Radio Astronomy Observatory is a facility of the National Science Foundation operated under cooperative agreement by Associated Universities, Inc.
.
Appendix A Accuracy of the astrometry of JWST and HST maps from grizli
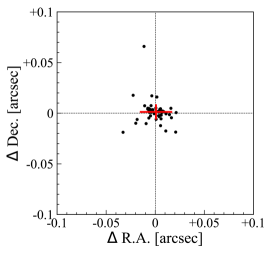
In Figure 10, we show the residual spatial offsets of the Right ascension (R.A.) and Declination (Dec.) for the GAIA sources. We evaluate the residual offsets by running the source extractor (Bertin & Arnouts 1996) on the JWST and HST maps produced by the grizli pipeline and being corrected for the proper motion effect of the GAIA sources, and comparing with those from the GAIA DR3 catalogs. We confirm that the average offset shows an excellent agreement with zero and the standard deviation in R.A and Dec. of and , respectively. We regard these standard deviations as the positional uncertainty of the JWST sources in Figure 2.
Appendix B CIGALE parameters for the full SED fit
We assume a delayed star-formation history (SFH): SFR() exp with stellar models from Bruzual & Charlot (2003) and an exponential recent burst implemented in the sfhdeleyed module. We use the dustatt_modified_starburst module for the dust attenuation, where the nebular emission (continuum + lines) are attenuated with a screen model and an SMC extinction curve (Pei 1992). During the SED fitting, the same is used between stellar and nebular emission. Finally, the dust emission is re-emitted in the infrared with Casey (2012) models. We fix and the mid-infrared power-law slope and adopt the range of 30–90 K. Because no evidence of the presence of AGN has been reported, we do not include an AGN component in the model. We list the modules and the parameter ranges used in the fitting in Table 4. In the fitting, we use the photometry with the error also for the measurements below the upper limits. To avoid the lens model uncertainty, we perform the SED fitting with the optical–mm photometry without the lens correction.
| Parameters | Symbol | Range |
| Delayed SFH and recent burst | ||
| e-folding time scale of the delayed SFH | [Myr] | 100, 250, 500, 1000 |
| Age of the main population | Agemain[Myr] | 51 log values in [1: 3.3] |
| Burst | fburst | 0.05, 0.10, 0.15, 0.25 |
| SSP | ||
| SSP | BC03 | |
| Initial mass function | IMF | Chabrier |
| Metallicity | Z | 0.0004, 0.004, 0.02 |
| Nebular emission | ||
| Ionization parameter | logU | -2.0 |
| Line width [km/s] | — | 150 |
| Gas-phase Metallicity | zgas | 0.0004, 0.004, 0.02 |
| Electron density | ne | 100 |
| Dust attenuation law | ||
| Color excess for both the old and young stellar populations | E_BV_lines | 21 log values in [: 1.3] |
| Reduction factor to apply on E_BV_lines to compute E(B-V)s the stellar continuum attenuation | E_BV_factor | 1.0 |
| Bump amplitude | uv_bump_amplitude | 0.0 |
| Power law slope | power law_slope | 0.0 |
| Extinction law to use for attenuating the emission lines flux | Ext_law_emission_lines | SMC |
| Ratio of total to selective extinction, A_V / E(B-V) | Rv | 2.93 |
| Dust emission (Casey2012) | ||
| Dust temperature | temperature | 20 log values in [1.5:1.95] |
| Dust emissivity index | beta | 1.8 |
| Mid-infrared power law slope | alpha | 2.0 |
| No AGN emission | ||
Appendix C HST/NIRcam/MIRI photometry of ID4590
We summarize the optical–mm photometry used in this paper in Table 5.
| Filter | Flux (nJy) |
|---|---|
| HST/F105W | |
| HST/F125W | |
| HST/F140W | |
| HST/F160W | |
| NIRCam/F090W | |
| NIRCam/F115W | |
| NIRCam/F150W | |
| NIRCam/F200W | |
| NIRCam/F277W | |
| NIRCam/F356W | |
| NIRCam/F444W | |
| MIRI/F770W | |
| MIRI/F1000W | |
| MIRI/F1500W | |
| MIRI/F1800W | |
| ALMA/Band7 | |
| ALMA/Band5 |
Appendix D Size measurements
In Figure 11, we summarize the observed, the best-fit model, and the residual maps from the best-fit size measurements for the [C ii], [O iii], rest-frame UV and optical continuum emission using the ALMA and JWST/NIRcam. The methods are described in Section 3.3. We confirm that significant positive and negative pixels remain in the residual maps.
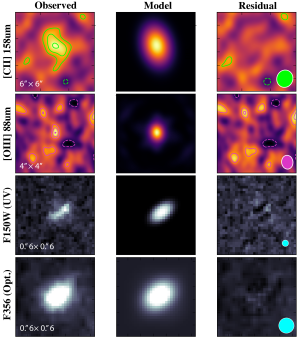
References
- Akins et al. (2022) Akins, H. B., Fujimoto, S., Finlator, K., et al. 2022, ApJ, 934, 64
- Aller (1984) Aller, L. H. 1984, Physics of thermal gaseous nebulae, doi:10.1007/978-94-010-9639-3
- Andrews & Martini (2013) Andrews, B. H., & Martini, P. 2013, ApJ, 765, 140
- Arata et al. (2020) Arata, S., Yajima, H., Nagamine, K., Abe, M., & Khochfar, S. 2020, arXiv e-prints, arXiv:2001.01853
- Arellano-Córdova et al. (2022) Arellano-Córdova, K. Z., Berg, D. A., Chisholm, J., et al. 2022, arXiv e-prints, arXiv:2208.02562
- Atek et al. (2022) Atek, H., Shuntov, M., Furtak, L. J., et al. 2022, arXiv e-prints, arXiv:2207.12338
- Bakx et al. (2020) Bakx, T. J. L. C., Tamura, Y., Hashimoto, T., et al. 2020, MNRAS, 493, 4294
- Behrens et al. (2018) Behrens, C., Pallottini, A., Ferrara, A., Gallerani, S., & Vallini, L. 2018, MNRAS, 477, 552
- Bertin & Arnouts (1996) Bertin, E., & Arnouts, S. 1996, A&A, 117, 393
- Bisigello et al. (2019) Bisigello, L., Caputi, K. I., Colina, L., et al. 2019, ApJS, 243, 27
- Boogaard et al. (2021a) Boogaard, L., Meyer, R. A., & Novak, M. 2021a, Interferopy: analysing datacubes from radio-to-submm observations, doi:10.5281/ZENODO.5775603
- Boogaard et al. (2021b) —. 2021b, Interferopy: analysing datacubes from radio-to-submm observations, doi:10.5281/ZENODO.5775603
- Boquien et al. (2019) Boquien, M., Burgarella, D., Roehlly, Y., et al. 2019, A&A, 622, A103
- Bouwens et al. (2022) Bouwens, R. J., Illingworth, G. D., Ellis, R. S., Oesch, P. A., & Stefanon, M. 2022, arXiv e-prints, arXiv:2205.11526
- Bouwens et al. (2015) Bouwens, R. J., Illingworth, G. D., Oesch, P. A., et al. 2015, ApJ, 803, 34
- Bouwens et al. (2021) Bouwens, R. J., Smit, R., Schouws, S., et al. 2021, arXiv e-prints, arXiv:2106.13719
- Bowler et al. (2022) Bowler, R. A. A., Cullen, F., McLure, R. J., Dunlop, J. S., & Avison, A. 2022, MNRAS, 510, 5088
- Boyer et al. (2022) Boyer, M. L., Anderson, J., Gennaro, M., et al. 2022, Research Notes of the American Astronomical Society, 6, 191
- Bradley et al. (2022) Bradley, L. D., Coe, D., Brammer, G., et al. 2022, arXiv e-prints, arXiv:2210.01777
- Brammer (2023) Brammer, G. 2023, grizli, please cite this software using these metadata., doi:10.5281/zenodo.7767790
- Brammer & Matharu (2021) Brammer, G., & Matharu, J. 2021, gbrammer/grizli: Release 2021, Zenodo, doi:10.5281/zenodo.5012699
- Brammer et al. (2008) Brammer, G. B., van Dokkum, P. G., & Coppi, P. 2008, ApJ, 686, 1503
- Brinchmann (2022) Brinchmann, J. 2022, arXiv e-prints, arXiv:2208.07467
- Broadhurst et al. (2005) Broadhurst, T., Takada, M., Umetsu, K., et al. 2005, ApJ, 619, L143
- Bruzual & Charlot (2003) Bruzual, G., & Charlot, S. 2003, MNRAS, 344, 1000
- Burgarella et al. (2005) Burgarella, D., Buat, V., & Iglesias-Páramo, J. 2005, MNRAS, 360, 1413
- Calzetti et al. (2000) Calzetti, D., Armus, L., Bohlin, R. C., et al. 2000, ApJ, 533, 682
- Caminha et al. (2022) Caminha, G. B., Suyu, S. H., Mercurio, A., et al. 2022, A&A, 666, L9
- Carnall et al. (2023) Carnall, A. C., Begley, R., McLeod, D. J., et al. 2023, MNRAS, 518, L45
- Carniani et al. (2017) Carniani, S., Maiolino, R., Pallottini, A., et al. 2017, A&A, 605, A42
- Carniani et al. (2020) Carniani, S., Ferrara, A., Maiolino, R., et al. 2020, MNRAS, 499, 5136
- Casey (2012) Casey, C. M. 2012, MNRAS, 425, 3094
- Chabrier (2003) Chabrier, G. 2003, PASP, 115, 763
- Chapin et al. (2009) Chapin, E. L., Pope, A., Scott, D., et al. 2009, MNRAS, 398, 1793
- Charlot & Fall (2000) Charlot, S., & Fall, S. M. 2000, ApJ, 539, 718
- Christensen et al. (2012) Christensen, L., Laursen, P., Richard, J., et al. 2012, MNRAS, 427, 1973
- Coe et al. (2019) Coe, D., Salmon, B., Bradač, M., et al. 2019, ApJ, 884, 85
- Cormier et al. (2015) Cormier, D., Madden, S. C., Lebouteiller, V., et al. 2015, Astronomy and Astrophysics, 578, A53
- Cullen et al. (2022) Cullen, F., McLure, R. J., McLeod, D. J., et al. 2022, arXiv e-prints, arXiv:2208.04914
- Curti et al. (2022) Curti, M., D’Eugenio, F., Carniani, S., et al. 2022, arXiv e-prints, arXiv:2207.12375
- da Cunha et al. (2013) da Cunha, E., Groves, B., Walter, F., et al. 2013, ApJ, 766, 13
- Dale et al. (2014) Dale, D. A., Helou, G., Magdis, G. E., et al. 2014, ApJ, 784, 83
- Davies et al. (2021) Davies, R. L., Förster Schreiber, N. M., Genzel, R., et al. 2021, ApJ, 909, 78
- De Looze et al. (2014) De Looze, I., Cormier, D., Lebouteiller, V., et al. 2014, A&A, 568, A62
- Díaz-Santos et al. (2017) Díaz-Santos, T., Armus, L., Charmandaris, V., et al. 2017, ApJ, 846, 32
- Ellis et al. (2013) Ellis, R. S., McLure, R. J., Dunlop, J. S., et al. 2013, ApJ, 763, L7
- Endsley et al. (2022) Endsley, R., Stark, D. P., Lyu, J., et al. 2022, arXiv e-prints, arXiv:2206.00018
- Faisst et al. (2020) Faisst, A. L., Fudamoto, Y., Oesch, P. A., et al. 2020, MNRAS, arXiv:2005.07716
- Ferland et al. (2017) Ferland, G. J., Chatzikos, M., Guzmán, F., et al. 2017, Rev. Mexicana Astron. Astrofis., 53, 385
- Ferrara et al. (2022) Ferrara, A., Pallottini, A., & Dayal, P. 2022, arXiv e-prints, arXiv:2208.00720
- Ferrara et al. (2019) Ferrara, A., Vallini, L., Pallottini, A., et al. 2019, MNRAS, 489, 1
- Finkelstein et al. (2015) Finkelstein, S. L., Ryan, Russell E., J., Papovich, C., et al. 2015, ApJ, 810, 71
- Finkelstein et al. (2023) Finkelstein, S. L., Bagley, M. B., Ferguson, H. C., et al. 2023, ApJ, 946, L13
- Fudamoto et al. (2022a) Fudamoto, Y., Inoue, A. K., & Sugahara, Y. 2022a, arXiv e-prints, arXiv:2206.01879
- Fudamoto et al. (2022b) —. 2022b, ApJ, 938, L24
- Fudamoto et al. (2020) Fudamoto, Y., Oesch, P. A., Faisst, A., et al. 2020, A&A, 643, A4
- Fudamoto et al. (2021) Fudamoto, Y., Oesch, P. A., Schouws, S., et al. 2021, Nature, 597, 489
- Fujimoto et al. (2016) Fujimoto, S., Ouchi, M., Ono, Y., et al. 2016, ApJS, 222, 1
- Fujimoto et al. (2019) Fujimoto, S., Ouchi, M., Ferrara, A., et al. 2019, ApJ, 887, 107
- Fujimoto et al. (2020) Fujimoto, S., Silverman, J. D., Bethermin, M., et al. 2020, ApJ, 900, 1
- Fujimoto et al. (2021) Fujimoto, S., Oguri, M., Brammer, G., et al. 2021, ApJ, 911, 99
- Fujimoto et al. (2022) Fujimoto, S., Brammer, G. B., Watson, D., et al. 2022, Nature, 604, 261
- Fujimoto et al. (2023) Fujimoto, S., Finkelstein, S. L., Burgarella, D., et al. 2023, ApJ, 955, 130
- Furtak et al. (2022) Furtak, L. J., Shuntov, M., Atek, H., et al. 2022, arXiv e-prints, arXiv:2208.05473
- Gaia Collaboration et al. (2021) Gaia Collaboration, Brown, A. G. A., Vallenari, A., et al. 2021, A&A, 649, A1
- Giménez-Arteaga et al. (2023) Giménez-Arteaga, C., Oesch, P. A., Brammer, G. B., et al. 2023, ApJ, 948, 126
- Ginolfi et al. (2020) Ginolfi, M., Jones, G. C., Béthermin, M., et al. 2020, A&A, 633, A90
- Guseva et al. (2020) Guseva, N. G., Izotov, Y. I., Schaerer, D., et al. 2020, MNRAS, 497, 4293
- Harikane et al. (2020) Harikane, Y., Ouchi, M., Inoue, A. K., et al. 2020, ApJ, 896, 93
- Harikane et al. (2022) Harikane, Y., Inoue, A. K., Mawatari, K., et al. 2022, ApJ, 929, 1
- Heintz et al. (2021) Heintz, K. E., Watson, D., Oesch, P. A., Narayanan, D., & Madden, S. C. 2021, ApJ, 922, 147
- Heintz et al. (2022) Heintz, K. E., Oesch, P. A., Aravena, M., et al. 2022, ApJ, 934, L27
- Heintz et al. (2023) Heintz, K. E., Giménez-Arteaga, C., Fujimoto, S., et al. 2023, ApJ, 944, L30
- Herrera-Camus et al. (2016) Herrera-Camus, R., Bolatto, A., Smith, J. D., et al. 2016, ApJ, 826, 175
- Herrera-Camus et al. (2021) Herrera-Camus, R., Förster Schreiber, N., Genzel, R., et al. 2021, A&A, 649, A31
- Howell et al. (2010) Howell, J. H., Armus, L., Mazzarella, J. M., et al. 2010, ApJ, 715, 572
- Inami et al. (2022) Inami, H., Algera, H. S. B., Schouws, S., et al. 2022, MNRAS, 515, 3126
- Inoue et al. (2020) Inoue, A. K., Hashimoto, T., Chihara, H., & Koike, C. 2020, MNRAS, 495, 1577
- Inoue et al. (2016) Inoue, A. K., Tamura, Y., Matsuo, H., et al. 2016, Science, 352, 1559
- Isobe et al. (2023a) Isobe, Y., Ouchi, M., Nakajima, K., et al. 2023a, ApJ, 956, 139
- Isobe et al. (2023b) Isobe, Y., Ouchi, M., Tominaga, N., et al. 2023b, ApJ, 959, 100
- Jullo et al. (2007) Jullo, E., Kneib, J. P., Limousin, M., et al. 2007, New Journal of Physics, 9, 447
- Kaasinen et al. (2017) Kaasinen, M., Bian, F., Groves, B., Kewley, L. J., & Gupta, A. 2017, MNRAS, 465, 3220
- Kaasinen et al. (2022) Kaasinen, M., van Marrewijk, J., Popping, G., et al. 2022, arXiv e-prints, arXiv:2210.03754
- Kashino et al. (2017) Kashino, D., Silverman, J. D., Sanders, D., et al. 2017, ApJ, 835, 88
- Katz et al. (2017) Katz, H., Kimm, T., Sijacki, D., & Haehnelt, M. G. 2017, MNRAS, 468, 4831
- Katz et al. (2022) Katz, H., Rosdahl, J., Kimm, T., et al. 2022, MNRAS, 510, 5603
- Kennicutt & Evans (2012) Kennicutt, R. C., & Evans, N. J. 2012, ARA&A, 50, 531
- Kepley et al. (2020) Kepley, A. A., Tsutsumi, T., Brogan, C. L., et al. 2020, PASP, 132, 024505
- Kewley & Dopita (2002) Kewley, L. J., & Dopita, M. A. 2002, ApJS, 142, 35
- Kewley et al. (2019) Kewley, L. J., Nicholls, D. C., Sutherland, R., et al. 2019, ApJ, 880, 16
- Killi et al. (2022) Killi, M., Watson, D., Fujimoto, S., et al. 2022, arXiv e-prints, arXiv:2211.01424
- Knudsen et al. (2016) Knudsen, K. K., Richard, J., Kneib, J.-P., et al. 2016, MNRAS, 462, L6
- Kohandel et al. (2022) Kohandel, M., Ferrara, A., Pallottini, A., et al. 2022, arXiv e-prints, arXiv:2212.02519
- Kohandel et al. (2020) Kohandel, M., Pallottini, A., Ferrara, A., et al. 2020, MNRAS, arXiv:2009.05049
- Kohandel et al. (2019) —. 2019, MNRAS, 487, 3007
- Kojima et al. (2017) Kojima, T., Ouchi, M., Nakajima, K., et al. 2017, PASJ, 69, 44
- Kokorev et al. (2022) Kokorev, V., Brammer, G., Fujimoto, S., et al. 2022, ApJS, 263, 38
- Labbe et al. (2022) Labbe, I., van Dokkum, P., Nelson, E., et al. 2022, arXiv e-prints, arXiv:2207.12446
- Lagache et al. (2018) Lagache, G., Cousin, M., & Chatzikos, M. 2018, A&A, 609, A130
- Lagos et al. (2020) Lagos, C. d. P., da Cunha, E., Robotham, A. S. G., et al. 2020, MNRAS, 499, 1948
- Lambert et al. (2022) Lambert, T. S., Posses, A., Aravena, M., et al. 2022, MNRAS, arXiv:2210.10023
- Le Fèvre et al. (2020) Le Fèvre, O., Béthermin, M., Faisst, A., et al. 2020, A&A, 643, A1
- Lelli et al. (2021) Lelli, F., Di Teodoro, E. M., Fraternali, F., et al. 2021, Science, 371, 713
- Mahler et al. (2022) Mahler, G., Jauzac, M., Richard, J., et al. 2022, arXiv e-prints, arXiv:2207.07101
- Maiolino & Mannucci (2019) Maiolino, R., & Mannucci, F. 2019, A&A Rev., 27, 3
- Maiolino et al. (2015) Maiolino, R., Carniani, S., Fontana, A., et al. 2015, MNRAS, 452, 54
- Martí-Vidal et al. (2012) Martí-Vidal, I., Pérez-Torres, M. A., & Lobanov, A. P. 2012, A&A, 541, A135
- Martínez-González et al. (2019) Martínez-González, S., Wünsch, R., Silich, S., et al. 2019, ApJ, 887, 198
- Mason et al. (2018) Mason, C. A., Treu, T., Dijkstra, M., et al. 2018, ApJ, 856, 2
- McLure et al. (2018) McLure, R. J., Dunlop, J. S., Cullen, F., et al. 2018, MNRAS, 476, 3991
- Meurer et al. (1999) Meurer, G. R., Heckman, T. M., & Calzetti, D. 1999, ApJ, 521, 64
- Molyneux et al. (2022) Molyneux, S. J., Smit, R., Schaerer, D., et al. 2022, MNRAS, 512, 535
- Naidu et al. (2022) Naidu, R. P., Oesch, P. A., van Dokkum, P., et al. 2022, ApJ, 940, L14
- Nakajima et al. (2023) Nakajima, K., Ouchi, M., Isobe, Y., et al. 2023, ApJS, 269, 33
- Nanayakkara et al. (2022) Nanayakkara, T., Glazebrook, K., Jacobs, C., et al. 2022, arXiv e-prints, arXiv:2207.13860
- Nardiello et al. (2022) Nardiello, D., Bedin, L. R., Burgasser, A., et al. 2022, MNRAS, 517, 484
- Nath et al. (2022) Nath, B. B., Vasiliev, E. O., Drozdov, S. A., & Shchekinov, Y. A. 2022, arXiv e-prints, arXiv:2211.12378
- Noll et al. (2009) Noll, S., Burgarella, D., Giovannoli, E., et al. 2009, A&A, 507, 1793
- Oesch et al. (2016) Oesch, P. A., Brammer, G., van Dokkum, P. G., et al. 2016, ApJ, 819, 129
- Oguri (2010) Oguri, M. 2010, PASJ, 62, 1017
- Oguri (2021) —. 2021, PASP, 133, 074504
- Ono et al. (2022) Ono, Y., Harikane, Y., Ouchi, M., et al. 2022, arXiv e-prints, arXiv:2208.13582
- Ota et al. (2014) Ota, K., Walter, F., Ohta, K., et al. 2014, ApJ, 792, 34
- Pallottini et al. (2015) Pallottini, A., Gallerani, S., Ferrara, A., et al. 2015, MNRAS, 453, 1898
- Pallottini et al. (2019) Pallottini, A., Ferrara, A., Decataldo, D., et al. 2019, MNRAS, 487, 1689
- Pallottini et al. (2022) Pallottini, A., Ferrara, A., Gallerani, S., et al. 2022, MNRAS, 513, 5621
- Papovich et al. (2023) Papovich, C., Cole, J. W., Yang, G., et al. 2023, ApJ, 949, L18
- Pascale et al. (2022) Pascale, M., Frye, B. L., Diego, J., et al. 2022, ApJ, 938, L6
- Pei (1992) Pei, Y. C. 1992, ApJ, 395, 130
- Peng et al. (2010) Peng, C. Y., Ho, L. C., Impey, C. D., & Rix, H.-W. 2010, AJ, 139, 2097
- Pilyugin & Thuan (2005) Pilyugin, L. S., & Thuan, T. X. 2005, ApJ, 631, 231
- Pilyugin et al. (2012) Pilyugin, L. S., Vílchez, J. M., Mattsson, L., & Thuan, T. X. 2012, MNRAS, 421, 1624
- Pizzati et al. (2020) Pizzati, E., Ferrara, A., Pallottini, A., et al. 2020, arXiv e-prints, arXiv:2001.10547
- Planck Collaboration et al. (2011) Planck Collaboration, Abergel, A., Ade, P. A. R., et al. 2011, A&A, 536, A21
- Pontoppidan et al. (2022) Pontoppidan, K., Blome, C., Braun, H., et al. 2022, arXiv e-prints, arXiv:2207.13067
- Popping (2022) Popping, G. 2022, arXiv e-prints, arXiv:2208.13072
- Reddy et al. (2018) Reddy, N. A., Oesch, P. A., Bouwens, R. J., et al. 2018, ApJ, 853, 56
- Rizzo et al. (2020) Rizzo, F., Vegetti, S., Powell, D., et al. 2020, Nature, 584, 201
- Robertson et al. (2022) Robertson, B. E., Tacchella, S., Johnson, B. D., et al. 2022, arXiv e-prints, arXiv:2212.04480
- Romano et al. (2020) Romano, M., Cassata, P., Morselli, L., et al. 2020, MNRAS, 496, 875
- Rossa & Dettmar (2000) Rossa, J., & Dettmar, R. J. 2000, A&A, 359, 433
- Rossa & Dettmar (2003) —. 2003, A&A, 406, 505
- Sanders et al. (2016) Sanders, R. L., Shapley, A. E., Kriek, M., et al. 2016, ApJ, 816, 23
- Sanders et al. (2020) Sanders, R. L., Shapley, A. E., Reddy, N. A., et al. 2020, MNRAS, 491, 1427
- Schaerer et al. (2022) Schaerer, D., Marques-Chaves, R., Oesch, P., et al. 2022, arXiv e-prints, arXiv:2207.10034
- Schaerer et al. (2020) Schaerer, D., Ginolfi, M., Béthermin, M., et al. 2020, A&A, 643, A3
- Shaw et al. (1998) Shaw, R. A., de La Pena, M. D., Katsanis, R. M., & Williams, R. E. 1998, in Astronomical Society of the Pacific Conference Series, Vol. 145, Astronomical Data Analysis Software and Systems VII, ed. R. Albrecht, R. N. Hook, & H. A. Bushouse, 192
- Smit et al. (2018) Smit, R., Bouwens, R. J., Carniani, S., et al. 2018, Nature, 553, 178
- Sommovigo et al. (2022a) Sommovigo, L., Ferrara, A., Carniani, S., et al. 2022a, MNRAS, 517, 5930
- Sommovigo et al. (2022b) Sommovigo, L., Ferrara, A., Pallottini, A., et al. 2022b, MNRAS, 513, 3122
- Spilker et al. (2018) Spilker, J. S., Aravena, M., Béthermin, M., et al. 2018, Science, 361, 1016
- Stark et al. (2017) Stark, D. P., Ellis, R. S., Charlot, S., et al. 2017, MNRAS, 464, 469
- Steidel et al. (2014) Steidel, C. C., Rudie, G. C., Strom, A. L., et al. 2014, ApJ, 795, 165
- Stott et al. (2016) Stott, J. P., Swinbank, A. M., Johnson, H. L., et al. 2016, MNRAS, 457, 1888
- Sugahara et al. (2022) Sugahara, Y., Inoue, A. K., Fudamoto, Y., et al. 2022, ApJ, 935, 119
- Sun et al. (2022) Sun, F., Egami, E., Fujimoto, S., et al. 2022, arXiv e-prints, arXiv:2204.07187
- Swinbank et al. (2014) Swinbank, A. M., Simpson, J. M., Smail, I., et al. 2014, MNRAS, 438, 1267
- Tacchella et al. (2022) Tacchella, S., Johnson, B. D., Robertson, B. E., et al. 2022, arXiv e-prints, arXiv:2208.03281
- Tadaki et al. (2018) Tadaki, K., Iono, D., Yun, M. S., et al. 2018, Nature, 560, 613
- THE CASA TEAM et al. (2022) THE CASA TEAM, Bean, B., Bhatnagar, S., et al. 2022, arXiv e-prints, arXiv:2210.02276
- Topping et al. (2022a) Topping, M. W., Stark, D. P., Endsley, R., et al. 2022a, arXiv e-prints, arXiv:2208.01610
- Topping et al. (2022b) —. 2022b, MNRAS, 516, 975
- Trump et al. (2022) Trump, J. R., Arrabal Haro, P., Simons, R. C., et al. 2022, arXiv e-prints, arXiv:2207.12388
- Tsukui & Iguchi (2021) Tsukui, T., & Iguchi, S. 2021, Science, 372, 1201
- Valentino et al. (2022) Valentino, F., Brammer, G., Fujimoto, S., et al. 2022, ApJ, 929, L9
- Vallini et al. (2020) Vallini, L., Ferrara, A., Pallottini, A., Carniani, S., & Gallerani, S. 2020, MNRAS, 495, L22
- Vallini et al. (2021) —. 2021, MNRAS, 505, 5543
- Vallini et al. (2015) Vallini, L., Gallerani, S., Ferrara, A., Pallottini, A., & Yue, B. 2015, ApJ, 813, 36
- Watson et al. (2015) Watson, D., Christensen, L., Knudsen, K. K., et al. 2015, Nature, 519, 327
- Witstok et al. (2022) Witstok, J., Smit, R., Maiolino, R., et al. 2022, MNRAS, 515, 1751
- Zhang et al. (2016) Zhang, Z.-Y., Papadopoulos, P. P., Ivison, R. J., et al. 2016, Royal Society Open Science, 3, 160025
- Ziparo et al. (2022) Ziparo, F., Ferrara, A., Sommovigo, L., & Kohandel, M. 2022, arXiv e-prints, arXiv:2209.06840
- Zitrin et al. (2009) Zitrin, A., Broadhurst, T., Umetsu, K., et al. 2009, MNRAS, 396, 1985
- Zitrin et al. (2015) Zitrin, A., Fabris, A., Merten, J., et al. 2015, ApJ, 801, 44
- Zurita et al. (2000) Zurita, A., Rozas, M., & Beckman, J. E. 2000, A&A, 363, 9