The High resolution Fe K Spectrum of Cygnus X-3
Abstract
We analyze features of the Fe K spectrum of the high mass X-ray binary Cygnus X-3. The spectrum was obtained with the Chandra High Energy Transmission Grating Spectrometer in the third diffraction order. The increased energy resolution of the third order enables us to fully resolve the Fe XXV He complex, the Fe XXVI Ly lines and features of the radiative recombination continua. The emission line spectrum shows the expected features of photoionization equilibrium, excited in the dense stellar wind of the companion star. We detect discrete emission from innershell transitions, in addition to absorption likely due to multiple unresolved transitions in lower ionization states. The emission line intensity ratios observed in the range of the spectrum occupied by the Fe XXV forbidden and intercombination lines suggest that there is a substantial contribution from resonantly scattered innershell emission from the Li- and Be-like ionization states.
The Fe XXV forbidden and intercombination lines arise in the ionization zone closest to the compact object, and since they are not subject to radiative transfer effects, we can use them in principle to constrain the radial velocity amplitude of the compact object. We infer that the results indicate a compact object mass of the order of the mass of the Wolf-Rayet companion star, but we note that the presence of resonantly scattered radiation from Li-like ions may complicate the interpretation of the He-like emission spectrum.
1 Introduction
Cygnus X-3 is a high mass X-ray binary with a short orbital period of 4.8 hours (Liu et al., 2006). Cygnus X-3’s companion is a WN4-7 Wolf-Rayet (WR) star (Koljonen & Maccarone, 2017). This WN4-7 WR star produces a massive stellar wind. Past literature on Cygnus X-3 has estimated the stellar wind to have a velocity of the order of 1000 km s-1. This wind is heavily ionized by X-ray radiation from the compact object. A notable feature of Cygnus X-3 is the ambiguity surrounding the exact nature of the compact object as existing limits on the mass of the compact object do not rule out either possibility - neutron star or black hole.
The 1.5–10 keV spectrum of Cygnus X-3, observed with the Chandra High Energy Transmission Grating Spectrometer (HETGS) exhibits a detailed discrete emission spectrum (Paerels et al., 2000). Distinct features of the spectrum, like the existence of narrow radiative recombination continua and the intensity ratio of the He-like emission lines are consistent with the properties of cool, optically thin photoionized gas in photoionization equilibrium (Liedahl & Paerels, 1996; Kawashima & Kitamoto, 1996; Paerels et al., 2000). Most recently, Kallman et al. (2019) have analyzed the full 1-7 keV spectrum observed with HETGS in terms of a detailed spectroscopic model for X-ray photoionized gas.
The spectrum shows a net redshift of approximately 800 km s-1 (Paerels et al., 2000) (550 km s-1 according to Stark & Saia (2003)), establishing that the ionization in the wind is asymmetric. These features of the wind (and its outflowing nature) are supported by the existence of P Cygni profiles (with blue-shifted absorption) in multiple emission lines. Vilhu et al. (2009) suggest that the modulation of the broadband X-ray light curves from Cygnus X-3, if any, can be attributed to electron scattering in the asymmetric wind.
In order to correctly measure the Doppler modulation of the compact object with respect to the WR star, we need to analyze emission from gas located as close as possible to the compact object/X-ray continuum source. We can approximately identify the distribution of emission lines with radial distance from the compact object using the ionization parameter. The degree of photoionization is governed by the density of the gas through the ionization parameter , which is proportional to the ionizing flux and inversely proportional to the particle density, (Tarter et al., 1969). With an ionizing source placed off-center in an outflowing wind, one generally expects an ionization structure centered on the X-ray source, with ionization parameter decreasing away from the X-ray source (Hatchett & McCray, 1977). The ionization distribution will be asymmetric with respect to the X-ray source, with a shape depending on the density distribution. The region of highest ionization, however, for most reasonable wind models, is compact and approximately spherical, centered on the X-ray source.
Therefore, if we intend to calculate the compact object’s orbital velocity (and by extension, mass) in congruence with binary phase, we have to analyze the Fe XXV and Fe XXVI lines.
Past attempts to analyze the Fe XXV and Fe XXVI lines have often considered the Fe XXV spectrum as a single unit due to limits on Chandra’s wavelength resolution (0.012 in the first order of the high dispersion grating) and the closeness of individual lines in the Fe He complex (the full range of the Fe XXV spectrum only spans 1.5 first order HETG resolution elements). However, without better resolution, the Doppler shifts in the Fe XXV complex cannot be separated uniquely for the different components of the emission line complex: the forbidden (z), intercombination (x,y), and resonance (w) lines of Fe XXV. This is also discussed in Vilhu et al. (2009), who do not work with Fe XXV due to the possibility of selective absorption in the lines as a function of orbital phase.
While third order spectra have lower intensity, the Cygnus X-3 spectrum is bright enough to discern most elements of the Fe XXV and Fe XXVI complexes. Resolving individual lines is especially important in Doppler modulation calculations as selective absorption and scattering of such lines as a function of phase generates erroneous results. In this paper, we follow up on results from past literature with an analysis of the third order HETGS Fe K spectrum. Using the third order enables us to analyze features of the Fe spectrum with three times the resolving power of the first order. At 6700 eV (Å), the energy of the Fe XXV resonance line, the resolving power in third order is .
In the following, we will first discuss the general nature of the Fe K spectrum in Cyg X-3. The HETGS spectrum currently is the only fully resolved Fe K spectrum in photoionization equilibrium from an astrophysical source, and it serves as an important template for the Fe K spectra of radiation-driven emission line sources in general, such as we may expect from accreting sources of all varieties, including AGN. We then turn to a detailed analysis of the optically thin emission lines, deriving constraints on the radial velocity curve for these lines. We conclude by interpreting the radial velocity constraints in terms of a lower limit on the mass of the compact object, in terms of the mass of the WR companion. The most likely limits place the mass of the compact object at , arguing for a Black Hole.
2 Observation and Data Reduction
| ObsID | Exp. mode | Date | Net exp. (ks) |
|---|---|---|---|
| 6601 | TE | 2006-01-26 | 49.56 |
| 7268 | CC | 2006-01-25 | 69.86 |
For our analysis, we extracted data from the Chandra X-ray Observatory archive. In particular, we worked with one CC mode dataset and one TE mode dataset from a high state of Cygnus X-3. Table 1 contains ObsID and exposure time details of the datasets. These datasets comprise about 75% of all counts obtained with HETGS on Cyg X-3 to date. Both the data sets have been used extensively by Vilhu et al. (2009) and Kallman et al. (2019). After downloading the datasets from the archive, we reprocessed the datasets (using the CIAO thread chandra_repro). We then barycenter-corrected the reprocessed files in order to account for effects due to the Earth’s orbit around the Sun and Chandra’s orbit around Earth. Following this, we created Good Time Intervals (GTIs) and aligned them if required (we aligned ObsID 6601 data). Finally, we divided the spectrum into phase bins and analyzed the third order phase-binned datasets using custom-written Python code. We combined the grating spectra from the two obsid’s before analysis and divided the spectrum into two phase bins using the CIAO command combine_grating_spectra.
The complete imaging TE mode data is more vulnerable to pileup associated with the finite spatial and temporal resolution of the CCD detectors than the Continuous Clocking, or CC, mode data. Pileup is defined as the coincidence of two or more photons per CCD readout time, or frame-time, within an event-detection cell. The detector will be unable to temporally resolve two or more photons, resulting in a charge deposition (’pulse height’) that is roughly the sum of the pulse heights of the individual photon events. Hence, in the presence of pileup, the event-detection rate will be lower, and the observed spectrum will be distorted toward higher energies. As a result, the observed count rate in very bright areas of the spectrum will be lower than the incident count rate.
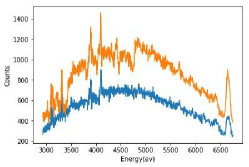
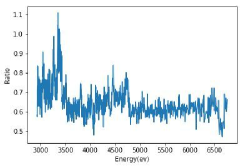
Therefore, ObsID 6601 is more vulnerable to pileup. According to Kallman et al. (2019), the high-energy grating (HEG) arm of the ObsID 6601 high-energy transmission grating (HETG) spectrum is relatively unaffected by pileup. Since the Fe K lines are located above 6 keV, we use the HEG arm for all our data analyses. Regardless, we performed our own analysis of the spectrum for pileup, in order to verify the results obtained by Corrales & Paerels (2015). We utilized data from the brightest region of the spectra (3-5 keV) from both observations (see Figure 1). Note that the third order Fe K photons (6600-6700 eV) will be superimposed on the first order 2200-2333 eV energy range. We can understand whether ObsID 6601 is significantly affected by pileup by analyzing anomalies in the following ratio for every bin: where is the number of counts in that bin, in obsid 6601 and 7268, respectively.
Figure 1 contains the result of this analysis for photon energies 2.9-6.7 keV. Since the observed count rate in very bright areas would be lower than the incident count rate for ObsID 6601 (this is not the case for ObsID 7268), a sustained statistically significant (at least ) negative deviation from the mean ratio in a very bright region would be evidence of pileup. In Figure 1, the mean ratio () = 0.661 and = 0.084. - 3 0.44. However, nowhere between 2.9-6.7 keV does drop below 0.44. As a result, we conclude there is no significant pileup in the HEG arm of the ObsID 6601 dataset.
3 Analysis
3.1 The Phase-averaged Fe K Spectrum

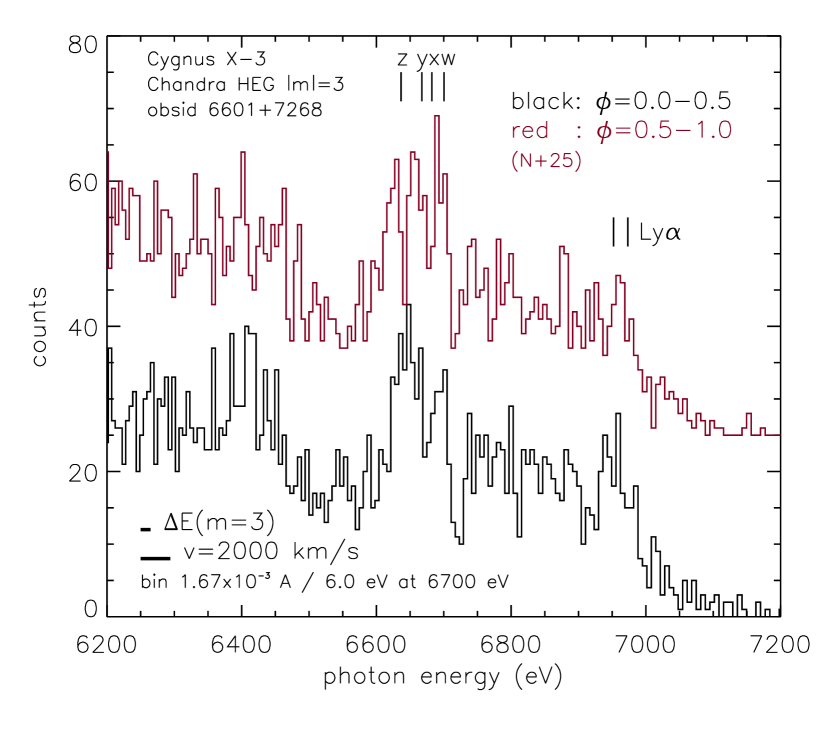
In Figure 2 we show the 6200–7200 eV range of the third order HETGS/HEG spectrum, both obsids combined, positive and negative orders added, binned in 0.0017Å bins (6.0 eV at 6600 eV). The summed spectrum covers approximately 6.9 binary orbits. Several features of this spectrum are noteworthy; note that we indicate the rest frame energies for all features in Figure 2, not yet taking account of orbital Doppler shifts. We see strong line emission from the He- and H-like ionization stages of Fe. The H-like Fe Ly transition is marginally resolved into its two fine structure components. The four prominent transitions in He-like Fe are resolved: the resonance line (w), the two intercombination lines (x,y), and the forbidden line (z) (Gabriel & Jordan, 1969; Porquet et al., 2010). The resonance line shows a prominent P Cygni profile. We have also marked the rest-frame positions of innershell transitions in the lower charge states, close to the He-like spectrum. These are the lines marked v, u, r, q, t, and . We list all relevant transitions in the He-, Li-, and Be-like ions in the photon energy range 6600-6700 eV in Table 2.
| symbol | energy (eV) aameasured energy, from Rudolph et al. (2013), except , , and , from Decaux et al. (1997) | ion | transition | bboscillator strength , from Palmeri et al. (2003) | cctheoretical fluorescence yield, from Palmeri et al. (2003) | type |
|---|---|---|---|---|---|---|
| v | 6613.31 | Li-like | – | 0.997 | IE | |
| u | 6616.629 | Li-like | – | 0.975 | IE | |
| 6628.804 | Be-like | – | 0.780 | IE | ||
| z | 6636.78 | He-like | – | 1.00 | forbidden | |
| r | 6652.826 | Li-like | – | 0.876 | IE | |
| q | 6662.240 | Li-like | – | 1.00 | IE | |
| y | 6667.671 | He-like | – | 1.00 | intercombination | |
| t | 6676.202 | Li-like | – | 0.733 | IE | |
| x | 6682.67 | He-like | – | 1.00 | intercombination | |
| w | 6700.549 | He-like | – | 1.00 | resonance |
As expected, the general character of the discrete Fe spectrum is very clearly that of a radiation driven plasma (Liedahl & Paerels, 1996; Kawashima & Kitamoto, 1996; Paerels et al., 2000; Kallman et al., 2019). To date, the only detailed astrophysical Fe K emission spectra observed have been those of the Sun (Solar flares, e.g. Phillips (2004)), and of the core of the Perseus cluster, which was observed with the microcalorimeter spectrometer on Hitomi in 2016 (Hitomi Collaboration, 2016). Both of these are examples of plasmas in which collisional excitation and ionization dominate.
In a collisional plasma, collisional excitation dominates over recombination-driven excitation, and the resonance line, w, is brighter than the forbidden and intercombination lines. But the latter are prominent in the spectrum of Cygnus X-3, as is expected in a photoionized plasma in which recombination excitation dominates (Porquet et al., 2010). In pure photoionization/recombination equilibrium in low-density plasma, the forbidden line is expected to be much brighter than the intercombination lines. In their analysis of the spectrum, Kallman et al. (2019) converged on a model for the photoionized plasma that predicts Fe XXV emission line intensity ratio’s and ; this model assumes that the plasma has low density and is optically thin. From Figure 2, it appears that, instead, the intercombination lines are the strongest. The fact that the resonance line is observed to be much brighter than the photoionization model predicts suggest that the resonance line intensity is mostly produced by resonance scattering of continuum photons in the wind. The resonance line is in fact seen to exhibit a clear P Cygni profile.
The apparent observed ’inverted’ ratio of forbidden to intercombination line emission suggests that, as is the case in other sources (see Porquet et al. (2010) and references therein), the population of the upper state of the transition may be transferred to the upper states of the transitions faster than spontaneous radiative decay in the transition can occur. This can be brought about by electron thermal collisions at high densities or by absorption of photons. The energy difference between the upper states of and in Fe XXV is 45.7 and 31.0 eV (i.e. the extreme ultraviolet [EUV]), respectively, and it therefore requires a plasma of temperature a few dozen eV, or an intense EUV radiation field, for this process to operate. Alternatively, the innershell transitions in the Li- and Be-like ions may scatter continuum photons in the wind, giving rise to P Cygni line profiles, as is seen in the resonance line. We examine each mechanism in turn.
We first examine transfer between the upper states of and by photoexcitation by EUV photons. Such photons could originate in the accretion flow or in the photosphere of the Wolf-Rayet star. The spontaneous decay rate for the level to ground is s-1 (Drake, 1971). The photoexcitation rate in a radiation field with energy flux density (erg cm-2 s-1 Hz-1) is (rate, per atom per unit time):
| (1) |
with the frequency of the transition, Planck’s constant, the oscillator strength, the electron charge (e.s.u.), the electron mass, and the velocity of light. The oscillator strength for the transition is (Sanders & Kight, 1989). Assuming an accretion luminosity , emitted approximately as a blackbody with keV (Kallman et al., 2019), we find a radiating surface area cm2, with the luminosity in units erg s-1. At Hz, we find a photon flux at distance from the source photons cm-2 s-1 Hz-1. In the Fe XXV ionization zone, we expect a photoionization parameter erg cm s-1 (Kallman & Bautista, 2001). Substituting, we find , and thus s-1. Here, , and we have used a fiducial value for the density in the WR wind near the compact object of cm-3, with the mass loss rate in yr-1, the distance from the center of the WR star in units cm, and the wind velocity in units 1000 km s-1. We conclude that the photoexcitation rate due to accretion radiation is much too small to suppress the forbidden line. For an analogous calculation for the rate induced by photospheric radiation from the WR star we assume K, , and use model MW/WNL H20 13-19 from Todt et al. (2015), quoted in Koljonen & Maccarone (2017), for the WR photospheric emission spectrum. These are likely to be upper limits to the stellar effective temperature and luminosity. We find for the photoexcitation rate s-1, where is the WR photospheric flux near 38 eV (326 Å) in units erg cm-2 s-1 Å-1. We conclude again that photoexcitation is not sufficient to suppress ; note that this rate cannot be increased much, since the stellar radius of the WR star is in fact of order cm, and it appears unlikely that the photospheric EUV flux has been underestimated by a factor 200 or more.
We now examine collisional transfer by thermal electrons in the photoionized gas. The temperature in the Fe XXV zone is expected to be of order 100 eV (Kallman & Bautista, 2001), so electrons with sufficient kinetic energy are available. The density required for electron collisions to compete with spontaneous deexcitation of the state in the He-like Fe ion is approximately cm-3 (Porquet et al., 2010). The fiducial density of the wind near the compact object is of order cm-3, however, so if collisional transfer is indeed responsible for the observed low value of the ratio of the forbidden-to-recombination line intensities, the emission would have to arise from very dense clumps very close to the compact object, so that one can have while cm-3. Such a large density contrast of order appears unreasonable.
The innershell transitions in the Li- and Be-like ions have large oscillator strengths; in these highly charged ions, the presence of one or a few electrons in does not change the transition probability much. For the highest charge states in the L-shell ions, the fluorescence yield is high, and autoionization following excitation is unimportant. These highest charge ions can therefore resonantly scatter continuum photons almost as effectively as . We suggest that this effect is what we observe in the spectrum of Cyg X-3: emission in the spectral range occupied by the intercombination lines and the resonance line is dominated by resonance scattering driven emission in the wind of the WR star, by the line and the innershell transitions in the Li- and possibly Be-like ions. Only (part of) the spectral window, near the forbidden transition, is not affected by radiative transfer.
At slightly lower energies, innershell absorption by B-like and lower charge states will often result in destruction of the photons by because the ion relaxes by autoionization (’resonant Auger destruction’, Ross et al. (1996)), and this may explain the shallow apparent absorption trough between 6450 and 6600 eV. The corresponding ranges of transitions in the B- through F-like ions observed in laboratory experiments have been indicated in Figure 2 (Decaux et al. (1997); their Table 1). Kallman et al. (2019) pointed out the presence of this absorption in their analysis of the first-order HETGS spectrum. We also note that net absorption may also result if the absorbing material is not spherically symmetrically distributed even if the photons are only scattered and not destroyed.
3.2 Radiative Recombination Continua
The Fe XXV and Fe XXVI Radiative Recombination Continua are located (theoretically) above 8.828 keV and 9.872 keV, respectively. While we were able to identify a weak feature as the Fe XXV radiative recombination continuum (RRC) close to 8.828 keV, the Fe XXVI RRC at 9.87 keV was undetectable due to noise. The Fe XXV RRC at 8.83 keV is shown in Figure 3. We can use this feature to set some limits on the electron temperature in the ionization zone in which the hydrogenic Fe ion (the source for the recombination radiation) dominates.
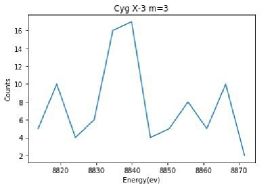
The limited number of photons made it awkward to fit an explicit skewed shape, convolved with the spectrometer response, to the feature. Very roughly, the photon emissivity in the recombination continuum is comparable to the emissivity in the complex. The spectrometer resolution at 8.83 keV is approximately 26 eV. If the electron temperature in the H-like Fe zone were of order the instrument resolution, we should have seen a narrow peak. The low contrast observed at the edge instead indicates that the recombination photons are likely spread out over several times the spectrometer resolution. This is consistent with the predictions from photoionization models, which estimate that the electron temperature in the H-like Fe ionization zone should be of order 100 eV (Kallman & Bautista, 2001). That is hotter than the eV obtained for the lower ionization zones (Paerels et al., 2000), as expected.
We can also use an estimate of the total emissivity in the RRC to predict how bright the emission lines should be if the spectrum shows only pure recombination emission from a low-density plasma. In the limit of , with the ionization potential, the integral over the photon emissivity in the RRC works out to
| (2) |
with the monochromatic emissivity (keV-1) in the RRC at the edge (), and in keV. We estimate a net monochromatic emissivity of counts keV-1 at the edge. Since this is formally no more than a 2 result, we treat the measurement as an upper limit, and calculate a 3 upper limit of counts keV-1. The upper limit to the total number of RRC counts is therefore counts. Recombination calculations for ionization parameter in the range predict (Kallman, 2022). Scaling with the effective area of the HETG, we predict 1745 counts (3 upper limit) in the and lines. We see roughly 300 counts, well below the upper limit. That means that the RRC upper limit is too weak to constrain the prediction for the line emissivities to the point that the measured line counts positively require the presence of significant additional contributions to the line counts, beyond pure recombination excitation.
4 Doppler modulation of the He-and H-like Fe Line complexes
The Fe XXV and Fe XXVI emission lines should arise closest to the compact object. In photoionization equilibrium, the He-like ionization zone is expected to be located at a distance cm, while the binary separation is cm, if we assume equal masses of for both binary components. Note that for recombination driven emission by ionization stage , the source for the emission is the ionization stage, which places the emitting plasma closer to the source than the nominal ionization zone for stage . The emission lines from the highest ionization stages of Fe therefore in principle offer the best way to constrain the orbital motion of the compact object, and hence its mass. In the previous section, however, we have found that it is likely that the emission in the lines with the largest transition probabilities is likely to be affected by scattering of continuum photons, and subsequent resonance scattering. The observed emission profile of the line shows direct evidence for this effect, by exhibiting a P Cyg profile. The scattering of continuum photons will still produce emission coupled to the distribution of the scattering ions, but multiple scattering may couple different regions of the wind, with a likely complicated distribution with respect to the center of mass of the binary, and a complex orbital velocity structure. This argument disqualifies the line from consideration, and likely also the Fe XXVI Ly lines.
Our original motivation for detailed analysis of the He-like spectrum was the fact that the intercombination and forbidden lines have much smaller transition probabilities, and are therefore most likely to remain optically thin, and should trace the motion of the compact object. But we find that the presence of emission from the Li- and Be-like ions complicates this idea: the spectral range of the , and lines is likely contaminated by scattered light in innershell transitions of the Li- and Be- like ions.
But since there is no other probe of the motion of the compact object, we will still formally analyze the phase resolved spectrum for Doppler shifts. A full model for the excitation and radiative transfer through the wind would be needed to interpret the measurements in terms of the properties of the compact object. But if the scattering in the Li- and Be- like ions is modest, and the Li- and Be-like ionization zones are approximately spherically symmetric and centered on the compact object, any Doppler shift could be interpreted more directly. We will therefore carry out a Doppler-shift measurement for the spectral range of the , and lines.
In view of the limited statistics of the spectra, we chose to cross-correlate the spectrum binned in two phase intervals covering the expected largest red- and blueshift of the Fe lines (which should occur at phases 0.75 and 0.25, respectively).
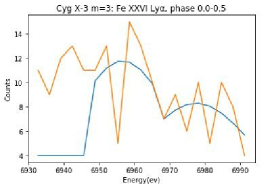
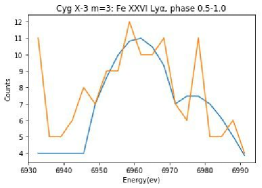
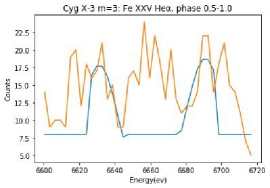
In Figure 4, we display the high resolution spectrum separated into two orbital phase bins, phase , when the compact object is approaching us (the compact object is in front at phase 0.5), and when the compact object is receding.
In order to estimate the Doppler modulation of a group of lines or any individual line, we fit a Gaussian to the line in both phase-binned spectra, and proceeded to evaluate the circular cross correlation of the two phase-binned Gaussian fits. We opted for this route instead of directly cross correlating the data as both the Fe XXVI Ly and Fe XXV He spectra are very noisy in the third order. The discrete circular cross correlation was evaluated by wrapping the two spectra onto each other and then evaluating the discrete cross correlation. The shift at which the cross correlation coefficient reaches a statistically significant () global maximum is considered to be the Doppler shift between the two spectra. In order to avoid skewing the standard deviation () by a huge margin, the value of the bins which have not been acted upon by the Levenberg-Marquardt Gaussian fitting algorithm have been set to a value greater than or equal to the average photon count in those regions. The expected variance in the cross-correlation coefficient was estimated by propagating Poissonian counting statistics.
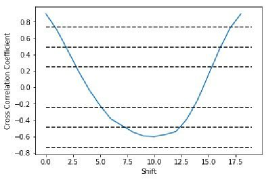
In Figure 5 we show the Gaussian fits to Fe XXVI Ly and Ly, for the two phase bins. Figure 6 shows the cross correlation coefficient between these two fits, as a function of wavelength shift. We calculated the cross correlation coefficient over the 6945-6990 eV range, and shifted in increments of 3 eV, or km s-1. From Figure 6, we can conclude that the cross correlation coefficient for the two Fe XXVI Ly lines reaches its global maximum (statistically significant) at zero Doppler shift. The cross-correlation falls below the deviation from zero (no correlation) at a shift of velocity bins or km s-1 (the full offset between one spectrum and the other, so double the orbital velocity of the emission line source). Vilhu et al. (2009) determined an orbital velocity from the Ly lines, using the first order HEG spectrum, of km s-1. For both the first and third spectral order radial velocity measurements in Ly to be consistent, we would have to assume that the radial velocity amplitude is in fact near the upper end of our upper limit.
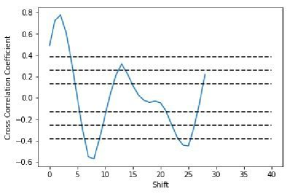
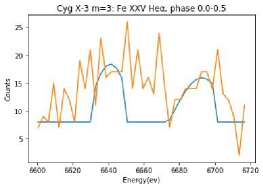
Figure 7 shows the corresponding Gaussian fit to the Fe XXV spectrum (fits to the intercombination and forbidden lines). In Figure 8, the cross correlation coefficient for the lines reaches a statistically significant global maximum (=0.78) at a shift of bins or km s-1. The full range of shifts consistent with positive correlation at more than is bins, or km s-1. There also appears to be a significant apparent anti-correlation at shifts of 8 and 25 bins, or 1080 and 3375 km s-1, respectively. This probably reflects the fact that there is in fact significant emission from scattering by the innershell transitions in the Li- and Be-like ions, which is likely to have a non-trivial orbital phase dependence.
We find that the Fe XXVI Ly lines, integrated over phase interval 0.0-0.5, and 0.5-1.0 (compact object approaching and receding, respectively) appear to show no significant Doppler offset between the two phase intervals, with the maximum positive correlation between the spectra occurring for a range of velocity shifts of km s-1 (3). We will try to estimate the effect of integrating over such a wide phase interval, by computing the average of the radial velocity over half an orbit, in units of the maximum radial velocity. For uniform emissivity as a function of phase, that reduction is by a factor , so that our estimate for the maximum allowed radial velocity range for the compact object is km s-1, or a maximum orbital velocity (assuming a circular orbit) of km s-1.
The same reasoning applied to the intercombination and forbidden emission lines in the He-like ion yields a maximum orbital velocity range of 848 km s-1, or a maximum orbital velocity of km s-1.
If we take these limits at face value, as upper limits to the orbital velocity of the compact object, we arrive at the following conclusion. The fact that the compact object does not exhibit a measurable radial velocity in our data translates into a lower limit on its mass, , of , with the orbital velocity of the WR star, its mass, and our upper limit to the orbital velocity of the compact object. Koljonen & Maccarone (2017) recommend a range for the probable mass for the WR star of (), while the radial velocity (half the full range) is km s-1. That translates into a nominal lower limit on the mass of the compact object of using the Ly lines, or using the He-like Fe forbidden and intercombination lines.
5 Discussion
We extend the spectroscopic study of the X-ray line emission of Cygnus X-3 from the mid- elements to the Fe K band, using the third diffraction order of the Chandra HETGS/HEG spectrum. Previous studies (Paerels et al., 2000; Kallman et al., 2019) have shown that the discrete emission in the mid-Z elements arises from recombination excitation in the photoionized wind of the Wolf-Rayet star.
The spectrum in the eV band shows line emission from the He- and H-like Fe ions. The intensity ratios of the four transitions in the He-like ion suggest that there is a contribution from innershell emission from the Li- and possibly the Be-like ions as well. We detect a clear P Cygni profile in the He-like resonance line (), direct evidence confirming that the line emission is excited in the highly ionized WR wind, in the vicinity of the compact object. We detect broad absorption in the eV band, which may be due to multiple innershell transitions in the lower-charge members of the Fe L shell series.
The appearance of a P Cygni profile in the He-like resonance line indicates that there is likely to be a finite contribution in emission from resonance scattering of continuum photons in the wind. By extension, a similar effect may contribute to the H-like Ly emission lines (we do not have sufficient flux to detect a P Cyg signature in these lines, directly probing the optical depth of the wind). The only optically thin transitions likely to trace the motion of the compact object are therefore the He-like forbidden transition (), and possibly the intercombination lines ().
The intensity ratios in the He-like transitions do not conform to the expectation for an optically thin, low density recombining plasma. The line, as we noted above, clearly shows a contribution from resonance scattering of continuum photons, so it is much brighter than expected from pure recombination. The forbidden line would be expected to be the brightest of the four transitions. Instead, we see comparable fluxes in , and . We show that the usual mechanisms that can transfer flux from to and (radiative excitation by UV photons, or collisional excitation by thermal electrons) are not viable in this case. This suggests there may be a finite contribution from resonance scattering by innershell transitions the Li- Be-like ions, of the type and , respectively, which have similar transition energies to the He-like forbidden and intercombination lines.
Unfortunately, we can not estimate the line fluxes produced by pure recombination, to quantify the contamination by resonance scattering in the Li- and Be-like ions. The only clean, optically thin signature is the radiative recombination continuum (clearly detected in the mid- elements), but the spectrum is too faint to constrain its total flux. We find an upper limit to the total recombination-driven line fluxes that is above the detected fluxes.
Though we suspect contamination by scattered photons (and noting that recombination-excited and scattered photons arise from different ionization stages), we performed a radial velocity study on the H-like Ly lines. In the He-like spectrum, we used the range for the and lines ( and have very small radiative transition probabilities). We cross-correlated the emission line profiles obtained in two phase bins, centered on maximum approaching and receding radial velocity of the compact object. We find no clearly detectable Doppler modulation. In fact, the Doppler shift between the two phases is consistent with zero, with upper limits on the orbital radial velocity of the compact object of 150 km s-1 in Ly (assuming a circular orbit). The corresponding upper limit to the orbital radial velocity of the compact object in the He-like lines is 424 km s-1. With no radial velocity modulation detected, we then infer a lower limit on the mass of the compact object, simply from the ratio of radial velocities of the binary components and an estimate for the mass of the WR star, of , but bearing in mind that the emission line spectrum may be complicated by radiative transfer.
Acknowledgements
We gratefully acknowledge discussions with Tim Kallman, Duane Liedahl, and Mike McCollough.
References
- Corrales & Paerels (2015) Corrales, L. R., & Paerels, F. 2015, MNRAS, 453, 1121
- Decaux et al. (1997) Decaux, V., Beiersdorfer, P., Kahn, S. M., & Jacobs, V. L. 1997, ApJ, 482, 1076
- Drake (1971) Drake, G. W. 1971, Phys. Rev. A, 3, 908
- Gabriel & Jordan (1969) Gabriel, A. H., & Jordan, C. 1969, MNRAS, 145, 241
- Hatchett & McCray (1977) Hatchett, S., & McCray, R. 1977, ApJ, 211, 552
- Hitomi Collaboration (2016) Hitomi Collaboration. 2016, Nature, 535, 117
- Kallman (2022) Kallman, T. 2022, XSTAR Home Page. https://heasarc.gsfc.nasa.gov/docs/software/xstar/xstar.html
- Kallman & Bautista (2001) Kallman, T., & Bautista, M. 2001, ApJS, 133, 221
- Kallman et al. (2019) Kallman, T., McCollough, M., Koljonen, K., et al. 2019, ApJ, 874, 51
- Kawashima & Kitamoto (1996) Kawashima, K., & Kitamoto, S. 1996, PASJ, 48, L113
- Koljonen & Maccarone (2017) Koljonen, K. I. I., & Maccarone, T. J. 2017, MNRAS, 472, 2181
- Liedahl & Paerels (1996) Liedahl, D., & Paerels, F. 1996, ApJ, 468, L33
- Liu et al. (2006) Liu, Q. Z., van Paradijs, J., & van den Heuvel, E. P. J. 2006, A&A, 455, 1165
- Paerels et al. (2000) Paerels, F., Cottam, J., Sako, M., et al. 2000, ApJ, 533, L135
- Palmeri et al. (2003) Palmeri, P., Mendoza, C., Kallman, T. R., & Bautista, M. A. 2003, A&A, 403, 1175, doi: 10.1051/0004-6361:20030405
- Phillips (2004) Phillips, K. J. H. 2004, ApJ, 605, 921
- Porquet et al. (2010) Porquet, D., Dubau, J., & Grosso, N. 2010, Space Sci. Rev., 157, 103
- Ross et al. (1996) Ross, R. R., Fabian, A. C., & Brandt, W. N. 1996, MNRAS, 278, 1082
- Rudolph et al. (2013) Rudolph, J. K., Bernitt, S., Epp, S. W., et al. 2013, Phys. Rev. Lett., 111, 103002, doi: 10.1103/PhysRevLett.111.103002
- Sanders & Kight (1989) Sanders, F. C., & Kight, R. E. 1989, Phys. Rev. A, 39, 4387
- Stark & Saia (2003) Stark, M., & Saia, M. 2003, ApJ, 587, L101
- Tarter et al. (1969) Tarter, C. B., Tucker, W. H., & Salpeter, E. E. 1969, ApJ, 156, 943
- Todt et al. (2015) Todt, H., Sander, A., Hainich, R., et al. 2015, A&A, 579, A75
- Vilhu et al. (2009) Vilhu, O., Hakala, P., Hannikainen, D. C., McCollough, M., & Koljonen, K. 2009, A&A, 501, 679