The Rise of Age-Friendly Jobs111 The authors are grateful to participants at the Economics of Longevity conference, London Business School 2022 and an anonymous referee for helpful comments and suggestions, and to the Department of Economics, Massachusetts Institute of Technology (MIT), the Center for Research in Econometric Analysis of Time Series (CREATES), the Dale T. Mortensen Center, Aarhus University, the Danish Council for Independent Research (Grant 0166-00020B), the ESRC (Grant T002204), and the Hewlett Foundation for research support.
Daron Acemoglu111Department of Economics and Center for Shaping the Future of Work, MIT. Email: daron@mit.edu. Nicolaj Søndergaard Mühlbach222Department of Economics, MIT, and CREATES. Email: muhlbach@mit.edu.
Andrew J. Scott333Department of Economics, London Business School and CEPR. Corresponding Author. Email: ascott@london.edu.
This version: 1st March 2024
In 1990, one in five U.S. workers were aged over 50 years whereas today it is one in three. One possible explanation for this is that occupations have become more accommodating to the preferences of older workers. We explore this by constructing an “age-friendliness” index for occupations. We use Natural Language Processing to measure the degree of overlap between textual descriptions of occupations and characteristics which define age-friendliness. Our index provides an approximation to rankings produced by survey participants and has predictive power for the occupational share of older workers. We find that between 1990 and 2020 around three quarters of occupations have seen their age-friendliness increase and employment in above-average age-friendly occupations has risen by 49 million. However, older workers have not benefited disproportionately from this rise, with substantial gains going to younger females and college graduates and with male non-college educated workers losing out the most. These findings point to the need to frame the rise of age-friendly jobs in the context of other labour market trends and imperfections. Purely age-based policies are insufficient given both heterogeneity amongst older workers as well as similarities between groups of older and younger workers. The latter is especially apparent in the overlapping appeal of specific occupational characteristics.
Keywords: Age Friendly; Ageing Society; Employment; Labor markets; Older Workers
JEL Classification: E24; J11; J24; J62
I. Introduction
In the U.S., the number of people aged over 50 years has risen from 65 million in 1990 to 118 million today and is expected to reach 155 million by 2050 (United Nations, 2019). Concurrently, 28 million of the 42 million increase in U.S. employment between 1990 and 2020, is accounted for by those aged between 50 and 74 years. As a result, workers aged over 50 years have gone from being one in five to one in three of the workforce.
These trends are accounted for by some combination of available jobs becoming more “age friendly” and older workers taking up employment in occupations previously performed by younger workers. Our purpose in this paper is to investigate the role of the former—the rising age-friendliness of available jobs. Doing so requires constructing a quantitative measure of occupational age-friendliness, a key contribution of this paper.
The importance of age-friendly jobs is twofold. First, by reducing the disutility of work, they should lead to greater involvement in the labour market for older workers, a key policy objective in an ageing society (Scott, 2022). Second, by creating opportunities that are most attractive to older workers, they minimise the impact on wages and employment at other ages (Card and Lemieux, 2001; Katz and Murphy, 1992) through the operation of comparative advantage. This is especially important given the large size of the “baby-boomer” cohort that started passing the 50-year mark in 1996. Reflecting these trends, the current OECD policy is to “promote employability of workers throughout their working lives” by “creating a supportive age-friendly working environment” (OECD, 2019).
The core idea of an “age-friendly working environment” is that older workers have distinct skills and preferences. Table 1 uses data from O*NET and shows that on average older workers are in occupations that differ in numerous ways from younger workers.111Based on employment peaking as a proportion of the population in the U.S. for the age group 45 to 49 years, this paper looks at four broad age categories: age group 15-24 (pre-career), 25-49 (prime working age), 50-64 (pre-retirement) and 65-74 (post-retirement). For instance, they are less likely to be in occupations that require physical exertion (physical and psychomotor abilities, work output, pace and scheduling); are more likely to involve responsibility for others; and experience less harsh environmental conditions and fewer job hazards. Conversely, they are more likely to be in occupations that provide a sense of accomplishment (recognition) and better overall working conditions. Table 1, however, reflects the nature of jobs undertaken and not necessarily those older people prefer. What is required is a way of determining what makes for an age-friendly job independent from employment data.
Age 15-24 25-49 50-64 65-74 Cognitive Abilities 0.419 0.451 0.450 0.449 Physical Abilities 0.211 0.175 0.170 0.156 Psychomotor Abilities 0.251 0.231 0.229 0.212 Sensory Abilities 0.285 0.296 0.296 0.291 Work Output 0.365 0.366 0.365 0.348 Communication 0.645 0.693 0.695 0.704 Conflictual Contact 0.417 0.406 0.403 0.405 Responsibility for Others 0.549 0.564 0.566 0.545 Environmental Conditions 0.291 0.283 0.284 0.261 Job Hazards 0.170 0.173 0.171 0.152 Pace and Scheduling 0.456 0.461 0.466 0.448 Recognition 0.317 0.425 0.422 0.428 Working Conditions 0.380 0.498 0.498 0.496 Notes: This table shows the average value for various O*NET occupational characteristics based on weighted employment across occupations by age group. The characteristics are drawn from various O*NET categories i.e. abilities, work activities, work styles, work context, and work values. The measure runs from 0 to 1 for each indicator with a higher number denoting the occupational attribute is more apparent. See Appendix A for additional information on O*NET and description of occupational characteristics.
A number of recent papers provide answers to this question using a variety of methodologies. Maestas et al. (2018) use state-preference experiments to elicit workers’ willingness to pay for different job attributes. They find older workers prefer jobs with greater autonomy (as measured by the ability to set their own schedule, work by themselves, etc.) as well as jobs that involve more moderate (relative to heavy) physical activity or more sitting.
Using both survey data as well as the probability of employment at age 70 years, Hudomiet et al. (2019) also examine the job characteristics preferred by older workers. They find that older workers have a strong preference for flexible working, reduced job stress, and less demanding cognitive and physical work as well as less commuting time and the opportunity to telecommute. The appeal of flexible working for older workers is also found by Ameriks et al. (2020) using survey questions. They find older workers are much more likely to accept a job if it offers flexibility in scheduling (60 per cent of non-working respondents would be willing to return to work if it offers a flexible schedule) and are prepared to accept significant declines in wages in order to find flexible work (20 per cent would accept a 20 per cent hourly wage reduction).
These studies help define which characteristics are important in making an occupation “age friendly” and reassuringly these differences are reflected in Table 1. Yet, they do not provide information as to which specific occupations workers consider age friendly. To achieve this, we need to create an occupational Age-Friendliness Index (AFI), which is the main contribution of the current paper.
Once we construct this index, we validate that it captures the relevant dimensions of age-friendliness by comparing it to a ranking obtained from a small-scale survey and also document that at the beginning of our sample, in 1990, older workers are disproportionately likely to be in age-friendly jobs (as well as at the end of 2020).
Our main empirical finding is to show a large increase in the age-friendliness of U.S. occupations between 1990 and 2020, with the average value of our index increasing by 8 per cent over this period. Using a Blinder-Oaxaca decomposition, we show this increase is driven in part by a rise in the relative share of occupations that were more age friendly in 1990 (the between component) but mostly through each occupation on average becoming more age friendly (the within component). We estimate that around three quarters of occupations have become more age friendly and employment in above-median age-friendly jobs has increased by 49 million.
The most striking pattern we document is that this notable increase in age-friendly jobs has not disproportionately benefited older workers. Many of these age-friendly jobs have been taken up by females and college graduates, as the occupational characteristics preferred by older workers (e.g., flexibility, office work, less strenuous demands, etc.) also appeal to these groups. Amongst older workers, the group most disadvantaged by this competition from younger groups is male non-graduates. We discuss possible reasons why this pattern may have arisen, despite the apparent comparative advantage of older workers for more age-friendly jobs.
The rest of the paper is organized as follows. Section II discusses the construction of our AFI, while Section III provides a validation of this index by comparing it to rankings by survey respondents and documenting its ability to predict occupations with higher shares of older workers. Section IV documents that U.S. occupations have become more age friendly, but also shows the puzzling feature that this has not disproportionately benefited older workers. It then discusses various explanations for why more age-friendly jobs have not been taken up by older workers. Section V concludes, while additional details are provided in the appendix.
II. Constructing an Age-Friendliness Index
Our aim in constructing an AFI is to derive a measure of the attractiveness of different occupations to older workers. The results of Maestas et al. (2018); Hudomiet et al. (2019); Ameriks et al. (2020) show which occupational characteristics older workers find most appealing and so our task is to measure the extent to which these are present in different occupations and turn this into a ranking.
For this ranking to properly capture the age-friendliness of occupations, it should reflect not just the overall desirability of occupations for older workers but also their relative desirability compared to other ages. If occupations appeal particularly to older workers, they should be prepared to accept lower wages in return for these attractive features. It is this channel that should create greater employment for older workers while minimising the impact on younger cohorts.
With this in mind, constructing an AFI requires four steps:
-
a)
detailed textual descriptions of the nature and attributes of occupations,
-
b)
a precise definition of the characteristics that make a job age friendly and a measure of their absolute importance for older workers,
-
c)
a means of weighting these characteristics to reflect their relative importance for older workers compared to younger ones,
-
d)
a means of determining the degree of overlap between these textual descriptions and using this to derive an AFI.
A. Constructing an Age-Friendliness Index—Intuition
For a), we use the O*NET database that provides rich textual details on 873 occupations. Each occupation comes with a detailed description, a measure of the relevance of more than 244 job attributes (broken down across abilities, interests, work values, work styles, skills, knowledge, work activities, and work context) as well as the relative importance of a total of 16,804 occupational tasks (see Appendix A for more details or Mühlbach (2020)).
For b), we utilise data from Maestas et al. (2018) who obtain survey preferences for various job characteristics for older workers.222We also construct an AFI using data from Hudomiet et al. (2019), using solely the Occ2Vec framework of Mühlbach (2020) as well as construct a PCA version from all three AFIs. There is a high degree of correlation between all these constructed AFIs so we present only those based on Maestas et al. (2018) They define nine main categories of job characteristics: Schedule Flexibility, Telecommuting, Physical Job Demands, Pace of Work, Autonomy at Work, Paid Time Off, Working in Teams, Job Training, and Meaningful Work (which we define in Definition 1-9 in Appendix B). For each of these nine categories, Maestas et al. (2018) provide weights based on the willingness to pay for these features in terms of a lower wage. The smallest weights are given to Meaningful Work, Job Training and Telecommuting and the highest weights to the Absence of Physical Work, PTO and Schedule Flexibility. These provide us with a measure for the absolute appeal of different occupational characteristics for older workers.
For c), we also rely on the results of Maestas et al. (2018) who provide willingness to pay for job characteristics across a range of demographic groups. We use the differences in willingness to pay for workers aged 62+ and those aged between 25 and 34 as a measure of the relative importance of job characteristics for older workers. This ends up placing the highest weight on avoiding taxing physical work, teamwork and flexible scheduling with negative weights attached to meaningful work and learning opportunities.
For d), the challenge is that whilst O*NET provides numerical and textual details for more than 17,000 items for each occupation, these attributes do not exactly match with the nine components of age-friendliness that we use from Maestas et al. (2018). For instance, one of the occupational characteristics in O*NET is “stamina”, defined as “the ability to exert yourself physically over long periods of time without getting winded or out of breath”. Similarly, one of the components that influences the age-friendliness of an occupation is its level of physical demands, defined in Definition 3 in Appendix B as “the level and duration of physical exertion generally required to perform job tasks, such as sitting, standing, carrying, walking, climbing stairs, lifting, carrying, reaching, pushing and pulling and it also includes strength, flexibility, dexterity, vision and endurance”.
Clearly, the concept of “stamina” in O*NET is related to the concept of “physical demands” in AFI, but the word itself is not mentioned in our definition of physical demands. To overcome this problem, we use the Occ2Vec NLP approach developed by Mühlbach (2020) who uses numerical methods to work out the overlap in meaning between “stamina” and “physical demands”.333For ease of interpretation, we explain Occ2Vec here using just one O*NET attribute and one aspect of age-friendliness. In practice, Occ2Vec works out the similarity for each occupation across a weighted average of the 17,048 available occupational descriptors and a weighted average of our nine characteristics of age-friendliness rather than for each individual pairwise comparison It does so by allocating numbers to words, essentially giving a numerical representation to sentences. This numerical representation is modeled using a deep neural net which picks up number patterns representing the frequency and ways in which different words are found together. Similar concepts will therefore have similar numerical representation, as reflected in high dimensional vectors which intuitively represent the weights in the neural net. Commonly referred to as text embeddings these form the crucial component of AFI. When the embedding associated with an occupation is more similar (as measured by cosine similarity) to the embedding associated with our definition of age-friendliness, this occupation will have a higher AFI.
This AFI enables us to classify occupations both at a point in time and across time periods. For example, if , we say that occupation is more age friendly than occupation at time and if , we say that the occupation has become more age friendly between and .
B. Constructing an Age-Friendliness Index — Technical Details
More formally, we index occupations by for and O*NET provides us with occupational data containing weights and text definitions given by , where is an -dimensional vector of occupational weights on the th occupational descriptor whose textual definition follows from at time . The descriptors contain all tasks and attributes available from O*NET. The weights summarize the importance, relevance, and frequency of the descriptor in question for each occupation. We concatenate the weight vectors into a single matrix . Embedding the textual definition of the th descriptor into a -dimensional vector , we apply the NLP algorithm Sentence-BERT (Liu et al., 2019; Reimers and Gurevych, 2019). This gives us an embedding matrix at time . The occupation vector, for , is then given as an occupation-specific average of all descriptor embeddings, , weighted by occupation weights. Using matrix notation, the construction of occupation embeddings occurs via (1), that is
| (1) |
where and represents occupation as a -dimensional vector that encodes the relevant occupational information across a range of criteria and with weights governed by the occupation-specific importance of each descriptor at time .
Having generated occupation vectors for and , the second step is to define age-friendliness and embed its definition into another -dimensional vector, say .444Note that we do not index the definition of age-friendliness by time as no time-variation occurs in the definition. This can then be used to establish the association between each occupation and age-friendliness as measured by the cosine similarity between and .
To ensure comparability of vectors, we use the same pre-trained Sentence-BERT to embed each definition, resulting in nine -dimensional vectors, which we concatenate into the matrix . Combining these embeddings of job amenities into a weighted average leads to our embedding of age-friendliness. As weights, we use the age-specific preferences estimated by Maestas et al. (2018) expressed in both absolute and relative form as discussed above. Averaging the two sets of weights gives us a weight vector, , which we use to construct our final embedding of age-friendliness via (2), i.e.,
| (2) |
with . Lastly, we compute the age-friendliness of the th occupation at time via (3), that is
| (3) |
which is the cosine similarity between the vectors and , because .
III. An Age-Friendliness Index
In this section, we provide some basic descriptive statistics about the age-friendliness of U.S. employment and occupations based on AF. We also perform validation exercises to confirm that our index successfully captures relevant dimensions of what are considered age-friendly occupations.
A. Which Occupations Are Age Friendly?
Year 1990 2020 Rank Top 10 1 Vocational and educational counselors Guides 2 Proofreaders Transportation ticket and reservation agents 3 Baggage porters, bellhops and concierges Receptionists and other information clerks 4 Supervisors of motor vehicle transportation Advertising and related sales jobs 5 Production supervisors or foremen Secretaries and stenographers 6 Insurance adjusters, examiners, and investigators Human resources and labor relations managers 7 Bus drivers Proofreaders 8 Financial managers Insurance sales occupations 9 Messengers Business and promotion agents 10 Garbage and recyclable material collectors Insurance adjusters, examiners, and investigators Bottom 10 1 Concrete and cement workers Concrete and cement workers 2 Tool and die makers and die setters Carpenters 3 Carpenters Painters, construction and maintenance 4 Masons, tilers, and carpet installers Masons, tilers, and carpet installers 5 Mixing and blending machine operators Tool and die makers and die setters 6 Technicians, n.e.c.; and Library technician Technicians, n.e.c.; and Library technician 7 Construction laborers Chemists 8 Painters, construction and maintenance Furniture/wood finishers, other prec. wood wor… 9 Chemical technicians Chemical technicians 10 Furniture/wood finishers, other prec. wood wor… Mixing and blending machine operators Notes: This table shows top and bottom ten occupations according to our AFI in 1990 (LHS) and 2020 (RHS).
Table 2 lists the top and bottom age-friendly occupations in 1990 and 2020 according to AFI. The rankings are intuitive but still revealing. Many of the top age-friendly occupations involve office work and limited physical exertion, such as proofreaders, insurance adjusters, financial managers, insurance adjusters, examiners and investigators, and business and promotion agents. Many of the least age-friendly jobs involve a heavy physical component 555Our algorithm is dependent on the accuracy of O*NET descriptions. If there are biases in descriptions of the physical nature of jobs e.g physical words are heavily used in relation to construction based occupations but not nursing there will be a bias in our constructed AFI., such as concrete and cement workers, construction laborers, painters, construction and maintenance occupations. Some jobs that emerge as age friendly also involve interpersonal communication and other soft skills, such as guides and advertising and related sales jobs in 2020. Comparing the rankings over time shows a notable amount of persistence, especially in the least age-friendly occupations.
AFI quartiles 1 2 3 4 Difference 4-1 Cognitive Abilities 0.413 0.424 0.442 0.468 0.055 Physical Abilities 0.291 0.269 0.178 0.110 -0.181 Psychomotor Abilities 0.372 0.333 0.228 0.157 -0.215 Sensory Abilities 0.328 0.326 0.294 0.273 -0.055 Work Output 0.447 0.441 0.363 0.314 -0.133 Communication 0.548 0.608 0.684 0.761 0.213 Conflictual Contact 0.339 0.379 0.407 0.436 0.097 Responsibility for Others 0.611 0.617 0.531 0.551 -0.060 Environmental Conditions 0.445 0.392 0.270 0.206 -0.239 Job Hazards 0.310 0.278 0.148 0.109 -0.201 Pace and Scheduling 0.561 0.495 0.440 0.436 -0.125 Recognition 0.276 0.343 0.388 0.491 0.215 Working Conditions 0.396 0.416 0.475 0.539 0.143 Notes: This table shows the average O*NET characteristic based on employment-weighted occupations in 2020 across quartiles of our AFI, where 1 denotes the lowest quartile of age-friendly jobs and 4 the highest quartile. Definitions of occupational characteristics are in A.
The role of physical activities in the least age-friendly jobs is confirmed in Table 3, which presents the importance of different attributes by quartile of AFI. We can see that our index captures the attributes emphasised in our definition of age-friendly jobs and age-friendly occupations are those that involve fewer physical activities and job hazards, are less likely to be performed under harsh environmental conditions, and less likely to require a rapid pace. They are also more likely to involve communication and conflictual contact as well more cognitive ability and better working conditions. It is also noteworthy that the range across quartiles in Table 3 is greater than in Table 1 that is based on age of workers and not the age-friendliness of jobs. Clearly, factors other than comparative advantage around age-friendliness influence the age structure of employment.
Figure 1 depicts the average age-friendliness of occupations broken down by sector. Industries involving harder manual work (e.g., construction and agriculture) have lower rankings in terms of age-friendliness compared to industries with less manual work (like finance, insurance, and real estate). As of 2020, around one in eight workers were in an occupation in the lowest quartile of AFI and around two in five were in a top quartile occupation. The top 10 largest occupations by employment all score above average in terms of AFI. The largest occupation of all is “managers and administrators”, accounting for nearly one million jobs, and it ranks in the top 10 per cent of AFI. Males make up 69 per cent of employment in the lowest quartile AFI occupations and 58 per cent of employment in the top quartile AFI occupations.
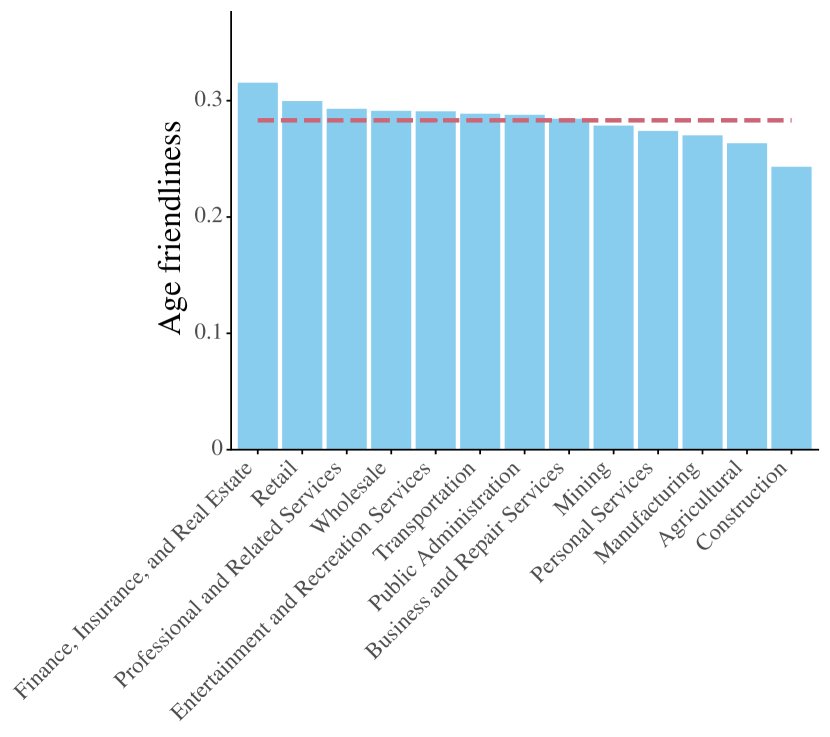 Notes: This figure shows average age-friendliness based on employment-weighted occupations in each industry. The dashed line is the average across all sectors.
B. Comparison to Survey Responses
As one part of our validation strategy, we compared the ranking according to our AFI to those of survey participants. For this purpose, we recruited a total of 210 survey participants from Amazon Mechanical Turk (MTurk), London Business School students, and social media. Full details of recruitment and survey composition can be found in Appendix C.
We ranked occupations into deciles based on AFI and then selected three occupations from each decile. Survey participants were asked to score the age-friendliness of ten occupations, with each survey containing an occupation from each decile and with multiple different surveys ensuring all 30 selected occupations were ranked multiple times. To help participants understand age-friendliness, they were provided with a definition (Definition 10 in Appendix B).666Our AFI is constructed using nine general occupational characteristics. It is the use of the relative weights based on the willingness to pay by older workers in Maestas et al. (2018) that makes this an age-friendliness index rather than the definition or selection of these nine characteristics. Survey participants were instead given a broad concept of what makes a job age friendly to guide them rather than the definitions of these nine occupational characteristics. This means our survey is not testing the ability of our NLP approach to successfully rank occupations based on the nine occupational characteristics but is evaluating the plausibility of our measure as reflecting general perceptions of what makes an occupation age friendly. Participants entered their rankings into a matrix where the rows were the listed occupations and the columns an index of 1 to 10. Participants were allowed to choose “Do not know” and to give the same rank to multiple occupations.
Using the scores from participants, we construct their ranking and compare it with that from our AFI. The Spearman rank-order correlation coefficient shows a high degree of overlap—a correlation coefficient of 0.829 and an associated -value less than 1‰. Of course, the two rankings are not identical and the fact that there are discrepancies is revealed by mean and median absolute deviations between the two rankings of 2.2486 and 2.00, respectively. The distribution of absolute deviations is depicted in Figure 2. Although there is considerable variation among the participants in terms of their rankings, the sizable correlation between the average survey rankings and those based on AFI is apparent. Moreover, looking more closely at the data, we see that absolute deviations of 0 (identical ranking) or 1 (choosing neighbouring rank) make up 45% of the responses, and two-thirds of responses have absolute deviations of 0, 1, or 2, confirming the strong overlap between AFI and survey participants’ assessments.
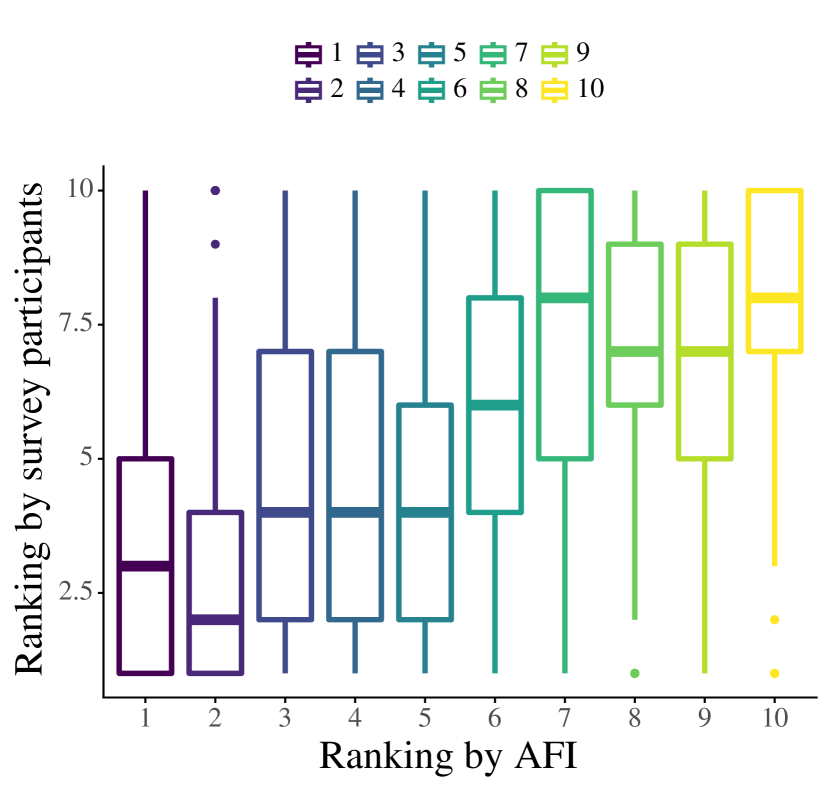 Notes: This figure shows the distribution of age-friendly rankings by survey participants compared to that based on our AFI. The horizontal bar denotes the mean ranking by survey participants, the box shows the 1st and 3rd quartile rankings and the lines the remaining distribution.
C. Baseline Employment Patterns by AFI
If AFI captures the comparative advantage of occupations by age—based on both the relative productivity of older workers and their relative disutility from work—then we would expect older workers to be disproportionately in higher AFI occupations. Table 4 confirms this by regressing the share of workers aged 50-74 in each occupation in 1990 on AFI and various other occupational characteristics. Most importantly, we control for the shares of females as well as college graduates, the average hourly wage, as well as the industry composition of workers employed in a given occupation.777The results are similar when we separately consider the share of workers aged 50-64 and 65-74. See Appendix C. In all cases, there is a strong positive correlation between AFI and the share of older workers, confirming that comparative advantage is at work in the data. Notably, the coefficient on AFI is fairly stable across columns, indicating that the relationship between AFI and the occupational share of older workers is not being driven by some other characteristics of occupations.
That having been said, Table 4 also reveals that there are many factors other than the comparative advantage based on age-friendliness that influence the age composition of occupations. The partial associated with AFI is typically low and it is these deviations from comparative advantage that we discuss in the next section.
Regression #1 Regression #2 Regression #3 Regression #4 Regression #5 AFI Share of females Share of graduates Hourly wage Share of business industry Share of construction industry Share of entertainment industry Share of finance industry Share of manufacturing industry Share of mining industry Share of personal services industry Share of professional services industry Share of public administraion industry Share of retail industry Share of transportaion industry Share of wholesale industry Partial of AFI 0.00000 0.01200 0.01200 0.01300 0.15100 Adj. 0.00700 0.01600 0.01300 0.01000 0.11200 Year 1990 1990 1990 1990 1990 N 299 299 299 299 299 Notes: This table shows results from regressing the 1990 share of employment of workers aged 50-74 in each occupation on the variables listed in column 1. Superscripts ***, **, and * indicate statistical significance based on a (two-sided) -test using heteroskedasticity-robust standard errors at significance levels 1%, 5%, and 10%, respectively.
IV. Have U.S. Jobs Become More Age Friendly?
In this section, we show that even though U.S. jobs have become more age friendly, many of these age-friendly jobs have been taken by younger workers.
A. Age-Friendliness Trends
Figure 3 presents the density function of AFI across occupations (not employment) in 1990 and 2020. It shows a clear increase in the age-friendliness of occupations with a shift in mass from the lower to the upper tail. In total, nearly three quarters of occupations saw an increase in their AFI.
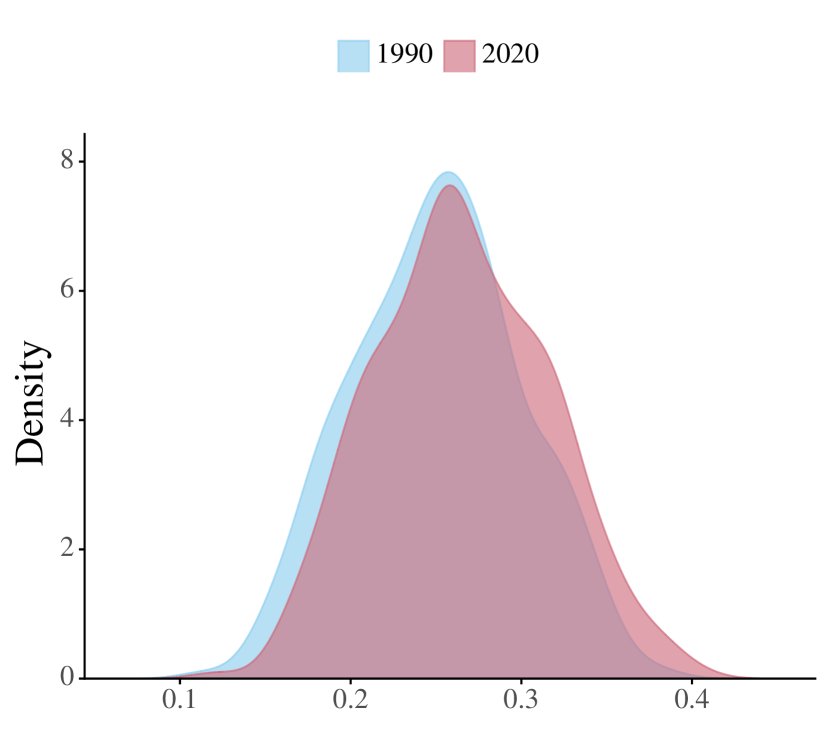 Notes: This figure shows the distribution of occupations (not weighted by employment) across our AFI for 1990 and 2020.
This rightward shift is reflected in Figure 4, which depicts employment shares by AFI decile (defined using the AFI in 2020). As a result of the increase in age-friendliness in so many occupations, there are fewer occupations in the lower deciles and more in the upper deciles of the AFI. Consequently, the pattern revealed by Figure 4 is one of declining employment shares in below average age-friendly occupations and an increase for above average ones. Relatedly, between 1990 and 2020, there was an increase of 49 million in employment in above-average age-friendly occupations. This exceeds the total increase in employment over this period, 41.5 million, and reveals significant opportunities for U.S. workers to move into age-friendly occupations.
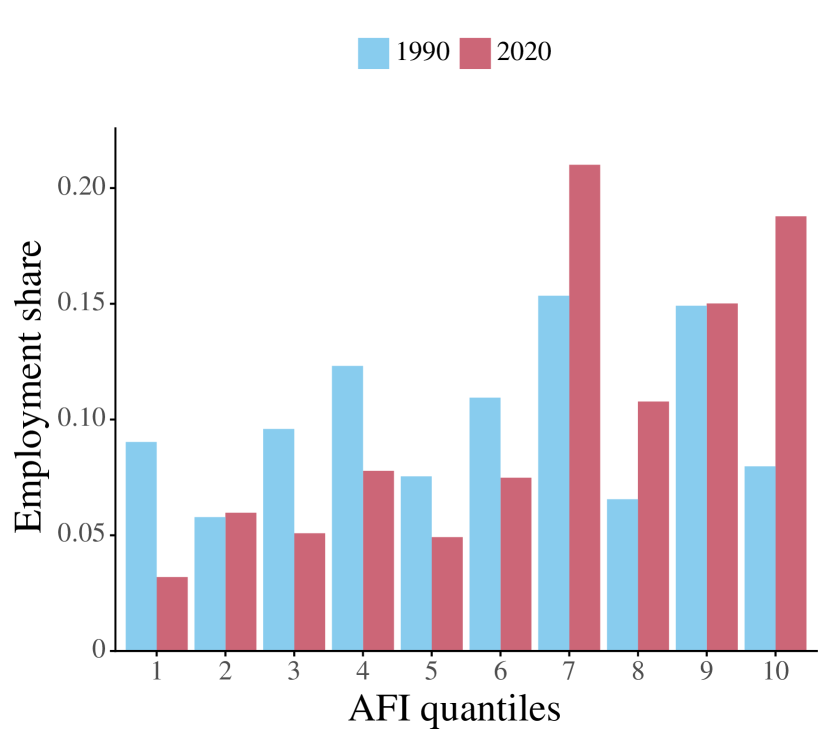 Notes: This figure shows employment shares broken down by AFI deciles in 1990 and 2020. Deciles are defined by numerical values based on the 2020 AFI.
Pursuant to these shifts, the average employment-weighted AFI across all occupations increased by 8 per cent over this time period. It is important to understand whether these substantive changes are driven by most occupations becoming more age friendly (an within occupations effect) or by a shift towards more age-friendly types of occupations (an between occupations effect). We answer this question by performing a Blinder (1973)-Oaxaca (1973) decomposition, which reveals that the within component is much more important. In particular, 92 per cent of the rise in AFI is driven by within-occupation changes, depicted by the rightward shift in Figure 3. There is also a between-occupations effect, which further boosts AFI as above-average age-friendly occupations saw employment increase by 44 per cent, compared to a 21 per cent increase for below-average occupations. Figure 5 provides a further look at this between-occupations effect by depicting the 1990 and 2020 employment shares by AFI quartiles and shows a sizable shift away from the lowest AFI quartiles.

Notes: This figures shows the percentage change in employment and AFI for each decile of the AFI index
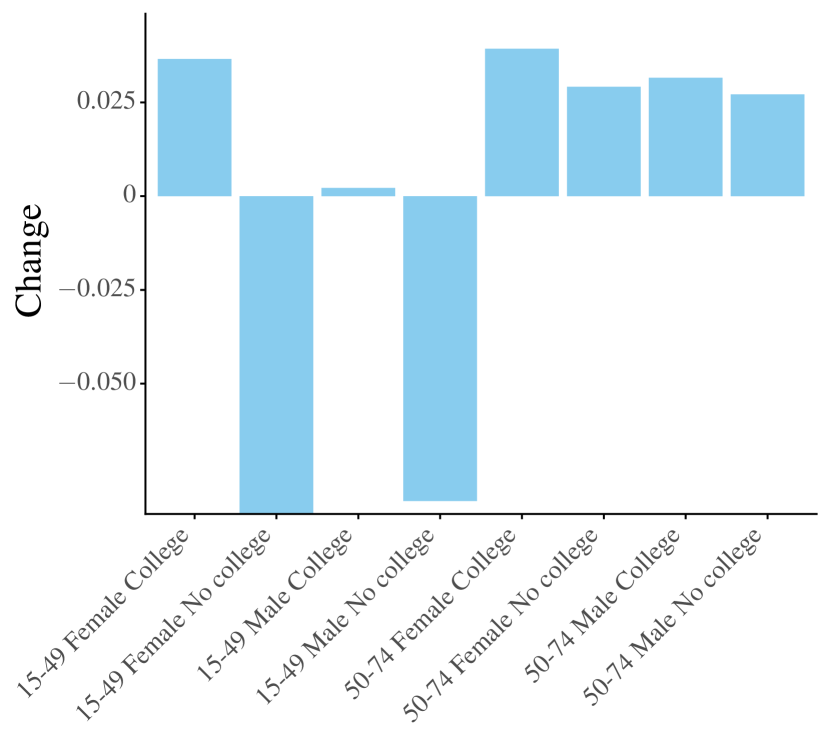
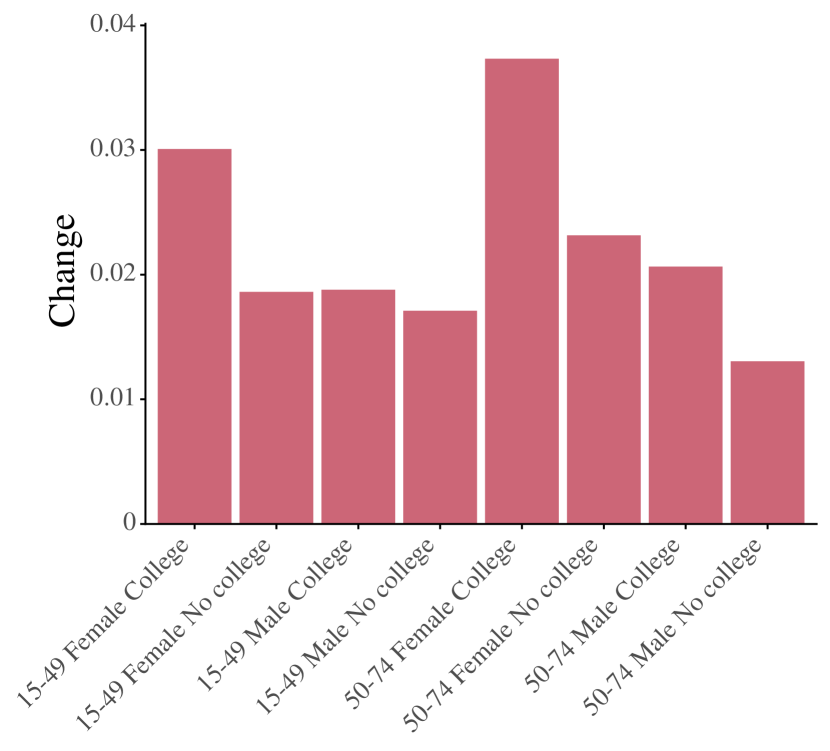
Figure 6 turns to changes in the U.S. labour market from the worker perspective. It shows a general shift towards older, female, and more educated workers. Figure 6(a) shows a significant decline in the employment shares of younger male and female non-college graduates, driven by absolute declines in their employment of 1.1 and 1.2 million, respectively. Mirroring this is a pronounced rise in graduate employment at younger ages, which is particularly noticeable for females. Younger female graduate employment rose by 9.1 million between 1990 and 2020, compared to only 4.8 million for men. More strikingly, Figure 6(b) reveals an increase in AFI for occupations held by all demographic groups, though the largest gains are amongst older workers, graduates, and females with the largest increase of all for older female graduates. This widespread increase in the age-friendliness of occupations across demographic groups signals a notable pattern, which we discuss in the rest of the paper.
Changes in Employment Shares and AFI by demographic groups
Notes: This figures shows the percentage change in employment and employment weighted change in AFI for demographic groups governed by age, sex, and education.
This trend is reflected in Table 5, which presents the employment shares of occupations in the top quartile of age-friendly occupations broken down by demographic group. Of the 33.1 million increase in employment in this top quartile of age-friendly occupations, only 15.2 million is accounted for by workers aged over 50 years, whereas female and college graduates account for most of the more age-friendly jobs that have been created since 1990. Note too that the increase for non-college, older males is quite small—from 20.3 per cent to only 25.9 per cent. Figure 6 and Table 5 reveal that females and college graduates have been major beneficiaries of age-friendly jobs and the older workers who have consequently lost out the most have been male non-graduates.
1990 2020 Change Education Sex Age Total Female 15-49 31.4% 48.2% 16.8 50-74 31.8% 51.5% 19.7 Male 15-49 20.6% 31.7% 11.1 50-74 23.0% 34.6% 11.6 College Total 15-49 27.5% 48.5% 21.0 50-74 28.1% 53.2% 25.1 Female 15-49 25.7% 52.2% 26.5 50-74 23.0% 56.2% 33.2 Male 15-49 29.0% 44.3% 15.3 50-74 30.7% 50.5% 19.8 No college Total 15-49 24.9% 34.8% 9.9 50-74 26.5% 36.9% 10.4 Female 15-49 33.2% 45.7% 12.5 50-74 33.6% 49.0% 15.4 Male 15-49 17.8% 26.0% 8.2 50-74 20.3% 25.9% 5.6 Notes: This table shows proportion of different demographic groups employed in top quartile age-friendly occupations. Quartiles are defined by numerical values based on 2020 AFI.
B. Limits to Comparative Advantage?
The patterns depicted so far, especially those in Figure 6(b), are at first puzzling. U.S. jobs have become significantly more age friendly and on the basis of comparative advantage, we would have expected older workers to be the primary beneficiaries. Instead, it is younger college graduates and females who have been the ones moving into these age-friendly jobs.
In principle, there are three reasons that could account for this pattern. Each is informative about the broader dynamics of the U.S. labour market and the direction of future research in this area.
First, our AFI may capture not just the age-friendliness of occupations, but also their “female-” and “graduate-friendliness”. A confirmation that this is the case, at least to some degree, comes from two pieces of evidence. To start with, Table 4 shows that while AFI significantly explains the share of older workers in an occupation, its explanatory power is limited, suggesting that other demographic groups are also typically employed in high AFI occupations. In addition, there is evidence that attributes that make jobs more age friendly—less physical exertion, greater use of social and communication skills, and less harsh environmental conditions—are also more attractive to female and more educated workers. This is confirmed in Table 6, which shows O*NET job characteristics for younger female and younger college-educated workers as well as older workers. Maestas et al. (2018) also show that both females and graduates are indeed more willing to pay for the occupational attributes valued by older workers than males and non-graduates, respectively. There may also be major differences between older college graduates and older non-college workers in terms of their preferences and skills—a topic that has not received much attention in the literature.
Age 50-74 15-49 Sex All Female Male Female Male All All Education All College No College College No College All All College No College Cognitive Abilities 0.45 0.485 0.427 0.491 0.430 0.447 0.444 0.487 0.423 Physical Abilities 0.168 0.112 0.161 0.106 0.236 0.158 0.204 0.113 0.219 Psychomotor Abilities 0.227 0.151 0.208 0.165 0.315 0.195 0.271 0.16 0.274 Sensory Abilities 0.295 0.279 0.270 0.289 0.330 0.274 0.312 0.283 0.3 Work Output 0.362 0.313 0.334 0.335 0.427 0.331 0.397 0.327 0.387 Communication 0.696 0.773 0.687 0.762 0.631 0.707 0.663 0.761 0.643 Conflictual Contact 0.403 0.440 0.410 0.404 0.379 0.43 0.389 0.42 0.403 Responsibility for Others 0.563 0.538 0.527 0.561 0.608 0.536 0.584 0.54 0.572 Environmental Conditions 0.28 0.195 0.230 0.221 0.400 0.221 0.342 0.207 0.326 Job Hazards 0.168 0.120 0.136 0.129 0.243 0.135 0.206 0.123 0.199 Pace and Scheduling 0.463 0.411 0.445 0.431 0.523 0.427 0.489 0.418 0.482 Recognition 0.423 0.534 0.353 0.572 0.349 0.409 0.399 0.542 0.331 Working Conditions 0.498 0.597 0.431 0.625 0.441 0.475 0.475 0.601 0.409 Notes: This table shows employment-weighted O*NET characteristics by sex, education and age in 2020.
Second, labour market allocations may not follow comparative advantage because of various distortions and frictions in the assignment of workers to jobs. One important factor is limited worker mobility, which is likely to increase with age as workers become settled into (permanent) jobs. Indeed, older workers have longer tenure in their jobs (Allen, 2019), either because general labour market imperfections have meant long-lasting matches or because these workers have accumulated firm-specific human capital, making them reluctant to leave these jobs and employers unwilling to replace them with others. In addition, with a shorter horizon until retirement, the return on learning will be diminished and the impact of fixed costs associated with occupational transitions rise especially in the presence of age discrimination in hiring (Neumark et al., 2019). Older workers may thus be understandably reluctant to change occupations. As emphasised by Autor et al. (2021), these effects are also likely to produce higher median ages in “old job” occupations. Due to these inertial forces, the most rapidly growing occupations are likely to have more younger workers.
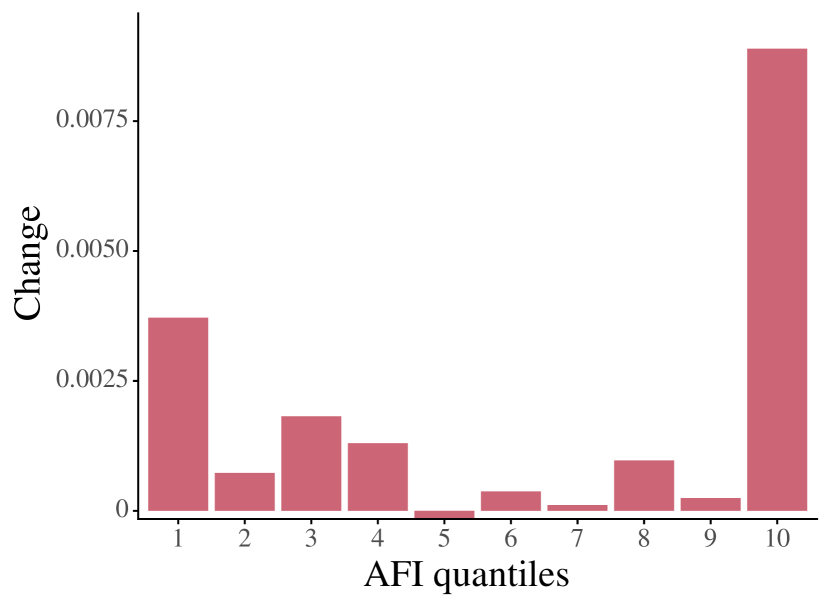
Third, when there is rent sharing or other frictions, employers may prefer higher-productivity workers, regardless of comparative advantage (Acemoglu, 1999; Shimer and Smith, 2000). If younger college graduates and especially female college graduates have higher productivity (or are perceived to have higher productivity), then employers with new age-friendly jobs may give them priority ahead of older workers. Figure 7 provides suggestive evidence for this explanation. The top and middle panels show that, in general, age-friendly jobs have higher wages and have experienced higher wage growth 888There is also evidence of polarisation whereby the lowest wage jobs have also not seen much benefit in terms of age friendliness. It also confirms that they have attracted a greater fraction of graduates. It also provides another aspect of the puzzling patterns we have described so far: median age has not changed much differentially across AFI quartiles.
These potential market imperfections also shed light on which category of older workers have been most adversely affected in terms of missing out on age-friendly jobs. Older male non-graduates are the only category of older workers whose share of growth in top quartile jobs is below their share of growth in total employment (16 per cent and 27 per cent, respectively). Evidence for this can be seen in Table 6, which shows that compared to other older workers, non-graduate males are more likely to be in physical jobs (physical, psychomotor, and sensory abilities and work output), have more difficult work conditions (environmental conditions and job hazards) with less autonomy (responsibility for others) and less flexibility (pace and scheduling).
The reason for this difference is linked to the industries they work in. The largest number are in manufacturing (18.2 per cent) and construction (14.7 per cent), which rank at the bottom in terms of age-friendliness in Figure 1. Whilst both industries have seen an improvement in their age-friendliness, the gap between them and the most age-friendly sectors has widened. By contrast, older female non-graduates are disproportionately in more age-friendly industries (38 per cent in professional and related services and 17 per cent in retail).
From the perspective of our three highlighted labour market imperfections, these patterns are revealing. They are consistent with the findings of Autor and Dorn (2009) that these industries disproportionately constitute “old jobs”. Another potential explanation is that we have so far focused on differences in preferences between young and old but it may be that younger and older graduates have more similar preferences than, say, older non-graduates and older graduates. Finally, given the fact that older graduates have benefited from age-friendly jobs, it is possible that different categories of older workers have different abilities to share the economic rents arising from absolute as well as comparative advantage. It is noticeable that older graduates in particular have benefited more from age-friendly jobs and so have gained from higher employment in higher-wage and more age-friendly occupations.
The disproportionately low access to age-friendly occupations for male non-graduates is a significant problem. This group have seen a substantial rise in labour force participation rates, which combined with relative cohort sizes means they represent the largest increase in older employment (7.6 out of 27.5 millions) but they have seen the fewest benefits from age-friendly jobs. This is also the group with the worst health conditions and the group that has experienced the worst declines in health (Zajacovaa and Montez, 2017) and so is most in need of age-friendly jobs. From the perspective of age-friendly jobs, these results suggest targeting policies on male non-graduates and on manufacturing and construction in particular combined with policies aimed at supporting retraining and aiding transitions into newer more age-friendly occupations (Aitken and Singh, 2023).
Although a full exploration of the relative contribution of different labour market imperfections in influencing the distribution of age-friendly jobs is beyond this paper, our empirical results point to an important policy caveat. Policies aimed at improving labour market conditions for older workers by encouraging greater age-friendliness may be much less effective than previously presumed as these jobs are attractive to a wide range of demographic groups, especially females and graduates. Labour market imperfections interact with heterogeneity between older workers and homogeneity between specific categories of older and younger workers. The consequence is that purely age-based policies may have limited impact. A more holistic approach to policy taking into account not just the types of jobs for which older workers have skills and preferences, but also competition from other groups for the same jobs and the difficulties of transitioning these workers to new jobs may be necessary.
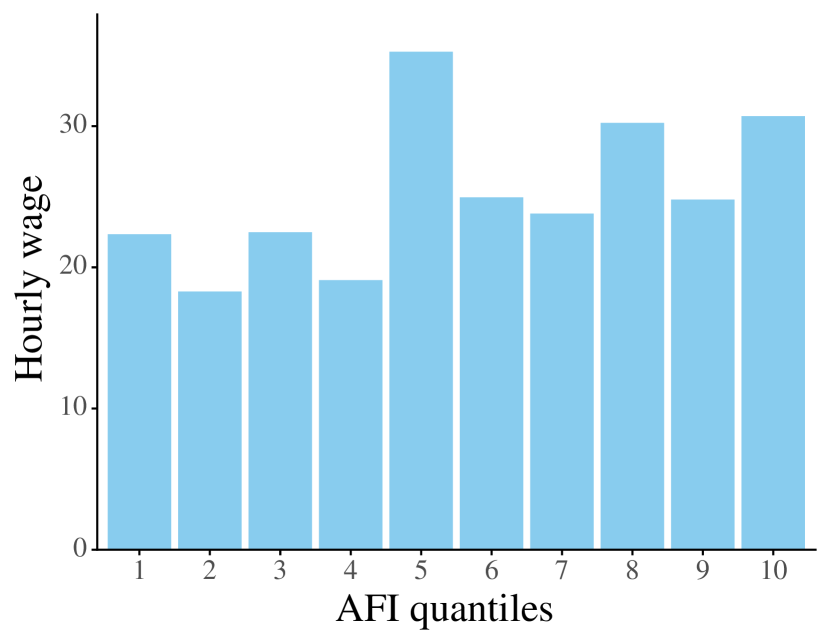
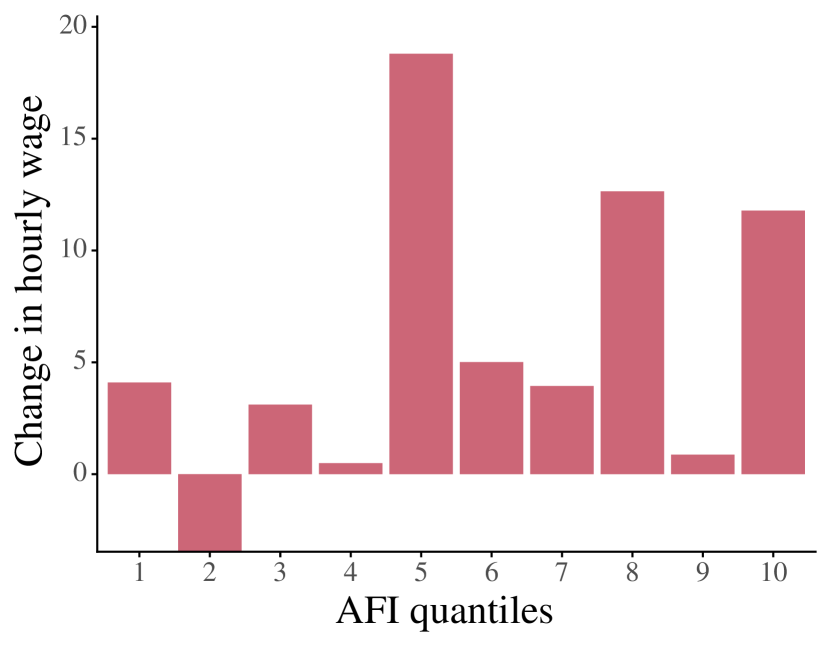
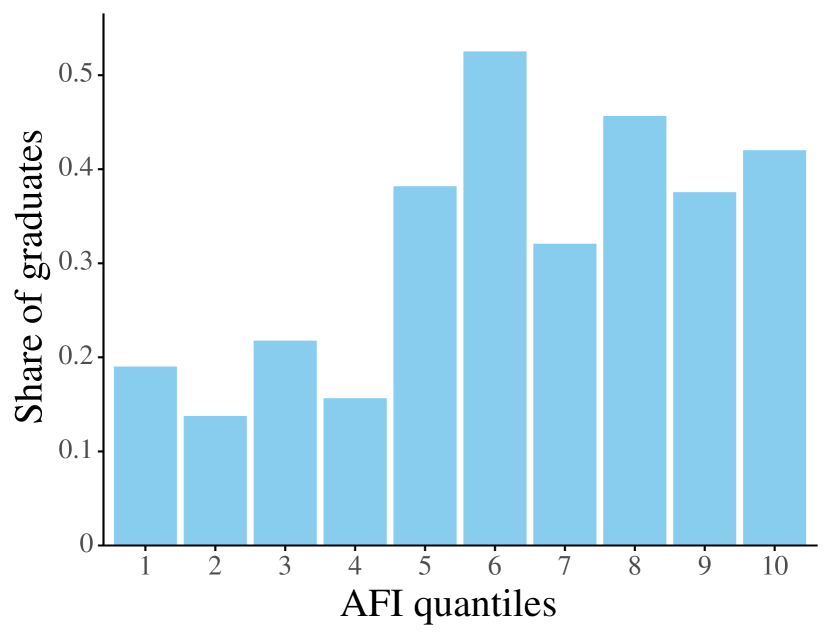
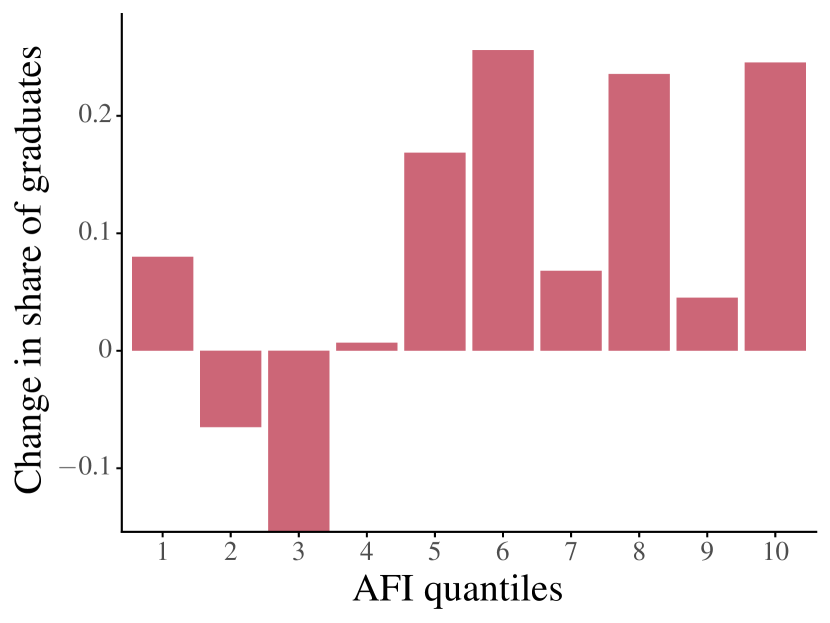
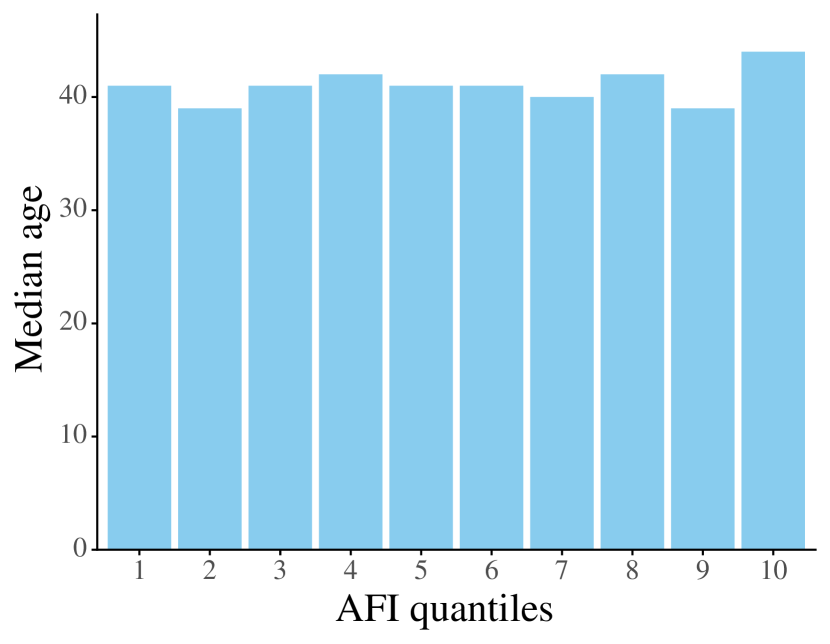
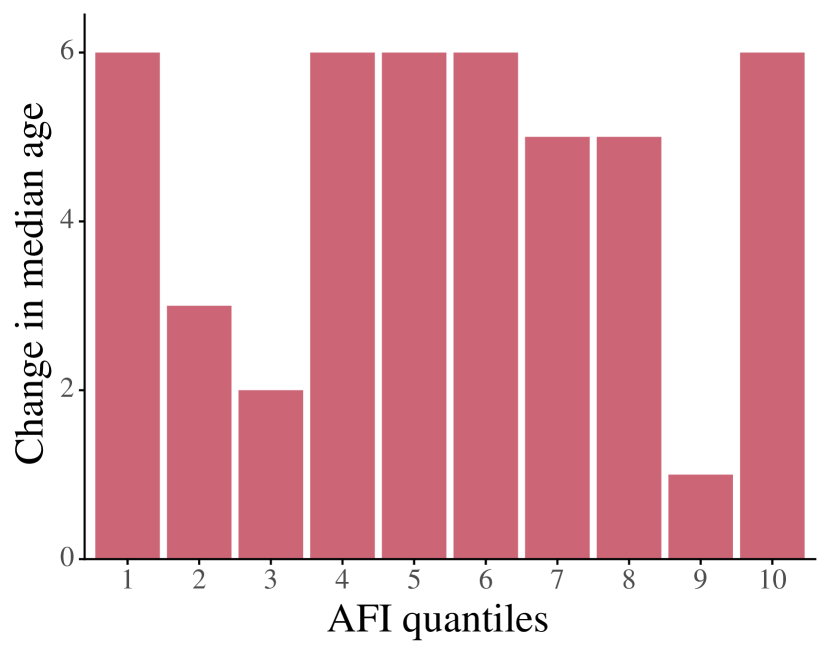
Notes: This figure shows the hourly wage, share of graduates and median age in levels (LHS) and changes from 1990 to 2020 (RHS) by AFI deciles.
V. Conclusion
The U.S. has witnessed a sharp, arguably epochal increase in employment among older workers. Americans aged between 50-74 years used to make up 20 per cent of total employment in 1990 and now account for 33 per cent. How has this been achieved? What lessons does this hold for the future?
To provide a first look as to how these substantive changes have been achieved, we developed an age-friendliness index (AFI) using natural language processing methods and information on preferences and skills of older workers and detailed job characteristics. This index captures various aspects that are associated with preferences and skills of older workers. It identifies jobs that are performed in offices and less harsh environments, that do not involve high levels of physical exertion, and rely on social and communication skills as more age friendly.
After documenting that AFI aligns well with responses from a small-scale survey and predicts the older workers’ share of occupations in 1990, we study whether U.S. jobs have become more age friendly. We uncover two major facts.
First, U.S. jobs have become significantly more age friendly. This is driven mostly by all occupations moving in an age-friendlier direction with only a small part played by a shift in employment away from low AFI towards higher AFI occupations.
Second, most of the age-friendlier jobs have not been taken up by older workers, but by females and college graduates. Amongst older workers, females and graduates have also benefited but the biggest excluded group have been non-college males. We have discussed several reasons why this is—most importantly, the overlap between characteristics that make jobs similarly attractive to females and college graduates as well as older workers; the unwillingness or inability of older workers to move away from their existing jobs; and the possible preference of employers in an imperfect labour markets to hire younger, more productive college-graduate workers rather than older non-college workers for these jobs.
Two conclusions emerge from these empirical findings. The first is that due to the overlap in occupational characteristics between older and younger workers, the creation of age-friendly jobs is effectively part of a broader policy of creating good jobs. Given that an ageing society requires an increase in labour force participation at all ages, this is not necessarily a problem but it does reduce the ability of age-friendly jobs to boost employment at older ages whilst minimising the labour market impact on other groups. Second, the interaction of age-friendly policies with labour market imperfections means that different older workers will be impacted very differently. The manner in which older graduates have benefited from age-friendly jobs compared to non-graduates, especially males, suggests the value of supplementing general age-based policies with more targeted approaches. For older male non-graduates that would likely be either a focused improvement in the age friendliness of specific occupations or aiding transitions to more age-friendly occupations.
References
- Acemoglu (1999) Acemoglu, D. (1999): “Changes in Unemployment and Wage Inequality : An Alternative Theory and Some Evidence,” American Economic Review, 89, 1259–1278.
- Acemoglu and Autor (2011) Acemoglu, D. and D. Autor (2011): “Skills, Tasks and Technologies: Implications for Employment and Earnings,” in Handbook of Labor Economics, Volume 4. Amsterdam: Elsevier-North, 1043–1171.
- Acemoglu and Restrepo (2022) Acemoglu, D. and P. Restrepo (2022): “Tasks, Automation, and the Rise in US Wage Inequality,” Econometrica (Forthcoming).
- Aitken and Singh (2023) Aitken, A. and S. Singh (2023): “Time to Change? Promoting mobility at older ages to support longer working lives,” Journal of the Economics of Ageing (Forthcoming).
- Allen (2019) Allen, S. (2019): “Demand for Older Workers: What do Economists Think? What are Firms Doing?” NBER Discussion Paper 26597.
- Ameriks et al. (2020) Ameriks, J., J. Briggs, A. Caplin, M. Lee, M. Shapiro, and C. Tonetti (2020): “Older Americans Would Work Longer if Jobs Were Flexible,” American Economic Journal: Macroeconomics, 12, 174–209.
- Autor and Dorn (2009) Autor, D. and D. Dorn (2009): “This Job is "Getting Old": Measuring Changes in Job Opportunities Using Occupational Age Structure,” American Economic Review, 99, 45–51.
- Autor et al. (2021) Autor, D., A. Salomons, and B. Seegmiller (2021): “New Frontiers: The Origins and Content of New Work, 1940–2018,” MIT Working Paper.
- Berinsky et al. (2012) Berinsky, A. J., G. A. Huber, and G. S. Lenz (2012): “Evaluating Online Labor Markets for Experimental Research: Amazon.com’s Mechanical Turk,” Political Analysis, 20, 351––368.
- Blinder (1973) Blinder, A. S. (1973): “Wage Discrimination: Reduced Form and Structural Estimates,” The Journal of Human Resources, 8, 436–455.
- Brañas-Garza et al. (2018) Brañas-Garza, P., V. Capraro, and E. Rascón-Ramírez (2018): “Gender differences in altruism on Mechanical Turk: Expectations and actual behaviour,” Economics Letters, 170, 19–23.
- Card and Lemieux (2001) Card, D. and T. Lemieux (2001): “Can Falling Supply Explain the Rising Return to College for Younger Men? A Cohort-Based Analysis,” Quarterly Journal of Economics, 116, 705–746.
- Fritsch and Butland (1984) Fritsch, F. N. and J. Butland (1984): “A Method for Constructing Local Monotone Piecewise Cubic Interpolants,” SIAM Journal on Scientific and Statistical Computing, 5, 300–304.
- Gabriele et al. (2010) Gabriele, P., C. Jesse, and P. G.Iperiotis (2010): “Running Experiments on Amazon Mechanical Turk,” Judgment and decision making, 5, 141–149.
- Hudomiet et al. (2019) Hudomiet, P., M. Hurd, A. Parker, and S. Rohwedder (2019): “The Effects of Job Characteristics on Retirement,” NBER Working Paper 26332.
- Katz and Murphy (1992) Katz, L. and K. Murphy (1992): “Changes in Relative Wages, 1963-1987 : Supply and Demand Factors,” Journal of Political Economy, 107, 35–78.
- Liu et al. (2019) Liu, Y., M. Ott, N. Goyal, J. Du, M. Joshi, D. Chen, O. Levy, M. Lewis, L. Zettlemoyer, and V. Stoyanov (2019): “RoBERTa: A Robustly Optimized BERT Pretraining Approach,” CoRR, abs/1907.11692.
- Maestas et al. (2018) Maestas, N., K. Mullen, D. Powell, T. von Wachter, and J. Wagner (2018): “The Value of Working Conditions in the United States and Implications for the Structure of Wages,” NBER Working Paper 25204.
- Mühlbach (2020) Mühlbach, N. N. (2020): “Tree-based Control Methods: Consequences of Moving the US Embassy,” Working paper. Available at SSRN: https://ssrn.com/abstract=3316049 or http://dx.doi.org/10.2139/ssrn.3316049.
- Mühlbach (2021) Mühlbach, N. S. (2021): “occupation2vec: A general approach to representing occupations,” arXiv preprint arXiv:2111.02528.
- Neumark et al. (2019) Neumark, D., I. Burn, and P. Button (2019): “Is It Harder for Older Workers to Find Jobs? New and Improved Evidence from a Field Experiment,” Journal of Political Economy, 127, 922–970.
- Oaxaca (1973) Oaxaca, R. (1973): “Male-Female Wage Differentials in Urban Labor Markets,” International Economic Review, 14, 693–709.
- OECD (2019) OECD (2019): Working Better with Age, OECD Publishing.
- Reimers and Gurevych (2019) Reimers, N. and I. Gurevych (2019): “Sentence-BERT: Sentence Embeddings using Siamese BERT-Networks,” in Proceedings of the 2019 Conference on Empirical Methods in Natural Language Processing, Association for Computational Linguistics.
- Ruggles et al. (2018) Ruggles, S., S. Flood, R. Goeken, J. Grover, E. Meyer, J. Pacas, and M. Sobek (2018): “IPUMS USA: Version 8.0,” .
- Scott (2022) Scott, A. J. (2022): “Working Life–Labor Supply, aging and longevity,” in The Routledge Handbook of the Economics of Ageing, ed. by D. Bloom, A. Sousa-Poza, and U. Sunde, Routledge.
- Shimer and Smith (2000) Shimer, R. and L. Smith (2000): “Assortative Matching and Search,” Econometrica, 68, 343–69.
- United Nations (2019) United Nations (2019): “World Population Prospects,” Department of Economic and Social Affairs, Population Division.
- Woo et al. (2015) Woo, S. E., M. Keith, and M. A. Thornton (2015): “Amazon Mechanical Turk for Industrial and Organizational Psychology: Advantages, Challenges, and Practical Recommendations,” Industrial and Organizational Psychology, 8, 171–179.
- Zajacovaa and Montez (2017) Zajacovaa, A. and J. K. Montez (2017): “Physical functioning trends among US women and men age 45-64 by education levels,” Biodemography Soc Biol, 63(1), 21–30.
Appendix
A. Data
Census
To generate the data, we follow Acemoglu and Autor (2011); Autor et al. (2021); Acemoglu and Restrepo (2022) among others in using the US Census of Population data for 1990, and the pooled American Community Survey (ACS) data for 2020, sourced from IPUMS (Ruggles et al., 2018). This gives us employment numbers by year, age, industry, sex, education, and occupation.
O*NET
Occupational Information Network (O*NET) is a detailed database, providing the most comprehensive occupational information to our knowledge. O*NET keeps track of hundreds of descriptors for more than a thousand standardized occupations. The descriptors cover four broader types of information about an occupation, which may be decomposed into ten detailed categories, namely, job descriptions, tasks, abilities, interests, work values, work styles, skills, knowledge, work activities, and work context. Figure 8 displays an overview of the data available from O*NET.
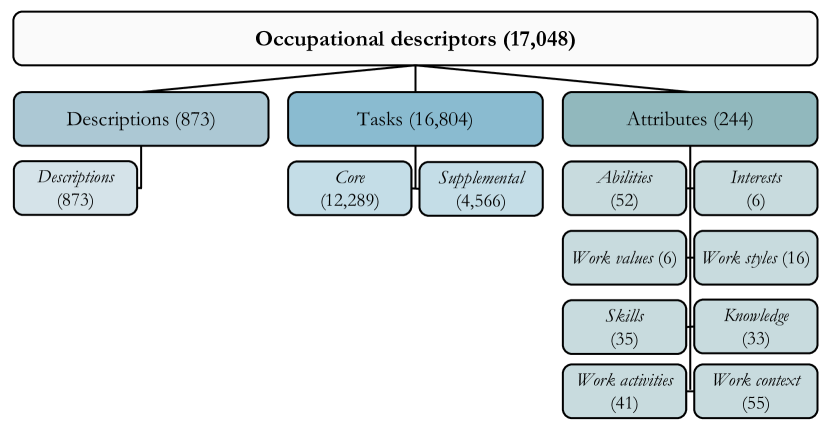 Notes: This figure shows the occupational descriptors provided by O*NET that can be expressed meaningfully by both text and numeric scores. The 17,048 unique occupational descriptors consist of 873 occupation descriptions, 16,804 detailed tasks, and 244 attributes. Note that a small number of tasks may be core to some occupations while supplemental to others, meaning that the sum of core and supplemental tasks exceed the total number of unique tasks. We divide the descriptors into ten categories of which one category belongs to descriptions, one category belongs to tasks (core and supplemental tasks are grouped as one category), and eight categories belong to attributes. The figure is adapted from Mühlbach (2021) by courtesy of the author.
O*NET updates the database multiple times a year. To obtain the data from 2020, we download the databases 24.2 (February 2020), 24.3 (May 2020), 25.0 (August 2020), and 25.1 (November 2020) and we use the average per descriptor by occupation. The data was assessed May 5, 2022 from this link. Regarding 1990, we use the 47 databases available between 2002 and 2022 and extrapolate using the Piece-wise Cubic Hermite Interpolating Polynomial (PCHIP) algorithm (Fritsch and Butland, 1984). The PCHIP algorithm is chosen as it outperforms several alternative algorithms in a pseudo out-of-sample validation exercise. We restrict the extrapolation such that all data points lie within one standard error of the linear extrapolation.
Cognitive Abilities - Abilities that influence the acquisition and application of knowledge in problem solving Physical Abilities - Abilities that influence strength, endurance, flexibility, balance and coordination Psychomotor Abilities - Abilities that influence the capacity to manipulate and control objects Sensory Abilities - Abilities that influence visual, auditory and speech perception Work Output - What physical activities are performed, what equipment and vehciles are operated/controlled, and what complex/technical activities are accomplished as job outputs? Communication - Types and frequency of interactions with other people that are required as part of this job Conflictual Contact - Amount of conflict that the workers will encounter as part of this job Responsibility for Others - Amount of responsibility the worker has for other workers as part of this job Environmental Conditions - Description of extreme environmental conditions the worker will be placed in as past of this job Job Hazards -Descriptions of types of hazardous conditions the worker could be exposted to as pasrt of this job Pace and Scheduling -Description of the role that time plays in the way the worker performs the tasks required by this job Recognition - Occupations that satisfy thus work value offer advancement, potential for leadership, and are often considered prestigious Working Conditions - Occupations that satisfy this work value offer job security and good working conditions.
B. Definitions of job amenities
In the following, we provide several textual definitions of various job amenities (Definitions 1-9) that are used to construct of index of age-friendliness in accordance with Maestas et al. (2018). We also provide our definition of age-friendliness that is used for external validation in Definition 10. The external validation is explained in Appendix C below.
Definition 1 (Schedule flexibility).
A flexible work schedule allows employees a level of autonomy to create their own schedules and find a work-life balance that works for them. A flexible schedule allows employees to plan, vary, and adapt the times they begin and end their workday and to have some control of the working hours.
Definition 2 (Telecommuting).
Telecommuting is the ability of an employee to complete work assignments from outside the traditional workplace by using telecommunications tools such as email, phone, chat, and video apps. Often this means working from home or at a location close to home, such as a coffee shop, library, or co-working space.
Definition 3 (Physical job demands).
Physical demands refer to the level and duration of physical exertion generally required to perform job tasks, such as sitting, standing, carrying, walking, climbing stairs, lifting, carrying, reaching, pushing, and pulling, and it also includes strength, flexibility, dexterity, vision, and endurance.
Definition 4 (Work pace).
Work pace is the rate at which an employee completes tasks and duties at the job.
Definition 5 (Work autonomy).
Work autonomy is the degree to which the job provides substantial independence and discretion to the individual in scheduling the work and in determining the procedures to be used in carrying it out. Autonomy at work thus refers to how much freedom employees have to do their jobs.
Definition 6 (Paid Time Off).
Paid time off (PTO) refers to the time that employees are paid for when they are not working. PTO includes paid vacation, sick time, holidays, and personal days.
Definition 7 (Teamwork).
Working in teams means working with a group of people to achieve a shared goal or outcome effectively, listening to other members of the team, working for the good of the group as a whole, and having a say and sharing responsibility.
Definition 8 (Job training).
Job training means any type of instruction or a program for skill development and competence acquisition provided by the workplace. Job training provides opportunities to gain valuable new skills and enables career advancement.
Definition 9 (Meaningful work).
Meaningful work refers to feeling morally, socially, personally, and spiritually significant and helps people feel a part of something larger than themselves, including being part of a community or society. Meaningful work contributes to the feeling of a purpose in life.
Definition 10 (Age-friendliness (for surveys)).
An age-friendly job appeals to older workers in particular. This will depend on a variety of characteristics including the following:
-
(a)
Should not involve intense or demanding physical work
-
(b)
Should not involve high stress levels, such as tight deadlines, performance assessment, etc.
-
(c)
Should encourage older workers to use their softer skills e.g., working in teams, dealing with interpersonal issues, etc.
-
(d)
Should offer the opportunity for flexible working including part-time and variable hours
-
(e)
Should offer autonomy and discretion rather than close management and supervision
-
(f)
Provide an environment that is inclusive and supportive of older workers and not one where older workers are vulnerable to discrimination and abuse
C. External validation through surveys
We distributed the surveys via three channels. The first channel is Amazon Mechanical Turk (MTurk), a crowd-sourcing marketplace for tasks that require human intelligence to complete. The use of MTurk in experimental research has been extensively validated (Gabriele et al., 2010; Berinsky et al., 2012; Woo et al., 2015) and the service has been used by, e.g., Brañas-Garza et al. (2018). We recruit workers from MTurk who are based in the US and who have graduated college. These participants were paid for their contribution. The second channel was students at London Business School participating in either an elective course "The Business Of Longevity" or core macroeconomic classes on Executive MBA or Sloan programmes. As a third channel to recruit participants, we distribute the surveys with anonymous links via social media, specifically Twitter and LinkedIn. We recruited 112 participants from MTurk, 58 from students, and 40 via social media, totaling 210 survey participants. We pool the responses from all survey participants and analyze them jointly, but our findings hold for each channel separately (results for each are available upon request).
As described in the paper, participants were asked to score 10 occupations, each drawn from a different decile of our age-friendliness ranking. They were provided with Definition 10 of what makes an occupation “age friendly”.
Scoring was done via a matrix and participants were allowed to give the same score to multiple occupations as well as decline to provide a score. The order of the occupations was randomized for each participant to avoid order fixed effects.
We include two control occupations to ensure the quality of the responses, and both controls are listed randomly as rows among the occupations. The first control reads “Select as an answer ’four’ for this question” while the second reads “Professional athlete (e.g. competing in NFL, NBA, or NHL)”. We discard all participants who fail to assign the rating of four to the first control, and similarly, we discard all participants who fail to assign a score less than or equal to four to the second control e.g who fail to score professional athletes as not an age-friendly occupation. We obtain 2627 valid rankings from the 210 survey participants, meaning that each of the randomly chosen occupations has been rated on average more than 87 times.
D. Internal validation through regression
Regression #1 Regression #2 Regression #3 Regression #4 Regression #5 AFI Share of females Share of graduates Hourly wage Share of business industry Share of construction industry Share of entertainment industry Share of finance industry Share of manufacturing industry Share of mining industry Share of personal services industry Share of professional services industry Share of public administraion industry Share of retail industry Share of transportaion industry Share of wholesale industry Partial of AFI 0.00000 0.02900 0.03200 0.04500 0.19800 Adj. 0.00100 0.02700 0.02700 0.03600 0.15700 Year 1990 1990 1990 1990 1990 N 299 299 299 299 299 Notes: This table shows results from regressing the 1990 share of employment of workers aged 50-64 in each occupation on the variables listed in column 1. Superscripts ***, **, and * indicate statistical significance based on a (two-sided) -test using heteroskedasticity-robust standard errors at significance levels 1%, 5%, and 10%, respectively.
Regression #1 Regression #2 Regression #3 Regression #4 Regression #5 AFI Share of females Share of graduates Hourly wage Share of business industry Share of construction industry Share of entertainment industry Share of finance industry Share of manufacturing industry Share of mining industry Share of personal services industry Share of professional services industry Share of public administraion industry Share of retail industry Share of transportaion industry Share of wholesale industry Partial of AFI 0.00000 0.00400 0.00900 0.04200 0.17300 Adj. 0.01700 0.01700 0.01900 0.04800 0.14300 Year 1990 1990 1990 1990 1990 N 298 298 298 298 298 Notes: This table shows results from regressing the 1990 share of employment of workers aged 65-74 in each occupation on the variables listed in column 1. Superscripts ***, **, and * indicate statistical significance based on a (two-sided) -test using heteroskedasticity-robust standard errors at significance levels 1%, 5%, and 10%, respectively.