One of the most active research areas in the world is the search for effective materials for use in the fields of optoelectronics and photovoltaics. The potential of materials like ATiO3 (A=Ti,Sr) is yet largely untapped. Ab initio studies based on density functional theory (DFT) have been used to comprehensively explore the structural, electronic, elastic, and optical properties of Ti2O3 and SrTiO3. In this study, the ground state properties were computed with spin-orbit coupling (SOC), without spin-orbit coupling, and with the inclusion of Hubbard U parameter. Ti2O3 has been found to have electronic bandgaps of 0.059 eV without SOC, 0.131 eV with SOC, and 1.665 eV with Hubbard U. For SrTiO3, electronic bandgaps of 1.612 eV, 1.761 eV, and 2.769 eV have been obtained, respectively, without SOC, with SOC, and with Hubbard U. Ti-4d orbitals have been observed to dominate near the top of the valence band in each and every instance. SOC did not significantly affect the bandgaps and calculated lattice parameters for ATiO3 (A=Ti,Sr). ATiO3 (A=Ti,Sr) is mechanically stable at absolute zero pressure, according to the mechanical stability test. The optical band gap has been seen to increase when Hubbard U is taken into account. In general, the Hubbard U parameter enhances bandgap and optical property predictions. Ti2O3 and SrTiO3 are good UV-Vis absorbers and appropriate for photovoltaic applications owing to the optical absorption coefficient curves being found to cover the ultraviolet to visible (UV-Vis) region.
Key words: Optical properties, Electronic and Elastic properties, DFT + U, Spin orbit coupling, ATiO3 (A=Ti,Sr).
An insight into the properties of ATiO3 (A=Ti,Sr) materials for photovoltaic applications
I Introduction
The search for sustainable energy resources has become a key field of study due to rising global energy demands and the negative environmental pollution generated by the burning of fossil fuels Eddiouane et al. (2018); Samat et al. (2016); Umebayashi et al. (2002). Titanium based oxides have been under investigation for the past few decades owing to their wide range of applications in environmental remediation and solar energy conversion,Samat et al. (2019); Umebayashi et al. (2002); Giustino (2014). Titanium is one of the earth-abundant elements, and its oxides including titanium dioxide (TiO2 ) and ATiO3 (A= Ba,Ca,Fe) have gained significant attention for applications in technologies of electronics, energy conversion, catalysis, sensing, and so onZhang et al. (2010); Anderson (1963); Inturi et al. (2014); Li et al. (2018). Despite its large band gap, TiO2 has been researched for its potential modification for solar harvestingFahmi et al. (1993); Zhang and Kilin (2012). However, there hasn’t been much focus on reduced TiO2 compounds like Ti2O3. Previously,Li (2016), Yang Yang et al observed a cubic perovskite Ti2O3 unit cell made at room temperature at the Ti/SrTiO3 interface, although they did not investigate the material’s properties. We thoroughly investigate the structural, electrical, elastic, and optical properties of Ti2O3 and SrTiO3 materials for photovoltaic applications as a result of this. Ti2O3 is Corundum structured and crystallizes in the trigonal R3c space group with Ti3+ atoms bonded to six equivalent O-2 atoms to form a mixture of edge, corner, and face-sharing TiO6 octahedra as reported elsewhere Guo et al. (2012). Similarly, SrTiO3 is (Cubic) Perovskite structured and crystallizes in the tetragonal I4/mcm space group with Sr2+ bonded to twelve O-2 atoms to form SrO12 cuboctahedra that share corners with twelve equivalent SrO12 cuboctahedra. In this study, the stability and properties of these two compounds will be explored their suitability for use in solar harvesting applications. Most recentlyAllan et al. (2022a), the properties of titanium oxynitride compounds TinN2O2n-1 with n=3, obtained from pristine Ti2O3, were investigated. Ti2O3 displayed metallic properties, yet it had been reported to have semi-conducting properties experimentallyAoki et al. (2019). The failure of first-principles DFT to properly describe the electronic band gaps of strongly correlated materials, in which the electron-electron interaction has a significant impact, is a well-known problemSamat et al. (2016). Many approaches to resolving this discrepancy have been proposed. The inclusion of the Hubbard model (DFT+U) in electronic structure calculations is one of them Samat et al. (2016). The DFT+U method has been used for improved prediction of the gaps as well as to exhaustively determine the elastic and mechanical properties of the compounds. The study of the elastic properties such as elastic constants provides fundamental information on how these materials behave under external strainBurke et al. (2007). Besides this, the effect of spin orbit coupling (SOC) has also been analyzed. To the best of our knowledge, there are a few experimental reports in the literature on the properties of Ti2O3 and SrTiO3. Hence, this work aimed at investigating the properties of the two titanites containing Ti3+ ions with a specific focus on their suitability for use in photovoltaic applications. Specifically, we explore the structural, electronic, elastic, mechanical, and optical properties of Ti2O3 and SrTiO3 compounds using the DFT method with SOC and Hurbbard U effects. This study opens new doors towards some new titanite-based technologies. This paper is organized as follows: Sec.II accounts for the technicalities that may be needed for future reproducibility in our computations. We offer detailed analysis of results and discussions in Sec.III. The structural properties of both Ti2O3 and SrTiO3 with and without SOC effects are discussed in Sec.III.1 while the eEffect of SOC and Hubbard U on electronic Properties in Sec.III.2. The elastic constants and mechanical properties of the compounds under study are outlined in Sec.III.3. In Sec.III.4, we discuss the optical properties of Ti2O3 and SrTiO3. Sec.IV outlines the conclusions of this work.
II Computational details
The structural, electronic, elastic, mechanical, and optical properties of Ti2O3 and SrTiO3 compounds were computed within the DFTBurke et al. (2007); Kohn and Sham (1965) as implemented in the quantum espresso (QE) code Giannozzi et al. (2009). The Ti2O3 and SrTiO3 crystal structure input files were downloaded from the materials project database Jain et al. (2013) and the materials cloud Talirz et al. (2020) input generator implemented in QE was used to generate the PWscf input files for DFT calculations. The electron-ion interaction was denoted by using the projector augmented-wave function (PAW) methodKresse and Joubert (1999). The Generalized Gradient Approximation (GGA) with the Perdew-Burke-Ernzerhof (PBE) Perdew et al. (1996) was chosen to define the exchange-correlation effect of the electrons. The optimized cutoff energy of 50Ry and 6 × 6 × 4 Monkhorst-Pack grid for Brillouin zone integration were used for the calculations. Geometry optimization was performed by computing the total energy per unit cell at several lattice constant values to obtain the ground state structural properties. Based on the optimized lattice constants, the elastic, electronic, and optical properties were calculated. The effects of spin orbit coupling (SOC) was included in the structural and electronic properties, while the well-known DFT underestimation problem was countered but the inclusion of Hubbard U correction on the electronic structure calculations. The choice of the effective Hubbard U values were peged on earlier works done on same materials while assesing the impact of the inclusion of U on the lattice parameter(a0) of the compounds.
III Results and Discussions
III.1 Structural Properties
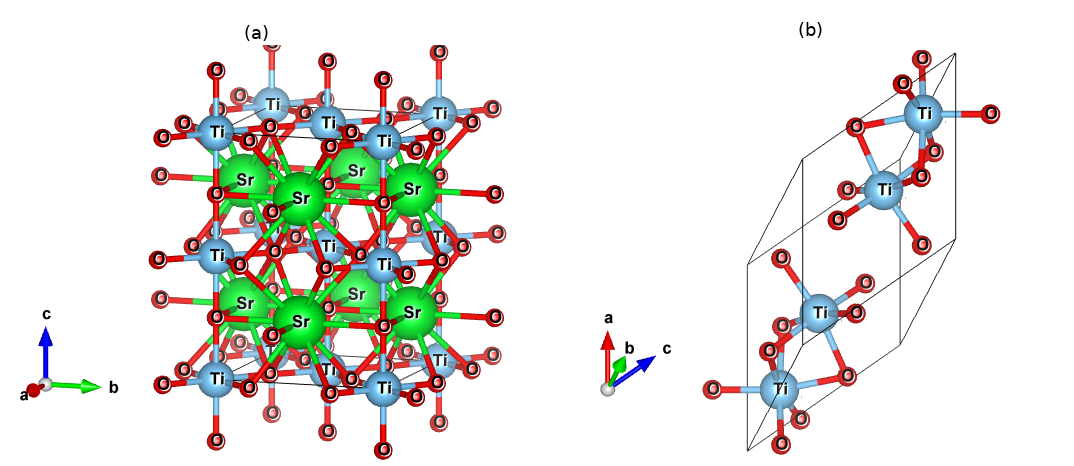
Ti2O3 and SrTiO3 compounds adopt trigonal and tetragonal crystal system as reported elsewhere Talirz et al. (2020). In order to achieve the equilibrium structure, one has to calculate the lattice parameter that minimizes the DFT total energy, the optimized crystal structures are shown in Figure 1. Table 1 shows bond strength for Ti2O3 and SrTiO3.
| Material | Bond | Bond length |
|---|---|---|
| Ti2O3 | Ti-O | 2.04 |
| Ti-Ti | 2.37 | |
| SrTiO3 | Sr-Ti | 3.41 |
| Sr-O | 2.78 | |
| Sr-Sr | 3.95 |
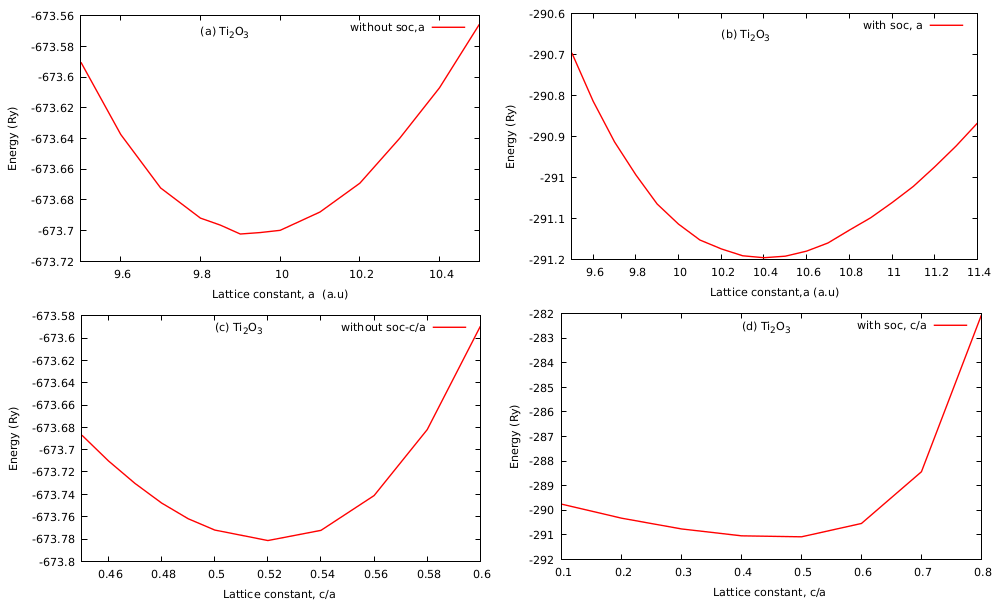
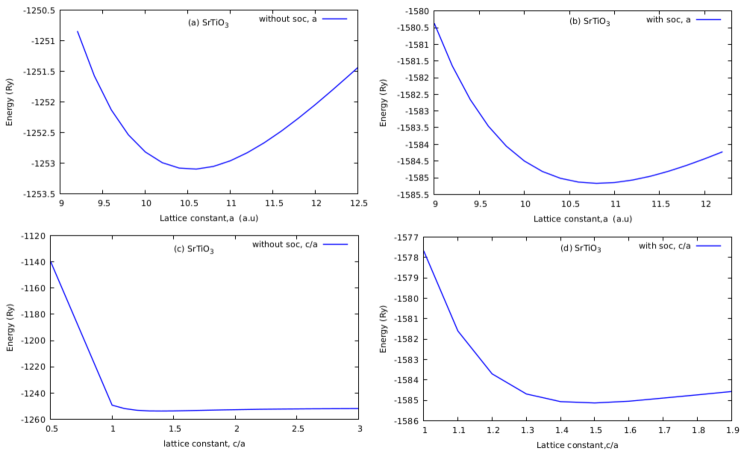
From Table 1, the Ti-O bond is stronger than the Ti-Ti bond in Ti2O3, while the Ti-O bond is stronger than both Ti-Sr and Sr-O bonds in SrTiO3 . The Sr-Sr bond is the weakest with long bond lengths; this difference is attributed to the fact that the volume per atom tends to increase with the increase in atomic radius and therefore affects crystal lattice basisMooser and Pearson (1956). The total energy at various lattice constant values is computed with SOC and without SOC effects are presented in figure 2 and figure 3 for Ti2O3 and SrTiO3 compounds, respectively. Table 2 gives a summary of the calculated lattice parameters and other structural properties.
| Structural Properties | Ti2O3 | SrTiO3 | ||||
|---|---|---|---|---|---|---|
| Without soc | With soc | Without soc | With soc | |||
| Lattice Parameters a0(a.u) | 9.933 | 10.404 | 10.535 | 10.849 | ||
| Lattice parameter c/a | 0.520 | 0.571 | 1.353 | 1.403 | ||
| Bulk modulus Bo (GPa) | 166.4 | 137.0 | 217.1 | 218.2 | ||
|
-673.7 | -291.1 | -1253.07 | -1585.16 | ||
|
980.14 | 1126.09 | 1167.17 | 1277.00 | ||
From figure 2 and figure 3, SOC did not have significant effects on the lattice parameters. However, when the data was fitted to Murnaghan’s equation of stateMorgan and Watson (2010), minimum changes were noted on the equilibrium volume and ground state energies of the two compounds as indicated in table 2
III.2 Effect of SOC and Hubbard U on Electronic Properties
The electronic band structures and projected density of states (PDOSs) of the Ti2O3 and SrTiO3 compounds were computed by using the optimized crystal structures and presented on figure 4 and figure 5. The band structures were calculated in three stages; i) without SOC effects, ii) with SOC effect, and iii) with Hubbard U corrections. The choice of U values were pegged on the earlier works on the same materials by refAllan et al. (2022a) and refAdewale and Chik (2019) for Ti2O3 and SrTiO3 , respectively. For Ti2O3 and SrTiO3 , Hubbard U=5 eV and U=7 eV, respectively, proved to have no significant effects on the lattice constants and were therefore used for the band structure calculations.


The Ti2O3 and SrTiO3 compounds have narrow bandgaps of Ti2O3 has been found to have electronic bandgaps of 0.059 eV and 1.612 eV, respectively, without SOC, 0.131 eV and 1.761 eV, respectively, with SOC, and 1.665 eV and 2.769 eV, respectively, with Hubbard U as seen in figures 4 and 5(a). The summary of the calculated bandgaps is tabulated in table 3.
| Materials | Calculated Band Gaps | Experimental gaps | |||
|---|---|---|---|---|---|
| Without SOC | With SOC | With Hubbard U | |||
| Ti2O3 | 0.0598 | 0.1311 | 1.667 (U=5eV) | 1.67Li (2016) | |
| SrTiO3 | 1.612 | 1.7612 | 2.769(U=7eV) | 2.85Van Benthem et al. (2001) |
From the band structure calculations, SOC did not have significant effect on the bandgaps, however the DFT+ U improved the prediction of the band gaps with respect to the experimental values. The maxima of the valence bands and the minima of the conduction bands occur at different symmetry points (Z-) for Ti2O3 and SrTiO3 and (–M) for SrTiO3 in the Brillouin zone, implying that the two compounds are indirect bandgap semiconductors. The projected density of states, which describes the available states for electrons to occupy when projected on atomic orbitals were calculated. However, since the effects of SOC and without Hubbard U did not have significant impact on the types of dominant states in the PDOS, only the results of the PDOS without the effects of SOC and Hubbard U are presented in figures 4(b) and 5(b). The orbital contributions to the formation of valence bands and conduction bands are described by the PDOS in the energy region -4.5 eV to 4 eV. As illustrated in figure 4(b), the entire band structure is dominated with O-2p and Ti-4d orbitals, an indication that Ti2O3 exhibits semi metallic properties without Hubbard U effects, this is attributed to the well-known poor description of the electronic structure by the DFT method. The bands in the region -4.5 to -2.5 eV are majorly formed by O-2p while Ti-4d states forms the bands in the energy region of -1.0 eV to 4 eV in the Ti2O3 band structure shown in figure 5. In the case of SrTiO3 compound (Figure 5(b)), the valence band is majorly formed by the O-2p states in the energy range of -4.5eV to Fermi level, while the conduction band is majorly formed by the Ti-4d orbitals.
III.3 Mechanical and Elastic properties
The Ti2O3 and SrTiO3 compounds adopt trigonal and tetragonal crystal structure featuring six independent elastic constants. The independent elastic constants for trigonal Ti2O3 are C11 C12 C13 C14 C33 C44 Chung and Buessem (1967). The necessary and sufficient conditions for trigonal elastic Ti2O3 stability is given by equation(1);
| (1) | ||||
For Tetragonal SrTiO3 , the six independent elastic constants are C11 C12 C13 C14 C33 C44 and C66 Chung and Buessem (1967). The necessary and sufficient conditions for elastic stability of the tetragonal crystal system are ;
| (2) | ||||
Table 4 shows the calculated elastic constants for both the compounds, from the results, both the compounds meet the stability criteria, at DFT and DFT+U levels, and are therefore mechanically stable. The bulk modulus B, Young’s modulus E, shear modulus G , Pugh’s ratio B/G, and Poisson’s ratio n are presented in table 5 .
| Compound | C11 | C12 | C13 | C14 | C33 | C44 | C66 | |
|---|---|---|---|---|---|---|---|---|
| Ti2O3 | DFT | 350.3 | 138.9 | 175.7 | 83.04 | 276.0 | 114.7 | 105.6 |
| DFT+U | 285.3 | 102.1 | 113.4 | 3.073 | 228.4 | 121.5 | 91.6 | |
| SrTiO3 | DFT | 338.3 | 110.6 | 105.7 | - | 351.6 | 116.5 | 122.3 |
| DFT+U | 372.5 | 116.7 | 115.2 | - | 383.3 | 130.3 | 133.0 |
| Compound | B | E | G | B/G | n | |
|---|---|---|---|---|---|---|
| Ti2O3 | DFT | 217.0 | 250.2 | 95.7 | 2.26 | 0.31 |
| DFT+U | 161.3 | 239.4 | 95.5 | 1.69 | 0.25 | |
| SrTiO3 | DFT | 185.8 | 292.4 | 118.1 | 1.57 | 0.24 |
| DFT+U | 202.5 | 322.9 | 130.8 | 1.54 | 0.23 |
Bulk modulus measures the resistance against volume change resulting from applied external pressure Allan et al. (2022b). Large B value predicts hard materials; thus, from the computed values of the bulk modulus, both Ti2O3 and SrTiO3 are not hard materials. It is clear that for Ti2O3, DFT+U gives a more accurate prediction of the mechanical properties with reference to the values obtained (in table 2) when lattice constants were fitted to Murnaghan’s equation of stateMurnaghan (1944). Additionally, the bond lengths of the crystal structures are correlated to the size of the B. The shorter the bond lengths, the larger the B value Manyali (2012). From the structural properties, the obtained bond lengths in Ti2O3 are shorter than those in the SrTiO3 crystal structure thus the higher value of B in Ti2O3 compound by DFT calculations. The ductile (ionic) and brittle (covalent) nature of materials is determined by Pugh’s ratio B/G and Poisson’s ratio, n Allan et al. (2022b). The restriction for brittleness is B/ G 1.75; otherwise, the material is said to be ductile. In addition, the Cauchy pressure (C12 -C44 ) also confirms the ductility and brittleness of materials. A positive value of the Cauchy pressure indicates ductility and brittleness otherwise. The critical value for the Poisson’s ratio is 0.26, with materials having n as 0.26 exhibiting a ductile nature and brittleness otherwise. From the calculated values, all the three methods are consistent in classifying the materials as brittle. Poisson’s ratio n 0.1, 0.25, and 0.33 for pure covalent, ionic, and metallic bonds, respectively, Manyali (2012). Thus, we can conclude that Ti2O3 and SrTiO3 compounds are ductile and strongly dominated by ionic character. The stiffness of a material is determined by applying Young’s modulus value Manyali (2012). The higher the value of E, the stiffer the material, therefore, SrTiO3 compound is stiffer than Ti2O3.
III.4 Optical Properties
Optical properties of solids, which dependent on their band gap, are very interesting to know how the solid interacts with light. To highlight optical properties such as: reflection transmission and absorption, we need to calculate the dielectric function , which reflects the response of electrons in solid to electromagnetic irradiation. The dielectric function is given by :
| (3) |
and are the real and the imaginary parts of the dielectric function. The real part is associated to the electronic polarizability of the material while the imaginary part is correlated to the electronic absorption of materialAslam et al. (2021). The real part and the imaginary parts describe, respectively, the dispersion and the absorption of the electromagnetic radiation by the medium which it crosses. The spectrum is calculated by summing the electric dipole operator matrix elements between the occupied and unoccupied wave functions over the Brillouin zone while respecting the selection rules. This is mainly connected with the electronic structures and characterizes the linear response of the material to electromagnetic radiation. It therefore governs the propagation behavior of radiation in a medium. The imaginary part of the dielectric function represents the electron transition between the valence and the conduction bands. The other optical properties like as: the reflectivity , the absorption and the refractivity , can be derived from and . These are presented in Figure 6, 7 and 8 are computed by using the equations presented as follows Samat et al. (2019); Aslam et al. (2021); Arbab (2019):
| (4) |
| (5) |
| (6) |
| (7) |
| (8) |
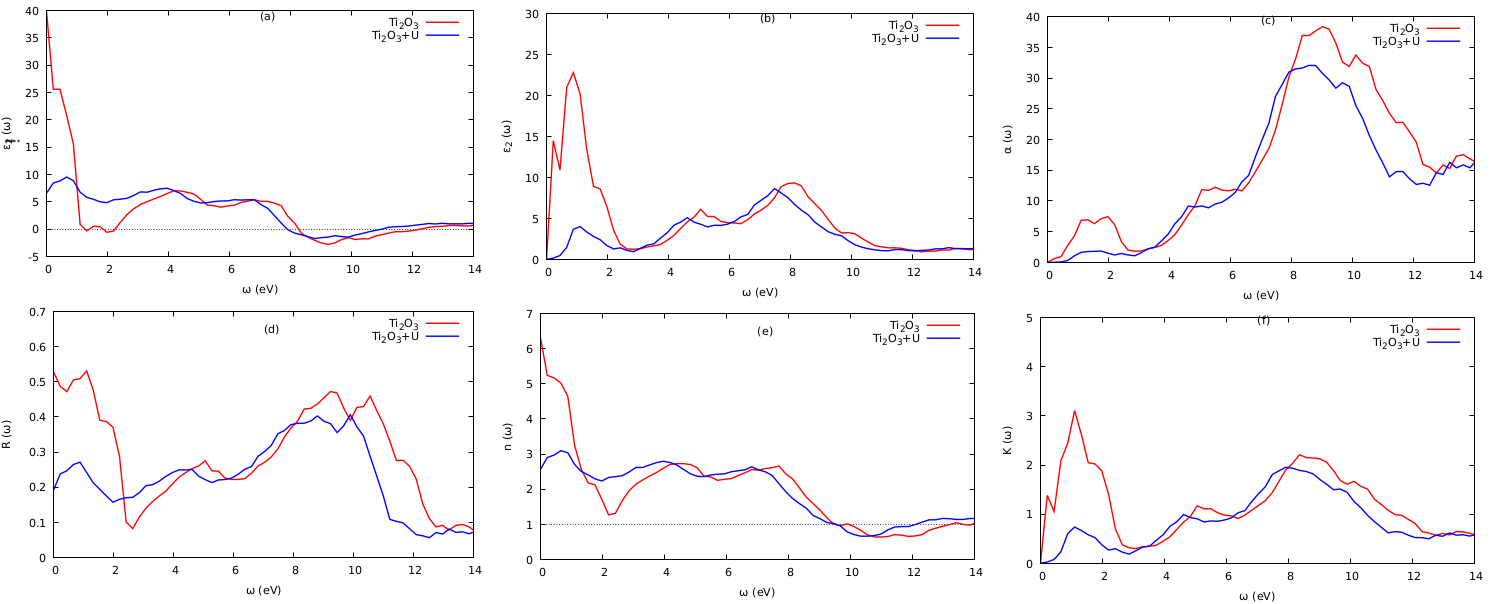
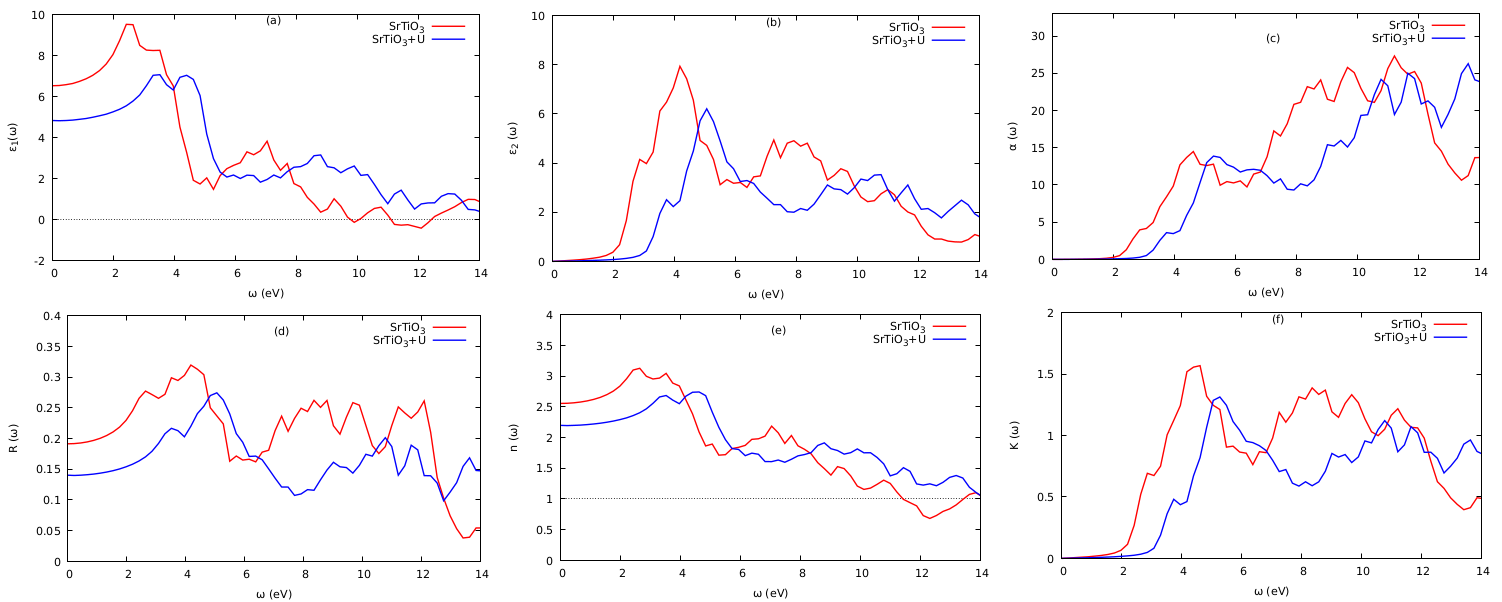
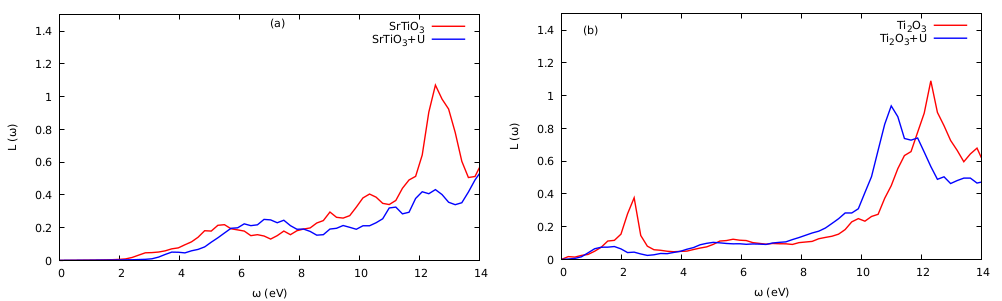
The imaginary part () of the dielectric wave function describes the photon absorption in crystalline materialsGuo et al. (2012). The peaks in ()curves result from the electronic transitions from the valence to the conduction bands. The absorption onsets in curves refer to the materials bandgaps which lie within the visible region, 3.1 eV for for Ti2O3 and SrTiO3 . compounds, and are consistent with the bandgaps from the band structure, an implication of strong inter-band transitions. This makes for Ti2O3 and SrTiO3 compounds promising candidates for photovoltaic applications. Additionally, narrow bandgaps facilitate faster electron transitions as opposed to wide bandgaps Samat et al. (2019). The key feature of the() curve is() Energy=0), also referred to as the static valueArbab (2019). This static value is correlated to the material’s refractive index as n () . Starting from Energy 0, the () plot attained major peaks at low energy regions, 1.5eV and 2.7 eV for Ti2O3 and SrTiO3, respectively. The photon transmission persisted until the Re() values became negative at energy regions of 8eV - 12eV. At this energy region, the incident photon radiations are assumed to be fully attenuatedMurtaza and Ahmad (2011) and the compounds assert a metallic behaviourMurtaza et al. (2011). From n () curves, the calculated refractive indices obtained at zero energies are 2.3 (DFTU) and 2.5 (without U) for SrTiO3 and 2.5 (with Hubbard U) for SrTiO3 . The major refractive index peaks for SrTiO3 and Ti2O3 (with Hubbard U) reside within the visible region. Additionally, the Ti2O3 and SrTiO3 were found to have high optical absorption in the energy range of 8eV-10eV and 10eV-12eV, respectively. The optical absorption coefficients of Ti2O3 and SrTiO3 compounds cover the UV-Vis regions. The absorption coefficients calculated covered a wide range of the electromagnetic spectrum in the energy regions 2.0–13.5 eV; this demonstrates that these compounds can be utilized for photovoltaic applications. The materials’ surface behaviour and energy loss by fast electrons entering a medium are determined by reflectivity and energy loss function, respectively Arbab (2019). The main peaks of the reflectivity curves are observed in the regions 6 eV -11 eV and 2 eV-6 eV for Ti2O3 and SrTiO3, respectively, the reflectivity decreased beyond this region. There was no significant absorption in the visible regions, as depicted in the loss spectrum for both compounds in figures 8(a) and 8(b). The major absorption peak occurred at higher energy regions 9.97–12.71 eV. The major absorption peak occurred at higher energy regions 12 eV and 10 eV for SrTiO3 and Ti2O3, respectively. The optical properties results obtained in this work are in agreement with the results obtained previously on the related materialsSamat et al. (2019); Aslam et al. (2021), .
IV Conclusion
We have studied the structural, electronic, elastic, mechanical, and optical properties of Ti2O3 and SrTiO3 .compounds using the DFT (with and without SOC effects), and DFT+U methods as implemented in the QE package. Interestingly, SOC did not have significant effects on the structural and electronic properties of the compounds. Equilibrium lattice constants of 9.93 a.u without SOC and 10.40 a.u with SOC were obtained for Ti2O3 compound, whereas for SrTiO3 the calculated equilibrium lattice constants were 10.53 a.u and 10.84 a.u without SOC and with SOC, respectively . Ti2O3 was found to have electronic bandgaps of 0.059 eV without SOC and 0.131 eV with SOC while SrTiO3 electronic bandgaps were 1.612 eV, and 1.761 eV, respectively, without SOC and with SOC. When the Hubbard U effects were in cooperated in the electronic structure calculations, the bandgaps for Ti2O3 and SrTiO3, were predicted as 1.665 eV and 2.769 eV, respectively. These were in fairly good agreement with reported experimental results. The formation of the conduction band was primarily by Ti-4d, while the valence bands were dominated by O-2p orbitals in both compounds. Both Ti2O3 and SrTiO3 were found to be mechanically stable at zero pressure, ductile, and ionic, thus their potentiality for resilient materials application, these properties were confirmed by DFT+U studies. Additionally, the optical properties of Ti2O3 and SrTiO3 were improved by DFT+U studies. The calculated bandgaps, high refractive indices, high absorption coefficients, and wide energy coverage of the absorption coefficients spectra was mainly in the UV-Vis regions of the electromagnetic spectrum. This work suggests that Ti2O3 and SrTiO3 compounds are suitable for photovoltaic applications.
V Acknowledgments
This work was supported by the Partnership for Skills in Applied Sciences, Engineering and Technology (PASET)— Regional Scholarship Innovation Fund (RSIF). The authors acknowledge the Centre for High-Performance Computing, CHPC, Cape for HPC resources.
VI Data availability
The source files and data will be assessed upon request from the authors.
VII conflicts of interest
The authors declare that they have no conflicts of interest.
References
- Eddiouane et al. (2018) A. Eddiouane, H. Chaib, A. Nafidi, M. Najjaoui, and T. Ait-Taleb, in AIP Conference Proceedings, Vol. 2056 (AIP Publishing LLC, 2018) p. 020005.
- Samat et al. (2016) M. Samat, A. Ali, M. Taib, O. Hassan, and M. Yahya, Results in physics 6, 891 (2016).
- Umebayashi et al. (2002) T. Umebayashi, T. Yamaki, H. Itoh, and K. Asai, Journal of Physics and Chemistry of Solids 63, 1909 (2002).
- Samat et al. (2019) M. Samat, A. Ali, M. Taib, O. Hassan, and M. Yahya, Materials Today: Proceedings 17, 472 (2019).
- Giustino (2014) F. Giustino, Materials modelling using density functional theory: properties and predictions (Oxford University Press, 2014).
- Zhang et al. (2010) B. Zhang, J. Sun, H. Katz, F. Fang, and R. Opila, ACS applied materials & interfaces 2, 3170 (2010).
- Anderson (1963) O. L. Anderson, Journal of Physics and Chemistry of Solids 24, 909 (1963).
- Inturi et al. (2014) S. N. R. Inturi, T. Boningari, M. Suidan, and P. G. Smirniotis, Applied Catalysis B: Environmental 144, 333 (2014).
- Li et al. (2018) Y. Li, Y. Yang, X. Shu, D. Wan, N. Wei, X. Yu, M. B. Breese, T. Venkatesan, J. M. Xue, Y. Liu, et al., chemistry of materials 30, 4383 (2018).
- Fahmi et al. (1993) A. Fahmi, C. Minot, B. Silvi, and M. Causa, Physical Review B 47, 11717 (1993).
- Zhang and Kilin (2012) Y. Zhang and D. S. Kilin, International Journal of Quantum Chemistry 112, 3867 (2012).
- Li (2016) Y. Li, Investigation of Titanium Sesquioxide Ti2O3: Synthesis and Physical Properties, Ph.D. thesis (2016).
- Guo et al. (2012) Y. Guo, S. J. Clark, and J. Robertson, Journal of Physics: Condensed Matter 24, 325504 (2012).
- Allan et al. (2022a) L. Allan, G. O. Amolo, J. Mwabora, and S. Mureramanzi, arXiv preprint arXiv:2201.00212 (2022a).
- Aoki et al. (2019) Y. Aoki, M. Sakurai, S. Coh, J. R. Chelikowsky, S. G. Louie, M. L. Cohen, and S. Saito, Physical Review B 99, 075203 (2019).
- Burke et al. (2007) K. Burke et al., Department of Chemistry, University of California , 40 (2007).
- Kohn and Sham (1965) W. Kohn and L. J. Sham, Phys. Rev. 140, A1133 (1965).
- Giannozzi et al. (2009) P. Giannozzi, S. Baroni, N. Bonini, M. Calandra, R. Car, C. Cavazzoni, D. Ceresoli, G. L. Chiarotti, M. Cococcioni, I. Dabo, A. D. Corso, S. de Gironcoli, S. Fabris, G. Fratesi, R. Gebauer, U. Gerstmann, C. Gougoussis, A. Kokalj, M. Lazzeri, L. Martin-Samos, N. Marzari, F. Mauri, R. Mazzarello, S. Paolini, A. Pasquarello, L. Paulatto, C. Sbraccia, S. Scandolo, G. Sclauzero, A. P. Seitsonen, A. Smogunov, P. Umari, and R. M. Wentzcovitch, Journal of Physics: Condensed Matter 21, 395502 (2009).
- Jain et al. (2013) A. Jain, S. P. Ong, G. Hautier, W. Chen, W. D. Richards, S. Dacek, S. Cholia, D. Gunter, D. Skinner, G. Ceder, et al., APL materials 1, 011002 (2013).
- Talirz et al. (2020) L. Talirz, S. Kumbhar, E. Passaro, A. V. Yakutovich, V. Granata, F. Gargiulo, M. Borelli, M. Uhrin, S. P. Huber, S. Zoupanos, et al., Scientific data 7, 1 (2020).
- Kresse and Joubert (1999) G. Kresse and D. Joubert, Phys. Rev. B 59, 1758 (1999).
- Perdew et al. (1996) J. P. Perdew, K. Burke, and M. Ernzerhof, Phys. Rev. Lett. 77, 3865 (1996).
- Mooser and Pearson (1956) E. Mooser and W. Pearson, Canadian Journal of Physics 34, 1369 (1956).
- Morgan and Watson (2010) B. J. Morgan and G. W. Watson, The Journal of Physical Chemistry C 114, 2321 (2010).
- Adewale and Chik (2019) A. A. Adewale and A. Chik, INTERNATIONAL JOURNAL 12, 11 (2019).
- Van Benthem et al. (2001) K. Van Benthem, C. Elsässer, and R. French, Journal of applied physics 90, 6156 (2001).
- Chung and Buessem (1967) D. Chung and W. Buessem, Journal of Applied Physics 38, 2535 (1967).
- Allan et al. (2022b) L. Allan, W. M. Mulwa, R. J. Musembi, and B. O. Aduda, arXiv preprint arXiv:2204.03759 (2022b).
- Murnaghan (1944) F. Murnaghan, Proceedings of the national academy of sciences of the United States of America 30, 244 (1944).
- Manyali (2012) G. S. Manyali, Ab-initio study of elastic and structural properties of layered nitride materials, Ph.D. thesis, University of the Witwatersrand, Faculty of Science, School of Physics (2012).
- Aslam et al. (2021) F. Aslam, B. Sabir, and M. Hassan, Applied Physics A 127, 1 (2021).
- Arbab (2019) A. Arbab, Optik 194, 163067 (2019).
- Murtaza and Ahmad (2011) G. Murtaza and I. Ahmad, Physica B: Condensed Matter 406, 3222 (2011).
- Murtaza et al. (2011) G. Murtaza, I. Ahmad, B. Amin, A. Afaq, M. Maqbool, J. Maqssod, I. Khan, and M. Zahid, Optical Materials 33, 553 (2011).