GermanBibliographyLiteratur \DeclareTranslationEnglishBibliographyBibliography \DeclareTranslationFallbackBibliographyBibliography \DeclareTranslationGermanFurtherReadingWeiterführende Literatur \DeclareTranslationEnglishFurtherReadingFurther Reading \DeclareTranslationFallbackFurtherReadingFurther Reading \DeclareTranslationGermanabbreviationsnameAbkürzungen \DeclareTranslationEnglishabbreviationsnameAbbreviations \DeclareTranslationFallbackabbreviationsnameAbbreviations \DeclareBibliographyCategorycited \LENGTHDIVIDE1cm \LENGTHDIVIDE1cm \DeclareTranslationGermanlstlistingnameQuellcode \DeclareTranslationEnglishlstlistingnameSourcecode \DeclareTranslationFallbacklstlistingnameListing \DeclareTranslationGermanlstlistoflistingnameQuellcodeverzeichnis \DeclareTranslationEnglishlstlistoflistingnameList of Sourcecodes \DeclareTranslationFallbacklstlistoflistingnameListings \DeclareTranslationGermanseenamesiehe \DeclareTranslationEnglishseenamesee \DeclareTranslationFallbackseenamesee \newabbreviationaiAIArtificial Intelligence \newabbreviationapiAPIApplication User Interface \newabbreviationcrudCRUDCreate, Read, Update, Delete \newabbreviationcsCSComputer Science \newabbreviationdoiDOIDigital Object Identifier \newabbreviationeraERAExcellence in Research for Australia \newabbreviationermERMexpress-restify-mongoose \newabbreviationldaLDALatent Dirichlet Allocation \newabbreviationnlpNLPNatural Language Processing \newabbreviationrestRESTRepresentational State Transfer \newabbreviationuiUIUser Interface \xpatchcmd\l@lstlisting1.5em0em
![]() Fakultät für Elektrotechnik,
Informationstechnik und Medientechnik
Fakultät für Elektrotechnik,
Informationstechnik und Medientechnik
Lehrstuhl für Data & Knowledge Engineering
Master-Thesis
Analyzing the State of Computer Science Research with the DBLP Discovery Dataset
Lennart Küll
1549540
Informatik
Data Analytics
Wuppertal, den 10. November 2022
\pbox[t][2em]Betreuer \pbox[t][2em]Dr. Terry Ruas
Jan Philip Wahle M.Sc. \pbox[t][2em]Erstgutachter
Zweitgutachter \pbox[t][2em]Prof. Dr.-Ing. Bela Gipp
Dr. Terry Ruas
Eidesstattliche Erklärung
Hiermit erkläre ich, dass ich die von mir eingereichte Abschlussarbeit (Master-Thesis) selbständig verfasst und keine anderen als die angegebenen Quellen und Hilfsmittel benutzt sowie Stellen der Abschlussarbeit, die anderen Werken dem Wortlaut oder Sinn nach entnommen wurden, in jedem Fall unter Angabe der Quelle als Entlehnung kenntlich gemacht habe.
| Wuppertal, den 10. November 2022 | |
| (Unterschrift) |
Einverständniserklärung
Hiermit erkläre ich mich damit einverstanden, dass meine Abschlussarbeit (Master-Thesis) wissenschaftlich interessierten Personen oder Institutionen zur Einsichtnahme zur Verfügung gestellt werden kann.
Korrektur- oder Bewertungshinweise in meiner Arbeit dürfen nicht zitiert werden.
| Wuppertal, den 10. November 2022 | |
| (Unterschrift) |
Acknowledgements
I would like to express my deepest gratitude to the many people who have supported me throughout my thesis. Without them, this thesis would not have been possible.
First and foremost, I am incredibly grateful for my supervisors Dr. Terry Ruas and Jan Philip Wahle, who continually provided invaluable guidance throughout the entire time I worked on this thesis. I deeply appreciate their expertise and constructive feedback, which helped me tackle any issues that arose during the thesis.
I also want to thank Prof. Dr. Bela Gipp for offering to write my thesis at his chair and giving me the opportunity to complete a part of my research at the National Institute of Informatics (NII) in Tokyo. Thanks should also go to Dr. Norman Meuschke, who helped me organize and review my application for the DAAD scholarship at the NII.
Moreover, I would like to thank my hosting professor at the NII Prof. Dr. Akiko Aizwa for her warm welcome and helpful insights when developing my thesis project, even though I could not visit the NII in person, due to traveling restrictions the COVID-19 pandemic imposed.
I express special thanks to Dr. Saif M. Mohammad for his comments on the project during its development and for essentially shaping how the project turned out. Many thanks also go to my two fellow students Tom Neuschulten and Alexander von Tottleben for developing the prediction endpoint and the shared efforts to integrate it into the project.
Finally, I want to thank my family and friends for their continued support and encouragement during this very intense academic year.
Related Publications
The content of this master’s thesis was created as part of an ongoing research project led by my supervisors Dr. Terry Ruas and Jan Philip Wahle. Parts of this project I also worked on (and thus parts of my thesis) were already published or are planned to be submitted to computer science conferences, which I list in the following:
The DBLP Discovery Dataset and its creation (LABEL:subs:data_primary to LABEL:subs:data_secondary), and its implementation (LABEL:subs:crawler).
maxnames[wahle_d3_2022]
The Computer Science Insights system (LABEL:subs:interface), its motivation (Section 1.1), and its architecture (LABEL:sec:architecture).
maxnames[ruas_cs-insights_2022]
In the following the wording “we” is used rather than “I” as the ongoing research project is a collaborative effort, and I worked closely together with my supervisors.
Abstract
The number of scientific publications continues to rise exponentially, especially in . However, our ability to analyze those publications does not follow the same speed, which prevents us from finding and understanding implicit patterns hidden in their metadata (e.g., venues, document types). Current solutions are limited by restricting access behind a paywall, offering no features for visual analysis, limiting access to their data, only focusing on niches or sub-fields, and/or not being flexible and modular enough to be transferred to other datasets.
In this thesis, we conduct a scientometric analysis to uncover those implicit patterns hidden in metadata and to determine the state of research. Specifically, we investigate trends of the quantity, impact, and topics for authors, venues, document types (conferences vs. journals), and fields of study (compared to, e.g., medicine). To achieve this we introduce the Computer Science Insights (CS-Insights) system, an interactive web application to analyze publications through multiple perspectives. The data underlying this system is the DBLP Discovery Dataset (D3), which contains metadata from 5 million scholarly publications in . We create D3 with data from DBLP, the largest open-access bibliography for scientific papers and articles in , and enrich it with further metadata (e.g., abstracts, citations). CS-Insights offers dedicated dashboards with multiple visualizations for all main features of D3 (e.g., publications, authors, venues, and citations) and multiple filters for more fine-grained analysis. Both D3 and CS-Insights are open-access, and CS-Insights can be easily adapted to other datasets in the future.
The most interesting findings of our scientometric analysis include that i) there has been a stark increase in publications, authors, and venues in the last two decades, ii) many authors only recently joined the field, iii) the most cited authors and venues focus on computer vision and pattern recognition, while the most productive prefer engineering-related topics, iv) the preference of researchers to publish in conferences over journals dwindles, v) on average, journal articles receive twice as many citations compared to conference papers, but the contrast is much smaller for the most cited conferences and journals, and vi) journals also get more citations in all other investigated fields of study, while only and engineering publish more in conferences than journals.
1 Introduction
Chapter 1 first introduces the problem this thesis tries to solve by explaining the context and motivation (Section 1.1). We establish the goals of our research through the main research objective and its corresponding tasks and research questions (Section 1.2) and list our contributions to research (Section 1.3). Lastly, we outline the remainder of this thesis (Section 1.4).
1.1 Problem Presentation and Motivation
In the last few decades, we have seen an exponential rise in the number of digital scientific publications, while our ability to analyze them does not follow the same speed, preventing us from uncovering implicit patterns among its main features (e.g., authors, venues) [bornmann_growth_2021]. Analyzing these large amounts of publications, and possibly any type of data, is hard, mainly due to its storage and processing challenges. There are already existing solutions to mitigate this problem, but all of them show inherent limitations. Researchers can use tools or repositories that already implement data storage, crawling, and processing, like Google Scholar 111https://scholar.google.com/, Semantic Scholar 222https://www.semanticscholar.org/ or DBLP 333https://dblp.org/, to find papers or authors and view their metrics, but these solutions lack details in other areas (e.g., venues) and options for analysis with visual components. Other solutions also provide visualizations (e.g., Scopus 444https://www.scopus.com/, Web of Science 555https://www.webofscience.com/), but are not open-access and are only available behind paywalls, which is prohibitive to those who would benefit the most from their resources (e.g., institutions in developing countries). Therefore, researchers focus on specific research areas, e.g., NLP Scholar [mohammad_nlp_2020_viz] for . Areas without such tools rely on data repositories (e.g. arXiv 666https://arxiv.org/) or general tools (e.g., VOSViewer [van_eck_software_2010]), which also only have a limited set of options for analysis and visualizations.
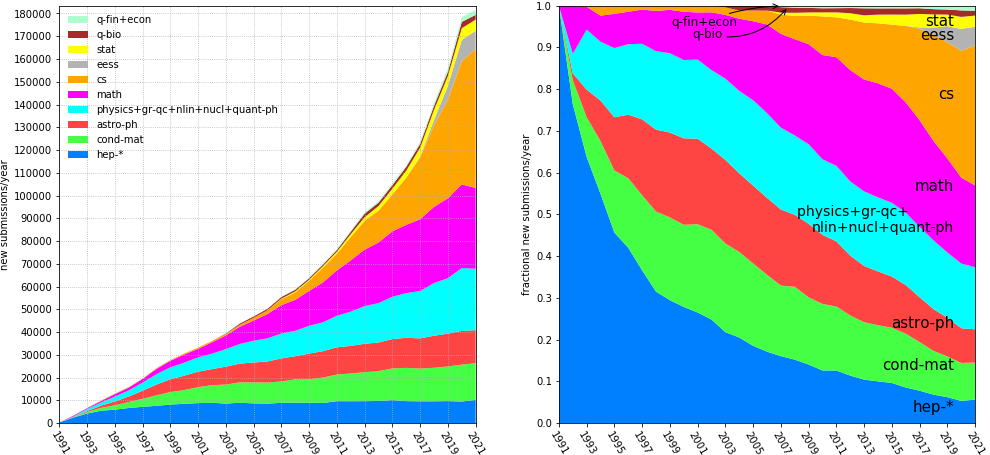
Analyzing the entire research landscape would be prohibitive (Google Scholar alone has more than 389m records [gusenbauer_google_2019]), so we focus efforts on a specific field of research and conducting a case study on that field, with the goal of our methodology also applying to other areas. We decide is a great candidate for this, for two main reasons. First, the presence of in solving or facilitating other field-related problems is undeniable (e.g., plagiarism detection [wahle_are_2021] or media bias [spinde_neural_2021]). Advancements in are also responsible for many benefits, e.g., faster systems, more accurate results, and efficient tools. Today there is hardly any area not affected by the vast possibilities of . Consider how difficult it would be to test, develop, and research new vaccines without access to tools of informatics (e.g., public repositories [kousha_covid-19_2020], artificial intelligence [aggarwal_has_2022]). Second, is a massively growing field, especially when compared to other fields, which becomes apparent when we look at the submissions on arXiv (Figure 1.1). We can not only see that the number of submitted papers increased over the last 10 years (from less than 10k papers a year in 2011 to 60k in 2021) but also how is taking up a much larger percentage of the total submissions (from 10% in 2011 to over a third of the submissions in 2021, the most of all research fields). While arXiv is not a peer-reviewed repository, the same increase in submissions is also visible for repositories consisting of peer-reviewed publications (e.g., DBLP and Web of Science, as shown by [wahle_d3_2022, fiala_computer_2017], respectively), and sub-fields of (e.g., as shown by [mohammad_nlp_2020_data]). Their studies also reveal that the number of authors has increased significantly over the last few decades.
As a result, we see as a promising environment for developing a system to help understand its publications in an automated and democratic way and conducting an analysis with it, that can answer questions like: How fast is computer science research growing? How many authors are actively publishing in their field? What topics are prevalent in specific venues? Answering these questions helps other researchers and organizations make more informed decisions in their research and publications. Researchers can explore particular topics of interest for individual authors and venues, discover influential publications, or find important venues to inform their own research. Conference organizers and research organizations (e.g., ACL777https://www.aclweb.org/) can track how their policy changes affect broad publication trends over time or compare the research output of authors and venues. For example, with a scientometric analysis one can track citation gaps across authors and venues; and in the future, uncover the influence of big technology companies, highly-funded universities, and governments.
1.2 Research Objective
With our goal of an analysis of the state of computer science research, we define the main research objective as follows:
Analyze the state of computer science research by inspecting its different core components and uncovering implicit patterns.
From the main objective, we distill the following research tasks:
-
RT1
Review scientometric studies in the area of and tools/resources for scientometric analyses that already exist.
-
RT2
Collect, clean, organize, store, and publish data from scientific publications in .
-
RT3
Develop a system that uses the collected data to create visualizations to facilitate quantitative analyses.
-
RT4
Analyze through its core components (e.g., publications, authors, venues, and document types), evaluate the findings, and compare them to that of previous research.
We also derive research questions from our main research objective to narrow down which specific questions we have to answer to determine the state of research. Thus, the research questions will guide our analysis in the later parts of this thesis and determine which experiments we will perform during RT4:
-
RQ1
How many publications, authors, and venues are in our dataset? How do the numbers change over time? How many authors and venues are currently active?
-
RQ2
How are the citations and publications distributed across authors and venues? How do the distributions change over time?
-
RQ3
What are the most prominent authors and venues? Are there preferences for topics? Do the topics change over time?
-
RQ4
How do incoming and outgoing citations evolve over time? How do their distributions differ?
-
RQ5
How do conferences and journals compare in their number of publications and citations over time? How do the top venues and topics differ? Do top authors prefer conferences or journals?
-
RQ6
How do the most prominent fields of study differ from in topics and preference for conferences or journals?
1.3 Contributions
Through our goals, this thesis provides multiple contributions to the research community:
-
•
We propose the DBLP Discovery Dataset (D3), a large and carefully curated dataset of publications metadata, with metadata of 5m publications from DBLP, enriched with additional metadata like abstracts and citation counts.
-
•
Also, we develop the Computer Science Insights (CS-Insights) system, a modular analysis platform, which allows its users to perform quantitative analyses on the core components of research.
- •
-
•
Both the dataset and system are open-access and open-source to allow everyone, regardless of background, wealth, or institutional affiliation to use and reproduce our research. References for the dataset and system are given at the beginning of LABEL:sec:data_acquisition and LABEL:subs:interface, respectively.
1.4 Outline
Chapter 1 introduced the current problem in research and research in general, which this thesis will work on (Section 1.1), proposed a solution to address the problem (Section 1.2), and listed our specific contributions (Section 1.3).
Chapter 2 introduces fundamental knowledge the reader needs to understand this thesis, including some technical aspects and concepts (e.g., topic modeling and scientometrics) we use in this thesis.
Chapter 3 addresses RT1, by investigating what scientometric studies other researchers perform and what data sources and tools they use (Section 3.1). We then review those data sources and tools and determine there is currently no free solution that can perform a quantitative analysis on research and thus show which gap CS-Insights and our research fill (LABEL:sec:resources).
LABEL:chap:methodology presents our methodology, which is composed of RT2 and RT3. We begin by explaining how we acquire our data from DBLP and how we enrich it with more metadata from full-texts (LABEL:sec:data_acquisition). Next, we cover how we store the data and make it accessible through an (LABEL:sec:data_storage). The rest of the chapter is spent on detailing the and its features, i.e., dashboards, filters, and visualizations (LABEL:subs:design to LABEL:subs:interface). We also include some showcases to demonstrate how the system can be used (LABEL:sub:showcases)
LABEL:chap:implementation goes over some implementation details that relate to RT2 and RT3. We provide an overview of the CS-Insights system, its components and their architecture (LABEL:sec:architecture), and some details on our measures for quality assurance (LABEL:sec:qa).
LABEL:chap:analysis addresses RT4 by conducting an extensive analysis, that follows the research questions given earlier in the chapter. We split each research question into multiple smaller experiments, each of which receives a discussion, that evaluates the findings and relates them to other experiments and previous research. Before starting with the experiments, we state the general setup of how we conduct them (LABEL:sec:setup). We then group the experiments by the main attribute they investigate (e.g., publications, authors, document types) and for each experiment include a figure or table that contains the results we then discuss (LABEL:sec:publications to LABEL:sec:fields). In the end, we provide a summary of the chapter that shows we cover each aspect of each research question (LABEL:sec:analysis_summary).
LABEL:chap:final presents the final considerations of this thesis. We list our contributions and most interesting findings and conclude is a very active and growing field, whose characteristics and trends a scientometric analysis with CS-Insights can uncover (LABEL:sec:conclusion). Finally, we present the limitations and future work of this thesis (LABEL:sec:limitations).
LABEL:chap:appendix includes supplementary figures of the and some of its visualizations, which are referenced throughout this thesis.
2 Fundamentals
This chapter shortly introduces some basic concepts related to technical aspects (Section 2.1), topic modeling (Section 2.2), and scientometrics (Section 2.3).
2.1 Technical Aspects
| MySQL | MongoDB |
| Database | Database |
| Table | Collection |
| Index | Index |
| Row | Document |
| Column | Field |
| Join | Lookup |
| Primary key | Primary key |
| Group by | Aggregation |
The CS-Insights system uses a MongoDB 111https://www.mongodb.com/ database to store its data (LABEL:sec:data_storage). MongoDB is a document-oriented database, and not a relational database (e.g., MySQL). The key difference is the way data is stored in a document-oriented database: data is stored in documents, while relational databases use tables with rows and columns. Thus, the terminology also changes, which Table 2.1 highlights. In document-oriented databases the schema is not fixed, so adding and removing fields is easier, which allows for quicker iterations during development. The documents in MongoDB use JSON’s key-value pairs, but add support for more features (e.g., dates) \parencites[3,16-17]bradshaw_mongodb_2019gyorodi_comparative_2015.
We then provide access to this data through a on our server (LABEL:subs:api), i.e., an , which is based on the four principles of : identification of resources, manipulation of resources through representations, self-descriptive messages, and hypermedia as the engine of application state [fielding_information_2000, 82]. This means REST uses HTTP verbs (e.g., GET, POST, DELETE) to transfer data as representations in a well-defined media type (e.g., JSON, XML). The resources are identified through unique resources identifiers (URIs), e.g., shop/products/ to perform operations on all products or shop/products/42 for operations on product 42 [kopecky_history_2014]. operations [bradshaw_mongodb_2019, 14] can then be performed on our data through the .
2.2 Topic Modeling
Topic models are statistical models, that cluster a group of words into meaningful “topics” from any unstructured text or text corpus (e.g., emails, book chapters, blog posts). Each document in a corpus is treated as a “bag of words”, i.e., the location of words in the document, syntax, and narrative of the document are ignored. The models then use these bags to determine the co-occurrence of specific words across the corpus of bags and generate the distribution of words that refers to each topic. Topic modeling is an automated approach, so researchers only have to define the number of topics the corpus is supposed to be sorted into [mohr_introductiontopic_2013]. The idea behind this is, e.g., documents about cats often include “cat” and “meow” and documents about dogs “dog” and “woof”, which show these words occur together in specific documents and relate to the same topic.
[blei_latent_2003] is a generative probabilistic model and the most used topic modeling approach. It assumes each document contains multiple themes/topics the authors want to discuss. The document is then generated by the authors by repeatedly selecting a topic and a word from that topic and placing it in the bag of words of the document until the document is completed. Selecting the next topic is based on the distribution of topics across the documents and selecting the next word is based on the distribution of words across the selected topic. then tries to infer the intents of the authors when generating the document by reverse-engineering the two distributions that are used to draw the topics for a document and words from a topic. Once both distributions are determined the most probable words for a specific topic can be used by humans to imagine the actual topics, as cannot generate topic labels [mohr_introductiontopic_2013].
The most probable words of specific topics can also include common words that are present across all topics, as they appear in many different scenarios (e.g., “paper” or “present” for scholarly articles). These generic words also appear in the list of most frequent terms of the entire corpus and explain little about the topic’s contents or the corpus. [chuang_termite_2012] develop the ranking measure “saliency”, which is supposed to filter a corpus’s list of most frequent words and rank words higher that only appear in a few topics, and words lower that appear in many topics. They first define the distinctiveness of a word, which measures how informative the word is for determining the generating topic, e.g., the word “brain” would be informative, while “paper” would not. Saliency is then computed by weighing the distinctiveness of a word against the overall probability of that word in the corpus. The list of the most salient words would then rank “paper” lower than the list of the most frequent words, making it easier to find differences between topics.
2.3 Scientometrics
Scientometrics is the study of quantitative aspects of science and technology, i.e., exploration and evaluation of scientific research. It covers measuring the quality of research and its impact, tracking and understanding citations, mapping and visualizing scientific fields, and using these measures for policy and management decisions (e.g., by institutions). Quantitative measures employed are, e.g., the impact factor for venues (average amount of citations per publication per year of that venue) or the h-index for authors ( papers of the author have at least citations). Bibliometrics is similar to scientometrics and uses statistical methods to analyze publications and books, e.g., citation graphs. Both scientometrics and bibliometrics are sub-fields of informetrics, which covers the study of all information as a whole, regardless of form or origin [mingers_review_2015]. An example of a scientometric study in is [coskun_scientometrics-based_2019], which analyzes the trends over time regarding countries, document types, institutions, author collaboration, keywords, and journals. [fiala_computer_2017] conduct a bibliometric study investigating the quantity and the impact of publications according to document types, languages, disciplines, countries, institutions, and publication sources. Both use similar approaches (e.g., by examining the distribution of document types or most publishing institutions and countries) even though one is called a scientometric study and one a bibliometric study, which shows the closeness of bibliometrics and scientometrics when analyzing only scientific publications. We will further explore the findings of both studies in Section 3.1.1.
3 Related Work
This chapter provides an overview of related (scientometric) studies and the existing resources that can be used to make these studies easier. We start by investigating previous scientometric studies in and their findings, where we also show what data and tools the authors use for their analyses (Section 3.1.1), and shortly look into unique approaches in (LABEL:subs:studies_nlp). Then, we present the data sources those studies use and other available data resources to show their limitations, and which gap CS-Insights fills (LABEL:subs:broad_aggregators to LABEL:subs:specialized_aggregators). We also show a few general tools that can aid researchers in scientometric studies and highlight their differences from CS-Insights (LABEL:subs:general_tools). Finally, we present selected tools from , as some of these tools are very similar to what CS-Insights tries to achieve (LABEL:subs:resources_nlp).
3.1 Scientometric Studies
This section covers previous scientometric studies in (Section 3.1.1) and shortly explores scientometric studies in (LABEL:subs:studies_nlp). We show many researchers rely on paid-access data and most researchers do not use any specific tool to automate their studies.
3.1.1 Scientometric Studies in Computer Science
In this subsection, we review the previous work of other researchers on research to see which analyses are done, prove useful, and should also be provided in CS-Insights. We cover broad studies of , studies on topics and terms, conferences vs. journals, and lastly some studies on the differences between and other research fields.
3.1.1.1 Broad Studies on Computer Science Research
First, we look into two broad studies on research that investigate many areas of research (e.g., publications, authors, venues, and citations). [coskun_scientometrics-based_2019] use data from the Web of Science core collection to perform a scientometrics-based study of and Information Science research by looking at two periods (2008-2013 and 2014-2019) with 57,347 and 96,219 documents respectively and comparing the results to discover trends. They look into the document types and find that there are slightly fewer conference papers in the second period, but the overall amount of documents increases, as there are more journal articles and documents from other types. Conference papers make up most documents in both periods, but the gap between papers and articles closes over time. The top journals come mostly from engineering and other technical sub-areas (e.g., from IEEE or IEICE), which also reflects in the top research areas, as they also show a focus on technical and engineering-related issues. Lastly, they use networks from VOSViewer 111https://www.vosviewer.com/ to investigate the recurrence of keywords, which reveals a shift to current issues, such as privacy, security, IoT, and big data.
[fiala_computer_2017] investigate the quantity and impact of 1.9m papers in based on document type, language, discipline, country, institution, and publication source from 1945 to 2014 available in Web of Science. They investigate the distribution of document types, which shows that proceedings papers make up the biggest part of the collection, but articles have more than 7x the number of citations. The number of articles shows a steady rise over time, except for one large drop in 2007 which the authors attribute to papers published in two book series being classified differently from 2007 onward. Similarly, the amount of proceedings papers rises over time, except for a drop between 2010-2011, because multiple conferences are not indexed in those years. The distribution of document languages shows that 99% of all documents are in English. Considering all seven subject categories in Web of Science, “Artificial Intelligence” has the most papers and citations, while “Interdisciplinary Applications” has the most citations per paper. In the top 20 sources (i.e., venues) the “Lecture Notes in Computer Science” have the most papers, the “Journal of Computational Physics” has the most citations, and the “IEEE Transactions of Information Theory” has the most citations per paper. [fiala_computer_2017] also compare the top 20 keywords for the entire time frame against those before 1995 and periods of five years after 1995 and find unique keywords in each period except 2005-2009. They also investigate the top 20 cited references (#1 being “INFORM CONTROL” from Zadeh, L.A.) and papers (#1 being “Fuzzy sets” from Zadeh, L.A.). The distribution of citations shows most citations are two years old, followed by three years, and one year, while 52.2% of papers remain uncited and less than 1% get over 100 citations.
The approach of our analysis in this thesis (LABEL:chap:analysis) is inspired by that of [coskun_scientometrics-based_2019, fiala_computer_2017], as we also conduct a broad study of research (i.e., looking into publications, authors, venues, and citations). While both conduct their analyses manually, we develop and use our system (CS-Insights), which can generate visualizations easily and intuitively. CS-Insights can replicate most of their analyses and show the top publications, authors, or venues, the distribution of document types and citations, and how they all change over time. Our topic modeling component can also determine the most salient terms for specific periods, venues, or authors. We also extend the studies of [coskun_scientometrics-based_2019] and [fiala_computer_2017] by using a much larger dataset (CS-Insights has 5m publications and the updated version of D3 6m222https://zenodo.org/record/7069915), diving deeper into the areas they analyzed (e.g., distribution of citations and papers across authors and venues), and investigating more areas (e.g., the differences between and other fields of study; see the rest of this section). Future researchers can also use CS-Insights to verify and extend our research even further.
3.1.1.2 Other broad Studies
Some works allocate a part of their analysis to detail differences between institutions or countries over time or which are the most productive affiliations [coskun_scientometrics-based_2019, fiala_computer_2017, xia_research_2021]. The current version of our dataset does not include any data on the affiliations, so we leave the inclusion and investigation of institutions and countries to future work (LABEL:sec:future_work). For this reason, we also leave out the many studies that focus entirely on analyzing the state and trends over time of research for specific countries [uddin_scientometric_2015, supriyadi_bibliometric_2022, faiz_bibliometric_2020] or institutions in general [zurita_bibliometrics_2020]. The country-specific studies focus on the output and performance of publications, authors, and institutions. For example, [uddin_scientometric_2015] compare the performance stats (e.g. publications, citations) of Mexico against the world over time, investigate top countries, institutions, publication sources, and authors, the number of authors per paper, and collaboration patterns of authors, institutions, and countries. [zurita_bibliometrics_2020] only rank the institutions based on citations in seven sub-fields of . This shows their approaches mirror [coskun_scientometrics-based_2019, fiala_computer_2017] or cannot be replicated with our data, so we do not cover their analyses and results any further. The authors of the studies on countries and institutions use different data sources, e.g., Scopus [supriyadi_bibliometric_2022, faiz_bibliometric_2020], or Web of Science [uddin_scientometric_2015, zurita_bibliometrics_2020]. For evaluation [faiz_bibliometric_2020] uses SciVal 333https://www.scival.com/, but most researchers use no tool for their evaluation or do not specify it.
Some studies also include analyses with networks on authors, citations, or terms [coskun_scientometrics-based_2019, uddin_scientometric_2015]. While we look into some of these areas, we do not leverage any networks and thus cannot perform any analyses, which require networks or graphs. In the future, we intend to also conduct analyses with networks (LABEL:sec:future_work).
3.1.1.3 Studies on Topics & Terms
Other studies focus more on emerging terms and which areas are researched currently. [tattershall_detecting_2020] apply a stock-market-inspired burst detection algorithm to DBLP data (2.6m documents between 1988 and 2017) to find “bursty terms”, i.e., the fastest-rising topics in the history of research. They find historic peaks for “Java”, “e-commerce”, and “Smartphone”, and that “word embeddings” and “deep learning” are still rising. Terms like “neural network” and “virtual reality” have two peaks, while other terms like “novel” are linearly increasing. Most terms show a life cycle of popularity and their classifier can predict with an accuracy of 80%, whether a term will rise or fall in popularity. [xia_research_2021] use a different approach and leverage data from Scopus (75m documents from 1996 onward) and its classification system of subject areas. They cluster the publications based on direct citation references and then evaluate the prominence of each topic using citations, views, and the impact of recent years. The authors investigate the top 20 frontiers in and find “Object Detection; CNN; IOU” to be the most prominent one, followed by “Bitcoin; Ethereum; Blockchain”, while the most prominent frontier in is “Sentiment Classification; Named Entity Recognition; Entailment”, followed by “Sentiment Classification; Opinion Mining; Product Review”. We do not analyze the evolution of single terms or the most prominent topics as a whole, but using CS-Insights’s topic modeling component, we can determine the most salient terms and most prominent topics for venues, authors, and fields of study, and how they change over time.
3.1.1.4 Studies on Conferences vs. Journals
Another popular area is the comparison of conferences and journals in research [franceschet_role_2010, vrettas_conferences_2015], which is tied to the characteristics of research itself. Most researchers in focus their publications on conferences and not journals, unlike other research fields (e.g., medicine), where researchers use journals as the primary way to publish their findings [vrettas_conferences_2015, vardi_conferences_2009, franceschet_role_2010]. [vrettas_conferences_2015] argue this is the reason why many studies compare conferences and journals in , as is an outlier among the research fields in this regard.
[rahm_citation_2005] analyze the citation frequencies between two conferences and three journals in the database field from DBLP over 10 years (1994-2003), with citation information from Google Scholar. They conclude, that the conferences have a higher citation impact than the journals. In a later publication, [rahm_comparing_2008] finds that conferences still have a higher impact than journals, again using select high-quality conferences and journals between 1996 and 2004. On the other hand, [franceschet_role_2010] finds that journals have a higher impact in than conferences. He uses data from DBLP, Google Scholar, and Web of Science to look into the top authors based on different measures (e.g., number of publications), which shows researchers in publish more in conferences than journals. His study on the most popular topics and nations with the highest scientific impact with separate entries for journals and conferences both show that journals receive significantly more citations and thus have a higher impact. [vrettas_conferences_2015] conclude the differences between the findings of [rahm_citation_2005, franceschet_role_2010] are due to different data sources, as [rahm_citation_2005] use DBLP and [franceschet_role_2010] uses Web of Science. While [franceschet_role_2010] also uses Google Scholar and DBLP data, his conclusion that journals have a higher impact is based solely on publication and citation information from Web of Science. [vrettas_conferences_2015] also examine conferences (195,513 papers) and journals (108,600 papers) themselves, by using data from Microsoft Academic Search 444The service was retired in 2012. and aligning it with venue rankings from the Australian government’s research assessment . They find the difference between citations of journals and conferences in is marginal. Aligning the venues by the ranking, the high-ranked conferences get, on average, more citations than the high-ranked journals. Incidentally, this aligns with [rahm_citation_2005], who also compare reputable conferences and journals.
In our research, we are also taking a venue-based approach like [rahm_citation_2005, vrettas_conferences_2015], by looking at the BibTeX entries of publications, which determines whether the publication is from a journal (i.e., “article”) or a conference (i.e., “inproceedings”). We extend their work by covering the number of citations and publications, topics, changes over time, top venues, and preferences of top authors. Other researchers use more author-based approaches to analyze publication patterns of authors and affiliations [kim_author-based_2019, kumari_scientometric_2020].
3.1.1.5 Studies on Comparisons between and other Research Fields
[vrettas_conferences_2015] show that there is a prevalence of conferences in , as 76% of ranked conferences in the assessment across all fields are from . [michels_systematic_2014] also show other research fields prefer journals by listing the distributions of publications among journals and conferences for 27 research fields in Web of Science in 2009. Yet, [subelj_publication_2017] show growth in journal publications in and attribute this to a rising number of new journals, rather than each journal publishing more. This is again different from other research fields, as the rise in journal articles in physics is due to the existing journals publishing more [subelj_publication_2017].
We also investigate the differences between