Directed flow of light flavor hadrons for Au+Au collisions at 7.7 - 200 GeV
Abstract
We have studied the directed flow of light-flavor hadrons for Au + Au collisions at 7.7 - 200 GeV. The initial condition is taken from a suitable Glauber model which is further evolved within the framework of relativistic hydrodynamics. Model calculations of the rapidity-odd directed flow () of identified light-flavor hadrons are compared with the available experimental data after suitably calibrating the initial condition to describe the rapidity dependence of charged particle multiplicity and net-proton yield. For reasonable choice of the initial condition, we are able to describe the measured rapidity and beam energy dependence of identified hadron including the observed splitting between baryons and anti-baryons.
I Introduction
Heavy-ion collisions in the Beam Energy Scan (BES) program at the Relativistic Heavy Ion Collider (RHIC) create a QCD medium with varying amount of net baryon in the mid-rapidity region Adamczyk et al. (2017), which allows one to probe a large region of the QCD phase diagram. It provides a unique opportunity to understand the dynamics of conserved charges in the QCD medium and to study the nature of phase transition from the state of Quark Gluon Plasma (QGP) to hadronic medium at finite baryon chemical potential. The beam energy dependence of the rapidity-odd directed flow() of identified particles is proposed to be one of the relevant observable to probe the nature of QCD phase transition Rischke:1995pe; Rischke:1996nq; Hung:1994eq; Steinheimer et al. (2014); Ivanov and Soldatov (2015); Ivanov:2016spr.
The directed flow() is defined as the first harmonic coefficient in the Fourier series expansion of the azimuthal distribution of the particles produced relative to the reaction plane .
| (1) |
where and are longitudinal rapidity and azimuthal angle of a produced particle, respectively. Breaking in forward-bacward symmetry generates a non-zero which is an odd function of rapidity in symmetric heavy-ion collisions.
STAR collaboration has measured the energy dependence of the slope of directed flow at mid-rapidity for various identified particles Adamczyk et al. (2014, 2018). A minima in the slope of proton has been observed between GeV and GeV. This has been attributed to the softening of the QCD equation of state (EoS) Steinheimer et al. (2022); Nara et al. (2016). From transport model calculations, it has been observed that the rapidity odd directed flow is sensitive to the nature of EoS Steinheimer et al. (2022); Nara et al. (2016); Konchakovski et al. (2014); Ivanov and Soldatov (2015); Nara and Ohnishi (2022) and provides a possible hint of first order phase transition of the QCD matter at larger baryon chemical potential Steinheimer et al. (2022); Nara et al. (2016). It has been further noticed that the reported experimental data shows a splitting between the slope of baryon and anti-baryon directed flow which increases by decreasing the collision energy. Recently, a hydrodynamic model calculation at GeV has shown that one may also obtain such splitting from the initial inhomogeneous deposition of baryon in the transverse plane Bozek (2022).
The directed flow is generated as a response to the initial pressure asymmetry and carries information about the early stage of collisions Csernai and Rohrich (1999); Snellings et al. (2000); Adil and Gyulassy (2005); Becattini et al. (2015); Bozek and Wyskiel (2010); Ryu et al. (2021); Jiang et al. (2022). Therefore, model-to-data comparison of the of identified hadrons has the potential to constrain the initial profile of both matter and baryon which in turn serves as a crucial ingredient to study the dynamics of conserved charges.
There have been several attempts to capture the beam energy dependence of directed flow of identified particles in transport Chen et al. (2010); Guo et al. (2012); Nara et al. (2022) and hybrid models Steinheimer et al. (2014); Ivanov and Soldatov (2015); Shen and Alzhrani (2020); Du et al. . However, a consistent approach that qualitatively captures the experimental trends across beam energies is missing Singha et al. (2016).
There have been efforts to construct frameworks for the three-dimensional evolution of the QCD conserved charges along with energy density for the RHIC BES Karpenko et al. (2015); Du and Heinz (2020); Li and Shen (2018); Shen and Alzhrani (2020); Denicol et al. (2018); Wu et al. (2022); De et al. (2022); Fotakis et al. (2020). One of the important goals in building such frameworks is to constrain the transport coefficients related to charge diffusion. Such attempts are hindered mainly by the large uncertainties in the initial matter and baryon deposition. An additional complication arises due to the large passage time of the colliding nuclei at lower , which consequently increases the initial proper time when hydrodynamics becomes applicable. There have been few attempts to implement a dynamical initialization condition for hydrodynamic evolution Akamatsu et al. (2018); Du et al. (2019); Shen and Schenke (2022); De et al. (2022); Okai et al. (2017); Shen and Schenke (2022, 2018). There have also been attempts to propose a simple geometrical ansatz that can qualitatively capture the trends in the data Denicol et al. (2018); Shen and Alzhrani (2020); Ryu et al. (2021); Bozek (2022); Du et al. . In this work, we follow the latter approach. We have recently proposed an initial baryon profile Parida and Chatterjee (2022) which when coupled to tilted matter profile Bozek and Wyskiel (2010) provides a reasonably good description of the identified hadron at GeV and 200 GeV. In this work, we have tested the performance of this newly proposed initial condition model across beam energies ranging from 200 GeV to 7.7 GeV. In addition to that, the centrality and transverse momentum dependency of have been presented and compared to available measurements.
In this study, we have used a multistage hydrid framework (hydrodynamic evolution + hadronic transport) for simulations at different . In the next section, we will describe the initial condition model which is used as an input to the hybrid framework. The transport coefficients and EoS used during the hydrodynamic evolution are presented in Sec. III. The procedure for selecting the model parameters to capture the experimental results are explained in Sec. IV. We have presented the results in Sec. V and Sec. VI is devoted to summarize the current study with some concluding remarks.
II Initial condition
We have adopted a similar procedure as described in Shen and Alzhrani (2020); Denicol et al. (2018) to prepare an event average profile of the initial energy and the net baryon density. The participant and binary collision sources obtained from each MC Glauber event are rotated by the second-order participant plane angle and then smeared out in the transverse plane. The smearing profile is assumed to be a Gaussian with parametric width, . Profiles are prepared by averaging over 25,000 initial configurations.
Assuming asymmetric matter deposition by a participant along the rapidity, the form of the initial energy density deposition at a constant proper time is taken as Bozek and Wyskiel (2010),
| (2) | |||||
where, and are the participant densities of forward and backward moving nucleus respectively. is the contribution of binary collision sources at each transverse position . is the hardness factor. are the asymmetric rapidity envelop function for the energy density, .
| (3) |
with
| (4) |
and
| (5) |
The form of the initial baryon profile is
| (6) |
are the weight factors to deposit the net baryon in the transverse plane which has the following form.
| (7) |
The net baryon distribution in the transverse plane can be tuned by varying the phenomenological parameter . The net baryon density rapidity envelope profiles are taken as Denicol et al. (2018); Shen and Alzhrani (2020),
| (8) | |||||
and
| (9) | |||||
The normalization factor in Eq. 6 is not a free parameter, rather it is constrained by the initially deposited net baryon carried by the participants.
| (10) |
With the asymmetric baryon profile given in Eqs. 8 and 9 we generate a tilted baryon profile in the reaction plane at the initial stage. The magnitude of the tilt can be controlled by changing the parameter.
III Hydrodynamic Evolution
The publicly available MUSIC Schenke et al. (2010); Paquet et al. (2016); Schenke et al. (2012) code has been used for the hydrodynamic evolution of the deposited energy and the baryon density profile. The hydrodynamic equations of the conserved quantities and the dissipative currents in the presence of finite baryon density, which are solved in the framework of MUSIC have been described in Denicol et al. (2018). Other conserved charges, net strangeness( ) and net electric charge densities() are not evolved independently and are assumed to satisfy the following constraints locally.
| (11) | |||||
| (12) |
A temperature () and baryon chemical potential () dependent baryon diffusion coefficient() has been implemented in the code which is derived from the Bolzmann equation in relaxation time approximation Denicol et al. (2018). The form of is as follows :
| (13) |
is a free parameter which controls the baryon diffusion in the medium. This has been taken as a model parameter in the simulation. In the above expression, is the net baryon density and is the local pressure of the fluid. The specific shear viscosity is related to the shear transport co-efficient as follows.
| (14) |
This is another model parameter and chosen to be 0.08. In this work, we have not considered the effects of bulk viscosity.
IV Model parameters
We have studied Au+Au collisions at seven different energies: 7.7, 11.5, 19.6, 27, 39, 62.4 and 200 GeV. The values of the model parameters used in the study have been summarized in Table 1. They are chosen to describe the experimentally observed rapidity dependence of the charged particle yield, net-proton yield and directed flow of and simultaneously. Using these model parameters, we have computed and presented the rapidity dependence of of other identified hadrons: K±, , and . In addition, we have also presented the differential .
In our previous work Parida and Chatterjee (2022), we have shown that our proposed initial condition with both zero and non-zero is able to describe the observed splitting between baryon and anti-baryon directed flow at 19.6 GeV and 200 GeV within the experimentally measured rapidity range. Hence, we are not able to constrain the values within the current ambit of model and available experimental data by a unique model-to-data comparison. The same has been observed for other . In this work, we have presented the model calculations with for above 11.5 GeV and at and 7.7 GeV (we couldn’t find a suitable parameter set for at these lowest energies).
The normalization parameter of the initial energy density distribution is calibrated to match the yield of charged hadron in mid-rapidity. However, the yield has been considered to set at energies where the mid-rapidity measurement of charged hadron is not available. The hardness factor has been chosen to capture the centrality dependence of the charged hadron yield.
The plateau length and Gaussian fall off in the initial matter profile are adjusted to describe the rapidity dependence of the charged particle yield. From the existing experimental data, we have observed that the rapidity dependent charged hadron yields at different energies follow the same distribution when the pseudo-rapidity is scaled by the respective beam rapidity. Therefore, we have chosen and to capture that scaled distribution at the energies where the rapidity distribution of neither the charged particle nor the identified particle has been experimentally measured.
Rapidity distribution of net-proton yield which is capable of constraining , and has been measured for Au+Au systems at and 62.4 GeV by the BRAHMS collaboration Bearden et al. (2004); Arsene et al. (2009) but is not available at other energies considered in this work. However, the mid-rapidity measurements for Au+Au systems has been done by STAR collaboration Adamczyk et al. (2017). We tuned the parameters of initial baryon profile to match with the mid-rapidity measurements at energies below 62.4 GeV.
The adopted initial condition model creates a tilted profile of both energy density and the net baryon density in the reaction plane (spanned by beam axis and impact parameter axis). Individually and parameters can be tuned to obtain the desired tilt in the energy and baryon profile respectively. However, only a proper set of and choice can explain the directed flow of and simultaneously after hydrodynamic evolution.
| (GeV) | (fm) | (GeV/fm3) | |||||||||
| 200 | 1.0 | 0.6 | 8.0 | 0.14 | 1.3 | 1.5 | 4.6 | 1.6 | 0.1 | 2.2 | 0.25 |
| 62.4 | 1.0 | 0.6 | 5.4 | 0.14 | 1.4 | 1.0 | 3.0 | 1.0 | 0.1 | 1.4 | 0.25 |
| 39 | 1.0 | 1.0 | 3.0 | 0.12 | 1.0 | 1.0 | 2.2 | 1.2 | 0.2 | 1.1 | 0.2 |
| 27 | 1.0 | 1.2 | 2.4 | 0.11 | 1.3 | 0.7 | 2.3 | 1.1 | 0.2 | 1.1 | 0.11 |
| 19.6 | 1.0 | 1.8 | 1.55 | 0.1 | 1.3 | 0.4 | 0.3 | 0.8 | 0.15 | 0.8 | 0.15 |
| 11.5 | 0.5 | 2.6 | 0.9 | 0.1 | 0.9 | 0.4 | 1.2 | 0.55 | 0.2 | 0.4 | 0.22 |
| 7.7 | 0.5 | 3.6 | 0.55 | 0.1 | 0.9 | 0.4 | 0.9 | 0.35 | 0.2 | 0.3 | 0.35 |
V Results
Pseudo-rapidity() distributions of charged hadrons have been plotted in panel (A), (B) and (C) of Fig. 1 for 0-6 and 15-25 Au+Au collisions at and GeV. We are able to capture the rapidity distribution by suitably choosing the , and for the initial space-time rapidity distribution of energy density. The rapidity() differential yield has been presented in panel (D), (E), (F) and (G) of Fig. 1 for Au+Au collisions at and GeV where the charged particle measurement is not available. We have fixed the parameter by matching the model calculation with the mid-rapidity yield measurement at those energies. The rapidity distribution of inital energy profile has been calibrated by compairing the model calculation with the scaled distribution as discussed in previous section. The chosen hardness factor provides a reasonable description about the centrality dependence of the charged particle yield across all energies.
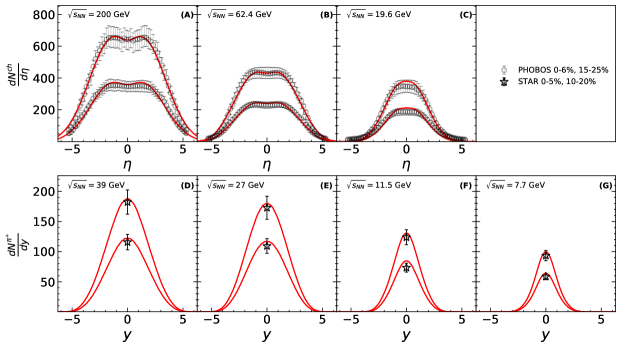
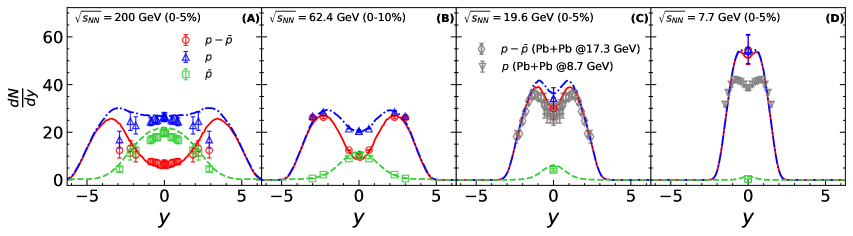
It is important to look at the distribution of net-proton along rapidity to constrain the longitudinal gradient of baryon chemical potential which plays a significant role in flow calculations. In this regard, we have plotted the proton, anti-proton and net-proton rapidity distribution for central Au+Au collsions at , and GeV in Fig. 2. We have obtained a good agreement between our model calculations and the experimental measuremets. The contributions from weak decays have been included in the calculation of proton and anti-proton yield to compare with the experimental measurements. In addition to that, we are able to capture the rapidity distribution of proton and anti-proton separately which reflects the fact that the chosen freeze-out energy density represents a proper combination of the tempearture and baryon chemical potential of chemical equilibration Andronic et al. (2018). The rapidity diferential net-proton measurements for Pb+Pb collisions at 17.3 GeV and 8.7 GeV has been done by NA49 collaborartion Anticic et al. (2011). We have considered the experimental data of net-proton distribution at 17.3 GeV as a proxy to constrain the model parameters present in Eq. 8 and 9 for the Au+Au collisions at 19.6 GeV, whereas the data of net-proton at 8.7 GeV has been put along with the model calculation of Au+Au GeV just for reference.
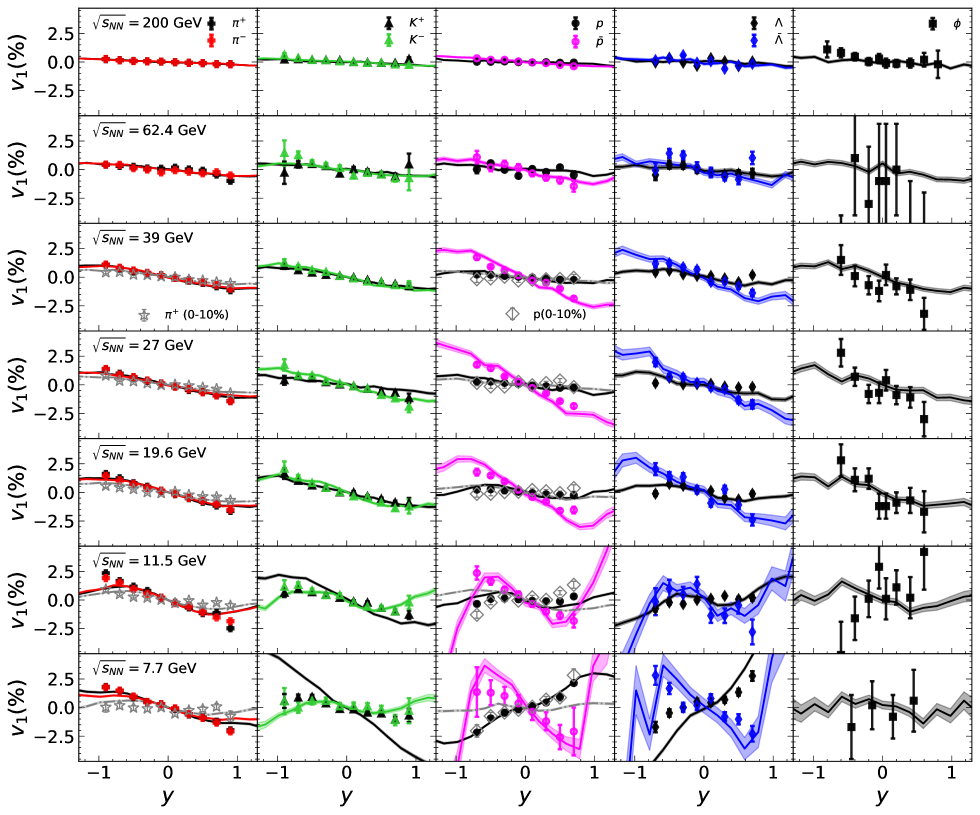
After calibrating the model parametrs of the initial energy and baryon density profile, we now present the directed flow() of identified particles in 10-40 Au+Au collisions at different in Fig. 3. Each row in the figure contains the results from a particluar collision energy whereas the directed flow of various particle species are put in different columns. The top row contains the rapidity dependence of directed flow coefficients in Au+Au collisions at GeV. The results for other energies are placed in subsequent rows in descending order. The for , , , and has been presented in column 1, 2, 3, 4 and 5 respectively. In addition, the of and in 0-10 centrality class has been plotted for the comparison at energies below GeV.
The relative tilt between the matter and baryon profiles determines the sign of the splitting between proton and anti-proton directed flow Parida and Chatterjee (2022). Thus, by suitable choice of (, ) at each , we are able to describe the rapidity dependence of for and simultaneously in 10-40 centrality whereas, the of other particle species plotted in Fig 3 are the model predictions. We are able to capture the sign change in slope of proton directed flow at GeV. From Table 1, one can observe that the value of decreases consistently with collision energy whereas the chosen value for model calibration seems to suggest a non-monotonic behaviour with collision energy. In order to confirm such non-monotonic behaviour of with , we need to perform a more sophisticated fitting procedure to extract the model parameters. The purpose of the current study is to demonstrate the existence of reasonable parameter space in this proposed model that captures the data trends quite well.
An inhomogeneous deposition and further evolution of net-baryon density in the medium creates inhomogeneities for the other conserved charges like strangeness and electric charge via the constraints in Eqs. 11 and 12 that give rise to correlations between the corresponding chemical potentials: , and for baryon, electric charge and strangeness respectively. This gives rise to splitting in directed flow of hadrons with different quantum numbers but same mass similar to the splitting of and . The splitting of between and is solely due to the inhomogeneity of in the medium. However, the inhomogeneity of both and are responsible for the difference in directed flow coefficient of and . In the present model calculation, we have not observed any significant splitting of between and which is consistent with experimental measurements. However, the splitting between and at and GeV is noticeable while it is consistent with zero in data. The same has been observed in case of and since they are getting affected by along with . In this case, the data also shows split. Although the model split is consistent with data for GeV, for and GeV the model overpredicts the data. At these same energies, the model also fails to capture the implying interesting physics of strange carriers that has not been included in the current model. These discrepancies underline the significance to evolve all the conserved charges independently in a fluid dynamical simulation Greif et al. (2018); Fotakis et al. (2020).
The directed flow measurements of and at 0-10 centrality are also plotted in Fig. 3 along with 10-40 for the ease of comparison. Our model calculations capture the centrality dependence of for at all the considered collision energies but it fails to do so for below GeV. It indicates that the mechanism of baryon stopping from central to peripheral collisions is different at lower energies and our model is unable to provide a proper gradient of initial net-baryon density at different centralities. From the microscopic models, we have the guidance that the baryon deposition mechanism is dependent on transverse position Li and Kapusta (2019, 2017); De et al. (2022); Shen and Schenke (2018, 2022) which need to be further explored. In this direction the centrality dependence measurement of proton directed flow could play a significant role.
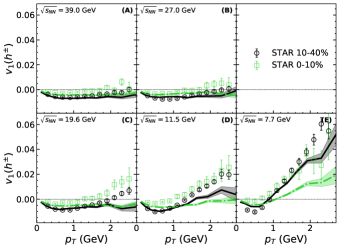
So far we have discussed about the rapidity differential behaviour of . Now we will present the dependency of which provides the information about the initial deposition and evolution of matter in the transverse plane around mid-rapidity region. In this regard, The differential directed flow of charged hadrons in 0-10 and 10-40 Au+Au collisions at and have been plotted in Fig. 4. The model calculations are in agreement with the experimental measurements in low region at all energies but fail to explain the trend in the high region. Nevertheless, the integrated does not get affected by this discrepancies due to relatively higher yield of low hadrons. We are able to capture the centrality trend in the differential , which in turn shows the correct centrality dependence of rapidity differential directed flow in Fig 3.
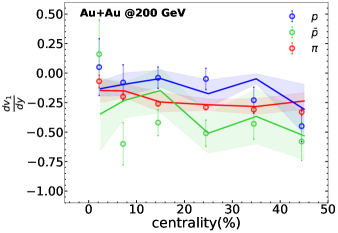
Fig. 5 shows the centrality dependence of the slope of identified particle directed flow in Au+Au collisons at GeV. slopes in the model at each centrality have been calculated by fitting a straight line in the mid-rapidity region. Although the model parameter is tuned for 10-40 centrality, we are able to describe the magnitude and hierarchy in the directed flow slope of and at other centralities.
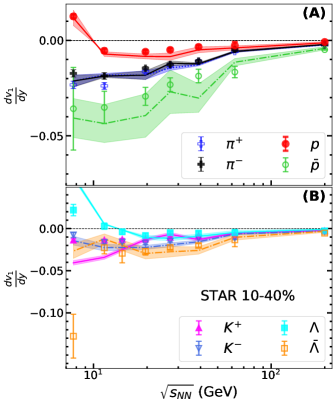
The slope of identified particles’ directed flow has been plotted as function of collision energy for 10-40 Au+Au collisions in Fig. 6. Slopes of and have been plotted in panel (A) whereas the slopes of and have been presented in the panel (B). In the model calculation of directed flow slope, the fitting function and fitting range in rapidity has been taken the same as mentioned in the experimental papers Adamczyk et al. (2014, 2018). We have observed that the -slope of and changes sign at lower energies whereas the slope of their corresponding anti-particles remains negative at all energies. The mangnitude of the slopes are in good agreement with the expermental data. The split between the slopes of and at GeV is overestimed by the model calculations which is already observed in the plots of rapidity differential in Fig 3.
VI Summary
In the present study, our goal is to study the measured beam energy dependence of the rapidity-odd directed flow of identified particles at RHIC BES. In this regard, we have adopted the model of initial baryon deposition proposed in Parida and Chatterjee (2022). The model assumes the asymmetric matter and baryon deposition in forward and backward rapidity by a participating nucleon. As a consequence, a tilted matter and baryon profile in the reaction plane are formed, although the tilts are different. Taking the model as an input for a multi stage hybrid framework(hydrodynamics + hadronic transport) and calibrating the model parameters to describe the measured rapidity distribution of charged particle and net-proton, we are able to describe the observed directed flow splitting between proton and anti-proton across beam energies ranging from 7.7 GeV to 200 GeV. The model is able to capture the sign change of proton- slope at lower enrgies. In addition to that we have studied the directed flow of , and . From model calculations, we are able to describe the rapidity differential directed flow of all the identified particles simultaneously above GeV. However, the noticable discrepancies in the split of direct flow between and at GeV is attributed to the constraints put in the EoS. This indicates that individual evolution of strangeness and electric charge should be done in hydrodynamic simulations at lower RHIC energies instead of constraing those via EoS. Our model is unable to capture the centrality dependency of proton directed flow at lower beam energies which shows that baryon stopping mechanism is very different from central to peripheral collisions. The analysis demonstrates the importance of the measurement of centrality dependecy of proton-.
In hydrodynamic calculations, it is known that the flow coefficients are response of initial gradient. Hence, the initial deposition plays a dominant role in explaining the measured directed flow of identified particles. Nevertheless, the effects due to non-trivial phenomena like dynamical initialization, non-zero initial longitudianl flow, event-by-event fluctuations and the nature of EoS which are not considered in present framework should not be ignored while studying the dynamics of conserved charges.
References
- Adamczyk et al. (2017) L. Adamczyk et al. (STAR), Phys. Rev. C 96, 044904 (2017), arXiv:1701.07065 [nucl-ex] .
- Steinheimer et al. (2014) J. Steinheimer, J. Auvinen, H. Petersen, M. Bleicher, and H. Stöcker, Phys. Rev. C 89, 054913 (2014), arXiv:1402.7236 [nucl-th] .
- Ivanov and Soldatov (2015) Y. B. Ivanov and A. A. Soldatov, Phys. Rev. C 91, 024915 (2015), arXiv:1412.1669 [nucl-th] .
- Adamczyk et al. (2014) L. Adamczyk et al. (STAR), Phys. Rev. Lett. 112, 162301 (2014), arXiv:1401.3043 [nucl-ex] .
- Adamczyk et al. (2018) L. Adamczyk et al. (STAR), Phys. Rev. Lett. 120, 062301 (2018), arXiv:1708.07132 [hep-ex] .
- Steinheimer et al. (2022) J. Steinheimer, A. Motornenko, A. Sorensen, Y. Nara, V. Koch, and M. Bleicher, (2022), arXiv:2208.12091 [nucl-th] .
- Nara et al. (2016) Y. Nara, H. Niemi, A. Ohnishi, and H. Stöcker, Phys. Rev. C 94, 034906 (2016), arXiv:1601.07692 [hep-ph] .
- Konchakovski et al. (2014) V. P. Konchakovski, W. Cassing, Y. B. Ivanov, and V. D. Toneev, Phys. Rev. C 90, 014903 (2014), arXiv:1404.2765 [nucl-th] .
- Nara and Ohnishi (2022) Y. Nara and A. Ohnishi, Phys. Rev. C 105, 014911 (2022), arXiv:2109.07594 [nucl-th] .
- Bozek (2022) P. Bozek, (2022), arXiv:2207.04927 [nucl-th] .
- Csernai and Rohrich (1999) L. P. Csernai and D. Rohrich, Phys. Lett. B 458, 454 (1999), arXiv:nucl-th/9908034 .
- Snellings et al. (2000) R. J. M. Snellings, H. Sorge, S. A. Voloshin, F. Q. Wang, and N. Xu, Phys. Rev. Lett. 84, 2803 (2000), arXiv:nucl-ex/9908001 .
- Adil and Gyulassy (2005) A. Adil and M. Gyulassy, Phys. Rev. C 72, 034907 (2005), arXiv:nucl-th/0505004 .
- Becattini et al. (2015) F. Becattini, G. Inghirami, V. Rolando, A. Beraudo, L. Del Zanna, A. De Pace, M. Nardi, G. Pagliara, and V. Chandra, Eur. Phys. J. C 75, 406 (2015), [Erratum: Eur.Phys.J.C 78, 354 (2018)], arXiv:1501.04468 [nucl-th] .
- Bozek and Wyskiel (2010) P. Bozek and I. Wyskiel, Phys. Rev. C 81, 054902 (2010), arXiv:1002.4999 [nucl-th] .
- Ryu et al. (2021) S. Ryu, V. Jupic, and C. Shen, Phys. Rev. C 104, 054908 (2021), arXiv:2106.08125 [nucl-th] .
- Jiang et al. (2022) Z.-F. Jiang, S. Cao, X.-Y. Wu, C. B. Yang, and B.-W. Zhang, Phys. Rev. C 105, 034901 (2022), arXiv:2112.01916 [hep-ph] .
- Chen et al. (2010) J. Y. Chen, J. X. Zuo, X. Z. Cai, F. Liu, Y. G. Ma, and A. H. Tang, Phys. Rev. C 81, 014904 (2010), arXiv:0910.1400 [nucl-th] .
- Guo et al. (2012) Y. Guo, F. Liu, and A. Tang, Phys. Rev. C 86, 044901 (2012), arXiv:1206.2246 [nucl-ex] .
- Nara et al. (2022) Y. Nara, A. Jinno, K. Murase, and A. Ohnishi, (2022), arXiv:2208.01297 [nucl-th] .
- Shen and Alzhrani (2020) C. Shen and S. Alzhrani, Phys. Rev. C 102, 014909 (2020), arXiv:2003.05852 [nucl-th] .
- (22) L. Du, , C. Shen, C. Gale, and S. Jeon, “Probing initial baryon stopping and baryon diffusive transport with rapidity-dependent directed flow of identified particles(Quark Matter 2022).” .
- Singha et al. (2016) S. Singha, P. Shanmuganathan, and D. Keane, Adv. High Energy Phys. 2016, 2836989 (2016), arXiv:1610.00646 [nucl-ex] .
- Karpenko et al. (2015) I. A. Karpenko, P. Huovinen, H. Petersen, and M. Bleicher, Phys. Rev. C 91, 064901 (2015), arXiv:1502.01978 [nucl-th] .
- Du and Heinz (2020) L. Du and U. Heinz, Comput. Phys. Commun. 251, 107090 (2020), arXiv:1906.11181 [nucl-th] .
- Li and Shen (2018) M. Li and C. Shen, Phys. Rev. C 98, 064908 (2018), arXiv:1809.04034 [nucl-th] .
- Denicol et al. (2018) G. S. Denicol, C. Gale, S. Jeon, A. Monnai, B. Schenke, and C. Shen, Phys. Rev. C 98, 034916 (2018), arXiv:1804.10557 [nucl-th] .
- Wu et al. (2022) X.-Y. Wu, G.-Y. Qin, L.-G. Pang, and X.-N. Wang, Phys. Rev. C 105, 034909 (2022), arXiv:2107.04949 [hep-ph] .
- De et al. (2022) A. De, J. I. Kapusta, M. Singh, and T. Welle, (2022), arXiv:2206.02655 [nucl-th] .
- Fotakis et al. (2020) J. A. Fotakis, M. Greif, C. Greiner, G. S. Denicol, and H. Niemi, Phys. Rev. D 101, 076007 (2020), arXiv:1912.09103 [hep-ph] .
- Akamatsu et al. (2018) Y. Akamatsu, M. Asakawa, T. Hirano, M. Kitazawa, K. Morita, K. Murase, Y. Nara, C. Nonaka, and A. Ohnishi, Phys. Rev. C 98, 024909 (2018), arXiv:1805.09024 [nucl-th] .
- Du et al. (2019) L. Du, U. Heinz, and G. Vujanovic, Nucl. Phys. A 982, 407 (2019), arXiv:1807.04721 [nucl-th] .
- Shen and Schenke (2022) C. Shen and B. Schenke, Phys. Rev. C 105, 064905 (2022), arXiv:2203.04685 [nucl-th] .
- Okai et al. (2017) M. Okai, K. Kawaguchi, Y. Tachibana, and T. Hirano, Phys. Rev. C 95, 054914 (2017), arXiv:1702.07541 [nucl-th] .
- Shen and Schenke (2018) C. Shen and B. Schenke, Phys. Rev. C 97, 024907 (2018), arXiv:1710.00881 [nucl-th] .
- Parida and Chatterjee (2022) T. Parida and S. Chatterjee, (2022), arXiv:xxxx.xxxxx [nucl-th] .
- Schenke et al. (2010) B. Schenke, S. Jeon, and C. Gale, Phys. Rev. C 82, 014903 (2010), arXiv:1004.1408 [hep-ph] .
- Paquet et al. (2016) J.-F. Paquet, C. Shen, G. S. Denicol, M. Luzum, B. Schenke, S. Jeon, and C. Gale, Phys. Rev. C 93, 044906 (2016), arXiv:1509.06738 [hep-ph] .
- Schenke et al. (2012) B. Schenke, S. Jeon, and C. Gale, Phys. Rev. C 85, 024901 (2012), arXiv:1109.6289 [hep-ph] .
- Monnai et al. (2019) A. Monnai, B. Schenke, and C. Shen, Phys. Rev. C 100, 024907 (2019), arXiv:1902.05095 [nucl-th] .
- Bazavov et al. (2012) A. Bazavov et al. (HotQCD), Phys. Rev. D 86, 034509 (2012), arXiv:1203.0784 [hep-lat] .
- Ding et al. (2015) H. T. Ding, S. Mukherjee, H. Ohno, P. Petreczky, and H. P. Schadler, Phys. Rev. D 92, 074043 (2015), arXiv:1507.06637 [hep-lat] .
- Bazavov et al. (2017) A. Bazavov et al., Phys. Rev. D 95, 054504 (2017), arXiv:1701.04325 [hep-lat] .
- Shen et al. (2014) C. Shen, Z. Qiu, H. Song, J. Bernhard, S. Bass, and U. Heinz, “The iebe-vishnu code package for relativistic heavy-ion collisions,” (2014).
- (45) “The iSS code packge can be downloaded from https://github.com/chunshen1987/iSS,” .
- Bass et al. (1998) S. A. Bass et al., Prog. Part. Nucl. Phys. 41, 255 (1998), arXiv:nucl-th/9803035 .
- Bleicher et al. (1999) M. Bleicher et al., J. Phys. G 25, 1859 (1999), arXiv:hep-ph/9909407 .
- Bearden et al. (2004) I. G. Bearden et al. (BRAHMS), Phys. Rev. Lett. 93, 102301 (2004), arXiv:nucl-ex/0312023 .
- Arsene et al. (2009) I. C. Arsene et al. (BRAHMS), Phys. Lett. B 677, 267 (2009), arXiv:0901.0872 [nucl-ex] .
- Back et al. (2003) B. B. Back et al., Phys. Rev. Lett. 91, 052303 (2003), arXiv:nucl-ex/0210015 .
- Andronic et al. (2018) A. Andronic, P. Braun-Munzinger, K. Redlich, and J. Stachel, Nature 561, 321 (2018), arXiv:1710.09425 [nucl-th] .
- Anticic et al. (2011) T. Anticic et al. (NA49), Phys. Rev. C 83, 014901 (2011), arXiv:1009.1747 [nucl-ex] .
- Adam et al. (2020) J. Adam et al. (STAR), Phys. Rev. C 101, 024905 (2020), arXiv:1908.03585 [nucl-ex] .
- Adamczyk et al. (2012) L. Adamczyk et al. (STAR), Phys. Rev. Lett. 108, 202301 (2012), arXiv:1112.3930 [nucl-ex] .
- Greif et al. (2018) M. Greif, J. A. Fotakis, G. S. Denicol, and C. Greiner, Phys. Rev. Lett. 120, 242301 (2018), arXiv:1711.08680 [hep-ph] .
- Li and Kapusta (2019) M. Li and J. I. Kapusta, Phys. Rev. C 99, 014906 (2019), arXiv:1808.05751 [nucl-th] .
- Li and Kapusta (2017) M. Li and J. I. Kapusta, Phys. Rev. C 95, 011901 (2017), arXiv:1604.08525 [nucl-th] .