Orbital-selective Mott phase and spin nematicity
in Ni-substituted FeTe0.65Se0.35 single crystals
Abstract
The normal state in iron chalcogenides is metallic but highly unusual, with orbital and spin degrees of freedom partially itinerant or localized depending on temperature, leading to many unusual features. In this work, we report on the observations of two of such features, the orbital selective Mott phase (OSMP) and spin nematicity, evidenced in magnetization and magnetotransport [resistivity, Hall effect, angular magnetoresistance (AMR)] of Fe1-yNiyTe0.65Se0.35 single crystals, with . Substitution of Ni dopes crystals with electrons, what eliminates some of the hole pockets from Fermi level, leaving only one, originating from orbital. This leads to electron-dominated conduction at low for . However, at high temperatures, K, the conduction reverses to hole-dominated. Anomalies in magnetization and resistivity are observed at temperatures which approach high- boundary of the electron-dominated region. Analysis of these effects suggests a link with the appearance of the hole pockets at X points of the Brillouin zone in the OSMP phase, facilitated by the localization of orbital, as recently reported by angular resolved photoemission experiments (J. Huang et al., Commun. Phys. 5, 29 (2022)). The low- AMR shows mixed 4-fold and 2-fold rotational symmetry of in-plane magnetocrystalline anisotropy, with the 4-fold term the largest at small , and suppressed at intermediate . These results are consistent with the mixed stripe/bicollinear magnetic correlations at small , and suppression of stripe correlations at intermediate , indicating development of spin nematicity with increasing Ni doping, which possibly contributes to the suppression of superconductivity.
I Introduction
While there is a broad agreement that the electron-phonon coupling cannot account for superconducting (SC) transition temperatures (’s) in iron-based superconductors (IBS), the nature of the normal state, and it’s implications for superconductivity, are still not well understood [1, 2, 3, 4, 5]. The normal state is metallic but highly unusual, with orbital and spin degrees of freedom partially itinerant or localized depending on temperature, what appears to be a result of multi-orbital character with important role of the Hund’s interaction [5]. This leads to many unusual features observed experimentally. One of them is so-called orbital differentiation, evidenced by angular resolved photoemission (ARPES) experiments, a phenomenon of different degrees of correlations experienced by different Fe-derived orbitals, three of which (, , ) are closest to Fermi level [5, 6]. A related finding is orbital-selective Mott phase (OSMP), in which orbital with large effective mass undergoes localization on the increase of temperature above about 120 K, while other -orbitals remain itinerant [5, 7, 8]. Both localized and itinerant moments contribute to magnetic properties, leading in many cases to magnetic orderings at low , and universal presence of dynamic magnetic correlations in all IBS materials at higher temperatures [3, 9]. A feature common to all IBS is nematicity, the electronic-driven breaking of rotational symmetry of the crystal, which lifts the degeneracy between and orbitals and possibly involves orbital as well [10, 11, 12]. While in many of the IBS the transition to nematic phase is identical with tetragonal-to-orthorhombic structural transition, either coinciding with magnetic ordering transition, or preceding it, in other compounds or/and at high temperatures the nematicity persists in the form of short-range fluctuations in the absence of long-range orthorhombic order. The relationship between nematicity and the anisotropy of spin correlations (called spin nematicity) is not yet clear, with recent studies suggesting a possible link between these two effects [13]. Theories and experiments [14, 15, 16, 17, 18, 19] discuss the possible impact of disorder on the emergence of nematicity.
Here we focus on the properties of one class of the IBS, iron chalcogenide system, FeTe1-xSex. The recent finding of the topological surface states at [20, 21] stimulates detail studies of this system, despite relatively low maximum . Prompted by interest in the relationship between disorder and nematicity, we re-visit the problem of the substitution of impurities into Fe-site in the FeTe1-xSex crystals, which we have studied in previous years [22, 23, 24, 25]. These studies have been partially hampered by crystal inhomogeneity affecting various properties, as discussed by us [22, 26, 25, 27] and others [28, 29].
In the present study we use Fe1+δ-yNiyTe0.65Se0.35 crystals with broad range of Ni content, , grown with small crystallization rate, what improves homogeneity, so that Fe-excess is small (). We evaluate the structure, magnetization, transport (resistivity and Hall effect), and anisotropic magnetoresistance (AMR). The most important result is the observation of the anomalies in magnetization, resistivity, and Hall effect, which we link to the coherent-incoherent electronic state crossover into the OSMP, which occurs on increasing temperature [7]. This effect becomes clearly evident in strongly Ni-doped crystals, in which some of the hole pockets are eliminated from the Fermi surface, leaving only one, of origin, as recently confirmed by photoemission study performed on our samples [30]. This results in electron-dominated conduction at low in crystals with , switching into hole-dominated conduction at K. This effect is well explained by the contribution to transport from -derived hole pockets, which appear at the Fermi level due to localization of orbital [8]. While there were previous suggestions that some magnetotransport properties may be explained by the crossover to the OSMP [31], complicated behavior of the Hall effect in multiorbital system did not allow for definite conclusions. Thus, our result appears to be the first unambiguous evidence of the OSMP from magnetotransport experiment. We also show that mixed 4-fold and 2-fold rotational symmetry of the AMR, observed at low , is replaced by 2-fold symmetry with increasing , consistent with the development of spin nematicity induced by Ni doping.
Before detail discussion of our experiment it is worth to summarize shortly experimental data accumulated over last few years on the evolution, with the change of , of the orbital, spin and nematic properties in the FeTe1-xSex system. The relevant ARPES data, on orbital differentiation and the OSMP, have been reported for crystals with [7, 6, 8]. Neutron scattering experiments map the change of magnetic properties with , from long-range magnetic order in Fe1+yTe, to the absence of a long-range order in FeSe at ambient pressure [32, 33, 9]. The evolution of magnetic excitations with or is well described by a model of disordered cluster state [34], which assumes different local magnetic ordering within clusters consisting of 4 nearest neighbor Fe-spins, either ferromagnetic (FM) or antiferromagnetic (AFM), and coupling between clusters by a short-range AFM correlations, characterized by two different wave vectors, either Q=(,0) (bicollinear) or Q=(,) (stripe). While local FM clusters coupled by bicollinear correlations describe well magnetic excitations in Fe1+yTe, in crystals with intermediate the AFM clusters have to be assumed, coupled by stripe correlations at low , and by a mixture of stripe and bicollinear correlations at high [34, 35, 36, 37, 9]. It is important to point out that AFM clusters break C4 rotational symmetry, suggesting possible link to nematicity. Finally, the substitution of transition metal elements into Fe-site drives the correlations towards bicollinear pattern, independent of temperature [9].
This picture is further complicated by an occurrence of the nematic phase. The largest body of data exist for FeSe, for which the transition to static nematic phase is found at 90 K [38, 39, 40]. Recent nuclear magnetic resonance (NMR) experiment shows that this transition, which normally lifts the degeneracy between and orbitals, affects also orbital; moreover, this orbital is also playing a dominant role in spin susceptibility, pointing to spin-orbital-intertwinned nematicity [11]. The nematic phase in compounds with intermediate is still a subject of studies. Although the tetragonal-to-orthorhombic transition is suppressed for [41], some low- broadening of the diffraction peaks has been noted at , together with change of the -dependence of in-plane lattice parameter [42, 35], what may suggest local structural deformations. Lifting of the degeneracy of and orbitals has been shown by ARPES for crystals with [43], and nematicity has been observed for by quasiparticle scattering [44] and elastoresistance [45]. In addition, spin nematicity has been recorded by in-plane AMR for [46]. Aside from static nematicity, dynamic fluctuations exist in the whole range of , as shown by recent elastoresistivity measurements for , with symmetry changing with , closely resembling evolution of magnetic correlations [13]. Finally, recent study of quasiparticle scattering in several crystals in the vicinity of reveals strain-induced static electronic nematicity in nanoscale regions, accompanied by SC suppression in the same regions [47].
In the following we will discuss how our experiment may be understood in view od the above findings.
II Experimental details
The crystals of nominal composition Fe1+δ-yNiyTe0.65Se0.35 were grown by Bridgman method, as described elsewhere [22], using crystallization rate of 1.2 mm/h. The crystals show a perfect mirror-like cleavage plane, suggesting their good crystal quality, furthermore confirmed by small full width at half maximum (FWHM) of 004 diffraction peak, of about 1.35-1.67 arc min, as already reported [22, 26]. This is in contrast to more inferior quality of the crystals produced with higher crystallization rates, in which the FWHM increases by a factor of 3.5 or more, as discussed previously [22, 26, 25, 27].
The crystals for this study have been carefully selected by quantitative point analysis, performed by energy-dispersive x-ray (EDX) spectroscopy at many points on each crystal. The average Ni content () has remained close to nominal, with small dispersion, not exceeding , in samples cut from the same crystal. The actual values, determined by EDX for each sample studied, are used to label samples. The Se content is . The average Fe+Ni content has been found to exceed slightly 1, as described in the next section.
For the structural evaluation the crystals were milled and characterized by powder X-ray diffraction (CuKα1 radiation) using X’Pert PRO Alpha-1 MPD (Panalytical) diffractometer. The investigated 2 range was 10∘ to 100∘, with a recording step size of 0.0167∘. Phase analysis and lattice constants determination were performed with a Rietveld refinement, using FullProf software.
For magnetization and transport measurements the crystals were cleaved, with cleavage plane always perpendicular to the -axis. The in-plane shape was slightly elongated in the direction of one of the in-plane main crystallographic axes, as confirmed by X-ray examination. The transport current has been applied in this direction, after cutting the sample into rectangular shape; this resulted in approximate orientation of the (to within 10-20 deg) with one of the main in-plane axes.
The resistivities, in-plane (), and Hall (), were measured by and four-probe methods, respectively, using Physical Property Measurement System (Quantum Design), in the temperature range 2 to 300 K, and in magnetic fields up to 9 T. The angle-dependent magnetoresistance (AMR) was measured in the magnetic field rotated in-plane around -axis (azimuthal angle) or in the magnetic field tilted away from the -axis towards current direction (planar angle). The accuracy of the angle is about deg. The magnetization was measured using SQUID magnetometer (MPMS-7XL, Quantum Design), in a magnetic field applied in two perpendicular in-plane directions (along and perpendicular to ), and along -axis, on warming in zero-field cooled (ZFC), and on cooling in field-cooled (FCC) modes.
III Results
III.1 Structural evaluation
Fig. 1(a) shows diffraction pattern for crystal with . All diffraction peaks may be indexed by tetragonal phase, with a space group . In other crystals tiny traces of Fe3O4 phase, with a space group -, are occasionally seen, with weight fractions below 0.7%. Fig.1(b) shows the -dependence of the lattice parameters and the cell volume relative to sample. The lattice parameters change monotonically with Ni doping, in agreement with previous studies [22]; the parameter depends very weakly on , while clearly decreases with increasing ; this results in similar decrease of the relative cell volume.
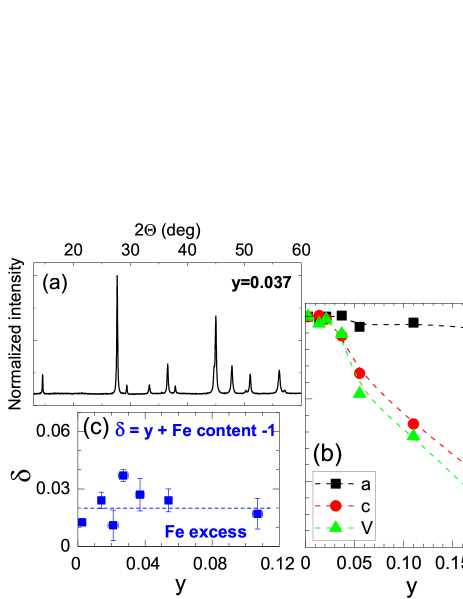
Fig.1(c) shows the deviation from 1 of the total Fe+Ni content, calculated by the relation , where Fe content and are measured by EDX. While in principle some of the deviation may occur on the Ni site, very small dispersion of value suggests that is primarily related to the Fe site. is positive, less then 0.04, pointing to small, almost -independent Fe excess, with the average value of about 0.02. For magnetization and transport measurements the crystals with have been selected.
III.2 Transport properties
The effect of Ni doping on the -dependence of the resistivity is shown in Fig. 2(a), where we plot , normalized to , versus on a logarithmic scale. Doping introduces -dependent upturn to the resistivity at low , with the magnitude of the upturn well correlated with the suppression of the SC transition temperature, . The dependence of the on , depicted in the inset to Fig. 2(a), indicates decrease of the to zero at . Here the is defined as the middle point of the transition, and the vertical error bars reflect 90% to 10% transition width.
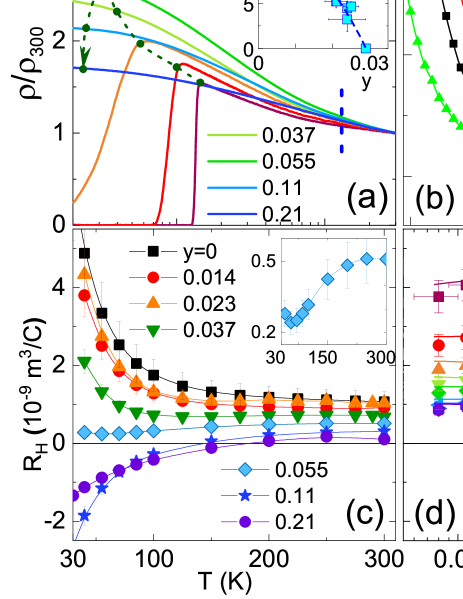
The dashed green line in Fig. 2(a) illustrates non-monotonic evolution of the low- values of with increasing , namely, initial increase, and, after reaching maximum at , the decrease. We remark that this does not mean that decreases due to doping, in fact, at large is larger by about 20% from the average at low , so that resistivity at low is higher for large doping. Nevertheless, rises most steeply with decreasing at . The second interesting feature is the change of slope of the resistivity at high temperatures, in the vicinity of 125-130 K, marked in the figure by dashed, vertical, blue line. This change of slope, which is somewhat difficult to see in , becomes clearly evident in a form of well-defined anomaly after we calculate the second derivative of the resistivity, , as depicted in Fig. 2(b) for several . The anomaly, seen in the vicinity of 125K, marks clear change of the -dependence of , which at K grows more steeply with decreasing . This feature suggests -induced modification of multi-carrier conduction, the origin of which will be discussed later.
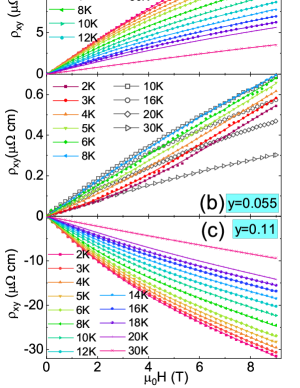
In Fig.2(c) we display -dependence of the Hall coefficient, , at different , and in Fig.2(d) the is shown as a function of for different temperatures. The data are extracted from the magnetic field dependence of the Hall resistivity, , which is linear for K. We observe that at high temperatures the is positive for all , indicating that hole carries dominate the transport. At lower temperatures the changes sign at , where ; this is approximately the same value at which at low reaches maximum value and starts to decrease. In fact, traces of negative contribution to the are already well visible for , in the form of downturn of , which exceeds experimental errors for temperatures lower then about 150 K [inset to Fig.2(c)]. These effects strongly suggest the electron doping of crystals by Ni substitution.
In order to get a clear confirmation of the electron doping from transport, we have analyzed the Hall resistivity, , measured at . At these temperatures the is nonlinear versus magnetic field, indicating multicarrier conduction. We have extracted the contribution of different types of carriers to transport using matrix formalism, proposed in the past for description of multicarrier semiconductor systems [48, 49] (see Appendix B for examples of , and detail description of the fitting procedure). In this formalism, all carriers with the same mobility contribute to one type of carriers with concentration (). Here we limit our considerations to 2 types of carriers in each sample (), because this describes satisfactorily the data; however, one should remember that this is an effective description, i.e. some types of carriers may include possible combination of carriers from different bands with similar mobility.
In each crystal we find majority carriers with larger concentration and smaller mobility ( and ), and minority carriers with smaller concentration and larger mobility ( and ). Both majority and minority carriers may be positive or negative, depending on the Ni doping. Here, we define positive (negative) mobilities for positive (negative) carriers, and create maps of shown in Figs. 3 (c) and (d). In the maps positive mobilities (holes) are indicated by red/yellow/light-green colors, while negative mobilities (electrons) are shown by green/blue; the white line shows the boundary between them at . In Figs. 3 (a) and (b) we show the -dependence of (on a logarithmic scale) for several selected crystals.
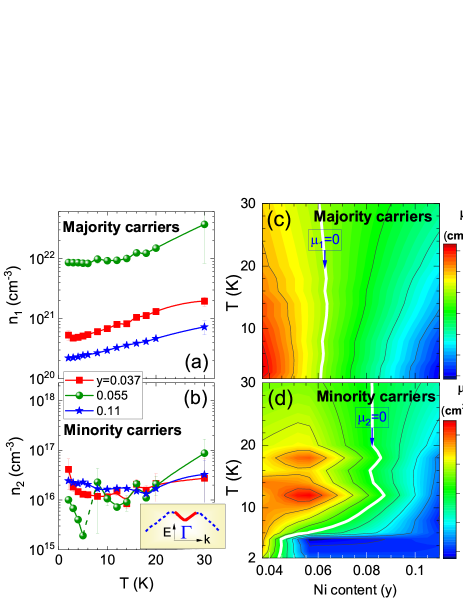
The map of for majority carriers [Fig.3(c)] shows that they undergo the change of sign from positive at low to negative at large . This change of sign occurs at , almost independently of temperature. The drop of carrier mobility to zero at explains the strongest increase of observed for at low .
On the other hand, minority carriers [Fig.3(d)] show unusual behavior: they are positive below about , and for a substantial range () they remain electron-like at low , changing into hole-like at higher . The abrupt change of carrier polarity is also reflected in the dependence for crystal with [Fig.3(b)]. This dependence shows two branches. At K there is an branch related to positive carriers, first decreasing, and then slightly increasing with decreasing . At K a second branch appears, increasing with decreasing , related to electron carriers. There are two possible explanations for this unusual behavior. One possibility is that with increasing and decreasing the concentration of electrons from M pockets becomes so large, that they are no longer compensated by holes. However, it is unclear why this would lead to change of sign at lower than . Another possibility is that this feature is caused by electrons not from M pockets, but from different band. We note that there are ARPES observations of the electron band at point just above Fermi level in FeTe0.6Se0.4 [50] or in FeTe0.55Se0.45 surface-deposited by potassium [51], likely originating from antibonding orbital and Se orbital [51, 20]. Surface-deposited crystals are doped with electrons, resembling the situation similar to present case of Ni substitution. Electron doping moves upwards the chemical potential, and the bottom of electron band at point begins to cross Fermi level, producing peculiar dispersion, which we sketch schematically in the inset in Fig. 3(b), with electron-like dispersion at small wavevector (shown in red), and hole-like dispersion for larger wavevector (in blue). Such dispersion could result in the electron-like carriers at low , switching into hole-like carriers at larger .
We summarize the transport experiments with the phase diagram, shown in Fig. 4(a), where we plot , and the temperatures, at which (-line) and mobilities (-lines), as well as the temperature, at which resistive anomaly is seen in . The most important feature is related to the dependencies on of the -line, and it’s extension to higher temperatures, -line. While at low temperature -line runs at almost constant value, the -line shifts to higher with increasing , approaching the region of black spheres, which represent the temperatures of the resistive anomaly. The -line eventually saturates, reaching the value of about 178 K at . Thus, electron carriers dominate transport exclusively in one portion of the phase diagram, marked in the figure by blue color, even in the case of crystals, which are heavily Ni-doped. This is an unusual finding, suggesting that some type of Fermi surface reconstruction occurs at high temperatures, in the vicinity of resistive anomaly, which turns electron-dominated conduction into hole-dominated conduction. A most plausible explanation is the appearance at high- of the -derived hole pockets at X points of Fermi surface, facilitated by the localization of band in the OSMP phase, as recently uncovered by ARPES experiments in FeTe0.56Se0.44 [8]. Note that such interpretation would be consistent with steeper increase of with decreasing below the temperature of the resistive anomaly, because at lower the -derived holes cannot participate in the transport. In the next sections we will present experiments which support this interpretation.
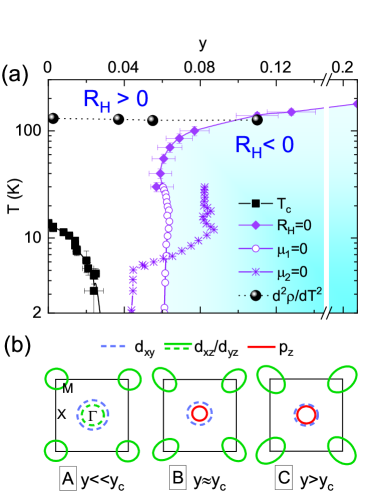
Before turning to other experiments, we mention that the electron doping by Ni substitution has been directly confirmed by recent ARPES measurements, performed at K for crystals from the same batch as studied here, with , 0.05 and 0.11 [30]. It is found that doping leads to the expansion of the electron pockets at the M point of Brillouin zone, which become elliptical upon doping, and to survival of only one hole pocket at point, designated as pocket, which is derived primarily from orbital [52]. Based on this and other ARPES experiments [30, 7, 8], and on present transport results we illustrate schematically in Fig. 4(b) the low- evolution of the band structure at the Fermi level upon doping, from very low (A), to (B) and to large electron doping (C). In A two hole pockets (of and origins) cross Fermi level at point, and electron pockets are present at M points. In B electron pockets at M points expand and become elliptical, while at point hole pocket is eliminated and pocket survives, accompanied (hypothetically) by small electron pocket of origin. Finally, in C all electron pockets expand more, while the hole pocket still survives but shrinks.
III.3 Magnetization
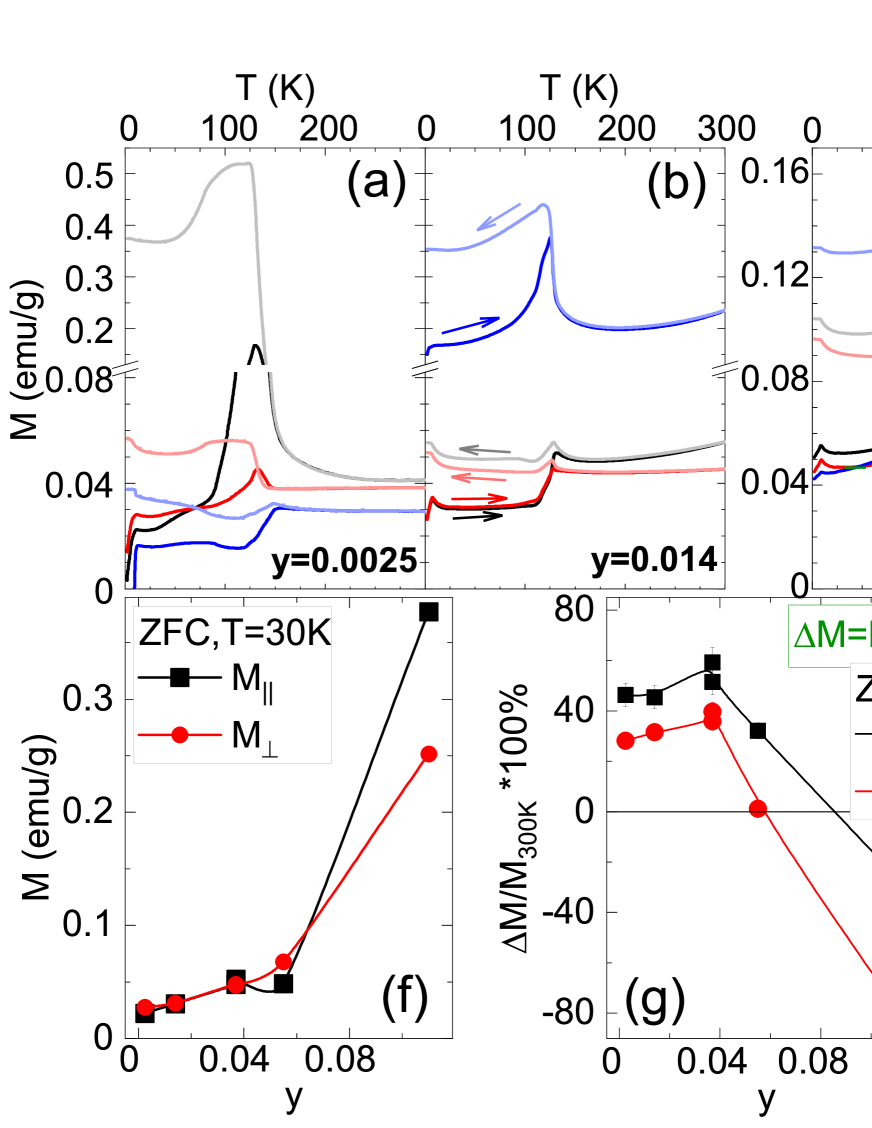
Now we turn attention to magnetization (), shown in Figs. 5(a-e) for several crystals with different , measured in ZFC and FCC modes in low magnetic field (100 Oe), applied in three mutually perpendicular directions, in-plane, parallel to transport current (), in plane, perpendicular to (), and out-of-plane, parallel to -axis ().
Looking first at low- data, we observe SC transition in least-doped sample, evident for all field directions [Fig. 5(a)]. Next, we discuss magnetization in the normal state, starting from low- behavior measured in ZFC mode. The magnitude of both in-plane components of , measured at 30 K, is plotted versus in Fig. 5(f). We observe systematic increase of with increasing . This is likely caused by increasing disorder due to doping of Ni into Fe sites. Notable is the large increase of in-plane for large , suggesting enhanced localization for large Ni doping, and substantial in-plane anisotropy. However, the most prominent feature in the normal-state magnetization is the anomaly, observed for all magnetic field directions in the region 125-130 K, in all samples. The anomaly produces a jump in the magnetization, i.e., significant difference between low-, and high- magnetization, accompanied in some cases by a large peak. The fact that the anomaly is observed in the same -region as the resistive anomaly strongly suggests that the two features are linked. In order to quantify the jump in magnetization, we introduce the definition , where and denote magnetization measured at 300 K, and at 30 K, as illustrated in Fig.5(c). The magnitude of changes with the change of , and, while in most cases is positive, it changes sign into negative for crystal with the largest [Fig.5(e)], what is clearly related to enhanced magnetization at low in this crystal.
Similar anomaly in magnetization has been reported before, in some Fe1+yTe1-xSex single crystals [54, 53, 26], but it has not been studied in detail. Instead, it has been speculated that the anomaly may originate from impurity phases, indicating either Verwey transition in Fe3O4 [55, 56], or spin reorientation transition in Fe7(Se-Te)8 impurity of hexagonal structure [26]. We see no correlation whatsoever between the magnitude of and tiny content of Fe3O4 estimated by X-ray diffraction, and we do not detect Fe7(Se-Te)8 in our samples. Moreover, the detail evaluation of the anomaly, described below, points against impurity origin.
The -dependence of , relative to at 300 K, is shown in Fig.5(g) for both in-plane directions. The data show slight increase at small , followed by rapid decrease and change of sign at large . There is also well-defined difference of for two in-plane directions, which systematically increases with increasing . Leaving aside for the moment the anisotropy of , we note that the dependence of on resembles the dependence of Hall coefficient on , shown in Fig.2(d). Therefore, in Fig.5(h) we re-plot the data versus measured at 30 K, on exactly the same piece of crystal as the measurement of magnetization. It is evident that quite good proportionality exists between the and . This supports the idea that the positive observed in samples with small , i.e. with hole-dominated transport, is a result of delocalization of carriers originating in hole pocket, which occurs on decreasing temperature, in agreement with the observation of the incoherent-coherent transition by ARPES in FeTe0.56Se0.44 [7]. This effect resembles the large change of susceptibility on cooling due to delocalization of one of the three Fe electrons, which accompanies magnetostructural transition in Fe1+δTe [32, 33], apart from the fact that no long-range magnetic order is expected in the present case. Somewhat more difficult to explain is the case of negative in crystal with large . Most likely, while orbital still becomes coherent at low , leading to elimination of hole pockets from Fermi level, doped electron carriers compensate delocalized -derived hole carriers at low , so that the lowering of is not observed. Instead, increase of at low suggests enhanced localization.
Returning back to anisotropy, a different way to quantify it is to calculate the ratio , which is displayed in Fig.5(i) versus , for three different temperatures, 30 K, 300 K, and the peak temperature, ( is generally slightly different for two in-plane configurations, by up to a few degrees). The ratio is larger or close to 1 for all samples at 300 K, and becomes smaller or close to one at 30 K, except for the sample with the largest . Interestingly, while the ratio at falls between high- and low- value for most samples, it reaches more than 3.7 in the crystal with smallest .
In order to get more insight into these effects, we calculate the derivative d/d for ZFC curves for several crystals and plot it versus in Fig.6. Black spheres indicate the temperatures of resistive anomaly, indicating it’s good correspondence with anomaly in magnetization. However, the figure reveals that there are precursors to the anomaly at temperatures well below , and they evolve with . The d/d shows most complicated structure in the crystal with smallest , starting from low temperature just above 30 K, and extending towards higher temperatures, with several extrema, which we mark by vertical color lines. Note that the extrema for different components of are correlated. Interestingly, the maxima for in-plane components ( and ) are accompanied either by maxima or by minima for out-of-plane component (). While the latter may be caused by spin reorientation (increase of in-plane , accompanied by decrease of out-of-plane ), the former seem to be of different origin. As is increased the number of extrema decreases, until in case of crystal with only one large, and two very tiny maxima, accompanied by one broad minimum are seen.
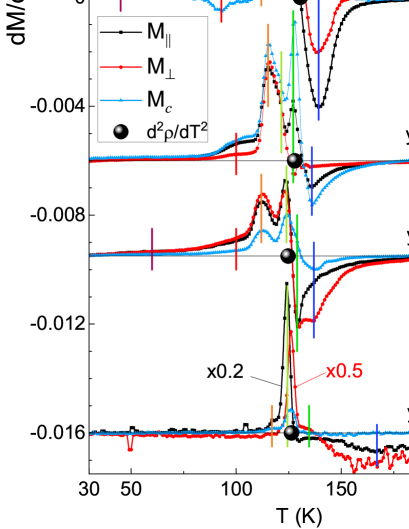
The fact that with increasing the derivative od becomes less complex suggests relation of the anomaly to magnetic correlations, which are weakened upon the dilution of the Fe-spin system by Ni substitution. This is not surprising, because the coherence of state establishes nesting conditions, which should enhance spin fluctuations. While ARPES shows that nesting conditions in FeTe0.65Se0.35 are not perfect [30], they still influence spin fluctuations at small . Thus, the complex structure of d/d and large enhancement of the anisotropy in the vicinity of the observed for smallest are likely related to magnetic correlations of stripe and/or bicollinear type, which exist in the system of disordered magnetic clusters (domains) of various lateral sizes, as suggested by neutron scattering experiments [34, 35, 36, 37, 9]. The influence of nesting on the spin fluctuations should be diminished with increasing , because the imperfect nesting is gradually removed with increasing doping.
In addition to magnetic correlations, the local nematic order may contribute to the anisotropy. It has been pointed out recently that the coherence-incoherence temperature scale of the orbital follows the behavior of nematic susceptibility in FeTe1-xSex [13]. We note in this context that the nematic transition, leading to step-like change in susceptibility, Hall effect, and heat capacity, has been described in case of undoped and Co-doped pnictide superconductor BaFe2As2 [57, 58, 59]. In contrast to pnictides, no step-change of Hall effect is observed here, probably due to larger disorder of chalcogenide samples (in fact, increasing Co-doping smears out step-like anomaly in BaFe2As2 [58]). Nevertheless, the anomaly in magnetization may be anticipated in the vicinity of second-order nematic-electronic phase transition [60, 61]. While no evidence of static nematicity exists for FeTe0.65Se0.35, the tendency towards local nematic order may be enhanced by doping-induced strains. Such a tendency has been observed, for example, in the case of pnictide superconductor Ca(Fe1-xCox)2As2, in which Co impurity induces highly anisotropic, extended (up to 8 unit cells) scattering centers for carriers [18], possibly locally magnetic in origin.
In the following we use the measurements of angle-dependent magnetoresistance to probe Ni-doped crystals for possible development of spin nematicity with doping.
III.4 Angle-dependent magnetoresistance
The anisotropic magnetoresistance in crystalline magnetic metals has been observed in many ferromagnetic, antiferromagnetic, or ferrimagnetic crystals and films [62, 63, 64, 65, 66]. Provided the external magnetic field is high enough so that spins are nearly aligned with the field, at lowest temperatures it usually reflects magnetocrystalline anisotropy (MCA) of the material, sometimes strongly influenced by various external factors, such as, for example, strain built-in during the crystal growth. For magnetic crystals or films with tetragonal symmetry usually the presence of 4-fold symmetry of the MCA (biaxial anisotropy) is naturally expected due to 4-fold symmetry of the lattice, while 2-fold symmetry terms (uniaxial anisotropy) appear on decreasing temperatures due to built-in strains and other factors [63].
In case of the IBS materials the in-plane AMR has been described in pnictides [67, 68, 69], in FeSe [70], and in several chalcogenide systems, including FeTe1-xSex, with = 0, 0.39, and 0.94 [46]. These studies, which were limited to non-SC compositions, observed 2-fold symmetry of the AMR below some characteristic temperatures, which in some cases could be identified, for example, as AFM ordering temperature in parent FeTe, nematic transition temperature in FeSe, or spin density wave transition or/and AFM ordering in pnictides. The origin of the 2-fold symmetry is linked to the prevailing anisotropic magnetic correlations existing below these ordering temperatures. It should be underscored that the 2-fold symmetry of the MCA, detected by the AMR, called ”spin nematicity” induced by the magnetic field, is a signature of the anisotropy of spin correlations. It may not be necessarily identical with spontaneous electronic nematicity observed in the absence of the magnetic field, although in many cases it is observed below exactly the same temperature [46].
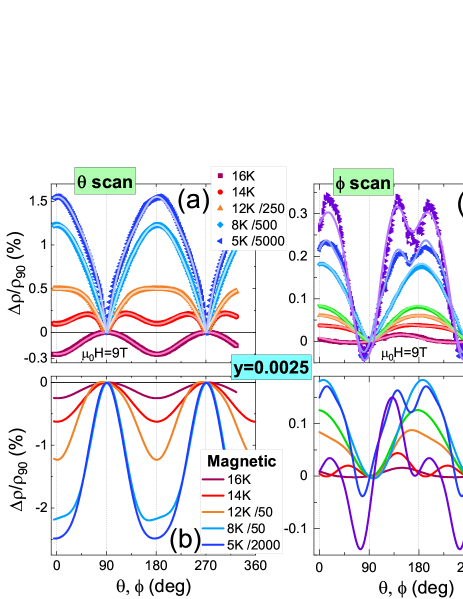
As we are interested in properties of Ni-doped crystals in a broad range of doping, it is important to evaluate the behavior of the AMR starting from SC compositions. In all samples studied in this work the magnetoresistance (MR) measured in the perpendicular magnetic field in the normal state starts to acquire substantial, negative values at temperatures below about 30 K. The positive conventional MR is negligible in this -range. In SC samples below the the positive component of the MR starts to appear, related to suppression of superconductivity. In order to separate clearly the SC and non-SC components of the MR, we have measured the AMR for two scans illustrated in the inset to Fig.7: is the azimuthal angle for rotation around -axis, with =0 for , and is the angle between axis and direction, with =0 for (we have verified that Lorentz-force effects are insignificant in scans). Since the effect of the magnetic field on the SC component of the AMR should be minimized for , i.e. = = 90 deg, we normalize the AMR to resistivity measured at 90 deg, , where is the resistivity measured at any given , , and or .
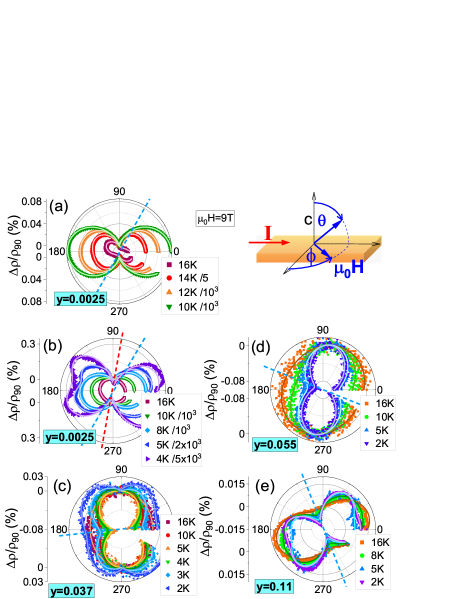
for scans measured at various temperatures and magnetic field T is shown in Fig.7 for several crystals with different (for discussion of scans see Appendix B). In the normal state ( K) the AMR shows dominant 2-fold symmetry in each crystal, with the positions of AMR minima depending on , as indicated by dashed blue lines. In the crystal with [Fig.7(a-b)] the minimum is located at deg, that is, it is shifted away from either of the in-plane axes, towards nearest-neighbor (NN) Fe-Fe direction (but not exactly along it); in case of intermediate (0.037 and 0.055) it shifts closer to the vicinity of , i.e. to next NN (nNN) Fe-Fe direction, finally, at highest the position is again closer to NN direction.
Focusing first on the crystal with , on decreasing below the , down to 10 K, we observe rapid growth of positive , with sharp minimum at = 90 deg and maximum at = 0, as expected in the SC state [Fig.7(a)]. However, on further decrease of temperature, when the resistance becomes very small deeper in the SC state, the symmetry of the AMR changes into 4-fold [Fig.7(b)], and the minimum of the AMR shifts away from to deg, as marked by red dashed line. Apparently, at this low the AMR due to suppression of the SC state becomes small, and magnetic component, related to the MCA, dominates.
When the doping with Ni increases to , the SC-related term is quenched, so that at 9 T it becomes visible only at K as a small dip at deg [Fig.7(c)]. As the Ni doping increases further the SC term is no longer observable, so that pure MCA term is seen down to 2K [Figs.7(d-e)]. Notably, in the two cases with intermediate (0.037 and 0.055) the dominant 2-fold symmetry of the MCA persists with unchanged position of the minimum for all temperatures. However, in case of largest [Figs.7(e)] the 4-fold MCA becomes apparent at lowest .
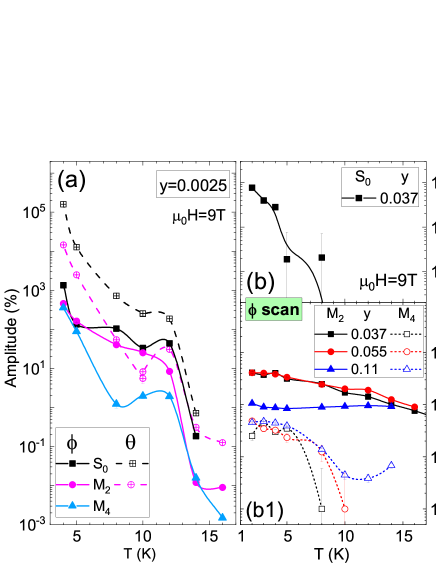
In order to quantify these observations, we fit the data by sum of terms which describe different angle dependencies expected for the SC and the MCA components: , and , respectively. Here and are amplitudes and phases of the MCA terms of -fold symmetry, treated as fitting parameters ( are almost constant for different ), while is the amplitude of SC term, extracted using boundary conditions from fitted ’s. We find that two MCA terms, (uniaxial anisotropy) and (biaxial anisotropy), are enough to fit the data. The fitted dependencies describe the data very well, as shown by continuous lines on Fig.7 (for more details see Appendix B). Both and amplitudes increase with decreasing , reflecting growing influence of the MCA on scattering of carriers. However, while the amplitude is found to be finite for all dopings and temperatures, indicating that 2-fold symmetry term is dominant in most of the crystals, the amplitude varies. It reaches the largest magnitude at low in SC crystals, while it is suppressed at intermediate , suggesting the development of spin nematicity with doping.
The origin of dominant 2-fold symmetry in FeTe1-xSex crystals may be traced to the nature of dynamic magnetic correlations of stripe and/or bicollinear types [9, 34, 35], because these correlations break symmetry, therefore, taken separately, should lead to uniaxial MCA. Our result shows, however, a mixed 2-fold and 4-fold symmetry, with the largest 4-fold component present in SC sample at lowest [Fig.7(b)]. It is very likely that intrinsic disorder in our crystals (due to Te/Se and Fe/Ni mixture) leads to the coexistence of domains of limited lateral size with prevailing stripe or bicollinear correlations. The AMR experiment averages over them, producing mixed symmetry, and the increasing contribution of stripe domains on decreasing temperature leads to 4-fold component most pronounced at lowest . Note that cases of stripe-type spin-density wave orders, which preserve symmetry, called spin-charge density wave or spin-vortex crystal [5], have been observed in some pnictides in limited regions of phase diagrams [71, 72], however, there are no reports of such observations in FeTe1-xSex.
In order to visualize the evolution of the MCA symmetry with doping and temperature we create a map of the ratio , and we use it as a background in a phase diagram, discussed in the next section.
IV Phase diagram
We summarize all experimental results on the phase diagram in Fig.8(a) (with on a logarithmic scale). The map of the ratio , obtained from the AMR, is plotted as a background in a lower portion of the figure. The red indicates presence of substantial terms, reaching about 1 at at lowest . Green represents area with suppressed down to between 0.01 and 0.1, while dark blue area specifies regions of strictly twofold symmetry of the MCA. The map reveals peculiar dependence of on temperature and doping: there is a clear suppression of for intermediate , but, in addition, there is suppression in the vicinity of K for all doping levels. We add to the graph all data obtained from transport experiments, displayed previously in Fig.4: the , the -line, -lines, and the temperatures of the resistive anomalies. Finally, we also add the temperatures , at which shows extrema, using the same colors as lines marked in Fig.6.
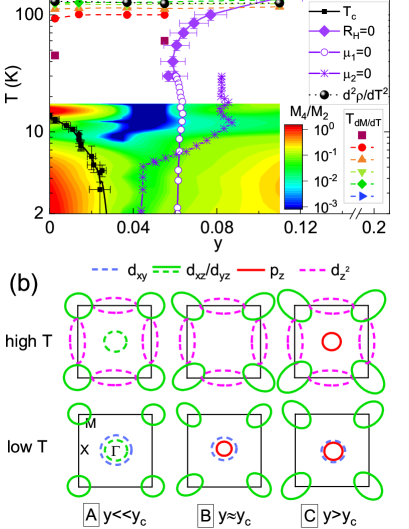
The phase diagram shows two important features. One of them is seen in high- region, and involves the correlation between resistive anomaly and the magnetization anomaly, both approaching -line on increasing . This correlation suggests that both anomalies occur as a result of the transition into OSMP phase, in which orbital becomes incoherent. Interestingly, the temperature at which the transition occurs depends only weakly on , what underscores the fact that the orbital survives Ni doping. In Fig.8(b) in the bottom raw we re-plot schematically the band structure at the Fermi level at low based on ARPES experiments [30, 7, 8], as discussed previously, for (A) , (B) and (C) . In the top raw the band structure in the OSMP phase is shown: in all diagrams hole pocket of origin is washed away but instead hole pockets at X point, of origin, appear. Note that in (C) the electron-like pocket of origin is likely surviving at high , contributing to the upward shift of the -line with increasing .
Previously, the appearance of negative component to at low- has been interpreted as evidence of incoherent-coherent transition in magnetotransport of Te-annealed Fe1+yTe1-xSex crystals [31, 13]. Interpretation of the linear versus magnetic field dependence of Hall resistivity, observed in that case, requires considerable assumptions. As suggested in Ref. [8], a possible origin of negative is the influence on the Hall coefficient of vertex corrections due to spin fluctuations, provided the nesting conditions for spin fluctuations are fulfilled [73]. In this respect, our experimental findings avoid any complications in interpretation, because we are able to show convincingly the electron doping at large , based on non-linear dependence of Hall resistivity on magnetic field. Moreover, the nesting conditions are not fulfilled at large , therefore vertex corrections should be suppressed [73]. Thus, the reemergence of positive at high temperatures in crystals with large , in which the only hole band at low is of origin, seems to be strong confirmation of the contribution to transport of holes originating from the pockets at X points in the OSMP phase.
The second interesting feature is the dependence of the on and , displayed in the low- portion of the phase diagram. Considering first -dependence at the lowest we recall that the gradual replacement of stripe correlations by bicollinear correlations is expected with increasing [36], what would eliminate the domains with stripe correlations, leading to the reduced magnitude of . This, together with doping-induced strains most likely leads to domination of 2-fold AMR component at intermediate . On further increase of up to 0.11, weak 4-fold component reappears. We believe that this is of different origin than the 4-fold term at small , since at this large Ni content stripe correlations are already absent. Rather, it is a consequence of the localization of electron carriers and enhanced anisotropy of magnetization at low , what probably induces biaxial MCA.
More puzzling is the non-monotonic dependence of the on temperature, with obvious suppression around 10 K. Note that at low this suppression seems to correlate with slightly stronger suppression of the at about 8-10 K. This correlation is further confirmed by the suppression of the amplitude of SC component of the AMR in exactly the same -range (see Fig. 11 in Appendix B). This observations may corroborate the connection between local nematicity and the suppression of superconductivity, observed by recent quasiparticle scattering experiments [47].
Even more interesting is the comparison between the map of and the -line. It appears that the -line encircles the region of suppressed on the side of large . We recall that the unusual dependence of -line on and originates from the switching from electron-like mobility at low to hole-like mobility at high in the vicinity of , as illustrated in Fig.3. This means that the suppressed region is likely associated with the presence of hole-like band at the Fermi level, which at is of origin. It is tempting, therefore, to link spin-nematicity described here to the behavior of orbital. It is worth to mention that many recent studies of FeSe find that nematicity in this system is not restricted to and orbitals, but involves orbital as well, in fact, may be crucially important for the development of the nematic state [12, 11, 40]. Our results suggest that the importance of orbital is not restricted to FeSe, but it may be a more general phenomenon. What exactly is the role of orbital for spin-nematicity cannot be judged on the basis of present experiment, but further detail studies of Ni-doped FeTe1-xSex may turn out to be helpful for understanding of this role.
V Summary
In summary, using systematic magnetotransport (resistivity, Hall effect, AMR) and magnetization measurements we have determined the phase diagram of single crystalline Fe1-yNiyTe0.65Se0.35 (), in which Ni substitution dopes the system with electrons, eliminating some of the hole pockets from Fermi level, and leaving only one, originating from orbital.
We show that doping suppresses superconductivity to zero at , and induces transition from hole-dominated into electron-dominated conduction, with a boundary defined by Hall coefficient equal zero. At low temperature the boundary runs almost parallel to -axis at value of , but at high temperatures it terminates the electron-dominated region in the vicinity of K, indicating reversal of the conduction back into hole-dominated at higher . Anomalies in magnetization and resistivity are observed at temperatures which approach high- boundary of the electron-dominated region. Analysis of these effects suggests a link with the incoherence-coherence transition due to localization of orbital on increasing , and, related to it, appearance of the hole pockets at X points of the Brillouin zone in the OSMP phase, as recently uncovered by ARPES [8]. Thus, this result appears to be the first unambiguous observation of the OSMP from magnetotransport measurements. The low- AMR shows mixed 4-fold and 2-fold rotational symmetry of in-plane magnetocrystalline anisotropy, with the 4-fold term the largest at small , and suppressed at intermediate . These results are consistent with the mixed stripe/bicollinear magnetic correlations at small , and suppression of stripe correlations at intermediate , indicating development of spin nematicity with increasing Ni doping, likely contributing to the suppression of superconductivity.
Acknowledgments
The work has been supported by Polish NSC Grant No. 2014/15/B/ST3/03889. The research was partially performed in the laboratory co-financed by the ERDF Project NanoFun POIG.02.02.00-00-025/09.
Appendix A Evaluation of carrier mobilities
Fig.9 shows the dependence of Hall resistivity, on the magnetic field for some of the crystals. In the case of each sample the dependence evolves from near linear at 20-30 K to nonlinear at 2 K. The nonlinearity is, however, dependent on . Specifically, the evolves from positive values and convex shape in Fig.9(a) to negative values and concave shape in Fig.9(c), suggesting that two types of carriers are involved in each case, with the same polarity but different mobilities, positive in the former case, and negative in the latter. In case of sample with intermediate doping, shown in Fig. 9(b), the is still positive, but there is a change of shape from convex for K to concave for K, signaling a change of sign of minority carriers from positive to negative.
In order to extract carrier concentrations and their mobilities, we fit the Hall resistivity data using the exact expressions derived from the matrix formalism, which has been proposed in the past for the description of multicarrier semiconductor systems [48, 49]. In this formalism one type of carriers is understood as collection of all carriers with the same mobility. While in principle the formalism allows to consider infinite types of carriers, in practice the fit must be limited to three types, and, in fact, fitting the 3-carrier expressions is usually difficult. For 2-carrier system with the carrier concentrations and mobilities () the Hall resistivity is given by (more complicated 3-carrier expressions may be found in Ref.[49]),
| (1) | ||||
In these equations mobilities are positive (negative) for positive (negative) carriers, while the parameters are related to the concentrations of carriers by relation , where is the carrier charge.
Data for most of the samples are very well fitted by the above expressions, using 3 fitting parameters (, , and ). The fitted curves are shown by continuous lines in Fig.9.
Appendix B Angular magnetoresistance
In magnetic crystal the resistivity tensor in the presence of magnetic field depends on the direction cosines, , of the magnetization vector, and may be expressed as series expansions in ascending powers of [62, 63]
| (2) | ||||
where and ’s are expansion coefficients. Symmetry considerations for tetragonal crystal, and assumption of the current direction along one of the main crystal axis, reduces this equation to a simple expression for magnetoresistance
| (3) |
where is the angle between magnetization vector and the main crystal axis, is a constant, and and are the amplitude and the phase of -fold symmetry.
Figs. 10(a) and 10(c) show the experimental data for sample with measured for and scans, respectively. The data for the scan [Fig. 10(a)] in the normal state, at K, show that the AMR is negative, and has 2-fold symmetry, with minima located at =0, i.e. in the out-of-plane direction. This is consistent with the picture of disordered cluster state with in-plane AFM ordering within clusters. Such clusters are source of substantial carrier scattering, which is reduced by out-of-plane magnetic field aligning the spins out-of-plane. Similar behavior is seen for all of the samples in the normal state. Decreasing below the results in the rapid growth of positive , with the minimum at = 90 deg and maximum at , as expected in the SC state. To display the low- data on the same graph, we divide it by large factors, as specified in the labels.
for scan (Fig.10(c)) is about five times smaller than for scan. In the normal state ( K) it shows apparent 2-fold symmetry, with the minima of the AMR located at deg. As is decreased below the the behavior somewhat similar to the scan appears, i.e. grows the most in the vicinity of = 0, and the least for = 90 deg, indicating the suppression of SC state by magnetic field. However, at very low , when the resistance becomes very small, the symmetry of the AMR changes into 4-fold, with the minimum of the AMR shifted away from to deg, clearly indicating that it is not related to SC state suppression. Instead, it reflects the minimum of magnetic component of the AMR, most likely related to the MCA.
In order to account properly for the superconducting () and magnetic () components of the AMR, we fit the experimental data by the following dependencies,
| (4) | ||||
Here and are the amplitude and the phase of -fold symmetry of the magnetocrystalline part, respectively; vary only slightly with the change of , what simplifies the fits. are constants resulting from the normalization of AMR by (i.e. at ), and is a small phase shift of the SC component away from resulting from rotator misalignment. It has been shown that the AMR for tetragonal symmetry is well described by (uniaxial anisotropy) and/or (biaxial anisotropy) [63]. When doing the fits, we first determine at , and use it to eliminate from the equations; , and are used as fitting parameters. This procedure results in excellent description of the data, as indicated by continuous lines in Figs.10(a) and 10(c). The parts extracted from the fits, shown in Figs. 10(b) and 10(d), illustrate the growth of 4-fold symmetry at low .
The -dependencies of the amplitudes and are shown for several crystals in Fig.11. In the crystal with both and amplitudes increase by many orders of magnitude with decreasing for both and scans (Fig.11(a)). In the limit of low temperatures the ratio between and for scan, , is about 1. However, it falls down to about 0.1 in the region between 8 K and 10 K, and again grows at higher . Thus, the symmetry of the MCA changes with . Interestingly, in the -region with small , which may be treated as indication of prevailing 2-fold symmetry, the amplitude seems somewhat suppressed. Turning to the crystals of intermediate Ni doping, = 0.037 and 0.055 (Fig.11(b1)), we observe that is about 0.1 at low , and falls down to zero at higher temperatures, clearly confirming 2-fold symmetry.
References
- [1] I. I. Mazin, D. J. Singh, M. D. Johannes, and M. H. Du, Unconventional superconductivity with a sign reversal in the order parameter of LaFeAsO1-xFx, Phys. Rev. Lett. 101, 057003 (2008).
- [2] D. J. Scalapino, Rev. Mod. Phys. 84, 1383 (2012).
- [3] P. Dai, Antiferromagnetic order and spin dynamics in iron-based superconductors, Rev. Mod. Phys. 87, 855 (2015).
- [4] R. M. Fernandes and A. V. Chubukov, Rep. Prog. Phys. 80, 014503 (2017).
- [5] R. M. Fernandes, A. I. Coldea, H. Ding, I. R. Fisher, P. J. Hirschfeld, and G. Kotliar, Iron pnictides and chalcogenides: a new paradigm for superconductivity, Nature 601, 35 (2022).
- [6] M. Yi, Y. Zhang, Z.-X. Shen, and D. Lu, Role of the orbital degree of freedom in iron-based superconductors, npj Quantum Mater. 2, 57 (2017).
- [7] M. Yi, Z-K Liu, Y. Zhang, R. Yu, J.-X. Zhu, J.J. Lee, R.G. Moore, F.T. Schmitt, W. Li, S.C. Riggs, J.-H. Chu, B. Lv, J. Hu, M. Hashimoto, S.-K. Mo, Z. Hussain, Z.Q. Mao, C.W. Chu, I.R. Fisher, Q. Si, Z.-X. Shen, and D.H. Lu, Observation of universal strong orbital-dependent correlation effects in iron chalcogenides, Nat. Comm. 6, 7777 (2015).
- [8] J. Huang, R. Yu, Z. Xu, J.-X. Zhu, Q. Jiang, M. Wang, H. Wu, T. Chen, J. D. Denlinger, S.-K. Mo, M. Hashimoto, G. Gu, P. Dai, J.-H. Chu, D. Lu, Q. Si, R. J. Birgeneau, and M. Yi, Correlation-driven electronic reconstruction in FeTe1-xSex, Commun. Phys. 5, 29 (2022).
- [9] J. M. Tranquada, G. Xu, and I. A. Zaliznyak, Magnetism and superconductivity in Fe1+yTe1-xSex, J. Phys.: Condens. Matter 32, 374003 (2020).
- [10] R. M. Fernandes, A. V. Chubukov, and J. Schmalian, What drives nematic order in iron-based superconductors? Nat. Phys. 10, 97 (2014).
- [11] J. Li, B. Lei, D. Zhao, L. P. Nie, D.W. Song, L. X. Zheng, S. J. Li, B. L. Kang, X. G. Luo, T. Wu, and X. H. Chen, Spin-Orbital-Intertwined Nematic State in FeSe, Phys. Rev. X 10, 011034 (2020).
- [12] Luke C. Rhodes, Matthias Eschrig, Timur K. Kim, and Matthew D. Watson, FeSe and the Missing Electron Pocket Problem, Front. Phys. 10, 859017 (2022).
- [13] Q. Jiang, Y. Shi, M. H. Christensen, J. Sanchez, B. Huang, Z. Lin, Z. Liu, P. Malinowski, X. Xu, R. M. Fernandes, and J.-H. Chu, Nematic fluctuations in an orbital selective superconductor Fe1+yTe1-xSex, Comms. Phys. 6, 39 (2023).
- [14] D. Steffensen, P. Kotetes, I. Paul, and B. M. Andersen, Disorder-induced electronic nematicity, Phys. Rev. B 100, 064521 (2019).
- [15] Z.Wang, X.-G. Zhao, R. Koch, S. J. L. Billinge, and A. Zunger, Understanding electronic peculiarities in tetragonal FeSe as local structural symmetry breaking, Phys. Rev. B 102, 235121 (2020).
- [16] P. Wiecki, R. Zhou, M-H. Julien, A. E. Bhmer, and J. Schmalian, Edwards-Anderson parameter and local Ising nematicity in FeSe revealed via NMR spectral broadening, Phys. Rev. B 104, 125134 (2021).
- [17] C.-L. Song, Y.-L. Wang, P. Cheng, Y.-P. Jiang, W. Li, T. Zhang, Z. Li, K. He, L. Wang, J.-F. Jia, H.-H. Hung, C. Wu, X. Ma, X. Chen, and Q.-K. Xue, Direct Observation of Nodes and Twofold Symmetry in FeSe Superconductor, Science 332, 1410 (2011).
- [18] M. P. Allan, T.-M. Chuang, F. Massee, Y. Xie, N. Ni, S. L. Bud´ko, G. S. Boebinger, Q.Wang, D. S. Dessau, P. C. Canfield, M. S. Golden, and J. C. Davis, Anisotropic impurity states, quasiparticle scattering and nematic transport in underdoped Ca(Fe1-xCox)2As2, Nat. Phys. 9, 220 (2013).
- [19] S.-H. Baek, D. V. Efremov, J. M. Ok, J. S. Kim, J. van den Brink, and B. Buchner, Nematicity and in-plane anisotropy of superconductivity in FeSe detected by 77Se nuclear magnetic resonance, Phys. Rev. B 93, 180502(R) (2016).
- [20] Zhijun Wang, P. Zhang, Gang Xu, L. K. Zeng, H. Miao, Xiaoyan Xu, T. Qian, Hongming Weng, P. Richard, A. V. Fedorov, H. Ding, Xi Dai, and Zhong Fang, Topological nature of the FeSe0.5Te0.5 superconductor, Phys. Rev. B 92, 115119 (2015).
- [21] Peng Zhang, Koichiro Yaji, Takahiro Hashimoto, Yuichi Ota, Takeshi Kondo, Kozo Okazaki, Zhijun Wang, Jinsheng Wen, G. D. Gu, Hong Ding, Shik Shin, Observation of topological superconductivity on the surface of an iron-based superconductor, Science 360, 182 (2018).
- [22] D.J. Gawryluk, J. Fink-Finowicki, A. Wiśniewski, R. Puźniak, V. Domukhovski, R. Diduszko, M. Kozłowski, and M. Berkowski, Growth conditions, structure and superconductivity of pure and metal-doped FeTe1-xSex single crystals, Supercond. Sci. Technol. 24, 065011 (2011).
- [23] V.L. Bezusyy, D.J. Gawryluk, A. Malinowski, M. Berkowski and M.Z. Cieplak, Infuence of Iron Substitutions on the Transport Properties of FeTe0.65Se0.35 Single Crystals, Acta Phys. Pol. A 126, 76 (2014).
- [24] V. L. Bezusyy, D. J. Gawryluk, A. Malinowski, and Marta Z. Cieplak, Transition-metal substitutions in iron chalcogenides, Phys. Rev. B 91, 100502(R) (2015).
- [25] M. Z. Cieplak and V. L. Bezusyy, Transition metal doping of FeSeTe: what can we learn from transport properties, Philos. Mag. 95, 480 (2015).
- [26] A. Wittlin, P. Aleshkevych, H. Przybylińska, D.J. Gawryluk, P. Dłużewski, M. Berkowski, R. Puźniak, M.U. Gutowska, and A. Wiśniewski, Microstructural magnetic phases in superconducting FeTe0.65Se0.35, Supercond. Sci. Technol. 25, 065019 (2012).
- [27] A. G. Sivakov, S. I. Bondarenko, A. I. Prokhvatilov, V. P. Timofeev, A. S. Pokhila, V. P. Koverya, I. S. Dudar, S. I. Link, I. V. Legchenkova, A. N. Bludov, V. Yu. Monarkha, D. J. Gawryluk, J. Pietosa, M. Berkowski, R. Diduszko, R. Puźniak and and A. Wiśniewski, Microstructural and transport properties of superconducting FeTe0.65Se0.35 crystals, Supercond. Sci. Technol. 30, 015018 (2017).
- [28] K. Prokeš, M. Schulze, S. Hartwig, N. Schäfer, S. Landsgesell, C.G.F. Blum, D. Abou-Ras, M.Y.Hacisalihoglu, E.Ressouche, B.Ouladdiaf, B.Büchner, S. Wurmehl, Structural inhomogeneities in FeTe0.6Se0.4: Relation to superconductivity, J. Cryst. Growth 432, 95 (2015).
- [29] S. Hartwig, N. Schäfer, M. Schulze, S. Landsgesell, D. Abou-Rasa, Ch.G.F. Blumb, S. Wurmehl, A. Sokolowski, B. Büchner, K. Prokeš, Inhomogeneities and superconductivity in poly-phase Fe-Se-Te systems, Phys.B: Cond. Mat 531, 102 (2018).
- [30] M. Rosmus, R. Kurleto, D. J. Gawryluk, J. Goraus, M. Z. Cieplak, and P. Starowicz, Effect of electron doping in FeTe1-ySey realized by Co and Ni substitution, Supercond. Sci. Technol. 32, 105009 (2019).
- [31] T. Otsuka, S. Hagisawa, Y. Koshika, S. Adachi, T. Usui, N. Sasaki, S. Sasaki, S. Yamaguchi, Y. Nakanishi, M. Yoshizawa, S. Kimura, and T. Watanabe, Incoherent-coherent crossover and the pseudogap in Te-annealed superconducting Fe1+yTe1-xSex revealed by magnetotransport measurements, Phys. Rev. B 99, 184505 (2019).
- [32] G. F. Chen, Z. G. Chen, J. Dong, W. Z. Hu, G. Li, X. D. Zhang, P. Zheng, J. L. Luo, and N. L. Wang, Electronic properties of single-crystalline Fe1.05Te and Fe1.03Se0.30Te0.70, Phys. Rev. B 79, 140509(R) (2009).
- [33] I. A. Zaliznyak, Z. Xu, J. M. Tranquada, G. Gu, A. M. Tsvelik, and M. B. Stone, Unconventional Temperature Enhanced Magnetism in Fe1.1Te, Phys. Rev. Lett. 107, 216403 (2011).
- [34] I. Zaliznyak, A. T. Savici, M. Lumsden, A. Tsvelik, R. Hu, and C. Petrovic, Spin-liquid polymorphism in a correlated electron system on the threshold of superconductivity, Proc. Natl Acad. Sci. USA 112 10316 (2015).
- [35] Z. Xu, J. A. Schneeloch, J. Wen, E. S. Božin, G. E. Granroth, B. L. Winn, M. Feygenson, R. J. Birgeneau, G. Gu, I. A. Zaliznyak, J. M. Tranquada, and G. Xu, Thermal evolution of antiferromagnetic correlations and tetrahedral bond angles in superconducting FeTe1-xSex, Phys. Rev. B 93, 104517 (2016).
- [36] Z. Xu, J. A. Schneeloch, J. Wen, B. L. Winn, G. E. Granroth, Y. Zhao, G. Gu, I. Zaliznyak, J. M. Tranquada, R. J. Birgeneau, and G. Xu, Surprising loss of three-dimensionality in low-energy spin correlations on approaching superconductivity in Fe1+yTe1-xSex, Phys. Rev. B 96, 134505 (2017).
- [37] Z. Xu, J. A. Schneeloch, M. Yi, Y. Zhao, M. Matsuda, D. M. Pajerowski, S. Chi, R. J. Birgeneau, G. Gu, J. M. Tranquada, and G. Xu, Coexistence of superconductivity and short-range double-stripe spin correlations in Te-vapor annealed FeTe1-xSex (), Phys. Rev. B 97, 214511 (2018).
- [38] M. D. Watson, T. K. Kim, A. A. Haghighirad, N. R. Davies, A. McCollam, A. Narayanan, S. F. Blake, Y. L. Chen, S. Ghannadzadeh, A. J. Schofield, M. Hoesch, C. Meingast, T. Wolf, and A. I. Coldea, Emergence of the nematic electronic state in FeSe, Phys. Rev. B 91, 155106 (2015).
- [39] M. He, L. Wang, F. Hardy, L. Xu, T. Wolf, P. Adelmann, and C. Meingast, Evidence for short-range magnetic order in the nematic phase of FeSe from anisotropic in-plane magnetostriction and susceptibility measurements, Phys. Rev. B 97, 104107 (2018), and references inside.
- [40] L. C. Rhodes, J. Böker, M.A. Müller, M. Eschrig, I.M. Eremin, Non-local Nematicity and the Missing Electron Pocket in FeSe. Npj Quan Mater. 6, 45 (2021).
- [41] K. Terao, T. Kashiwagi, T. Shizu, R. A. Klemm, and K. Kadowaki, Superconducting and tetragonal-to-orthorhombic transitions in single crystals of FeSe1-xTex (), Phys. Rev. B 100, 224516 (2019).
- [42] K. Horigane, H. Hiraka, and K. Ohoyama, Relationship between Structure and Superconductivity in FeSe1-xTex, J. Phys. Soc. Jap. bf 78, 074718 (2009).
- [43] P. D. Johnson, H.-B. Yang, J. D. Rameau, G. D. Gu, Z.-H. Pan, T. Valla, M. Weinert, and A. V. Fedorov, Spin-Orbit Interactions and the Nematicity Observed in the Fe-Based Superconductors, Phys. Rev. Lett. 114, 167001 (2015).
- [44] U. R. Singh, S. C. White, S. Schmaus, V. Tsurkan, A. Loidl, J. Deisenhofer, P. Wahl, Evidence for orbital order and its relation to superconductivity in FeSe0.4Te0.6. Sci. Adv. 1, e1500206 (2015).
- [45] H-H. Kuo, J-H. Chu, J. C. Palmstrom, S. A. Kivelson, I. R. Fisher, Ubiquitous signatures of nematic quantum criticality in optimally doped Fe-based superconductors, Science 352, 958 (2016).
- [46] S. Liu, J. Yuan, S. Ma, Z. Lu, Y. Zhang, M. Ma, H. Zhang, K. Jin, L. Yu, F. Zhou, X. Dong, and Z. Zhao, Magnetic-Field-Induced Spin Nematicity in FeSe1-xSx and FeSe1-yTey Superconductor Systems, Chin. Phys. Lett. 38, 087401 (2021).
- [47] H. Zhao, H. Li, L. Dong, B. Xu, J. Schneeloch, R. Zhong, M. Fang, G. Gu, J. Harter, S. D. Wilson, Z. Wang and I. Zeljkovic, Nematic transition and nanoscale suppression of superconductivity in Fe(Te,Se), Nature Phys. bf 17, 903 (2021).
- [48] J. S. Kim, D. G. Seiler, and W. F. Tseng, J. Appl. Phys. 73, 8324 (1993).
- [49] J. S. Kim, J. Appl. Phys. 86, 3187 (1999).
- [50] K. Okazaki, Y. Ito, Y. Ota, Y. Kotani, T. Shimojima, T. Kiss, S. Watanabe, C.-T. Chen, S. Niitaka, T. Hanaguri, H. Takagi, A. Chainani, and S. Shin, Superconductivity in an electron band just above the Fermi level: possible route to BCS-BEC superconductivity, Sci. Rep. 4, 4109 (2014).
- [51] P. Zhang, P. Richard, N. Xu, Y.-M. Xu, J. Ma, T. Qian, A. V. Fedorov, J. D. Denlinger, G. D. Gu, and H. Ding, Observation of an electron band above the Fermi level in FeTe0.55Se0.45 from in-situ surface doping, Appl. Phys. Lett. 105, 172601 (2014).
- [52] The ARPES experiment reported in [30] did not allow for identification of the dominant orbital character of , and bands, but based on other ARPES reports and calculations [7, 6, 21, 8] they are derived primarily from , and orbitals, respectively.
- [53] M. H. Fang, H. M. Pham, B. Qian, T. J. Liu, E. K. Vehstedt, Y. Liu, L. Spinu, and Z. Q. Mao, Phys. Rev. B 78, 224503 (2008).
- [54] S. Rößler, D. Cherian, S. Harikrishnan, H. L. Bhat, S. Elizabeth, J. A. Mydosh, L. H. Tjeng, F. Steglich, and S. Wirth, Disorder-driven electronic localization and phase separation in superconducting Fe1+yTe0.5Se0.5 single crystals, Phys. Rev. B 82, 144523 (2010).
- [55] E. J. W. Verwey, Electronic Conduction of Magnetite (Fe3O4) and its Transition Point at Low Temperatures, Nature 144, 327 (1939).
- [56] F. Walz, The Verwey transition - a topical review, J. Phys. Cond. Matter 14, R285 (2002).
- [57] N. Ni, S. L. Bud´ko, A. Kreyssig, S. Nandi, G. E. Rustan, A. I. Goldman, S. Gupta, J. D. Corbett, A. Kracher, and P. C. Canfield, Phys. Rev. B 78, 014507 (2008).
- [58] J. H. Chu, J. G. Analytis, C. Kucharczyk, and I. R. Fisher, Determination of the phase diagram of the electron-doped superconductor Ba(Fe1-xCox)2As2, Phys. Rev. B 79, 014506 (2009).
- [59] J. J. Sanchez, P. Malinowski, J.-W. Kim, P. Ryan, and J.-H. Chu, Quantitative relationship between structural orthorhombicity, shear modulus, and heat capacity anomaly of the nematic transition in iron-based superconductors, Phys. Rev. B 105, 064513 (2022).
- [60] M. E. Fisher and J. S. Langer, Phys. Rev. Lett. 20, 665 (1968).
- [61] A. T. Hristov, M. S. Ikeda, J. C. Palmstrom, P. Walmsley, and I. R. Fisher, Elastoresistive and elastocaloric anomalies at magnetic and electronic-nematic critical points, Phys. Rev. B 99, 100101(R) (2019).
- [62] Y. Bason, J. Hoffman, C. H. Ahn, and L. Klein, Magnetoresistance tensor of La0.8Sr0.2MnO3, Phys. Rev. B 79, 092406 (2009).
- [63] J. Li, S.L. Li, Z.W. Wu, S. Li, H.F. Chu, J. Wang, D.N. Zheng, A phenomenological approach to the anisotropic magnetoresistance and planar Hall effect in tetragonal La2/3Ca1/3MnO3 thin films, J. Phys. Condens. Matter 22, 146006 (2010).
- [64] T. Wong, C. Beekman, H. Guo, W. Siemons, Z. Gai, E. Arenholz, Y. Takamura, T. Z. Ward, Strain driven anisotropic magnetoresistance in antiferromagnetic La0.4Sr0.6MnO3, Appl. Phys. Lett. 105, 052401 (2014).
- [65] J. Gong, D. Zheng, D.Li, C.Jin, H. Bai, Lattice distortion modified anisotropic magnetoresistance in epitaxial La0.67Sr0.33MnO3 thin films, J. Alloys and Comp. 735, 1152 (2018).
- [66] Y. Miao, D. Yang, L. Jia, X. Li, S. Yang, C. Gao, and D. Xue, Magnetocrystalline anisotropy correlated negative anisotropic magnetoresistance in epitaxial Fe30Co70 thin films, Appl. Phys. Lett. 118, 042404 (2021).
- [67] G. F. Chen, Z. Li, J. Dong, G. Li, W. Z. Hu, X. D. Zhang, X. H. Song, P. Zheng, N. L. Wang, and J. L. Luo, Transport and anisotropy in single-crystalline SrFe2As2 and A0.6K0.4Fe2As2 (A=Sr, Ba) superconductors, Phys. Rev. B 78, 224512 (2008).
- [68] X F Wang, T Wu, G Wu, R H Liu, H Chen, Y L Xie and X H Chen, The peculiar physical properties and phase diagram of BaFe2-xCoxAs2 single crystals, New J. Phys. 11, 045003 (2009).
- [69] J-H. Chu, J. G. Analytis, D. Press, K. De Greve, T. D. Ladd, Y. Yamamoto, and I. R. Fisher, In-plane electronic anisotropy in underdoped Ba(Fe1-xCox)2As2 revealed by partial detwinning in a magnetic field, Phys. Rev. B 81, 214502 (2010).
- [70] D. N. Yuan, J. Yuan, Y. L. Huang, S. L. Ni, Z. P. Feng, H. X. Zhou, Y. Y.Mao, K. Jin, G. M. Zhang, X. L. Dong, F. Zhou and Z. X. Zhao, Observation of Ising spin-nematic order and its close relationship to the superconductivity in FeSe single crystals, Phys. Rev. B 94 060506(R) (2016).
- [71] J. M. Allred, K. M. Taddei, D. E. Bugaris, M. J. Krogstad, S. H. Lapidus, D. Y. Chung, H. Claus, M. G. Kanatzidis, D. E. Brown, J. Kang, R. M. Fernandes, I. Eremin, S. Rosenkranz, O. Chmaissem and R. Osborn, Double-Q spin-density wave in iron arsenide superconductors. Nat. Phys. 12, 493 (2016).
- [72] W. R. Meier, Q-P. Ding, A. Kreyssig, S. L. Bud´ko, A. Sapkota, K. Kothapalli, V. Borisov, R. Valenti, C. D. Batista, P. P. Orth, R. M. Fernandes, A. I. Goldman, Y. Furukawa, A. E. Böhmer and P. C. Canfield, Hedgehog spin-vortex crystal stabilized in a hole-doped iron-based superconductor, npj Quantum Mater. 3, 5 (2018).
- [73] L. Fanfarillo, E. Cappelluti, C. Castellani, and L. Benfatto, Unconventional Hall Effect in Pnictides from Interband Interactions, Phys. Rev. Lett. 109, 096402 (2012).