The uncertain interstellar medium of high-redshift quiescent galaxies: Impact of methodology
How much gas and dust is contained in high-redshift quiescent galaxies (QGs) is currently an open question with relatively few and contradictory answers, as well as important implications for our understanding of the nature of star formation quenching processes at cosmic noon. Here we revisit far-infrared (FIR) observations of the REQUIEM-ALMA sample of six QGs strongly lensed by intermediate-redshift galaxy clusters. We measured their continuum emission using priors obtained from high resolution near-infrared (NIR) imaging, as opposed to focusing on point-source extraction, converted it into dust masses using a FIR dust emission model derived from statistical samples of QGs, and compared the results to those of the reference work. We find that, while at least the most massive sample galaxy is indeed dust-poor, the picture is much more nuanced than previously reported. In particular, these more conservative constraints remain consistent with high dust fractions in early QGs. We find that these measurements are very sensitive to the adopted extraction method and conversion factors: the use of an extended light model to fit the FIR emission increases the flux of detections by up to 50% and the upper limit by up to a factor 6. Adding the FIR-to-dust conversion, this amounts to an order of magnitude difference in dust fraction, casting doubts on the power of these data to discriminate between star formation quenching scenarios. Unless these are identified by other means, mapping the dust and gas in high-redshift QGs will continue to require somewhat costly observations.
Key Words.:
Galaxies:early-type – Galaxies:formation – Galaxies:ISM – Gravitational lensing:strong1 Introduction
In the local Universe, most of the stars are held in so-called quiescent galaxies, which
are predominantly spheroidal systems where star formation activity is at very low levels
or entirely absent, and which have evolved passively, only becoming older and redder for
the past ten billion years. Unsurprisingly, contemporary quiescent galaxies by and large
lack the cold gas that fuels star-forming (SF) galaxies such as the Milky Way
(e.g., Saintonge et al., 2011; Young et al., 2011; Boselli et al., 2014). Whether they always did, on the other hand,
remains an unsolved yet deceptively important question.
The stellar component of quiescent galaxies (QGs) has been extensively studied and its
evolution traced out to , both photometrically (e.g., Davidzon et al., 2017) and
spectroscopically (Glazebrook et al., 2017; Schreiber et al., 2018; Tanaka et al., 2019; Valentino et al., 2020). However, the various mechanisms that
have been put forward to quench star formation, by either preventing the cooling of gas
in and onto galaxies (e.g., Birnboim & Dekel, 2003; Croton et al., 2006; Cattaneo et al., 2006), stabilizing it (Martig et al., 2009),
or outright expelling it (e.g., Di Matteo et al., 2005; Hopkins et al., 2006), might not leave sufficiently
conspicuous signatures in stellar populations. Indeed, galactic archaeology by way of
spectroscopic modeling (e.g., Onodera et al., 2015; Gobat et al., 2017; Valentino et al., 2020) has so far yielded only
circumstantial evidence on the quenching pathways of these galaxies
(e.g., Onodera et al., 2015; Man & Belli, 2018; Pawlik et al., 2019; Belli et al., 2019), constraining the timescale of quenching,
but not its specific mechanism.
On the other hand, the state of the interstellar medium (ISM) of QGs after quenching
should be sensitive to the specific scenario that led to quiescence: for example, a
completely expulsive quenching naturally leaves less gas than gravitational stabilization
or a mechanism that heats the ISM which, in the latter case, is in a warmer phase (e.g.,
neutral) on average than if stabilized against fragmentation.
While the gas content of normal, SF galaxies has been extensively traced up to
(e.g., Tacconi et al., 2018, 2020; Liu et al., 2019), similar efforts targeting QGs remain
sparser and heterogeneous, with CO observations generally placing constraints on
their molecular gas fraction () ranging from 6%
upper limits (Sargent et al., 2015; Bezanson et al., 2019; Williams et al., 2021) to % in some outliers
(Rudnick et al., 2017; Hayashi et al., 2018).
Interstellar dust, which correlates with total gas (e.g., Magdis et al., 2012), has so far
provided the only statistical, though more indirect, constraints on the ISM of QGs for
the first five billion years of the history of the Universe. Two approaches based on
dust emission have been used which, however, appear to yield contradictory results:
the first, using far-infrared (FIR) spectral energy distributions (SEDs) averaged over
large samples, suggests that QGs retain relatively large amounts of dust and gas
(Gobat et al., 2018; Magdis et al., 2021, hereafter, G18 and M21), corresponding to gas fractions
of % at solar metallicity. The data on which these SEDs are
based have a variable resolution that is typically lower than the angular size of
individual galaxies. They might therefore include contributions from nearby sources,
which have to be corrected for. The second approach, on the other hand, involves
resolved observations of strongly lensed (and thus magnified) QGs with, however,
more limited statistics. Based on these, Whitaker et al. (2021a, hereafter, W21) derived
constraints on dust masses which imply significantly lower upper limits of
% on . However, these conclusions are also based on
assumptions, such as the compactness of emission, conversion factors, and (in
particular, since the observations only sample the Rayleigh-Jeans tail of
dust emission) dust temperature. It is therefore not immediately clear whether
the apparent tension between these two types of constraints is not simply an
artifact of mismatched assumptions.
To remedy this doubt, we revisited the lensed QG sample of W21 using a methodology consistent with that of G18 and M21. Section 2 briefly summarizes the sample and data, Sect. 3 describes our analysis, Sect. 4 provides the results, and Sect. 5 presents our conclusions. We assumed a concordance cosmology with km s-1 Mpc-1, , and , as well as a Salpeter (1955) initial mass function (IMF), with quantities from the literature having been converted to this IMF.
2 Sample and data
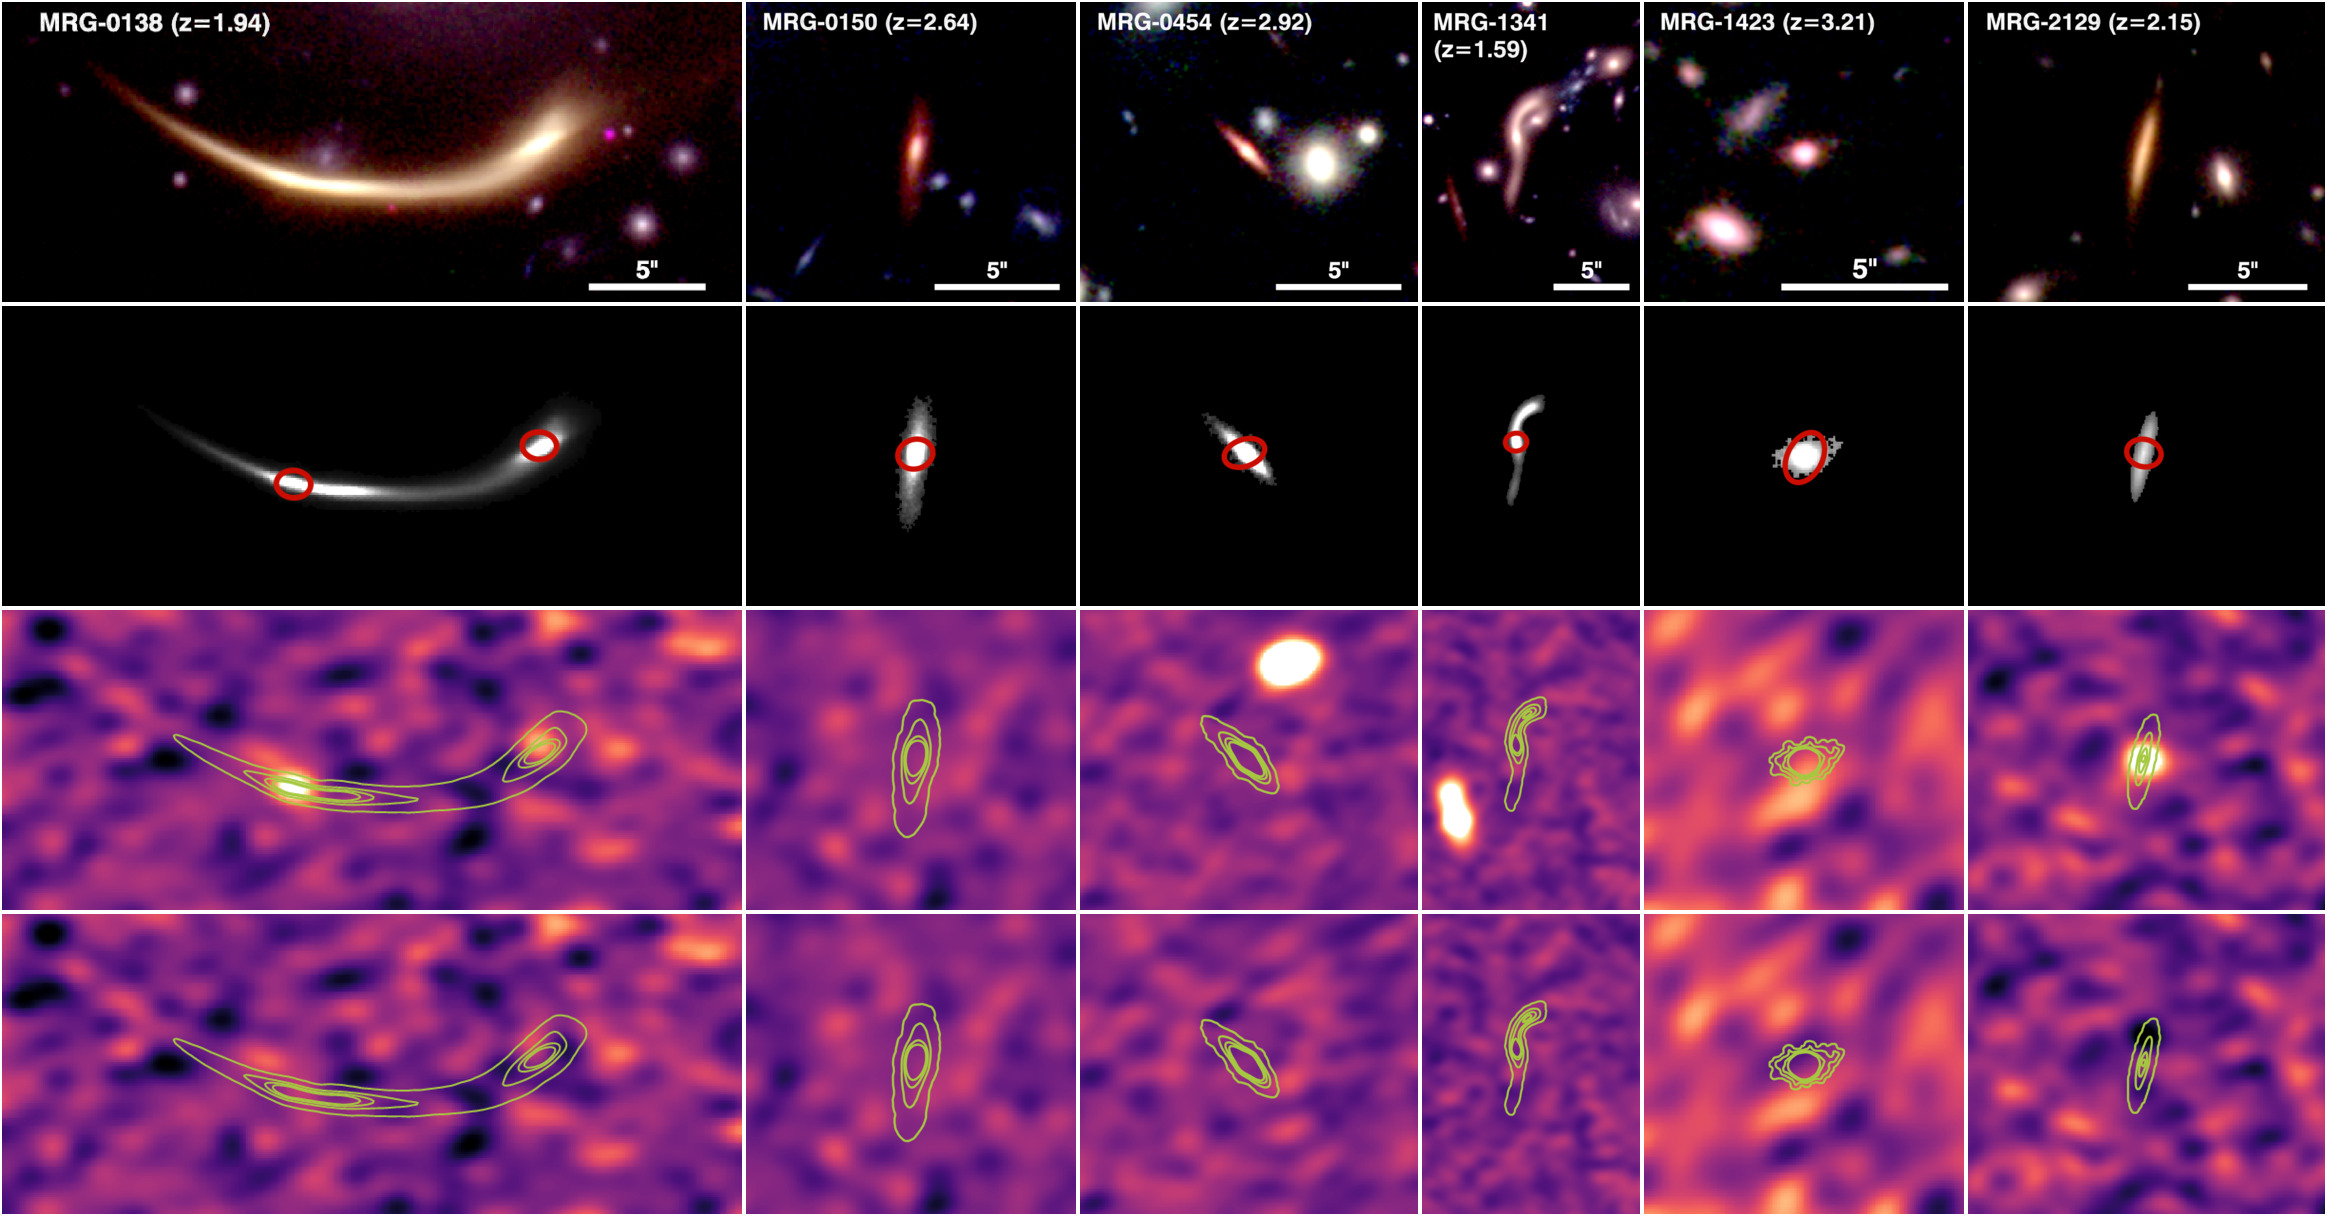
The REQUIEM-ALMA sample (W21) consists of six QGs at observed under programs 2018.1.00276 (PI K.E. Whitaker) and 2019.1.00227 (PI J. Tan) with the Atacama Large Millimeter/Submillimeter Array (ALMA) at 1.3 mm, corresponding to the ALMA Band 6 and m rest frame. We obtained the raw data from the ALMA Science Archive and processed them to produce calibrated visibility sets, which were then split and binned in both time and channels, and finally exported as a single continuum UVFITS table per QG with GILDAS111http://www.iram.fr/IRAMFR/GILDAS. All six QGs are strongly lensed by intermediate-redshift () massive galaxy clusters, with two creating giant arc images. Due to the nature of the lenses, they benefit from optical-near-infrared (NIR) imaging by the Hubble (HST) and Spitzer space telescopes, accumulated over the years under a variety of observing programs and publicly available in their respective archives. Table 2 summarizes the photometric coverage of these fields. The lensed galaxies themselves have also been observed spectroscopically, with them and the data being described in Newman et al. (2018, hereafter, N18) and Man et al. (2021). We refer the reader to these articles for more information and we adopt their naming conventions throughout.
3 Analysis
Based on two point-like detections, W21 concluded that the 1.3 mm emission from dust was
confined to compact, unresolved regions of the QGs. These correspond, spatially, to their
cores (the central kiloparsec, in the case of the most extended, MRG-0138), which are
also the brightest regions of the galaxies in stellar light. More recently, the QG
MRG-2129 was followed up on with ALMA at very high resolution by Morishita et al. (2022), who
similarly concluded that the emission is compact and localized. However, this new
observation consists of a single pointing with a maximum recoverable scale of
0.6”, or half the beam width of the data used in W21.
Therefore, if conversely the distribution of dust includes an overall continuous
component following the stellar one, the emission from lower-surface brightness
regions could very well be either below the noise level of the data or missed
entirely by the instrument.
As a test, we examined resolved, integral field spectroscopy of two of the most
extended galaxies in the sample, MRG-0138 and MRG-1341 (see Appendix B).
Within the wavelength range of the spectra, we found no appreciable difference between
the bright central regions of these galaxies and their extended outer regions, which
would for example suggest that one contains a larger fraction of younger stars than
the former.
For each galaxy, we first constructed a model of their stellar distribution from the
longest-wavelength high-resolution data available, namely the HST Wide Field
Camera 3 (WFC3) F160W imaging, corresponding to the rest-frame optical range. Cutouts
centered on the QGs were extracted from the F160W images and the light of nearby
objects was modeled and subtracted using galfit (Peng et al., 2010). All pixels below
3 of the background value were then zeroed out, using SExtractor
(Bertin & Arnouts, 1996) on the residual image to isolate the QG. We note that, while this
threshold was chosen to avoid including image noise in the model, it might cut out
some of the galaxies’ extended profiles. However, as the F160W data are deep compared
to the brightness of the lensed QGs, the loss of emission should not be significant.
The use of these stellar light models should therefore come closest to reproducing
the effective aperture of the SED stacks in M21, minus the potential residual
contamination by nearby sources. The cutout images and resulting models are shown
in Fig. 1 (top and second row, respectively).
To account for astrometry differences between the F160W and ALMA data, the fit allowed
for a free offset. For detected objects, this yielded offsets of 0.15”, which
is significantly smaller than the spatial resolution of the ALMA data.
Any bright sources present in the field of view (MRG-0454 and MRG-1341) were modeled
at the same time, so as to mitigate the possibility of contamination from sidelobes.
In cases where the residuals of the extended model fit contained noticeable
(3) leftover emission, we also allowed for excess central emission in the
form of an additional point source with free amplitude for a total of
two components per fit in this case.
One exception was MRG-0138, where the lensed arc targeted by the ALMA observation
is a combination of two images bisected by a critical line. We did not attempt to
separate them, but rather counted them as a single image, thus requiring the use of
two point-source components, with relative amplitudes fixed by the ratio of mean
magnifications between the two images given in N18.
We then corrected the quantities derived for this object to the magnification factor
of the first image (N18). As a sanity check and to allow for a direct comparison with
W21, we also extracted 1.3 mm fluxes by fitting a point source without the total
light model. Uncertainties (and thus upper limits) for model and point source fluxes were estimated
from the r.m.s. dispersion of a thousand extractions performed with each component at
random positions with large offsets from phase center (that is, staying well clear of
the target galaxy and other sources within the field of view). The resulting magnified
fluxes and errors, or 3 upper limits, are shown in Table 1.
3.1 Dust masses
We then converted these fluxes into (magnified) dust masses using the average FIR
SED template for QGs of M21, sampled at 1.3 mm. This model has a dust
temperature of K, which is a few Kelvin lower than the mass-weighted
typically used for SF galaxies (Scoville et al., 2016, 2017, hereafter S16). In addition
to being consistent with the methodology of M21, with which we compare in this study,
we consider it a more likely description of the ISM of QGs which, given their
quiescence, should be subjected to a softer radiation field than in SF galaxies.
If the FIR SEDs used in M21 were contaminated by, for example, SF occurring at a similar
redshift (i.e., from satellite galaxies), the true of high-redshift QGs might
be even lower. To summarize, here, we consider three analysis methods. In order of
complexity, they are as follows: point-source extraction converted to a dust mass using S16,
point-source extraction converted to dust mass using the M21 SED, and an extended
model fit converted to dust using M21. For clarity, we do not include the
fourth possible combination here, that is, the extended model fit with the S16 calibration,
as it falls between the first and third method and can be easily inferred from
the first three (see Sect. 4). The dust masses or upper limits
corresponding to both model+point and point-source fluxes are given in
Table 1.
3.2 Stellar masses
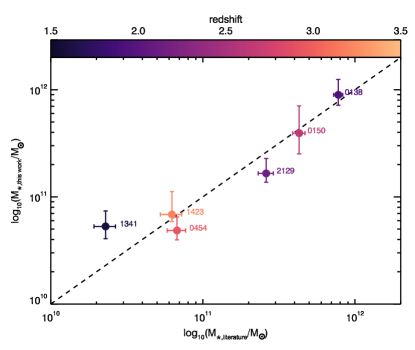
For consistency with the ALMA analysis, we also recomputed stellar masses for the six REQUIEM-ALMA QGs from SEDs based on the F160W light model used to fit the ALMA data. That is, we extracted photometry from HST images using SExtractor in dual-image mode, with the F160W model as a reference. For Spitzer data, which have significantly lower resolution and are thus often blended, we instead performed a multicomponent decomposition222with MPFIT (Markwardt, 2009) of the image, using the F160W model and galfit models of nearby objects convolved with the point response functions of Spitzer/IRAC. We then modeled these SEDs with Bruzual & Charlot (2003) stellar population templates, assuming star formation histories (SFHs) with exponential cutoffs, as already used for high-redshift QGs (e.g., Schreiber et al., 2018; Valentino et al., 2020). We checked that the stellar masses thusly obtained are consistent with those from the literature. We refer the reader to Appendix D for more details.
4 Results
Of the two point-like detections in W21, the emission of MRG-2129 is well-fitted
by the extended stellar light model (Fig. 1, right) without
compact emission, with slightly lower residuals than when using a point source;
although, the difference is not significant. With the same conversion factor,
this yields a 50% larger than when only considering compact emission
(W21, Morishita et al., 2022).
On the other hand, MRG-0138 requires an additional point-like component,
accounting for 45% of the total flux per image. For this object, the
error on the flux is thus taken as the quadrature sum of model and point-source
uncertainties. The other four galaxies in the sample remain undetected at
the 3 level, in which case we only considered uncertainties from
the stellar light model.
Under the assumption that interstellar dust and stars have comparable distributions
in the source plane, the dust-to-stellar mass ratio does not depend
on the lensing magnification .
We note that, in any other case, correctly estimating would
require the usage of a full lensing model to account for differential
magnification across images.
We therefore do not include the uncertainty on in the formal error on this
ratio. Likewise, here, we focus our discussion on dust fractions, so as to not
depend on the uncertain dust-to-gas conversion factor (92 for M21, 100 for W21).
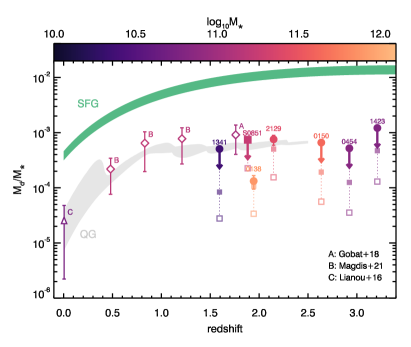
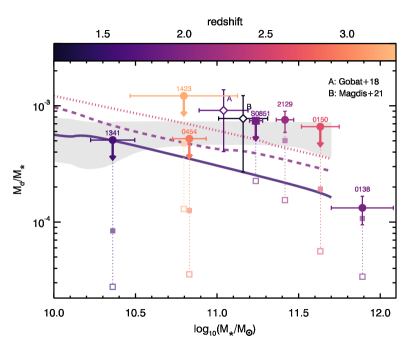
Fig. 2 shows the of the REQUIEM-ALMA galaxies, as
a function of redshift and stellar mass, for the three different flux extraction
and 1.3 mm-to-dust conversion cases: point sources with the S16 calibration, as
in W21; point sources with the M21 SED; and extended models with the M21 SED.
For comparison, we also include in Fig. 2 literature constraints on
the of S0851, which is another lensed QG (though unresolved in the
FIR) discussed in Caliendo et al. (2021).
The first case yields the lowest , while the second one produces
values higher by a factor . As noted in M21, the difference between these
two estimates stems from the higher used by S16, which implies a higher
dust luminosity per unit mass. Using the extended emission model (third case)
raises by another 25%-50% for detected objects and a factor
3-5 in the case of upper limits, depending on the size of the galaxy.
Using the stellar light model and M21 SED, the constraints on the
of the REQUIEM-ALMA galaxies become consistent with those derived from FIR
SEDs (G18, M21) and thus with a scenario where relatively young QGs retain
a non-negligible ISM, as found by Suess et al. (2017) and Bezanson et al. (2022) at
intermediate redshift.
However, we caution that, while at least one object (MRG-2129) has 0.13% dust,
implying %, the upper limits derived here remain
compatible with much lower ISM fractions, which makes it difficult to draw firm
conclusions on quenching scenarios from these data.
The notable exception is MRG-0138 which, even in this new analysis, remains almost an order of magnitude more dust-poor than the other five QGs. Assuming no systematic error in its estimated magnification, it is also the most massive galaxy in the sample, occupying the high-mass tip of the galaxy mass function in its redshift range (e.g., Davidzon et al., 2017), and it is possibly the oldest when accounting for differences in redshift (N18 and Appendix B). This suggests a host dark matter halo with a mass M⊙ (at 3, assuming parameter and uncertainties as well as the relation of Girelli et al., 2020), where cold gas accretion should have become inefficient at (Dekel & Birnboim, 2006), around which time quenching likely began. Since dust is destroyed over time in QGs (e.g., Smercina et al., 2018; Whitaker et al., 2021b), its low concentration in MRG-0138 is therefore unsurprising. For example, a depletion time for dust of 1.7 Gyr (Michałowski et al., 2019; Gobat et al., 2020) would imply that the initial dust mass after quenching was higher by at least a factor 2. This mirrors the anticorrelation between and stellar mass seen in the local Universe (e.g., Young et al., 2011; Saintonge et al., 2017; Tacconi et al., 2018, 2020; Liu et al., 2019; Saintonge & Catinella, 2022).
5 Conclusions
In this Letter, we revisited the REQUIEM-ALMA literature sample of six lensed QGs.
We analyzed the ALMA Band 6 continuum observations of these galaxies, described
in W21, with a different methodology and assumptions. Namely, we allowed for extended
dust emission coterminous with the stellar distribution, with or without an
additional compact component, and we converted the measured intensities to dust
masses using an empirical FIR SED derived from larger statistical QG samples.
We found that, while some tension with SED-derived results might still exist,
the method used for FIR flux extraction and the light-to-mass conversion
factor both have a significant impact on the estimate of their dust fractions,
with both adding up to an order of magnitude variation. In particular, opting
for extended models based on the stellar surface brightness of the targets has
the effect of relaxing, if not eliminating, said tension.
Under our physically motivated assumptions, the constraints on the dust fraction
of this sample are broadly consistent with the %
values derived by G18 and M21 for coeval QGs from lower-resolution FIR stacks.
On the other hand, we confirm the scant dust content of MRG-0138 determined
in W21. This object, being the most massive member of the sample, has likely
experienced the most biased evolution. Its tension with the stacked results
of G18 and M21 might then be explained by an anticorrelation between ISM
mass and stellar mass being already present at this epoch, which would be
largely diluted with them being averaged over large samples with relatively
broad stellar mass ranges.
Knowing whether the ISM of high-redshift QGs is confined to central cores, distributed but clumpy, or diffuse would drive the choice of the extraction method. Simulations could in principle inform us on the likely true amount and distribution of dust and gas in early QGs, if sufficiently well bracketed by other observables. On the other hand, the current statistics allowed by strong lensing, and the data thereon at their current depth, are not sufficient to draw definitive conclusions on this aspect. Given the current lack of consensus regarding the total ISM mass of these galaxies, resolved observations thus need to be taken with caution.
Acknowledgements.
GBC acknowledges the Max Planck Society for financial support through the Max Planck Research Group for S.H.Suyu and the academic support from the German Centre for Cosmological Lensing.References
- Belli et al. (2019) Belli, S., Newman, A.B., Ellis, R.S. 2019, ApJ, 874, 17
- Bertin & Arnouts (1996) Bertin, E. & Arnouts, S. 1996, A&AS, 117, 393
- Bezanson et al. (2019) Bezanson, R., Spilker, J., Williams, C. et al. 2019, ApJ, 873, 19
- Bezanson et al. (2022) Bezanson, R., Spilker, J., Suess, K.A. et al. 2022, ApJ, 925, 153
- Birnboim & Dekel (2003) Birnboim, Y. & Dekel, A. 2003, MNRAS, 345, 349
- Boselli et al. (2014) Boselli, A., Cortese, L., Boquien, M. et al. 2014, A&A, 564, A66
- Bruzual & Charlot (2003) Bruzual, G. & Charlot, S. 2003, MNRAS, 344, 1000
- Caliendo et al. (2021) Caliendo, J.N., Whitaker, K.E., Akhshik, M. et al. 2021, ApJ, 910, 7
- Cattaneo et al. (2006) Cattaneo, A., Dekel,. A., Devriendt, J., Guiderdoni, B., Blaizot, J. 2006, MNRAS, 370, 1651
- Croton et al. (2006) Croton, D.J., Springel, V., White, S.D.M. et al. 2006, MNRAS, 365, 11
- Davidzon et al. (2017) Davidzon, I., Ilbert, O., Laigle, C. et al. 2017, A&A, 605, A70
- Dekel & Birnboim (2006) Dekel, A. & Birnboim, Y. 2009, MNRAS, 368, 2
- Di Matteo et al. (2005) Di Matteo, T., Springel, V., Hernquist, L. 2005, Nature, 433, 604
- Fanelli et al. (1992) Fanelli, M.N., O’Connell, R.W., Burstein, D., Wu, C. 1992, ApJS, 82, 197
- Girelli et al. (2020) Girelli, G., Pozzetti, L., Bolzonella, M. et al. 2020, A&A, 634, A135
- Glazebrook et al. (2017) Glazebrook, K., Schreiber, C., Labbé, I. et al. 2017, Nature, 544, 71
- Gobat et al. (2017) Gobat, R., Daddi, E., Strazzullo, V. et al. 2017, A&A, 599, A95
- Gobat et al. (2018) Gobat, R., Daddi, E., Magdis, G. et al. 2018, Nature Astronomy, 2, 239
- Gobat et al. (2020) Gobat, R., Magdis, G., D’Eugenio, C., Valentino, F. 2020, A&A, 644, L7
- Hayashi et al. (2018) Hayashi, M., Tadaki, K., Kodama, T. et al. 2018, ApJ, 856, 118
- Hopkins et al. (2006) Hopkins, P.F., Somerville, R.S., Hernquist, L. et al. 2006, ApJ, 652, 864
- Lianou et al. (2016) Lianou, S., Xilouris, E., Madden, S.C., Barmby, P. 2016, MNRAS, 461, 2856
- Liu et al. (2019) Liu, D., Schinnerer, E., Groves, B. et al. 2019, ApJ, 887, 235
- Magdis et al. (2012) Magdis, G., Daddi, E., Béthermin, M. et al. 2012, ApJ, 760, 6
- Magdis et al. (2021) Magdis, G., Gobat, R., Valentino, F. et al. 2021, A&A, 647, A33
- Man & Belli (2018) Man, A.W.S.& Belli, S. 2018, Nature Astronomy, 2, 695
- Man et al. (2021) Man, A.W.S., Zabl, J., Brammer, G. et al. 2021, ApJ, 919, 20
- Maraston et al. (2009) Maraston, C., Nieves Colmenárez, L., Bender, R., Thomas, D. 2009, A&A, 493, 425
- Markwardt (2009) Markwardt, C.B., 2009, ASPC, 411, 251
- Martig et al. (2009) Martig, M., Bournaud, F., Teyssier, R., Dekel, A. 2009, ApJ, 707, 250
- Michałowski et al. (2019) Michałowski, M.J., Hjorth, J., Gall, C. et al. 2019, A&A, 632, 43
- Morishita et al. (2022) Morishita, T., Abdurro’uf, Hirashita, H. et al., arXiv:2208.10525
- Newman et al. (2018) Newman, A.B., Belli, S., Ellis, R.S., Patel, S.G. 2018, ApJ, 862, 125
- Onodera et al. (2015) Onodera, M., Carollo, C.M., Renzini, A. et al. 2015, ApJ, 808, 161
- Pawlik et al. (2019) Pawlik, M.M., McAlpine, S., Trayford, J.W. et al. 2019, Nature Astronomy, 3, 440
- Peng et al. (2010) Peng, C.Y., Ho, L.C., Impey, C.D., Rix, H.-W. 2010, AJ, 139, 2097
- Rudnick et al. (2017) Rudnick, G., Hodge, J., Walter, F. et al. 2017, ApJ, 849, 27
- Saintonge et al. (2011) Saintonge, A., Kauffmann, G., Kramer, C. et al. 2011, MNRAS, 415, 32
- Saintonge et al. (2017) Saintonge, A., Catinella, B., Tacconi, L.J. et al. 2017, ApJS, 233, 22
- Saintonge & Catinella (2022) Saintonge, A. & Catinella, B. 2022, ARA&A, 60, 319
- Salpeter (1955) Salpeter, E.E. 1955, ApJ, 121, 161
- Sargent et al. (2015) Sargent, M.T., Daddi, E., Bournaud, F. et al. 2015, ApJ, 806, 20
- Schreiber et al. (2018) Schreiber, C., Glazebrook, K., Nanayakkara, T. et al. 2018, A&A, 618, A85
- Scoville et al. (2016) Scoville, N., Sheth, K., Aussel, H. et al. 2016, ApJ, 820, 83
- Scoville et al. (2017) Scoville, N., Lee, N., Vanden Bout, P. et al. 2017, ApJ, 837, 150
- Smercina et al. (2018) Smercina, A., Smith, J.D.T., Dale, D.A. et al. 2018, ApJ, 855, 51
- Soto et al. (2016) Soto, K.T., Lilly, S.J., Bacon, R. et al. 2016, MNRAS, 458, 3210
- Suess et al. (2017) Suess, K.A., Bezanson, R., Spilker, J.S. et al. 2017, ApJ, 846, 14
- Tacconi et al. (2018) Tacconi, L.J., Genzel, R., Saintonge, A. et al. 2018, ApJ, 853, 179
- Tacconi et al. (2020) Tacconi, L.J., Genzel, R., Sternberg, A. 2020, ARA&A, 58, 157
- Tanaka et al. (2019) Tanaka, M., Valentino, F., Toft, S. et al. 2019, ApJ, 885, 34
- Valentino et al. (2020) Valentino, F., Tanaka, M., Davidzon, I. et al. 2020, ApJ, 889, 93
- Vazdekis et al. (2010) Vazdekis, A., Sánchez-Blázquez, P., Falcón-Barroso, J. et al. 2010, MNRAS, 404, 1639
- Weilbacher et al. (2020) Weilbacher P.M., Palsa, R., Streicher, O. et al. 2020, A&A, 641, A28
- Whitaker et al. (2014) Whitaker, K.E., Franx, M., Leja, J. et al. 2014, ApJ, 795, 104
- Whitaker et al. (2021a) Whitaker, K.E., Williams, C.C., Mowla, L. et al. 2021, Nature, 597, 485
- Whitaker et al. (2021b) Whitaker, K.E., Narayanan, D., Williams, C.C. et al. 2021, ApJ, 922, 30
- Williams et al. (2021) Williams, C.C., Spilker, J.S., Whitaker, K.E. et al. 2021, ApJ, 908, 54
- Young et al. (2011) Young, L.M., Bureau, M., Davis, T.A. et al. 2011, MNRAS, 414, 940
Appendix A HST and Spitzer coverage
Table 2 shows the broadband photometric coverage by the HST and Spitzer telescopes of the fields of each QG, with each dot indicating that public imaging data are available from their respective archives.
| Band | MRG- | |||||
|---|---|---|---|---|---|---|
| 0138 | 0150 | 0454 | 1341 | 1423 | 2129 | |
| F275W | ||||||
| F336W | ||||||
| F390W | ||||||
| F435W | ||||||
| F475W | ||||||
| F555W | ||||||
| F606W | ||||||
| F625W | ||||||
| F775W | ||||||
| F814W | ||||||
| F850LP | ||||||
| F105W | ||||||
| F110W | ||||||
| F125W | ||||||
| F140W | ||||||
| F160W | ||||||
| IRAC1 | ||||||
| IRAC2 | ||||||
| IRAC3 | ||||||
| IRAC4 | ||||||
Appendix B Spatially resolved spectroscopy
We obtained integral field spectroscopic data of two of the
six targets from the Science Archive of the European Southern
Observatory (ESO). The clusters MACS0138 and MACS1341 were observed
with the Multi Unit Spectroscopic Explorer (MUSE) on the Very Large
Telescope (VLT) under ESO programs 0103.A-0777 (PI A. Edge) and
0103.B-0717 (PI A. Man), respectively.
MACS0138 was observed for a total of 48.5 minutes on target with a
median seeing of 0.8”, while MACS1341 was observed for a total
of 82 minutes using the Ground Layer Adaptive Optics (GLAO) system,
which provided a final point spread function (PSF) width of 0.55”
measured from the white light image (i.e., the data cube collapsed
along its wavelength axis). The raw data were reduced using the
standard MUSE pipeline (version 2.8; Weilbacher et al., 2020) to produce
corrected and calibrated data cubes. We then applied the Zurich
Atmosphere Purge tool (ZAP; Soto et al., 2016) to improve the sky
subtraction and, for each cluster, matched the world coordinate
system (WCS) of the data cube (based on the white image) to that
of the HST/WFC3 F160W image. Further details on the data and their
reduction will be given in Caminha et al. (in prep.).
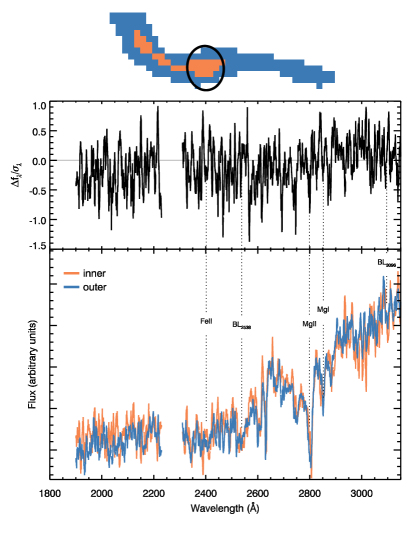
We divided each of the F160W stellar light models into two areas of equal total flux, corresponding to an inner (or “bulge”) and outer (or “disk”) region. We then rebinned these masks to the MUSE pixel size and produced a median stacked 1D spectrum for each. We computed an associated noise spectrum using the jackknife method as
| (1) |
where is the number of pixels, the spectrum corresponding
to the -th pixel, and the coadded spectrum.
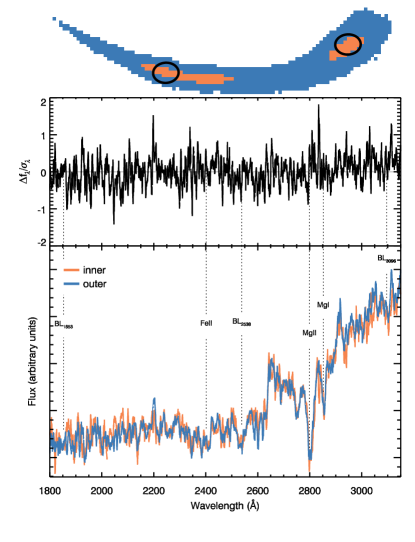
Figs. 3 and 4 compare the inner and outer VLT/MUSE spectra of MRG-0138 and MRG-1341, respectively, with the signal-difference-to-noise spectrum shown in the middle panel. In both cases, we find no appreciable difference between spectral features within the two regions. Spectral modeling based on the parametric SFH described in Appendix D produces consistent mass-weighted ages of 1.5 Gyr and 1.8 Gyr. Similarly, adopting a nonparametric fit with Vazdekis et al. (2010) templates, as done in Gobat et al. (2017), yield very similar age and metallicity distributions, within uncertainties. However, we caution that, although the absorption features covered by the MUSE spectra correlate with a combination of age and metallicity (Fanelli et al., 1992; Maraston et al., 2009), being limited to the near-ultraviolet, which is most sensitive to young massive stars, makes them suboptimal for reconstituting SFHs. In addition, some stellar populations could be invisible if, for example, they are entirely shrouded by dust. Alternatively, a signal of inside-out or outside-in quenching might still be present, but more subtle than what these particular data can resolve. Finally, we note that these results do not change if mean spectra are used or if we define the inner region using the ALMA beam (see top panels in Figs. 3 and 4) rather than isophotes.
Appendix C uv plane modeling
Given an intensity distribution on the sky of , where and are
spatial coordinates from the phase center, we modeled the complex visibility
as
| (2) |
where is the primary beam response of the antennas, with the first order Bessel J function, , and HWBN is the half-beam width at first null. Here we assumed that there are no significant differences in astrometry between the ALMA and HST data. In cases where a bright off-center source exists in the field of view (e.g., for MRG-1341; see Fig. 1), this appears to be the case.
Appendix D Comparison of stellar masses
Fig. 5 compares previously published stellar masses of the QG sample with those used in this work. The latter masses were estimated from fits to their HST and Spitzer SEDs, extracted using SExtractor (Bertin & Arnouts, 1996) in dual-image mode with the HST/WFC3 F160W model as the base, using Bruzual & Charlot (2003) stellar population models. We assumed metallicity priors from spectroscopy (Newman et al., 2018; Man et al., 2021) and delayed exponentially declining SFHs with an exponential cutoff of the form
| (3) |
(where is the time since the beginning of star formation, the SFH’s
-folding timescale, and and parameterize the
start and timescale of quenching, respectively), which is appropriate for
high-redshift QGs (e.g., Schreiber et al., 2018; Valentino et al., 2020).
Here we fixed the start of the SFH at and assumed parameter ranges of
Gyr for , Gyr for , and Gyr for .
The stellar masses thusly derived from the SEDs are consistent with those published in previous works and used in W21, except for MRG-1341, where our estimate is almost a factor 2 higher. As a consequence, the of MRG-1341 presented in this Letter is lower by half than if we had used the literature value.