PHANGS-JWST First Results: Dust embedded star clusters in NGC 7496
selected via 3.3m PAH emission
Abstract
The earliest stages of star formation occur enshrouded in dust and are not observable in the optical. Here we leverage the extraordinary new high-resolution infrared imaging from JWST to begin the study of dust-embedded star clusters in nearby galaxies throughout the local volume. We present a technique for identifying dust-embedded clusters in NGC 7496 (18.7 Mpc), the first galaxy to be observed by the PHANGS-JWST Cycle 1 Treasury Survey. We select sources that have strong 3.3m PAH emission based on a color excess, and identify 67 candidate embedded clusters. Only eight of these are found in the PHANGS-HST optically-selected cluster catalog and all are young (six have SED-fit ages of Myr). We find that this sample of embedded cluster candidates may significantly increase the census of young clusters in NGC 7496 from the PHANGS-HST catalog – the number of clusters younger than 2 Myr could be increased by a factor of two. Candidates are preferentially located in dust lanes, and are coincident with peaks in PHANGS-ALMA CO (2-1) maps. We take a first look at concentration indices, luminosity functions, SEDs spanning from 2700Å to 21m, and stellar masses (estimated to be between ). The methods tested here provide a basis for future work to derive accurate constraints on the physical properties of embedded clusters, characterize the completeness of cluster samples, and expand analysis to all 19 galaxies in the PHANGS-JWST sample, which will enable basic unsolved problems in star formation and cluster evolution to be addressed.
1 Introduction
Star clusters are formed in the densest parts of giant molecular clouds (Lada & Lada, 2003; Elmegreen, 2008; Kruijssen, 2012). During their formation and early evolution they remain surrounded by dust and molecular gas causing them to be heavily obscured at optical wavelengths, and often only detectable at infrared and longer wavelengths. Until now, such young objects were mostly identified using observations of the radio continuum (Johnson et al., 2003) or dust continuum in combination with molecular-gas lines (Leroy et al., 2018). Infrared studies of the star clusters inside such nurseries has so far mainly occurred in the Milky Way, Magellanic Clouds, and Local Group (e.g. Großschedl et al., 2019).
Since most stars form in clustered environments (Lada & Lada, 2003), embedded clusters represent a very early, critical stage in the star formation process. Therefore, the study of these systems is essential for understanding the mechanisms that drive star formation overall, and the properties and evolution of star cluster populations in galaxies.
Previous studies suggest that star clusters remain in this embedded phase within their natal cloud for only a few Myr ( 2-5 Myr, e.g. Whitmore et al., 2014b; Corbelli et al., 2017; Messa et al., 2021; Grasha et al., 2018, 2019; Kim et al., 2021, Kim et al 2022, Whitmore et al. 2022, this volume). However it has not been possible to obtain complete samples of embedded clusters beyond the Local Group to constrain these durations more directly, as the angular resolution of previous infrared facilities could not resolve the parsec scales required to identify clusters at larger distances.
The powerful new infrared capabilities of JWST enable embedded young star clusters throughout nearby galaxies to be identified and studied statistically. Complete samples of embedded clusters from PHANGS-JWST, combined with the PHANGS-HST, ALMA, and MUSE datasets, will allow basic open issues in star and cluster formation to be addressed, such as fraction of star formation that occurs in clusters (cluster formation efficiency), timescales for the clearing of the natal dust and gas, the conditions that lead to cluster formation, and the dependence of these parameters on galactic environment.
In this pilot study, we identify candidate embedded clusters in NGC 7496 using PHANGS-JWST NIRCam and PHANGS-HST UV-optical imaging. We find that selection based on an excess in the color, indicating PAH m emission, effectively identifies the youngest dusty star clusters. We take a first look at their properties, and compare with the census of optically-selected clusters in the PHANGS-HST catalog. The rest of this paper is organized as follows. In Section 2, we summarize the observations of NGC 7496 taken as part of the PHANGS-JWST Treasury program. In Section 3 we identify a small set of prototype embedded clusters with strong PAH m emission, and use their measured properties to define selection criteria to identify a larger smaple of candidate young, embedded clusters. In Section 4 we estimate the masses of the newly identified clusters and take a first look at the their luminosity functions at 2 and 3 m. We compare this new embedded cluster sample with the optically-selected PHANGS-HST catalog in Section 5, and also examine other properties of the sources, including concentration indices, and UV-IR SEDs, which also incorporates photometry from PHANGS-JWST MIRI imaging. We summarize our main conclusions and outline future work in Section 6.
2 Data
The PHANGS-JWST Cycle 1 Treasury program observed its first target, the dusty barred spiral galaxy NGC 7496 located at 18.7 Mpc (Shaya et al., 2017; Kourkchi et al., 2020; Anand et al., 2021), on 6 July 2022. The data were released (simultaneously to the team and public) on 14 July 2022. All 19 galaxies in the PHANGS-JWST sample will eventually be imaged with NIRCam and MIRI from 2.0 to 21, using 8 filters (NIRCam: F200W, F300M, F335M and F360M; MIRI: F770W, F1000W, F1130W and F2100W). Full details of the observing strategy and data reduction are given in the PHANGS-JWST survey description paper in this Volume (Lee et al. 2022).
In this analysis, we examine the JWST data together with UV-optical imaging in 5 filters from the PHANGS-HST survey (Lee et al., 2022, F275W, F336W, F438W, F555W and F814W). We compare our dust embedded clusters with the sample from the PHANGS-HST cluster catalog (Lee et al., 2022; Thilker et al., 2021; Turner et al., 2021; Deger et al., 2022), which provides age and stellar-mass estimates from spectral-energy distribution (SED) fitting in NGC 7496. Here, we consider the 263 clusters in the HST catalog which have passed human visual inspection and are classified as class 1 (symmetric compact cluster), and class 2 (asymmetric compact cluster; Whitmore et al., 2021; Deger et al., 2022). This PHANGS-HST sample spans a wide range of properties, with ages between 1 Myr and 13.7 Gyr, and masses between 500 and 4.6 with a median of 1.5 . Of these, 131 are 10 Myr and younger, with masses between 600 and 4.3 with a median of 8000 M⊙.
3 Methodology
3.1 Identification of embedded cluster prototypes
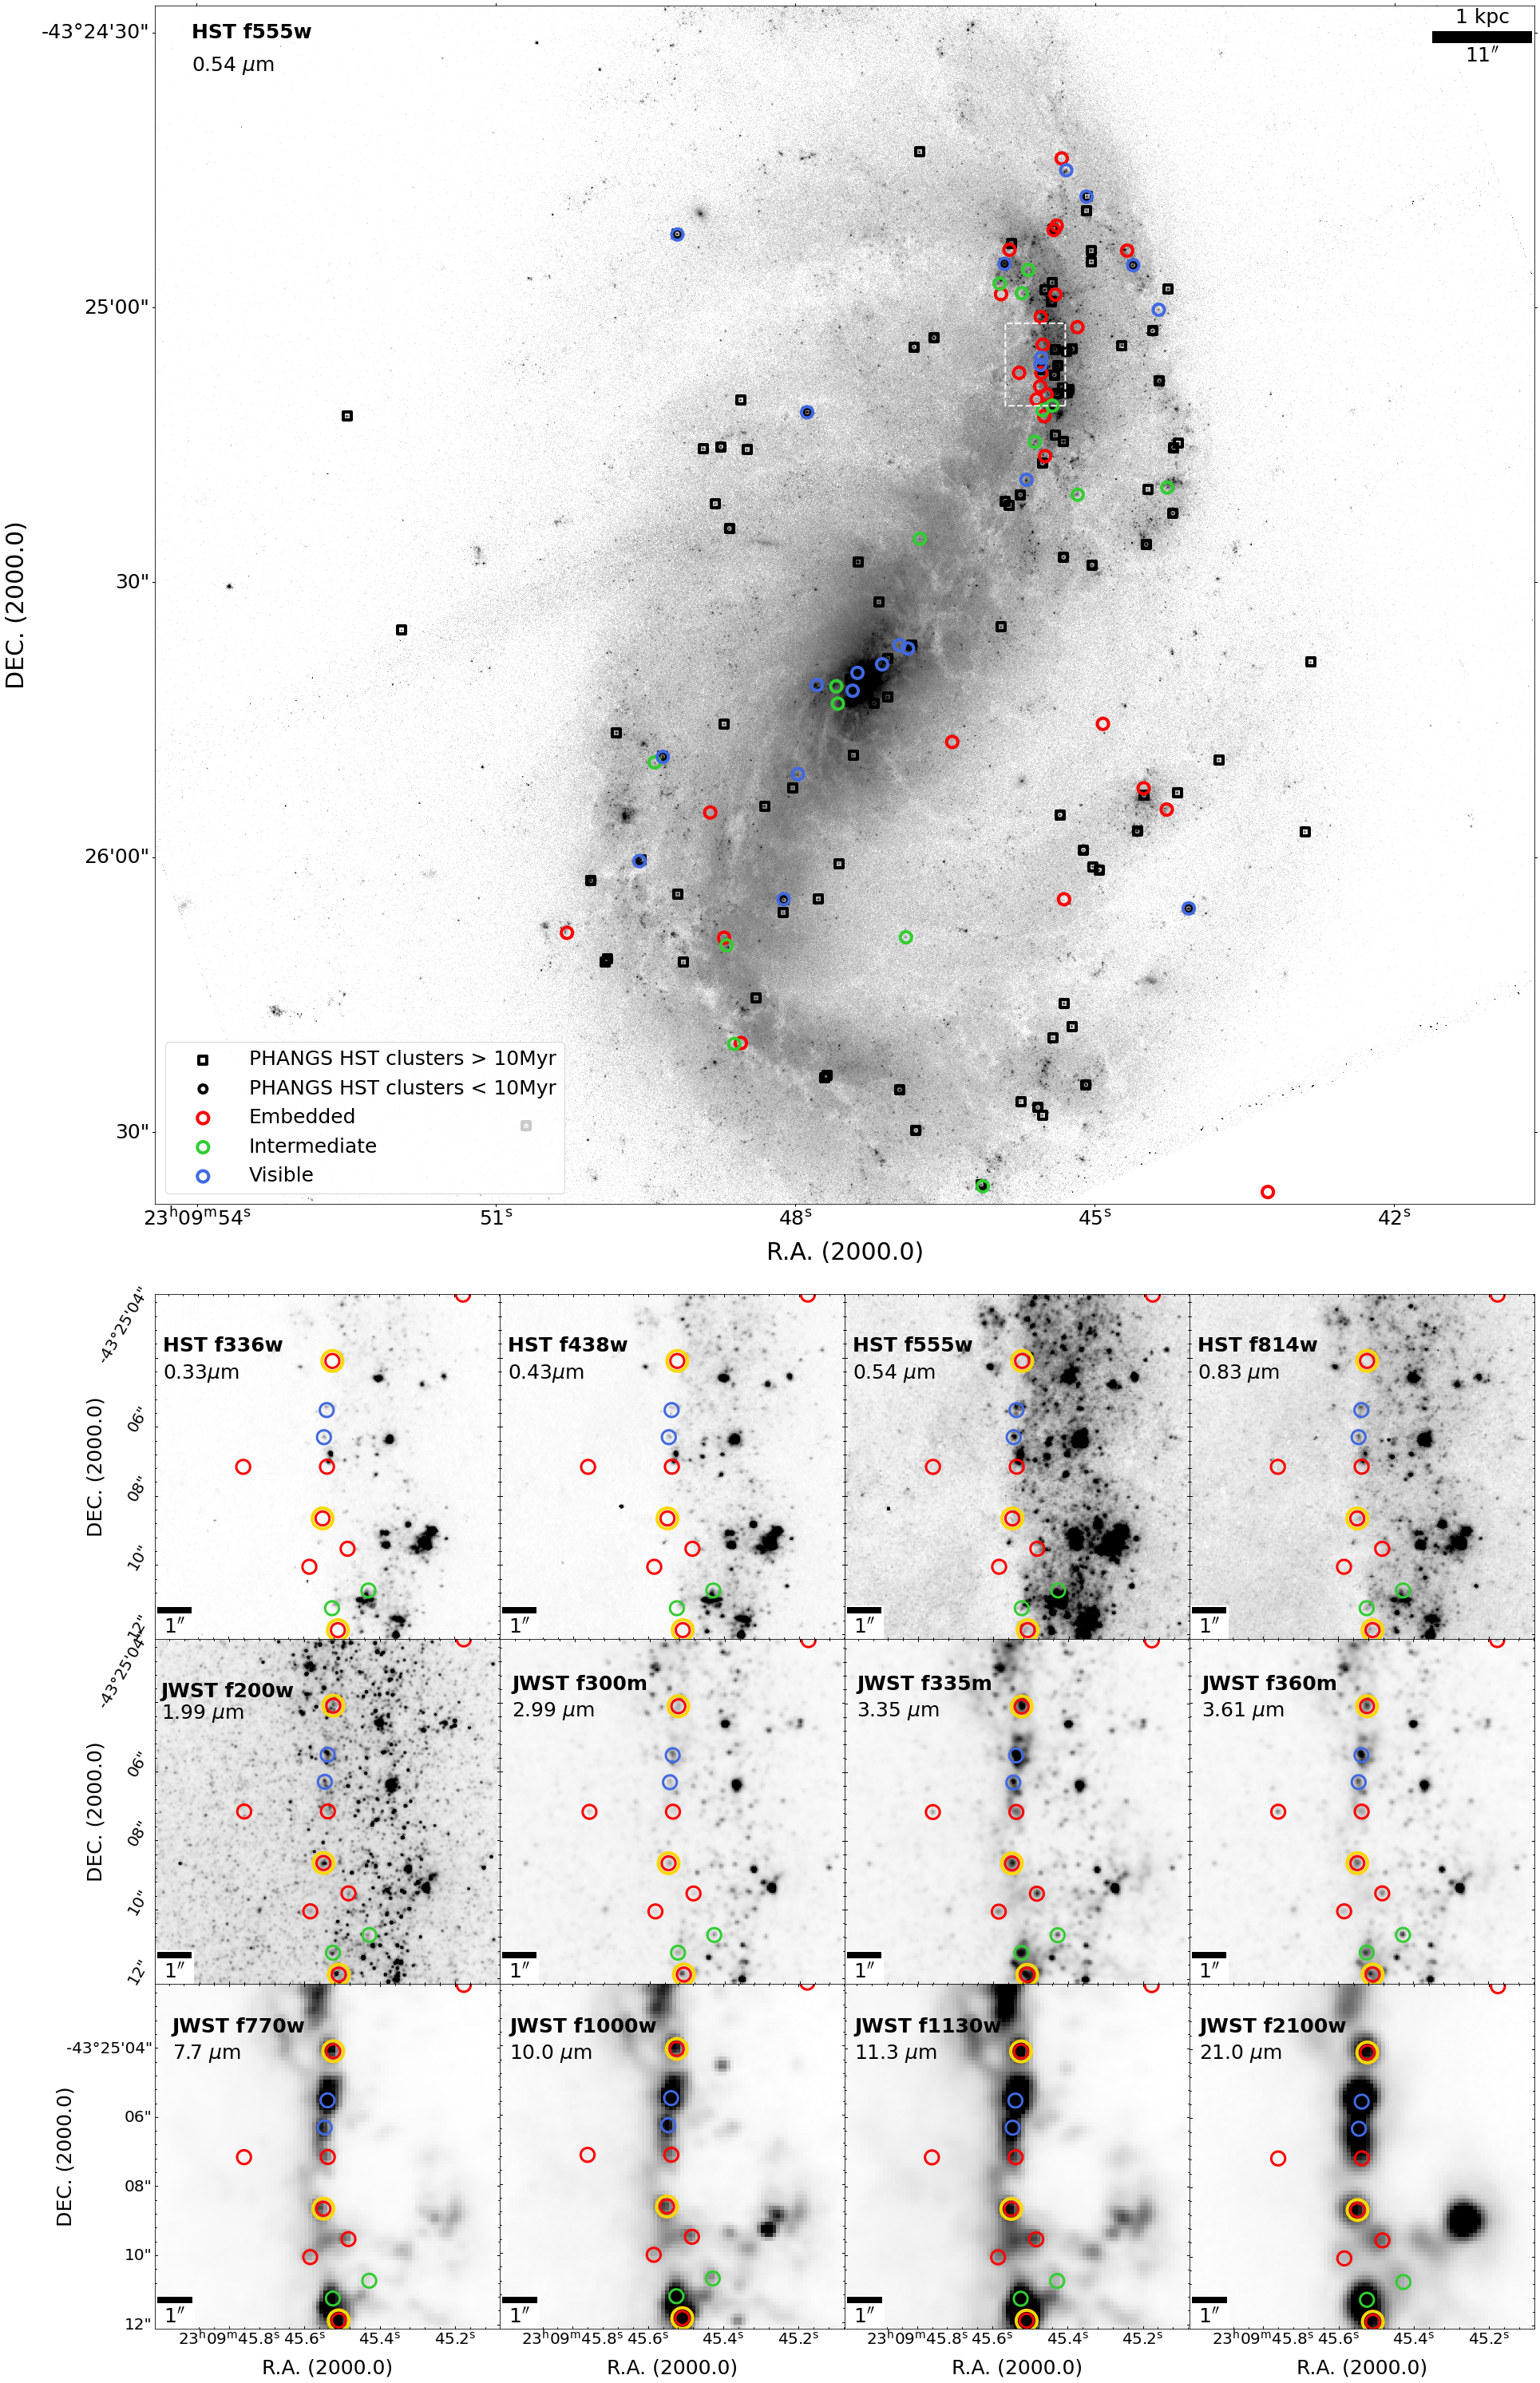
To begin our studies of dust embedded, young star clusters with JWST, we visually inspect the images to identify a small sample of sources that are obvious candidates for dusty clusters and can serve as prototypes to guide our analysis. We look for bright compact sources in the NIRCam filter that also appear in at least one other PHANGS-JWST NIRCam image (, , or ), but are either faint or not visible by eye in the PHANGS-HST UV-optical images (A 10).We choose compact objects that are slightly more extended than point sources (i.e., FWHM 1.8 pixels 10 pc), following a process similar to that for optical star clusters in PHANGS-HST imaging (Lee et al., 2022; Thilker et al., 2021; Whitmore et al., 2021; Deger et al., 2022). We choose to start our inspection with the NIRCam image because it is the highest resolution image obtained by PHANGS-JWST that captures PAH emission and hot dust111We do not use continuum subtracted F335M images for visual inspection to avoid issues with residuals on the small spatial scales of interest here.. We identify an initial set of 12 prototypical clusters. The bottom panels of Fig. 1 show examples of these prototypes marked in yellow. Aperture photometry is performed to examine the properties of these objects and to develop selection criteria to select embedded cluster candidates, as discussed further in the next section.
3.2 Source detection and photometry
To obtain positions and photometry for our set of 12 prototype embedded clusters, as well as to search for embedded clusters in a more systematic way, we use routines in the Photutils (Bradley et al., 2022) Astropy package for photometry. First, we use the peak-finding algorithm find_peaks to detect sources in the F335M image. The level of the background varies significantly across the image. So, in order to estimate local background levels, we use the function SExtractorBackground to build a 2D model of the background. Then, we search for local maxima in square regions that are 11 px on a side.
To derive accurate source positions, we use the function centroid_quadratic, which determines the centroid by fitting 2D quadratic polynomials. We extract photometry from a circular aperture with radius of 0093 (3 NIRCam short-wavelength pixels) which encloses more than 50% of the energy for a point source (0073) in the F335W filter.
We subtract the background computed from an annulus between 0217 and 031 away from the source center. The units of the NIRCam imaing are MJy/steradian, so we multiply by the pixel area in steradians, given by the parameter PIXAR_SR in the header of the image, to obtain flux densities in MJy.
We then convert the measured flux densities into the AB magnitudes using the usual expression:
For this initial analysis, we forgo aperture corrections to the photometry to calculate total source fluxes. The measurement of accurate total fluxes for individual clusters across the PHANGS-JWST filter set will be subject of dedicated future work to address the challenges presented by the 10-fold decrease in resolution from 2-21m.
Nevertheless, our sample selection strategy which is primarily based on the F300M-F335M color (described in Sect. 3) should not be greatly affected since the resolution in these adjacent bands is quite similar, with a difference in the PSF FWHM of only 0011.
3.3 Selection criteria for embedded cluster candidates
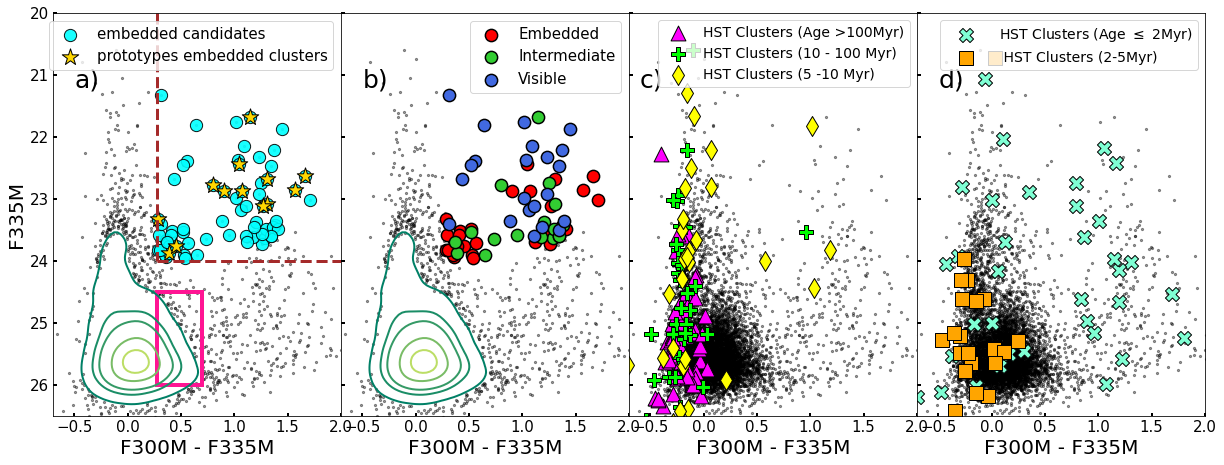
In Figure 2 we show color-magnitude diagrams (CMDs) based on and photometry; the former captures flux from PAH 3.3m feature, while the latter primarily probes stellar and dust continuum (Lee et al. 2022; Sandstrom et al 2022, Chastenet et al 2022, this Volume). Panel a in Figure 2 shows the 12 visually identified prototype embedded clusters (yellow stars) together with the sample of sources detected using Photutils find_peaks (black dots). This latter sample is comprised of a mixture of sources including stellar clusters of different ages, MS, RGB and AGB stars and also background galaxies.
These CMDs are analogous to those commonly used to select emission-line sources in extra-galactic narrow-band imaging surveys (e.g., Ly et al., 2011; Lee et al., 2012), and similar strategies can be adopted to identify and characterize sources with PAH emission. Sources that show a significant color excess (i.e., a continuum-subtracted F335M flux) are identified as PAH emitters. The locus of points around represents continuum sources with little-to-no PAH emission. These objects are typically associated with star clusters older than 10 Myr as shown in panel c of Fig. 2. Not surprisingly, this distribution becomes broader at fainter F335M magnitudes, due to increasing noise in the measurement (compare with Fig. 3 in Lee et al., 2012). Sources with PAH emission show significant color excess and are found to the right of the locus, and we find that all 12 prototypes are in this region.
Based on this clear separation in the CMD, we select a larger sample of bright PAH emitters for examination, i.e., , and . This selection provides a sample of 67 objects, shown with cyan symbols in panel a of Fig. 2. In this figure, the lines indicate the limits and . We note there are additional sources (beyond the 67 cyan candidates) that fall inside this box; however these sources are fainter than mag and not included in our sample.
We visually inspect each of these 67 cluster candidates, and divide them into 3 categories:
-
•
embedded: optical emission very faint or undetected, similar to the 12 prototype objects ()
-
•
intermediate/ambiguous: optical emission detected, but it is not clear whether the optical source is the counterpart to the F335M source due to positional differences, and lower resolution at 3m ()
-
•
visible/exposed: clear optical counterpart ()
Examples of objects in each category are shown in Figure 1. We will compare our new, dust embedded cluster sample with the optically selected PHANGS-HST catalog in the Discussion.
4 Results
Luminosity and mass functions for the youngest cluster populations in galaxies give direct constraints on the initial cluster mass function, analogous to the stellar initial stellar mass function. One of the major weaknesses in current studies of star formation is that the fraction of the most recently formed dust obscured clusters has been unknown and unaccounted for. These initial results provide a preview of the work with JWST which will measure these fundamental distributions.
4.1 Luminosity Function
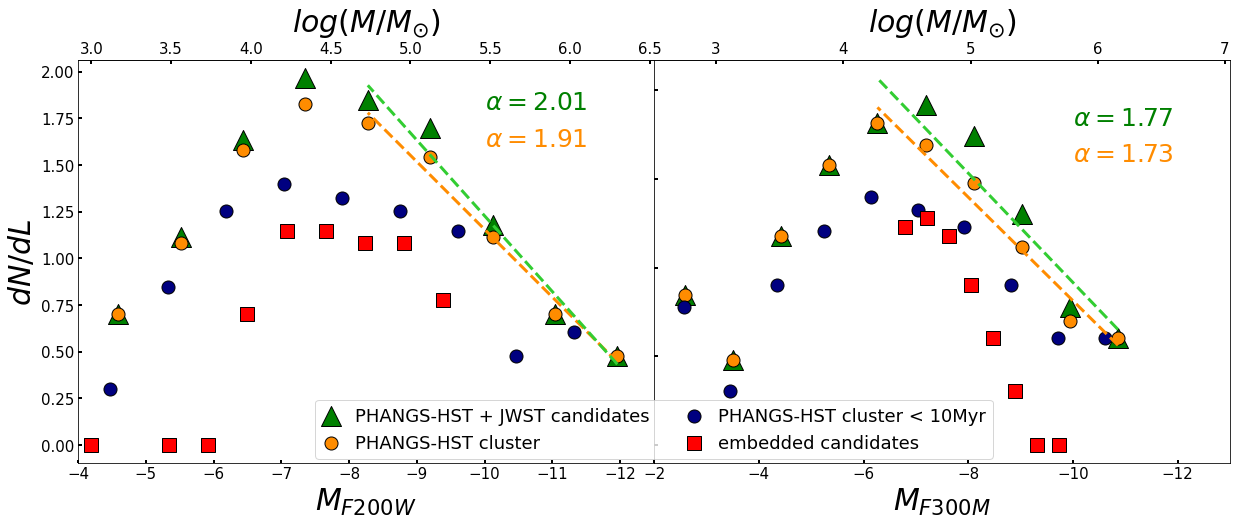
For clusters with similar ages and reddening, the luminosity function of clusters can serve as a proxy for their mass function. The luminosity function (LF) can be approximated, at least to first order, by a power law shape of the form (Whitmore et al., 1999; Fall, 2006; Whitmore et al., 2014a). Values of the power-law index are typical for young star clusters (e.g. Larsen, 2009; Whitmore et al., 2014a).
In Fig 3 we present the LFs of our embedded cluster candidates in the and bands, which sample flux from the stellar continuum, with some contribution from the dust continuum (red squares). These distributions increase starting from the brightest magnitudes (to the right), eventually flatten, and then drop off again (F200W filter). The flattening towards fainter magnitudes is almost certainly due to incompleteness.
For comparison we also show the LF of optically-selected clusters from the PHANGS-HST survey (Lee et al., 2022; Thilker et al., 2021; Turner et al., 2021; Deger et al., 2022), with no restriction on age (shown in orange) and clusters with best fit ages younger than 10 Myr (shown in blue). We also plot the LF of the combined cluster sample, i.e. PHANGS-HST clusters plus the 67 embedded candidates (shown with green triangles). The LF for the full HST+JWST cluster sample (green) has a best fit power-law index of in and for (shown as the green lines in each panel). The fit over only the PHANGS-HST clusters (orange) gives very similar index values, in and for (orange lines). On the other hand, while there are only few data points before our embedded cluster distribution (red points) flattens at magnitudes fainter than M-8, the bright points suggest a behavior similar to the optically-selected clusters. The LF in the F300M filter however, appears to be steeper than the PHANGS-HST clusters. This difference could be due to the imposed selection criteria that involve cuts using the F300M filter (Sect. 3.3).
Based on our preliminary results, we suspect that the LF for embedded star clusters present a similar shape to that for optical clusters. However our sample is not large enough to derive accurate power-law indices. In future work we will extend this work to the full sample of 19 PHANGS-JWST galaxies, which will be based on total fluxes computed with appropriate aperture corrections. A larger sample will better constrain the shape of the LF as well as the embedded cluster mass function, which again, is effectively the initial cluster mass function. Comparison with what we have already learned for visible clusters, will provide important insights into the survival of clusters in transition to becoming exposed/visible.
4.2 Estimate of Cluster Masses
To obtain initial stellar mass estimates for our 67 embedded cluster candidates, we fit a linear relation to obtain the mass-to-light ratio (e.g. Fall, 2006; Larsen, 2009) using clusters younger than 2 Myr in the PHANGS-HST catalog. In doing so, we obtain coefficients and , where: . We use apparent magnitudes in F200W and F300M bands, obtaining values of -2.35, 34.22, and -2.43, 35.46 respectively.
Using the relation for , we obtain a range of masses between 6.4 and , with approximately in the range – . In the case of masses obtained from , the values for our candidates start at due to our imposed condition in the selection criteria (, see Sect. 3.3). We find that of the sample is between this minimum value and , with a few candidates reaching up . The masses estimated from F200W and F300M are generally consistent to within a factor of a few, but clearly, from the vastly different values on the low end of the range, there are candidates (n10) with estimates which differ by up to a factor of 30. All of these candidates are embedded sources, which likely suffer from high extinction, even at 2m. In future work, we will provide more reliable mass estimates from spectral energy distribution (SED) fitting, as discussed further in the next section.
5 Discussion
We compare our sample of 67 dust embedded cluster candidates with the PHANGS-HST human inspected class cluster catalog (N=263), and find that our analysis of the PHANGS-JWST imaging has identified 59 new, embedded clusters candidates in NGC 7496. These objects are of particular importance because they are likely to be among the youngest clusters in this galaxy, and are needed to construct a complete census. In this context, it is notable that the size of our new sample is comparable to the number of young HST clusters (59 younger than 2 Myr; 94 younger than 5 Myr), and may double the census of the population younger than 2 Myr.
Of the 8 clusters in common between the two samples, we classify seven as visible/exposed, and 1 as partially embedded/intermediate. All are found to be younger than 11 Myr (six having ages less than 1 Myr), with masses of . (As mentioned earlier the full PHANGS-HST cluster sample, meanwhile, contains clusters as old as 13 Gyr.)
We can gain additional insight by examining the infrared properties of clusters of all ages from the optically-selected PHANGS-HST sample. Panels c) and d) in Fig. 2 show the location of clusters in different age intervals in the F300M-F335M color vs. F335M magnitude diagram. In panel c) we can see that clusters older than 100 Myr (magenta triangles) have , indicating these older sources do not have PAH emission. This panel also shows that nearly all clusters with ages between 10-100 Myr (green crosses) and 5-10 Myr (yellow diamonds) have . On the other hand, panel d) shows that all HST clusters with a color excess (i.e. strong PAH emission) have ages 2 Myr (cyan crosses). These very young, optically-selected clusters have a similar range of values as our 67 embedded candidates, although most of them have a significantly fainter F335M magnitude. Panel d) of Fig. 2 also shows clusters with estimated ages between 2 and 5 Myr (orange squares). While a small fraction of these 2-5 Myr cluster have slighly higher values than clusters older than 5 Myr, a surprising number of them show little-to-no PAH emission. Assuming that the age-dating from PHANGS-HST is correct for these clusters, this result indicates that measurable PAH emission may drop very rapidly (in 2 Myr) in clusters of moderate mass.
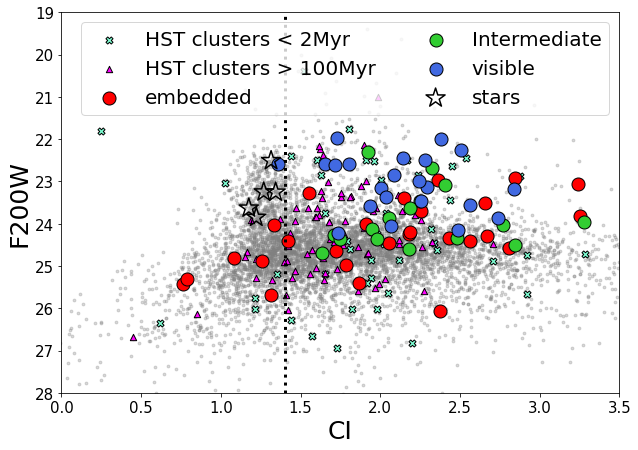
We also examine the Concentration Index (CI) of infrared and optically selected clusters. The CI provides a measure of the compactness of the source, and is useful to distinguish between clusters and stars (e.g. Chandar et al., 2010; Whitmore et al., 2014b; Deger et al., 2022). In particular, Whitmore et al. (2022, this volume) found that CI estimated from the JWST F200W filter significantly improves the separation of stars and clusters. CI values were estimated following the procedure in Whitmore et al. (2022, this volume), as the magnitude difference measured between 1 and 4 pixel apertures (0031 and 0124) in the F200W filter. In Fig 4 we present the results. The vertical dashed line indicates CI, a limit to separate clusters from stars (Whitmore et al. 2022, this volume). The 67 dust embedded clusters from this work are nearly all to the right of the line, meaning they are extended relative to a point source, although there are a few fainter objects which fall to the left of the line. The dispersion in the size measurements clearly increases towards fainter magnitudes.
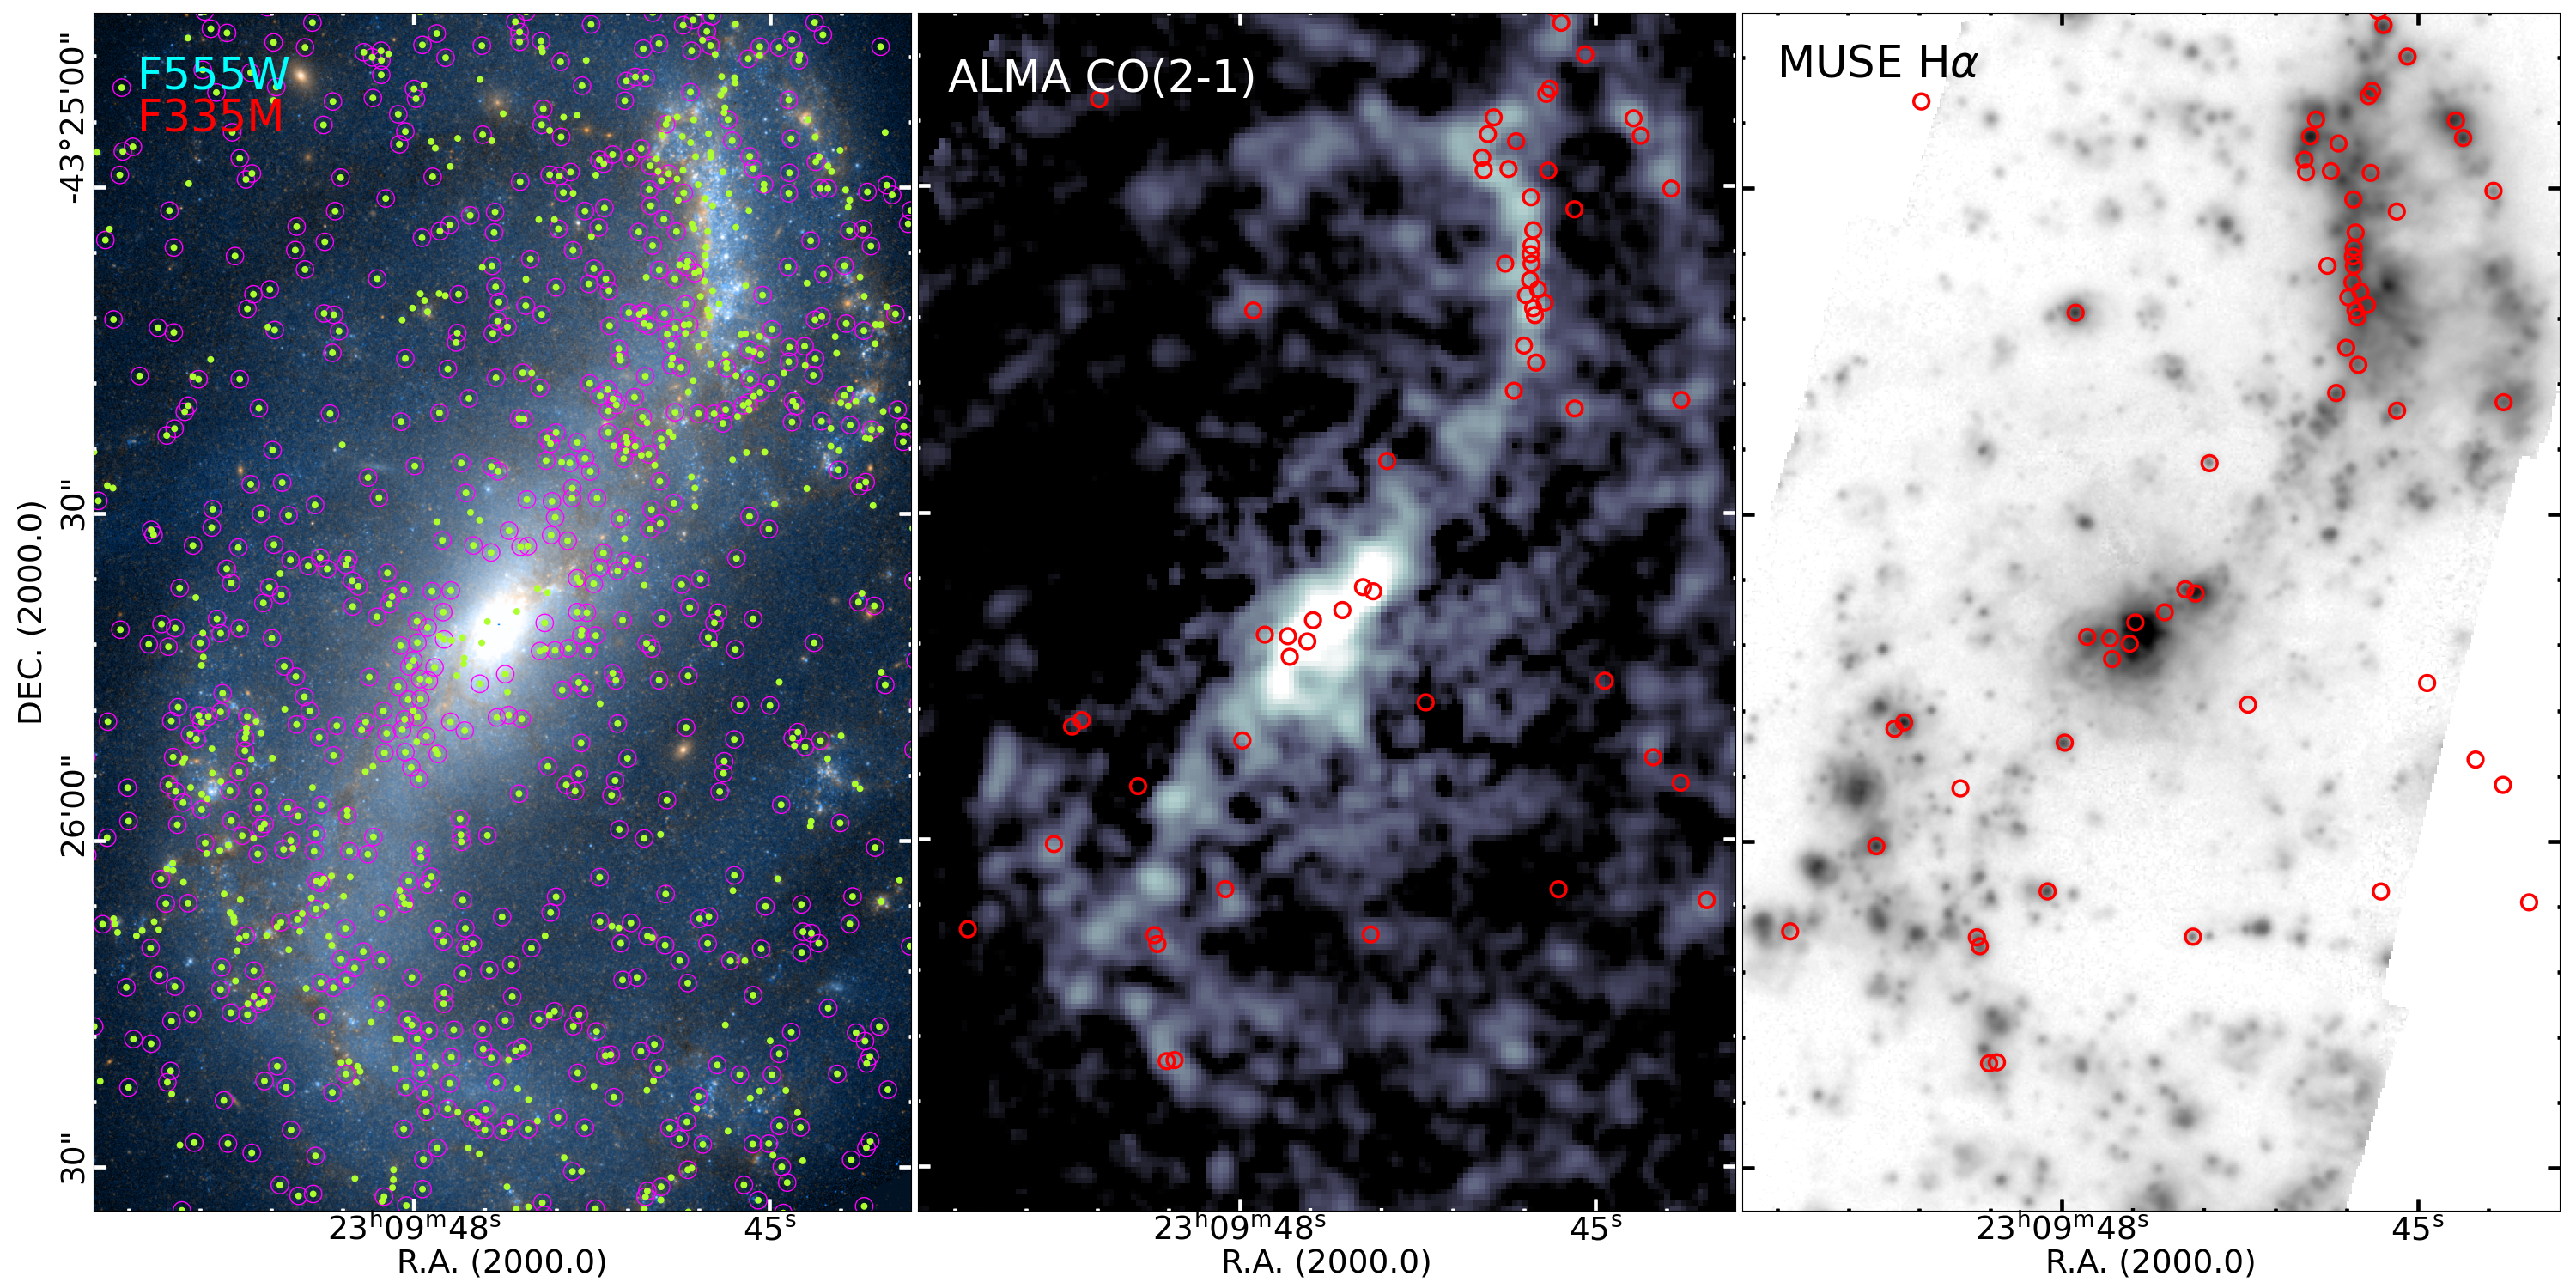
Next we examine the overall spatial distribution of the sample, as well as the location of our dust embedded cluster candidates relative to other structures and components of the ISM. In Fig. 1 we see a strong concentration of embedded clusters (shown in red) along a dust lane in the northern spiral arm, which forms a ridge just next to young (age 10 Myr) optically-selected clusters. Jumping to the left panel of Fig. 5, we see that strongest PAH emitters (shown as the green dots, without an accompanying magenta circle) are mostly located where we see the most prominent dust features in the optical HST images, along the spiral arms. Sources with 0.3, but with faint magnitudes (see magenta box in Fig. 2 a) are enclosed with a magenta circle. Recall that we decided to apply cuts in magnitude to study only the brightest sources ( and ) to simplify this initial analysis. However, by imposing these limits, weaker PAH emitters are excluded from inspection of the image, these appear to coincide with the more subtle dust lanes and potentially may also be dust embedded clusters. In future work we will test selection criteria which employ a color excess curve to identify fainter embedded clusters.
The middle and right panels of Fig. 5 show a CO(2-1) ALMA image taken as part of the PHANGS–ALMA survey (Leroy et al., 2021), and the H VLT-MUSE image of NGC 7496 from the PHANGS-MUSE survey (Emsellem et al., 2022). Our 67 PAH-emitting sources are closely associated with molecular gas and current star formation. Only 9% of our candidates appear unassociated with significant peaks of CO emission, Hα, or both. These 9% all have no obvious optical counterpart in the HST images, and half have CI values similar to stars, indicating they are very compact and possibly not embedded clusters.
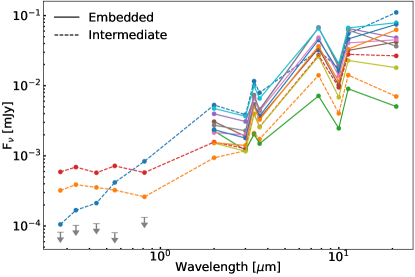
Finally, we examine the SEDs of the embedded clusters from optical wavelengths with HST to the IR with NIRCam and MIRI, which provide further insights into their properties. We show preliminary SEDs of the 12 embedded cluster prototypes in Fig. 6. These show a clear deficit in optical flux relative to the infrared. In fact, we were able to identify possibly associated faint optical emission for only three of these objects. For the 9 embedded clusters, without UV-optical detections, we show upper limits in the HST bands. For this first look, the photometric measurements in all bands have been performed with the same 0155 aperture, which leads to a relative underestimate of the measured fluxes in the MIRI-bands, as no aperture corrections have been applied as discussed before. To produce proper SEDs for these clusters in future work, we will need to correctly distinguish between crowded point sources and their corresponding diffuse PAH emission, with more careful source extraction which takes the different PSFs into account. These are some of the challenge that need to be addressed in order to perform proper SED fitting for embedded clusters and more accurately constrain their physical properties (e.g., stellar masses, dust masses, ages, reddenings). In addition to the distinctive PAH-feature at m, we see a dip at m indicating silicate absorption, which is caused by protostellar envelopes (Crapsi et al., 2008) and has been observed in young stellar objects (e.g. Großschedl et al., 2019). This spectral feature supports our conclusion that these candidates are very young embedded clusters.
6 Summary and Conclusions
In this work, we have used new NIRCam imaging of the nearby spiral galaxy NGC 7496, the first galaxy to be observed for the PHANGS-JWST Treasury survey, to identify very young clusters embedded in natal dust and gas. Our selection method relies on detection of PAH 3.3 m emission, which is closely associated with the ISM of very recently formed clusters.
We begin by identifying 12 prototype, dust-obscured clusters based on visual inspection of both PHANGS-JWST NIRCam and PHANGS-HST optical images. We find that all 12 show strong PAH emission at 3.3 m, and fall in a region of the F335M vs. color-magnitude diagram that clearly separates from the vast majority of detections. To first order the PAH emission at m appears to correlate with other dust emission (Sandstrom et al., Dale et al., Chastenet et al., 2022 this volume) and so should represent a sensitive, high resolution tracer of dust-reprocessed UV light from young stars. Based on this, we develop criteria to select a larger sample of candidates. This selection is primarily based on the F330M-F335M color excess, and yields a sample of 67 candidate embedded clusters in NGC 7496. By comparing the F300M-F335M colors of this sample to optically-selected clusters in the PHANGS-HST catalog, which have ages determined through SED fitting of 5-band UV-optical photometry, we estimate that the embedded clusters are likely to be younger than 2 Myr.
We find that our new sample may significantly increase the census of young clusters from the PHANGS-HST catalog – the number of clusters younger than 2 Myr could be increased by a factor of two. A more careful analysis of the selection functions and completeness of both the HST and JWST cluster samples will be required to provide an accurate assessment of the fraction of young clusters which are embedded and are missing from optical catalogs. The eight clusters in common between the two catalogs have very young SED ages (six are Myr). These results underscore the importance of our new PHANGS-JWST imaging for studying the earliest stages of star and cluster formation.
Preliminary optical/infrared SEDs for the visually selected prototype candidates show PAH emission and possible silicate absorption. Concentration index measurements confirm that the majority of our 67 sources are more extended than stars/point sources. These characteristics provide additional evidence that most of our selected candidates are star clusters. We also take a first look at the 2 and 3 m luminosity functions for our sample, and estimate stellar masses, finding values of – .
The strongest and brightest PAH emitters are mainly located in prominent dust lanes within the main spiral arms of the galaxy, next to young optically-detected clusters from PHANGS-HST. The spatial distribution of our candidates show that they are also correlated with Hα and CO(2-1) emission.
In future work we will expand this analysis to all 19 galaxies in the PHANGS-JWST sample, and examine the completeness of samples based on the F300M-F335M color excess for selecting young embedded star clusters. Significant effort will be required to develop techniques to obtain robust total fluxes across the 13 PHANGS-HST and JWST filters from 2750Å to 2m due to the factor of 10 decrease in resolution. Such techniques are needed to produce SEDs appropriate for constraining the physical properties of these clusters through the fitting of stellar population and dust models. Ultimately, a complete census of star clusters from PHANGS-HST and JWST will enable basic unsolved problems in star formation and cluster evolution to be addressed through new constraints on the initial cluster mass function, star cluster formation efficiencies, as well as on feedback timescales associated with the clearing of the natal gas and dust.
acknowledgments
This work is based on observations made with the NASA/ESA/CSA JWST and NASA/ESA Hubble Space Telescopes. The data were obtained from the Mikulski Archive for Space Telescopes at the Space Telescope Science Institute, which is operated by the Association of Universities for Research in Astronomy, Inc., under NASA contract NAS 5-03127 for JWST and NASA contract NAS 5-26555 for HST. The JWST observations are associated with program 2107, and those from HST with program 15454. The specific JWST observations analyzed can be accessed via http://dx.doi.org/10.17909/9bdf-jn24 (catalog 10.17909/9bdf-jn24). We have also used higher level data products developed and released by PHANGS-HST http://dx.doi.org/10.17909/t9-r08f-dq31 (catalog 10.17909/t9-r08f-dq31) (image products) http://dx.doi.org/10.17909/jray-9798 (catalog 10.17909/jray-9798) (catalog products). We are grateful to Scott Fleming at STScI and his team for their excellent support in helping us provide these products to the community through https://archive.stsci.edu/hlsp/phangs-hst and https://archive.stsci.edu/hlsp/phangs-cat. Based on observations collected at the European Southern Observatory under ESO programmes 1100.B-0651 (PHANGS-MUSE; PI: Schinnerer). This paper makes use of the following ALMA data: ADS/JAO.ALMA#2017.1.00886.L, ALMA is a partnership of ESO (representing its member states), NSF (USA) and NINS (Japan), together with NRC (Canada), MOST and ASIAA (Taiwan), and KASI (Republic of Korea), in cooperation with the Republic of Chile. The Joint ALMA Observatory is operated by ESO, AUI/NRAO and NAOJ. JMDK gratefully acknowledges funding from the European Research Council (ERC) under the European Union’s Horizon 2020 research and innovation programme via the ERC Starting Grant MUSTANG (grant agreement number 714907). COOL Research DAO is a Decentralized Autonomous Organization supporting research in astrophysics aimed at uncovering our cosmic origins. EJW acknowledges the funding provided by the Deutsche Forschungsgemeinschaft (DFG, German Research Foundation) – Project-ID 138713538 – SFB 881 (“The Milky Way System”, subproject P1). MB acknowledges support from FONDECYT regular grant 1211000 and by the ANID BASAL project FB210003. TGW acknowledges funding from the European Research Council (ERC) under the European Union’s Horizon 2020 research and innovation programme (grant agreement No. 694343). JK gratefully acknowledges funding from the Deutsche Forschungsgemeinschaft (DFG, German Research Foundation) through the DFG Sachbeihilfe (grant number KR4801/2-1). MC gratefully acknowledges funding from the DFG through an Emmy Noether Research Group (grant number CH2137/1-1). FB would like to acknowledge funding from the European Research Council (ERC) under the European Union’s Horizon 2020 research and innovation programme (grant agreement No.726384/Empire). RSK acknowledges financial support from the European Research Council via the ERC Synergy Grant “ECOGAL” (project ID 855130), from the Deutsche Forschungsgemeinschaft (DFG) via the Collaborative Research Center “The Milky Way System” (SFB 881 – funding ID 138713538 – subprojects A1, B1, B2 and B8) and from the Heidelberg Cluster of Excellence (EXC 2181 - 390900948) “STRUCTURES”, funded by the German Excellence Strategy. RSK also thanks the German Ministry for Economic Affairs and Climate Action for funding in the project “MAINN” (funding ID 50OO2206). ER acknowledges the support of the Natural Sciences and Engineering Research Council of Canada (NSERC), funding reference number RGPIN-2022-03499. KG is supported by the Australian Research Council through the Discovery Early Career Researcher Award (DECRA) Fellowship DE220100766 funded by the Australian Government. KG is supported by the Australian Research Council Centre of Excellence for All Sky Astrophysics in 3 Dimensions (ASTRO 3D), through project number CE170100013. SD is supported by funding from the European Research Council (ERC) under the European Union’s Horizon 2020 research and innovation programme (grant agreement no. 101018897 CosmicExplorer). KK gratefully acknowledges funding from the Deutsche Forschungsgemeinschaft (DFG, German Research Foundation) in the form of an Emmy Noether Research Group (grant number KR4598/2-1, PI Kreckel). HH acknowledges the support of the Natural Sciences and Engineering Research Council of Canada (NSERC), funding reference number RGPIN-2022-03499.
JPe acknowledges support by the DAOISM grant ANR-21-CE31-0010 and by the Programme National “Physique et Chimie du Milieu Interstellaire” (PCMI) of CNRS/INSU with INC/INP, co-funded by CEA and CNES. G.A.B. acknowledges the support from ANID Basal project FB210003.
References
- Anand et al. (2021) Anand, G. S., Lee, J. C., Van Dyk, S. D., et al. 2021, MNRAS, 501, 3621, doi: 10.1093/mnras/staa3668
- Astropy Collaboration et al. (2013) Astropy Collaboration, Robitaille, T. P., Tollerud, E. J., et al. 2013, A&A, 558, A33, doi: 10.1051/0004-6361/201322068
- Astropy Collaboration et al. (2018) Astropy Collaboration, Price-Whelan, A. M., Sipőcz, B. M., et al. 2018, AJ, 156, 123, doi: 10.3847/1538-3881/aabc4f
- Astropy Collaboration et al. (2022) Astropy Collaboration, Price-Whelan, A. M., Lim, P. L., et al. 2022, apj, 935, 167, doi: 10.3847/1538-4357/ac7c74
- Bradley et al. (2022) Bradley, L., Sipőcz, B., Robitaille, T., et al. 2022, astropy/photutils: 1.5.0, 1.5.0, Zenodo, doi: 10.5281/zenodo.6825092
- Chandar et al. (2010) Chandar, R., Whitmore, B. C., Kim, H., et al. 2010, ApJ, 719, 966, doi: 10.1088/0004-637X/719/1/966
- Corbelli et al. (2017) Corbelli, E., Braine, J., Bandiera, R., et al. 2017, A&A, 601, A146, doi: 10.1051/0004-6361/201630034
- Crapsi et al. (2008) Crapsi, A., van Dishoeck, E. F., Hogerheijde, M. R., Pontoppidan, K. M., & Dullemond, C. P. 2008, A&A, 486, 245, doi: 10.1051/0004-6361:20078589
- Deger et al. (2022) Deger, S., Lee, J. C., Whitmore, B. C., et al. 2022, MNRAS, 510, 32, doi: 10.1093/mnras/stab3213
- Elmegreen (2008) Elmegreen, B. G. 2008, ApJ, 672, 1006, doi: 10.1086/523791
- Emsellem et al. (2022) Emsellem, E., Schinnerer, E., Santoro, F., et al. 2022, A&A, 659, A191, doi: 10.1051/0004-6361/202141727
- Fall (2006) Fall, S. M. 2006, ApJ, 652, 1129, doi: 10.1086/508404
- Grasha et al. (2018) Grasha, K., Calzetti, D., Bittle, L., et al. 2018, MNRAS, 481, 1016, doi: 10.1093/mnras/sty2154
- Grasha et al. (2019) Grasha, K., Calzetti, D., Adamo, A., et al. 2019, MNRAS, 483, 4707, doi: 10.1093/mnras/sty3424
- Großschedl et al. (2019) Großschedl, J. E., Alves, J., Teixeira, P. S., et al. 2019, A&A, 622, A149, doi: 10.1051/0004-6361/201832577
- Johnson et al. (2003) Johnson, K. E., Indebetouw, R., & Pisano, D. J. 2003, AJ, 126, 101, doi: 10.1086/375459
- Kim et al. (2021) Kim, J., Chevance, M., Kruijssen, J. M. D., et al. 2021, MNRAS, 504, 487, doi: 10.1093/mnras/stab878
- Kourkchi et al. (2020) Kourkchi, E., Courtois, H. M., Graziani, R., et al. 2020, AJ, 159, 67, doi: 10.3847/1538-3881/ab620e
- Kruijssen (2012) Kruijssen, J. M. D. 2012, MNRAS, 426, 3008, doi: 10.1111/j.1365-2966.2012.21923.x
- Lada & Lada (2003) Lada, C. J., & Lada, E. A. 2003, ARA&A, 41, 57, doi: 10.1146/annurev.astro.41.011802.094844
- Larsen (2009) Larsen, S. S. 2009, A&A, 494, 539, doi: 10.1051/0004-6361:200811212
- Lee et al. (2012) Lee, J. C., Ly, C., Spitler, L., et al. 2012, PASP, 124, 782, doi: 10.1086/666528
- Lee et al. (2022) Lee, J. C., Whitmore, B. C., Thilker, D. A., et al. 2022, ApJS, 258, 10, doi: 10.3847/1538-4365/ac1fe5
- Leroy et al. (2018) Leroy, A. K., Bolatto, A. D., Ostriker, E. C., et al. 2018, ApJ, 869, 126, doi: 10.3847/1538-4357/aaecd1
- Leroy et al. (2021) Leroy, A. K., Schinnerer, E., Hughes, A., et al. 2021, ApJS, 257, 43, doi: 10.3847/1538-4365/ac17f3
- Ly et al. (2011) Ly, C., Lee, J. C., Dale, D. A., et al. 2011, ApJ, 726, 109, doi: 10.1088/0004-637X/726/2/109
- Messa et al. (2021) Messa, M., Calzetti, D., Adamo, A., et al. 2021, ApJ, 909, 121, doi: 10.3847/1538-4357/abe0b5
- Shaya et al. (2017) Shaya, E. J., Tully, R. B., Hoffman, Y., & Pomarède, D. 2017, ApJ, 850, 207, doi: 10.3847/1538-4357/aa9525
- Thilker et al. (2021) Thilker, D. A., Whitmore, B. C., Lee, J. C., et al. 2021, arXiv e-prints, arXiv:2106.13366. https://arxiv.org/abs/2106.13366
- Turner et al. (2021) Turner, J. A., Dale, D. A., Lee, J. C., et al. 2021, arXiv e-prints, arXiv:2101.02134. https://arxiv.org/abs/2101.02134
- Whitmore et al. (2014a) Whitmore, B. C., Chandar, R., Bowers, A. S., et al. 2014a, AJ, 147, 78, doi: 10.1088/0004-6256/147/4/78
- Whitmore et al. (1999) Whitmore, B. C., Zhang, Q., Leitherer, C., et al. 1999, AJ, 118, 1551, doi: 10.1086/301041
- Whitmore et al. (2014b) Whitmore, B. C., Brogan, C., Chandar, R., et al. 2014b, ApJ, 795, 156, doi: 10.1088/0004-637X/795/2/156
- Whitmore et al. (2021) Whitmore, B. C., Lee, J. C., Chandar, R., et al. 2021, MNRAS, 506, 5294, doi: 10.1093/mnras/stab2087