Dust-free starburst galaxies at redshifts
Abstract
One of the most distant galaxies GN-z11 was formed when the Universe was 400 Myr old, and it displays a burst-like star formation rate yr-1 with a metallicity . It resembles galaxies (at “cosmic noon") except for the fact that the measured reddening indicates the presence of little or no dust. This marked absence of dust hints towards violent dynamical events that destroy or evacuate dust along with gas out of the galaxy on a relatively short time scale and make it transparent. We apply a 3D numerical model to infer possible physical characteristics of these events. We demonstrate that the energetics of the observed star formation rate is sufficient to tear apart the dusty veil on time scales of Myr. This can explain the apparent lack of evolution of UV luminosity function of galaxies between and and , by compensating for the lower galaxy masses at higher redshift by the absence of dust. We show, however, that this is a temporary phenomenon and soon after the last of the supernovae explosions have taken place, the expanding shell shrinks and obscures the galaxy on time scales of Myr.
keywords:
galaxies: high-redshift, formation, evolution, ISM1 Introduction
Only one spectroscopically confirmed very high-redshift () galaxy is known to date, dubbed GN-z11, at redshift , when the age of the Universe was Myr. GN-z11 has been identified as a bright ( mag), massive (stellar mass ) Lyman break galaxy in observations with the Hubble Space Telscope/WFC3/IR and Spitzer/IRAC instrument (Oesch et al. , 2016). Near-infrared observations of [CIII]1907, CIII]1909 doublet and OIII]1666 lines with Keck I telescope allowed the measurement of the redshift more precisely as (Jiang et al. , 2020). Furthermore, Harikane et al. (2022a) reported the photometric identification of two even brighter ( mag) galaxy candidates at . Very recently, the James Webb Space Telescope (JWST) has found two more bright and massive galaxies with mag and : GL-z13 (photometric ) and GL-z11 () with its CEERS and GLASS programes (Castellano et al. , 2022; Naidu et al. , 2022). These recently discovered bright galaxies challenge the conventional scenario of UV luminosity functions (Naidu et al. , 2022), since the total number of the currently known bright galaxies would require 10 times larger area for being detected within the standard paradigm of structure formation. Overall, the early JWST results and the ALMA REBELS galaxy survey suggest an unexpected abundance of galaxies. The properties of these high-z galaxies have been discussed in (Harikane et al. , 2022a; Naidu et al. , 2022), although more data are needed to firmly conclude about their nature.
The case of GN-z11 is intriguing becasue its large stellar mass and metallicity () are at odds with the observed absence of dust attenuation, mag (Oesch et al. , 2016). Although relatively high metal content (), has also been found in a galaxy (Inoue et al. , 2016), it is reasonable to think that GN-z11 is not an exception, but a common phenomenon among the first galaxies. Moreover, inspired by recent finding of exceptionally bright galaxies in the universe, Ferrara et al. (2022) have considered the evolution of the UV luminosity function (LF) from to and hypothesized that galaxies have negligible amount of dust (see also Mason et al. , 2022). Fiore et al. (2022) have invoked radiatively driven wind (through dust grains) in this context. Arata et al. (2019) had also deduced that stellar feedback could make high- galaxies intermittently UV-transparent, although the SFR in their simulated galaxies had a much smaller value than found in GN-z11.
In this paper we discuss supernovae driven wind that can explain the puzzle, and also include the effect of dust destruction behind shock waves. In addition we discuss a rather surprising aftermath of such a wind, to the effect that a dust-free condition may prevail for a limited duration of time. This paper is organized as follows. Section 2 briefly describes the proposed scenario. In Section 3 we describe the model set-up for the simulation, and present our results in 4, followed by a discussion on the implications.
2 The scenario
2.1 Estimates: mass budget and optical depth
All recently found galaxies are recognized to be star-forming or a short-term starburst Lyman break galaxies (LBG) (Oesch et al. , 2016; Harikane et al. , 2022a; Naidu et al. , 2022). Using the Kennicutt-Schmidt (Kennicutt & Evans, 2012) law for the local universe (, and being measured in and , correspondingly.) the observed star formation rate (SFR) of 25 M⊙ yr-1 within the half-light radius kpc implies a total gas mass .
A SFR of yr-1 with a Salpeter initial mass function (IMF) produces supernovae (SNe) explosions at a rate yr-1 (with being the specific SNe rate for a Salpeter IMF), each injecting a fraction of the pre-SN mass in metals, and a considerable fraction () of them in form of dust (Todini & Ferrara, 2001; Bianchi & Schneider, 2007; Matsuura et al. , 2011; Gall et al. , 2014; Lau et al. , 2015). Direct measurement of dust in galaxies lead Lésniewska & Michałowski (2019) to an estimate of the ejected dust mass, as per SN. Observations of cold dust in Cas A allowed Krause et al. (2004) to set an upper limit . A more conservative estimate, follows from simulations by Todini & Ferrara (2001). Here, we use a conservative value of .
With these assumptions, the total estimated mass of metals and dust injected into the ISM within 40 Myr by SNe is , and , respectively. The dust-to-gas mass ratio is, therefore, , nearly % of the Milky Way value. Assuming the dust to be Milky Way-type, the expected optical depth at UV ( Å) , where cm2 (Draine & Lee, 1984; Corrales et al. , 2016), and , . This estimate strongly conflicts with the observational transperancy of the ISM in GN-z11: (Jiang et al. , 2020).
Possible explanations can be sought either from the suppression of dust yield by reverse shocks from SNe, or with destruction of dust by SNe triggered shocks, and/or with evacuation of dust by gas outflows driven by stellar activity, or a combination of all these.
2.2 Reducing dust attenuation
In the circumstance under consideration here, dust grains are mostly destroyed by thermal sputtering111We do not account nonthermal sputtering due to betatron acceleration and kinetic sputtering of dust particles moving in ambient gas supersonically. This corresponds to a lower estimate of dust destruction.. Destruction of dust in similar conditions has been taken into account previously by Arata et al. (2019), by scaling the dust-to-gas ratio in proportion to the fraction of HI in the hot gas. Here, we use a different approach, and implement dust destruction depending on the dust radius by comparing the sputtering time with the dynamical time of the cell. More explicitly, we do not remove all dust particles entering into the volume occupied by hot gas, but only when the sputtering time is shorter than the dynamical time. The characteristic sputtering time and the gas cooling time at temperatures close to K: yr at K, and yr for K (Draine & Salpeter, 1979; Draine, 2011), yr (Vasiliev, 2013), m, K. Therefore, dust particles with radii Å can partially survive at temperatures within the hot bubble formed by a starburst with SNe shock velocities of km s-1. We assume, in the unperturbed medium, a given initial dust-size spectrum , and then we compare in each computational cell behind the shock front the characteristic dust thermal sputtering time and the dynamical time . When , dust particles of a given size are removed from the distribution function within the cell.
Dust can also be destroyed in situ during the process of delivery by an expanding SN ejecta because of the reverse shock (Bianchi & Schneider, 2007; Nozawa et al. , 2007), considerbaly reducing the fraction of small size dust particles (m, see Nozawa et al. , 2007, lower panel in their Fig. 6). In the present case this effect can be important only at very initial stages of star formation in the central stellar clusters, when the remnants from individual SNe expand into unperturbed surrouding gas in a cluster. After the merging of remnants from the very first 1000 SNe, they form a joint superbubble with a hot low-density gas inside (see in Sec. 4). In these conditions reverse shocks do not form and dust particles can survive in situ destruction. In order to examine how the shape of the unperturbed dust-size spectrum affects the results, we consider the two models: one with the “standard” MRN spectrum (Mathis et al. , 1977), and the other with a “flat” spectrum in the form similar to that used by Maiolino et al. (2004) and confirmed numerically by Nozawa et al. (2007) for conditions in early galaxies.
Since the optical depth scales as for a given dust mass kept, it can drop to the detection level if the dust cloud expands up to kpc. Attributing such an expansion to SNe explosions, with a rate of yr-1, corresponding to mechanical luminosity erg s-1, the bubble size evolution is given by, where is the density of ambient ISM gas. For g cm-3, and , a radiative correction factor, the time taken for the shell to reach kpc, is which is shorter than the star formation time scale of GN-z11.
In order to confirm these estimates we simulate SNe driven outflow assuming the following model for a galaxy before explosion.
3 Model setup
We carry out 3-D hydrodynamic simulations (Cartesian geometry) of multiple SNe explosions in the central part of a galaxy. The code is based on the unsplit total variation diminishing (TVD) approach that provides high-resolution capturing of shocks and prevents unphysical oscillations. We have implemented the Monotonic Upstream-Centered Scheme for Conservation Laws (MUSCL)-Hancock scheme and the Haarten-Lax-van Leer-Contact (HLLC) method (see e.g. Toro, 1999) as an approximate Riemann solver. This code has successfully passed the whole set of tests proposed in Klingenberg et al. (2007). It is difficult to pin down the exact geometry, size and profiles of gaseous and the stellar content of galaxy at such a high redshift. At the same time, one has to fix these in the initial set up in order to simulate. Our idea in the following exercise is to have a simple yet robust set up so that does not mitigate the essential physics. One important problem one faces in this regard is that of gas overcooling in the central region, if one assumes gas to be distributed spherically. We avoid this by using a disc geometry as recently found in galaxies (Adams et al. , 2022), although the physical processes we attempt to demonstrate here robust enough, as the above estimates show, and do not crucially depend on these particular assumptions. We consider gas in the central region to be initially in the hydrostatic equilibrium in the gravitational potential of a dark matter halo, and a stellar disc.
The dark matter halo is assumed to follow the Navarro-Frenk-White (NFW) profile, with virial radius kpc with a concentration parameter , corresponding to a total galactic mass of at . We use a softening length of kpc for the NFW potential. The total amount of gas within the virial radius is assumed to be a cosmic fraction () of the total mass. The disc potential is provided by a total mass of , which can be thought of as comprising gas and stars, recalling that the observed stellar mass is . We use the Miyamoto-Nagai disc potential with scalelength kpc and scaleheight kpc (Miyamoto et al. , 1975). We are interested in the vertical (relative to a disc) motions of a gas, because this direction is favourable for observing a naked stellar population (i.e. low extinction similar to that measured in the observations). We therefore consider a vertically stratified medium, with a mid-plane density of cm-3 and a scale height of pc.
In order to simulate the effects of energy, metal and dust injection by SNe as specified in Sec. 2.1, we set up a stellar population within star clusters randomly spread in an ellipsoidal region with major and minor axes of and kpc. The masses of star clusters range randomly between according to a power-law distribution: (Krumholz et al. , 2019). Each cluster includes massive stars, which are progenitors of SNe, with masses ranging between . We also assume a burst-like star formation model for all the stellar clusters inside the ellipsoid, with the SNe spread randomly inside the corresponding cluster. The lifetime of massive stars relates stellar mass as (Iben, 2012). The (longest) lifetime of stars is Myr. We begin our run when the most massive SN explodes.
To reduce the computation time, we assume that 200 SNe with equal mass of their progenitors explode simultaneously as a single SN, and accordingly each of such explosions inject jointly times the energy, mass and metals of a single explosion. The energy of such explosion is erg, which is injected in form of thermal energy. The injected masses of gas and metals are also increased by a factor , i.e. the mass load for a joint explosion is ( on average over the IMF) correspondingly. The total number of such explosions occurring during Myr is . Therefore, the total ejected energy is erg, which, over Myr of SNe explosions (see above), corresponds to a power of erg s-1, as required. The corresponding mass ejection is .
Radiative cooling is implemented in the simulations with a tabulated non-equilibrium cooling function calculated as described in details in (Vasiliev, 2013), and splined accordingly for and at different time steps . The functions are obtained for isochoric cooling from K down to 10 K for 68 discret values of metallicity within the range [Z/H]. The simulations are performed with a physical cell size of 10 pc. This size is sufficient to resolve the evolution of a single super-SN with energy erg, as mentioned above 222The cooling time is s, so that for the typical shock velocity km/s the SN shell at the beginning of radiative phase is greater than the cell size. Note that after Myr from initiating the starburst in the galaxy, the majority of shells formed around stellar clusters begin to interact with each other and merge into a combined bubble.
4 Results
The disturbance in the ISM due to combined SNe proceeds to engulf the galaxy; the ‘breakthrough’ from the disk in the vertical direction happens at Myr, and the whole gaseous disk is enveloped in Myr. Thereafter the shock wave proceeds through the circumgalactic medium with a roughly spherical shape. The average temperature within the shock wave is K, although radiative cooling leads to cloud formation with dense patches embedded in hot and tenuous medium.
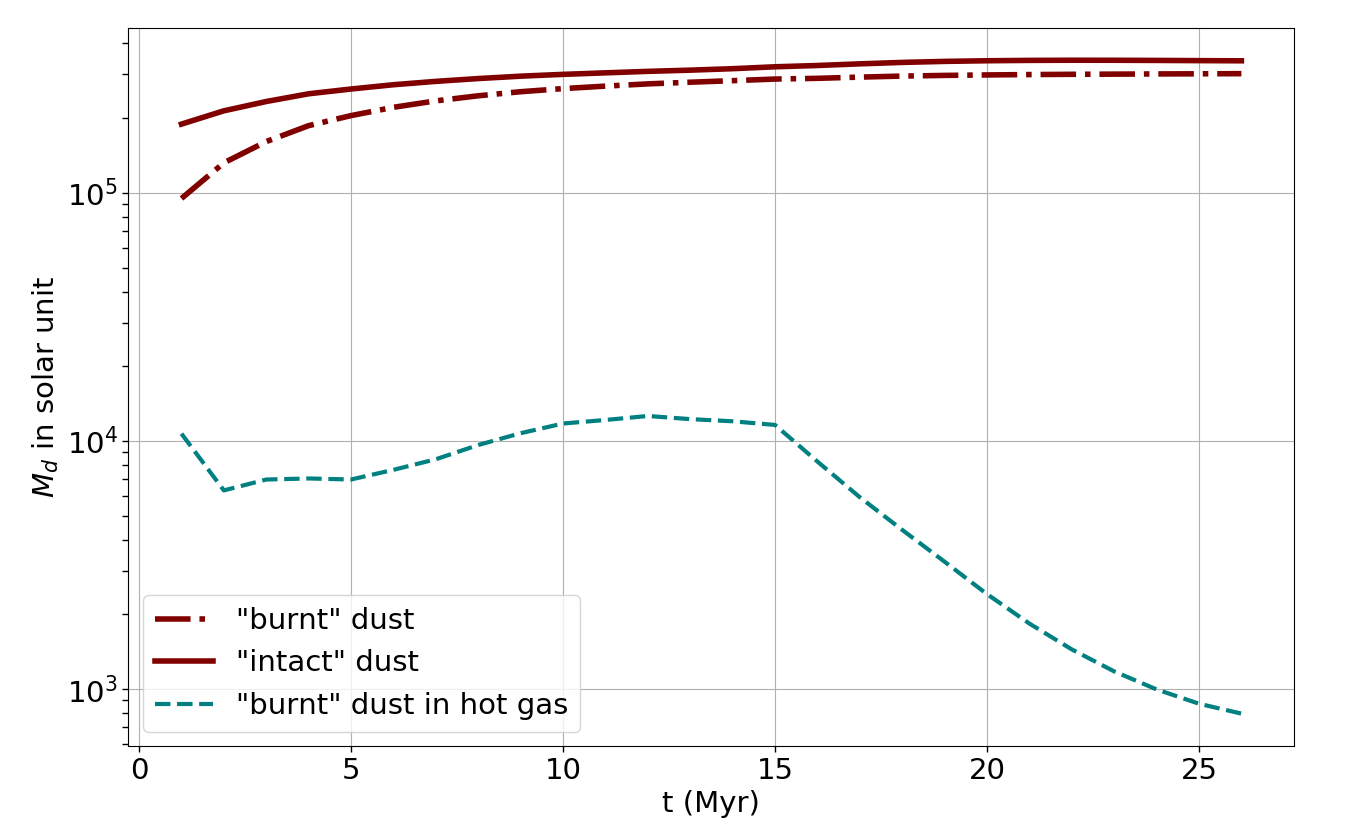
As mentioned above, SNe explosions enrich the galaxy ISM during the evolution until the least massive progenitors exhaust. In total, around of metals and (for the fraction of metals in solid phase ) of dust are supplied into the superbubble as shown in Figure 1, where the total mass of dust (solid lines) and the mass of dust experienced sputtering (dash-dotted line), along with the dust locked in the hot ( K) superbubble interior indicated by dashed line are shown. It is seen that although the mass fraction of dust within the hot region during the first Myr can be as high as , it drops below afterwards, while the rest accumulates in the cold clumps.
Since the gas density in the hot interior drops below cm-3 by Myr, the dust sputtering time is increased ( Myr). Also, most of the dust is pushed into the conducive environment of the dense and cooler shell where it can survive. In other words, dust destruction is important only in the initial period of bubble growth ( Myr) when the shock is confined within a few scale heights.
4.1 Extinction of the outflow
4.1.1 Fog clearing
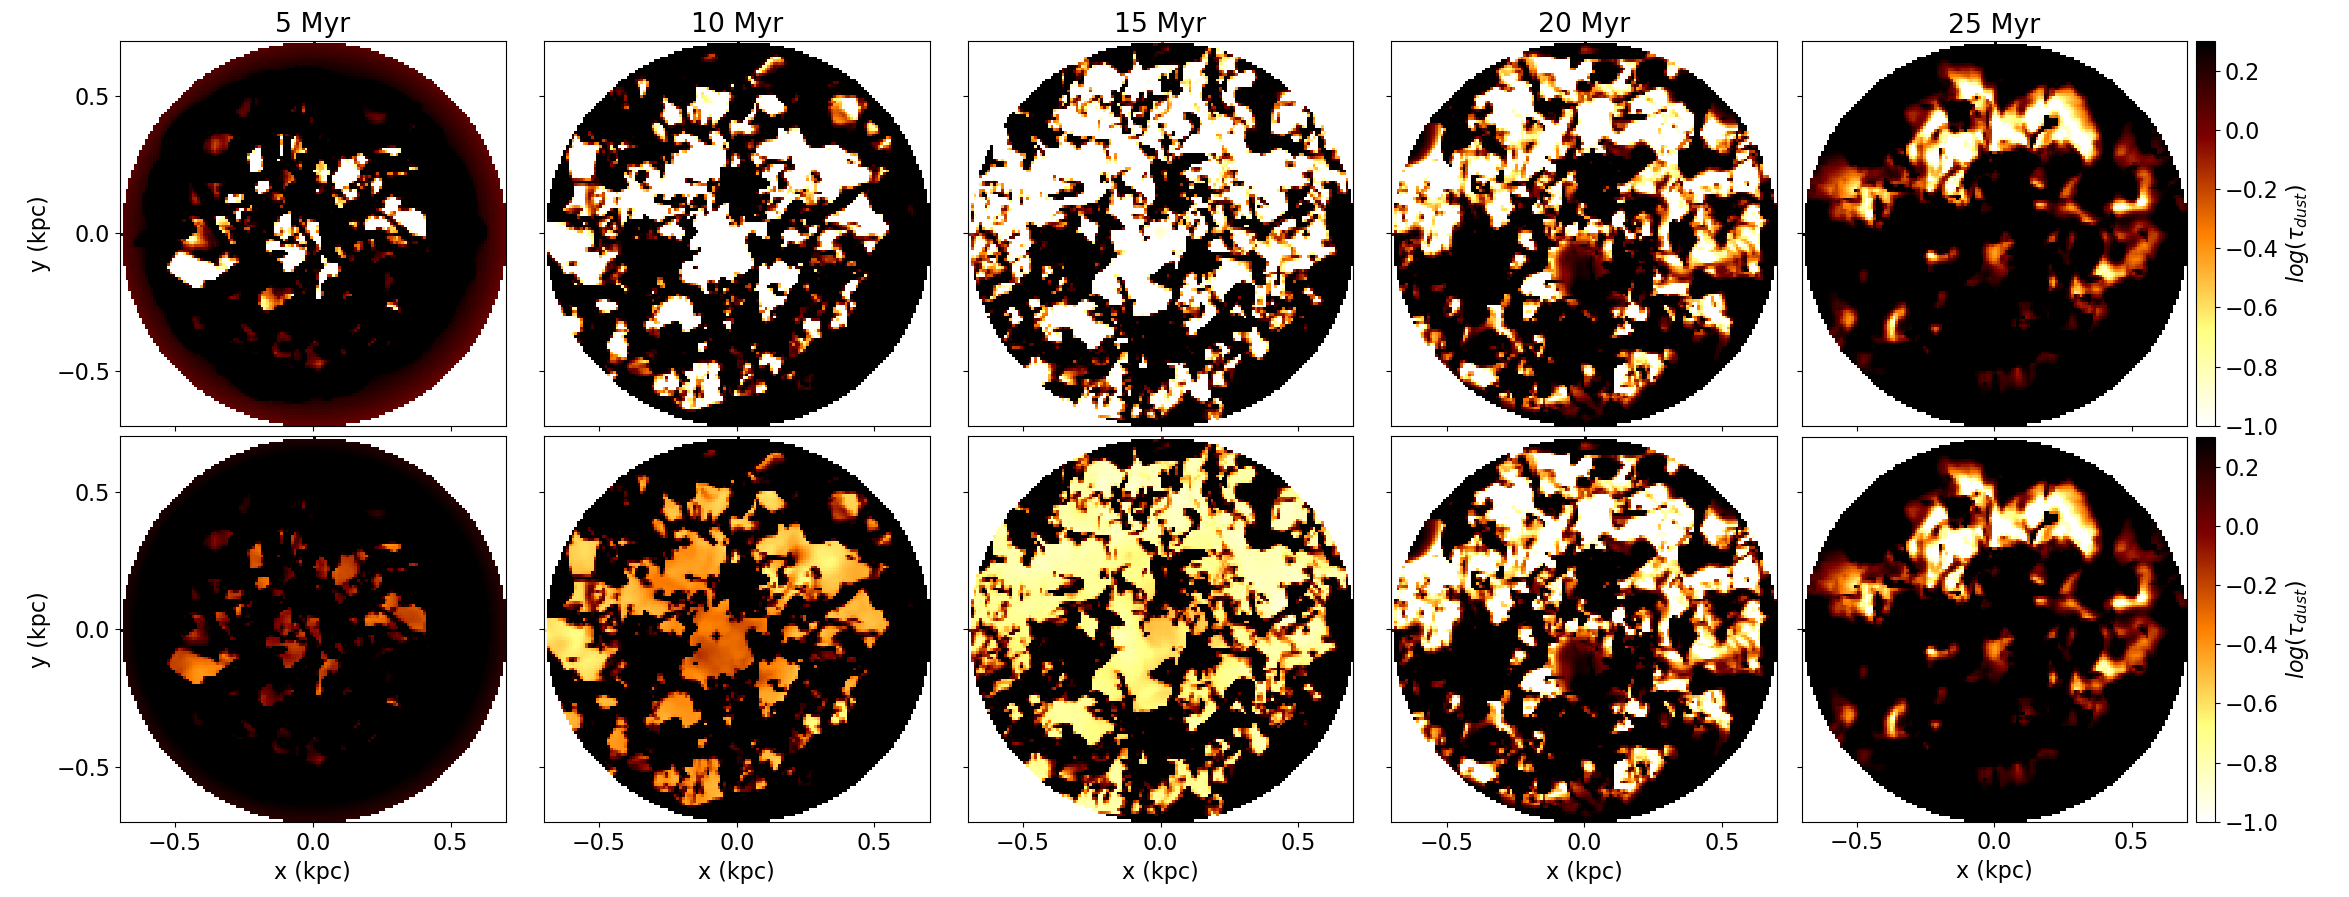
Figure 2 shows simulated maps of optical depth at different epochs, as seen face-on towards the hemisphere facing the observer (hereafter referred to as ‘front-side hemisphere’) of the growing bubble, with (upper row) and without (lower row) sputtering effects. Mapping of optical depth of one hemisphere seems to be sufficient to demonstrate whether or not the radiation from stars, located mostly in the disc, would be visible. Left to right panels illustrate the bubble ages from 5 to 25 Myr as labelled. In both cases, we find pervading areas of a lowered extinction that originates from Rayleigh-Taylor instability of expanding but decelerating shell. Note that, at the epoch of maximum transperancy ( Myr), even the clear patches in the lower panel (without dust sputtering) are darker in colour than in the upper panel (with dust sputtering). This implies that dust sputtering increases the overall transparency. Although this is intuitively expected, our simulation demonstrates it quantitively. It is seen, however, that in spite of dust destruction, a fraction of the bubble area remains dim because of partially survived dust.
Figure 3 illustrates cleaning in the expanding shell quantitatively – it represents the fraction of area of the front-side shell with optical depth lower than a certain level as shown in the legend. Initially (although not shown here) one has and as depicted by the dashed curve. At later epochs, the shell fragments under Rayleigh-Taylor instability and forms relatively transparent windows, such that cannot be neglected anymore, particularly in the model that has sputtered (‘burnt’) dust. Left panel in Fig. 3 represent the model with threshold SN progenitor mass of . The difference between the solid (‘burnt’) and dashed (‘intact’) curves is large in the case of the (red) curve for , which represents the clearest patches. This difference is large in the epochs of continuing SNe explosions (before 15 Myr), and the gap decreases at later times, due to the decreasing influence of SNe shocks.
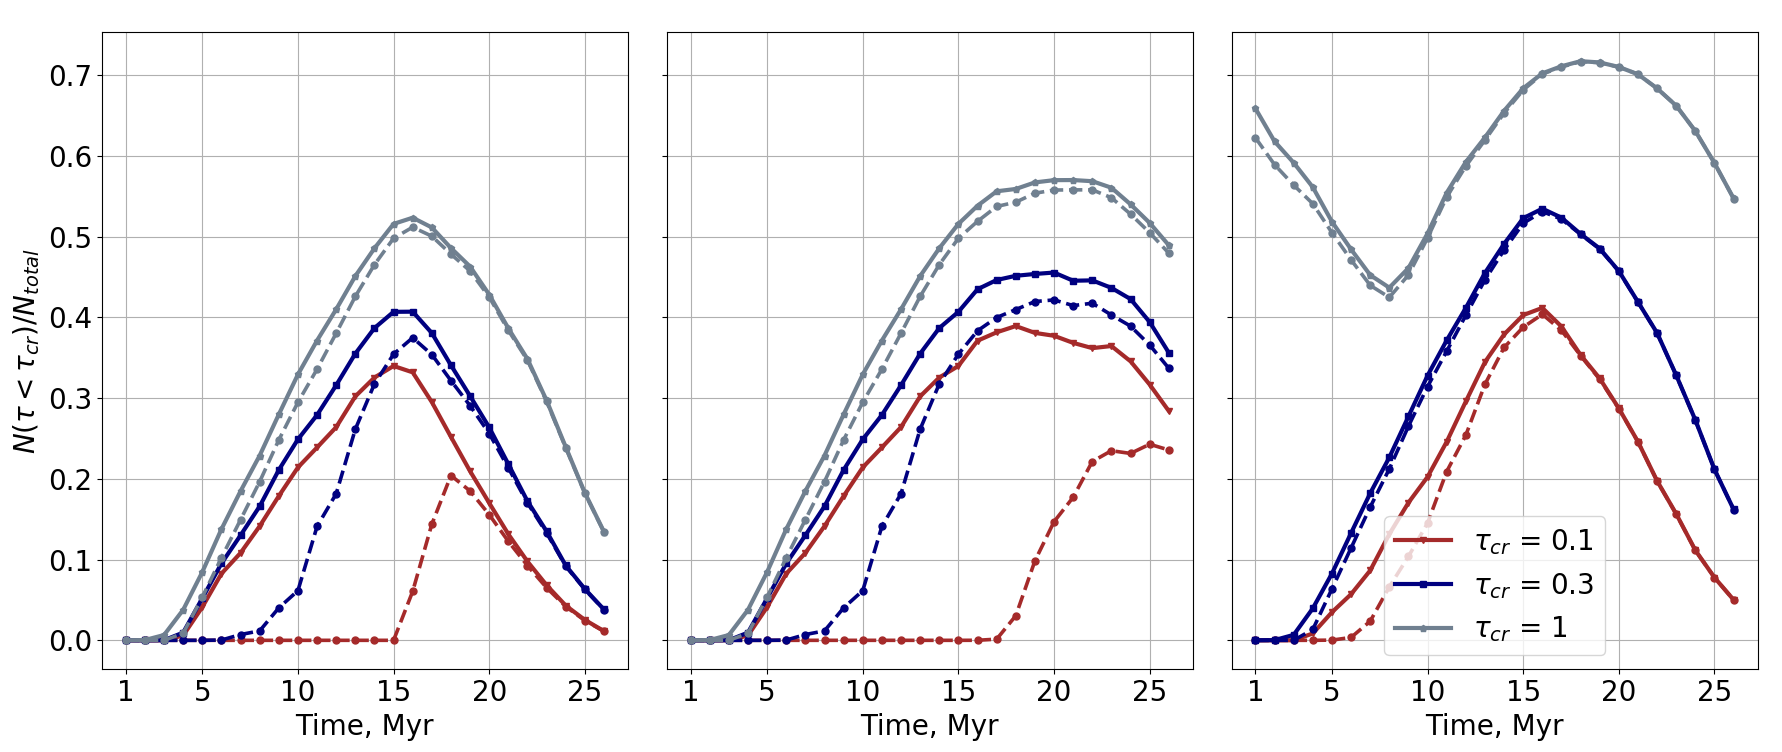
Expected variations of dust properties (e.g., dust-size distribution) in early galaxies at as compared to local galaxies can make their appearance distinctly different (Nozawa et al. , 2007). To study this, we also calculated the optical depth evolution of the expanding dusty outflows with a ‘flat’ dust size distribution , normalized by the dust mass in the galaxy and in the ejecta. Due to a deficit of small dust particles compared to the ‘standard’ MRN dust size distribution (Mathis et al. , 1977) , the extinction in this model is lower by factor , and being the radii of the smallest and the largest grains, assuming the same dust-to-gas mass ratio, in both cases we assumed Å, m. The consequences are seen in the right panel of Fig. 3: during the evolution the bubble remains more transparent as compared with the middle panel. Moreover, the difference between the fractions of hemisphere with optical depth below a certain level in models with the ‘burnt’ and intact grains are comparable, particularly for curves in the middle and right panels.
4.1.2 From clearing back to darkening
The fraction of transparent areas monotonously increases until Myr, when the SNe cease to explode. Soon after the sputtering from shock waves slows down, the pattern of transparancy maps in the lower (intact dust) and upper (burnt dust) rows in Fig. 2 approach each other and become nearly identical. This is also seen in Fig. 3, and is connected with decaying turbulent motions within the superbubble that redistribute the remaining grains, and mix the regions with low and high extinction, resulting in diminishing the fraction of the transparent area. The time required for this mixing is Myr (for a bubble radius of kpc, and turbulent velocity km s-1), and is consistent with the sequence shown in Fig. 2.
Stellar population with threshold SN progenitor mass of shows a longer transition from cleaning to darkening stage, Myr (middle panel of Fig. 3). This is connected with a longer process of fragmenting the ouflow due to Rayleigh-Taylor instability and dust sputtering in hot regions.
It is clearly seen in Figure 3 that starting from Myr, the areas of , with the corresponding reddening of for the standard (Milky Way) extinction law with (see in Draine & Lee, 1984; Weingartner & Draine, 2001; Draine, 2011), occupy a fraction in the model with . When dust sputtering is taken into account, the parameter increases to the value typical for AGNs (Maiolino et al. , 2001; Gaskell et al. , 2004), and the reddening approaches the value measured in GN-z11 (Jiang et al. , 2020). For the flat dust-size distribution, the parameter increases from before entering shock, to after shock processing. This diminishes the reddening to the value measured in GN-z11 .
At latter stages, at Myr a small part of the area becomes as transparent as , however regions with shrinks below 15%. At later stages Myr nearly 50% of the shell becomes covered with optical depth upto in accordance with the maps shown in Fig. 2. However, the model with truncated IMF at with SNe acting on longer times Myr, shows even a higher fraction of of optically thin area with for as long as 23 Myr, and in later 5 to 7 Myr, they dim quickly with the fraction of transparent areas below 15% at Myr.
5 Discussion
Even though the amount of dust that can be produced and ejected by SNe during the entire period of star formation in GN-z11 ( Myr) is quite sufficient () to enshroud the stellar light, the mechanical power from the same SNe is capable to blow the dust shell out and to break in it patchy transparent windows. The apparent ‘puzzling’ lack of dust in the galaxy GN-z11 might reflect that detection of this galaxy was rather accidental, when its evolutionary phase passed through a period of ‘transparency’. Switching to infrared wavelengths may not help, because dust heating for grains embedded in hot gas is not substantial enough to raise their temperature much above that of CMB: the dust temperature estimated by the peak in its emission spectrum is K, with the peak flux mJy, nearly the detection threshold of B-band in ALMA. This takes into account the fact that dust emission will be embedded in the CMB (see discussion in da Cunha et al. , 2013).
As the metal enriched and dusty shell settles down to the galactic disc and stellar population gets at least partially obscured, the galaxy becomes veiled, and therefore, avoids detection in rest-frame UV and optical range. At the same time, the measured stellar luminosity in GN-z11 can heat the settled dust only up to temperatures that are a few per cents higher than the CMB K at . For this reason, the galaxy cannot be observed in the infrared as well. Following these arguments and accounting for a relatively short period of the starburst in GN-z11 — 10 % of the Universe age at — one may assume that a considerable fraction of galaxies similar to those determining the actual value of the galaxy UV luminosity function (GUVLF) can be hidden beneath the dust – a factor of 10 higher than currently inferred. Such a possibility has been recently confirmed from the Early Release Science Program CEERS that identified a set of 33 heavily obscured massive star-forming galaxies at , which are not detected in HST surveys (Barrufet et al. , 2022).
Recent observations of galaxies at the beginning of cosmic dawn and measurements of the GUVLF at (Rojas-Ruiz et al. , 2020) show outliers at the bright end of the GUVLF. We speculate that they may show periods of starburst ‘transparency’ during their evolution, and their relative fraction compared to those lying in the ‘standard’ luminosity function at these , is proportional to the duty cycle of the ‘transparent’ phase. Note that the transparent phase can continue longer for a flat dust-size distribution, as seen in the right panel in Fig. 3.
Recently James Webb Space Telescope (JWST) found surprisingly abundant massive and bright blue galaxies at (Windhorst et al. , 2022; Yan et al. , 2022). One possible explanation is that galaxies mostly had high star formation efficiency, and were therefore brighter in UV than latter galaxies (Castellano et al. , 2022; Mason et al. , 2022). Other scenarios have been described by Ziparo et al. (2022). One of them suggests radiation driven dust ejection out of galaxies, while another model assumes dust to be segregated in dense compact clouds with a low covering factor. Ziparo et al. (2022) have stated that the recently reported non-detection of the rest-frame [OIII]88m line in the galaxy GNZ2/GL-z13 (Bakx et al. , 2022; Popping, 2022) can be explained by the first scenario, since the radiatively driven dust outflow will also evacuate gas, and therefore, OIII ions. In our model, the absence of OIII ions can also be easily explained, because the optically thin regions of the expanding gas are filled with diffuse and highly ionized hot gas K. These regions contain a very small fraction of OIII ions, (as discussed in Gnat & Sternberg, 2007, their Fig. 2.1b, upper panel). Threfore, the observed lack of OIII is also a generic prediction of SN shock driven outflowing gas.
6 Summary
Our study of the dynamical and observational consequences of the high- starburst galaxy GN-z11 demonstrates that:
-
1.
SFR measured in GN-z11 is sufficient to remove dust beyond the galactic disc to heights up to kpc, thereby making it transparent. Dust with a flat size distribution is potentially more conducive for making the disc transparent.
-
2.
Within 10 Myr after the end of SNe explosions, the evacuated material along with dust fall back and obscure stellar light until conditions for a next starburst are met with.
-
3.
Such an obscuration may hide many starburst galaxies avoiding detection.
-
4.
The total amount of dust is insufficient to be seen in the rest-frame FIR/submm domain, making GN-z11-like galaxies unobservable in these wavebands.
We thank Andrea Ferrara for helpful discussion and an anonymous referee for detailed comments. The work of SD is done under partial support from the project “New Scientific Groups LPI” 41-2020.
Data Availability
The data underlying this article are available in the article.
References
- Adams et al. (2022) Adams, N. J., Conselice, C. J., Ferreira, L., et al. , arXiv:2207.11217
- Arata et al. (2019) Arata, S., Yajima, H., Nagamine, K., Li, Y., Khochfar, S. 2019, MNRAS, 488, 2629
- Barrufet et al. (2022) Barrufet, L., Oesch, P. A., Weibel, A., et al. , 2022, eprint arXiv:2207.14733
- Bakx et al. (2022) Bakx, T. J. L. C., Zavala, J. A., Mitsuhashi, L., et al. , 2022, arXiv e-prints, arXiv:2208.13642.
- Bianchi & Schneider (2007) Bianchi, S., & Schneider, R., 2007, MNRAS, 378, 973, doi: 10.1111/j1365-2966.2007.11829.x
- Bruzual & Charlot (2003) Bruzual, G., & Charlot, S. 2003, MNRAS, 344, 1000
- Castellano et al. (2022) Castellano, M. et al. 2022, ApJL, 938, L15
- Corrales et al. (2016) Corrales, L. R., J. García, J., Wilms, J., F. Baganoff, F., 2016, MNRAS 458, 1345
- da Cunha et al. (2013) da Cunha, E., Groves, B., Walter, F., et al. , 2013, ApJ, 766, 13
- Draine & Salpeter (1979) Draine, B. T., Salpeter, E. E., 1979, ApJ, 231, 77
- Draine & Lee (1984) Draine, B. T., Lee, H. M., 1984, ApJ, 285, 89
- Draine (2011) Draine B.T., Physics of the Interstellar and Intergalactic Medium, Princeton University Press, 2011
- Ferrara et al. (2022) Ferrara, A., Pallottini, A., Dayal, P., 2022, arXiv:2208.00720
- Fiore et al. (2022) Fiore, F., Ferrara, A., Bischetti, M., Feruglio, C., Travascio, A., 2022, arXiv:2211.08937
- Gall et al. (2014) Gall, C., Hjorth, J., Watson, D., et al. , 2014, Natur., 511, 326
- Gaskell et al. (2004) Gaskell, C. M., Goosmann, R. W., Antonucci, R. R. J., Whysong, D. H., 2004, ApJ, 616, 147
- Gnat & Sternberg (2007) Gnat, O, Sternberg, A., 2007, ApJS, 168, 213
- Harikane et al. (2022a) Harikane, Y., Inoue, A. K., Mavatari, K., et al. , 2022a, ApJ, 929, 1
- Jiang et al. (2020) Jiang, L., Kashikawa, N., Wang, S., 2020, NatAs, arXiv:2012.0693
- Jones et al. (1994) Jones, A. P., Tielens, A. G. G. M., Hollenbach, D. J., McKee, C. F., 1994, ApJ, 433, 797
- Inoue et al. (2016) Inoue, A. K., Tamura, Y., Matsuo, H., et al. , 2016, Science, 352, 1559
- Iben (2012) Iben I., Stellar Evolution Physics, Volume 2, Cambridge, Cambridge University Press, 2012
- Kawamata et al. (2018) Kawamata, R., Ishigaki, M, Shimasaku, K., et al. , 2018, ApJ, 855, 4
- Kennicutt & Evans (2012) Kennicutt, R. C., Jr., Evans II, N. J., 2012, ARA& A, 50, 531
- Klingenberg et al. (2007) Klingenberg Ch., Schmidt W., Waagan K., 2007, J. Comp. Phys., 227, 12
- Krause et al. (2004) Krause, O., Birkmann, S. M., Rieke, G. H., et al. , 2004, Natur, 432, 596
- Krumholz et al. (2019) Krumholz, M. R., McKee, C. F., Bland-Hawthorn, J., 2019, ARA& A, 55, 227
- Lésniewska & Michałowski (2019) Lésniewska, A. & Michałowski, M. J., 2019, A&A, 24, L13
- Lau et al. (2015) Lau, R. M., Herter, T. L., Morris, M. R., et al. ., 2015, Sci., 348, 413
- Maiolino et al. (2001) Maiolino, R., Marconi, A., Oliva, E., 2001, A& A, 365, 37
- Maiolino et al. (2004) Maiolino, R., Schneider, R., Oliva, E., Bianchi, S., Ferrara, A., Mannucci, F., Pedani, M., Roca Sogorb, M., 2004, Natur, 431, 533
- Mason et al. (2022) Mason, C. A., Trenti, M., Treu, T., 2022 arXiv:2207.14808
- McKee et al. (1987) McKee, C. F., Hollenbach, D. J., Seab, C. G., Tielens, A. G. G. M., 1987, ApJ, 318, 674
- Matsuura et al. (2011) Matsuura, M., Dwek, E., Meixner, M., et al. , 2011, Sci., 333, 1258
- Mathis et al. (1977) Mathis, J. S., Rumple, W., Nordsieck, K. H., 1977, ApJ, 217, 425 (MRN)
- Miyamoto et al. (1975) Miyamoto M., Nagai R., 1975, PASJ, 27, 533
- Naidu et al. (2022) Naidu, R. P., Oesch, P. A., van Dokkum, P., et al. , 2022, eprint arXiv:2207.09434
- Nozawa et al. (2007) Nozawa, T., Kozasa, T., Habe, A., et al. , 2007, ApJ, 666, 955
- Oesch et al. (2016) Oesch, P. A., Brammer, G., van Dokkum, P. G., et al. , 2016, ApJ, 819, 129
- Popping (2022) Popping, G., 2022, arXiv e-prints, arXiv:2208.13072.
- Rojas-Ruiz et al. (2020) Rojas-Ruiz, S., Finkelstein, S. L., Bagley, M. B., et al. , 2020, ApJ, 891, 146
- Shen et al. (2020) Shen, X., Hopkins, P. F., Faucher-Giguère, C.-A., et al. , 2020, MNRAS, 495, 3252
- Todini & Ferrara (2001) Todini, P.,& Ferrara, A., 2001, MNRAS, 325, 726, doi: 10.1046/j.1365-8711.2001.04486.x
- Toro (1999) Toro E., Riemann solvers and numerical methods for fluid dynamics, Springer-Verlag, Berlin, second edition, 1999
- Vasiliev (2013) Vasiliev E.O., 2013, MNRAS, 431, 638
- Weingartner & Draine (2001) Weingartner, J. C., Draine, B. T., 2001, ApJ, 548, 296
- Windhorst et al. (2022) Windhorst, R. A., Cohen, S. H., Jansen, R. A., et al. , 2022, arXiv e-prints, arXiv:2209.04119
- Yan et al. (2022) Yan, H., Cohen, S. H., Windhorst, R. A., et al. , 2022, arXiv e-prints, arXiv:2209.04092
- Ziparo et al. (2022) Ziparo, Ferrara, Sommovigo, L., Kohandel, M., 2022, arXiv e-prints, arXiv:2209.06840