The RATAN-600 multi-frequency catalogue of blazars – BLcat
Published in Astrophysical Bulletin Vol. 77, No.4, pp.397–410 (2022)
DOI: 10.1134/S1990341322040149)
Abstract
In this paper we present the RATAN-600 multi-frequency catalogue of blazars, an updated version of the BLcat: the RATAN-600 multi-frequency catalogue of BL Lacertae objects. The main novelty in the catalogue is an extension of the sample with flat-spectrum radio quasars (FSRQs), thus currently it contains more than 1700 blazars of different types. The main feature of the BLcat is a compilation of radio continuum data for blazars based on the RATAN-600 quasi-simultaneous measurements at frequencies of 1.2, 2.3, 4.7, 7.7/8.2, 11.2, and 21.7/22.3 GHz. We additionally supplement the catalogue with the radio data from external sources to provide an opportunity to more complete study of radio spectra and radio light curves. For the convenience of users, we developed tools to calculate the spectral index, variability index, and radio luminosity. We briefly describe basic radio properties of blazar subsamples of the catalogue: spectral classification, spectral indices, flux density variability, and radio luminosity.
keywords:
galaxies: active – radio continuum: galaxies – quasars: general – BL Lacertae objects: general– catalogues1 Introduction
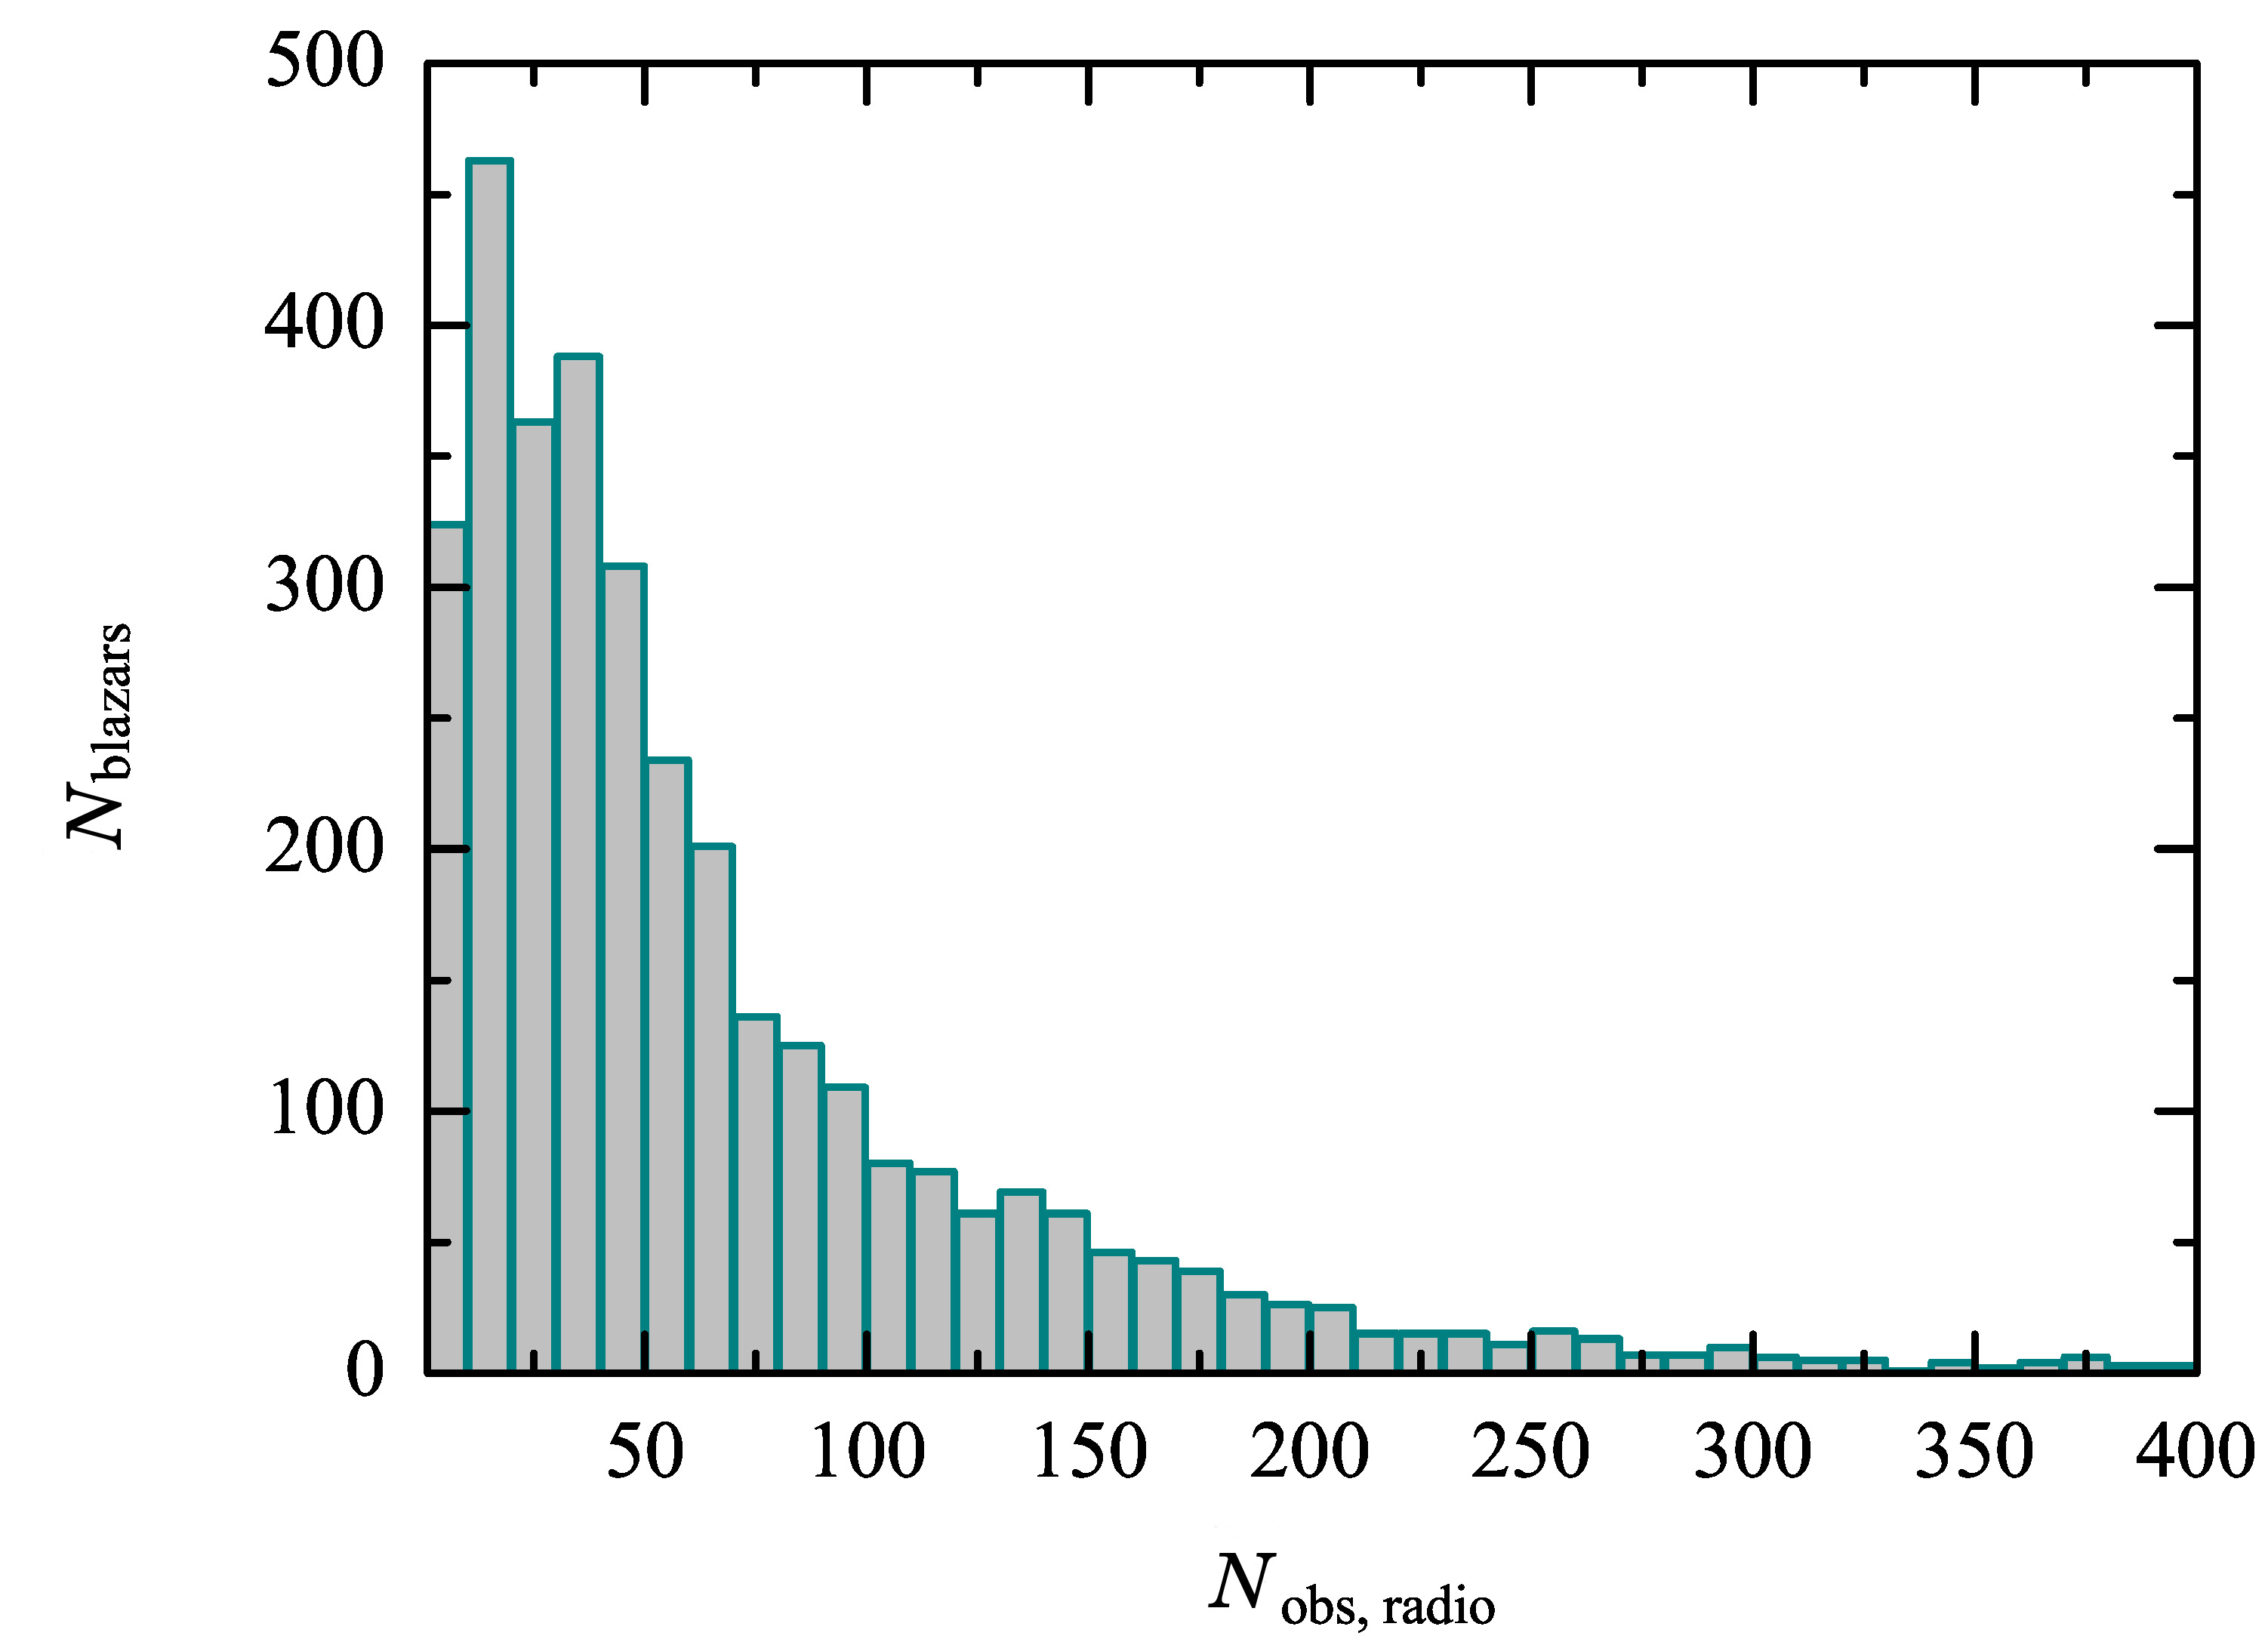
Blazars are radio-loud active galactic nuclei (AGNs) with their jets pointed in the direction to the observer (Urry & Padovani, 1995; Padovani et al., 2017). After their discovery, they became interesting as the objects of extreme physical conditions with rapid and violent variability at different timescales. Later, in addition to that, the interest to their investigation was triggered by the fact that they are the most common sources of -ray emission in the sky (Ajello et al., 2020). Recently, they were discovered as the possible sources of PeV-energy neutrino (IceCube Collaboration et al., 2018). For a comprehensive study of blazars and the connection between the radio emission and neutrinos in them, it is important to conduct multi-band high-cadence long-term observations (Kovalev et al., 2020; Plavin et al., 2020; Hovatta et al., 2021). The Whole Earth Blazar Telescope (WEBT, Villata et al. 2002) is a collaboration which organises such campaigns on blazar monitoring, from radio to -rays. In the radio bands, the greatest contribution was made by several observatories: the long-term regular monitoring of brightest AGNs at 37 GHz by the Metsähovi Radio Observatory (Salonen et al., 1987; Nieppola et al., 2009), the 15 GHz blazar monitoring program by the Owens Valley Radio Observatory (Richards et al., 2011), the three-frequency (4.8–14.5 GHz) monitoring by the University of Michigan Radio Astronomy Observatory (Aller et al., 1985), the 1.4 GHz NRAO VLA Sky Survey (NVSS, Condon et al. 1998), the 8.4 GHz observations with the Very Large Array (VLA, Healey et al. 2007), and the 2–4 GHz Very Large Array Sky Survey (VLASS, Lacy et al. 2020). However, long-term light curves are usually sparsely sampled, and most blazars have been observed mainly within multi-frequency flare activities monitoring campaigns (Hovatta & Lindfors, 2019). For example, in the Roma-BZCAT Multi-frequency Catalogue of Blazars (Massaro et al., 2015) more than 20% of them have less than 20 radio measurements (Fig. 1).
Among the mentioned radio telescopes and surveys, the RATAN-600 radio telescope stands out for its capability of obtaining six-frequency measurements (1–22 GHz) simultaneously. AGNs, including blazars, have been regularly monitored with RATAN-600 since 2005, and this data formed the basis for the first version of the BLcat111https://www.sao.ru/blcat/ (Mingaliev et al., 2014), the catalogue of “RATAN-600 multi-frequency data for the BL Lacertae objects”. It contained more than 300 BL Lac objects and candidates. In this paper, we present the electronic “RATAN-600 multi-frequency catalogue of blazars”, which is an update of the BLcat. In this new BLcat edition 1.3 (September 2021), we present several major changes to the previous version: firstly, the catalogue was enlarged with new types of blazars, namely blazars of an uncertain type (Blaz.un.t) and flat-spectrum radio quasars (FSRQs), and now it contains more than 1700 blazars; secondly, the BL Lac objects from the first version of the catalogue were supplemented by new RATAN-600 flux density measurements; and thirdly, the radio data from external databases and the literature are given along with the RATAN-600 data.
The paper is organised as follows. The properties of the sample are given in Section 2; the description of the RATAN-600 observations and characteristics of the antenna and receivers are given in Section 3.1; in Section 3.2 the external data added to the catalogue are described; in Section 4 we present the general organisation, the structure of the catalogue, and available tools. Section 5 describes radio properties of blazar populations of the catalogue. The summary of the paper is given in Section 6.
2 The sample
The list of BLcat blazars is based on the Roma-BZCAT catalogue by Massaro et al. (2009), which is the largest collection of blazars selected from different multi-band surveys. Its 5th edition (Massaro et al., 2015) contains 3561 objects, all of them provided with the radio band data from the NVSS (Condon et al., 1998), the FIRST survey (White et al., 1997), or the SUMMS (Mauch et al., 2003). The BZCAT blazar classification is based in general on the spectral energy distribution (SED) showing strong non-thermal emission over the entire electromagnetic spectrum and the presence of evidence for relativistic beaming. When available, the data for -rays, soft and hard X-rays, microwaves, and the -band magnitudes are also given.
The BLcat catalogue originally included 306 BL Lacertae objects from the large Metsähovi BL Lac sample (Nieppola et al., 2006) and contained the RATAN-600 measurements in 2005–2014 (Mingaliev et al., 2014, 2017b). Later we included to the catalogue the FSRQ blazars from Roma-BZCAT within the declination range from to with an NVSS flux density limit of mJy. In comparison with the first version of the catalogue (Mingaliev et al., 2014) current edition contains almost six times more objects, the population is mainly extended because of FSRQ type of blazars (Table 1).
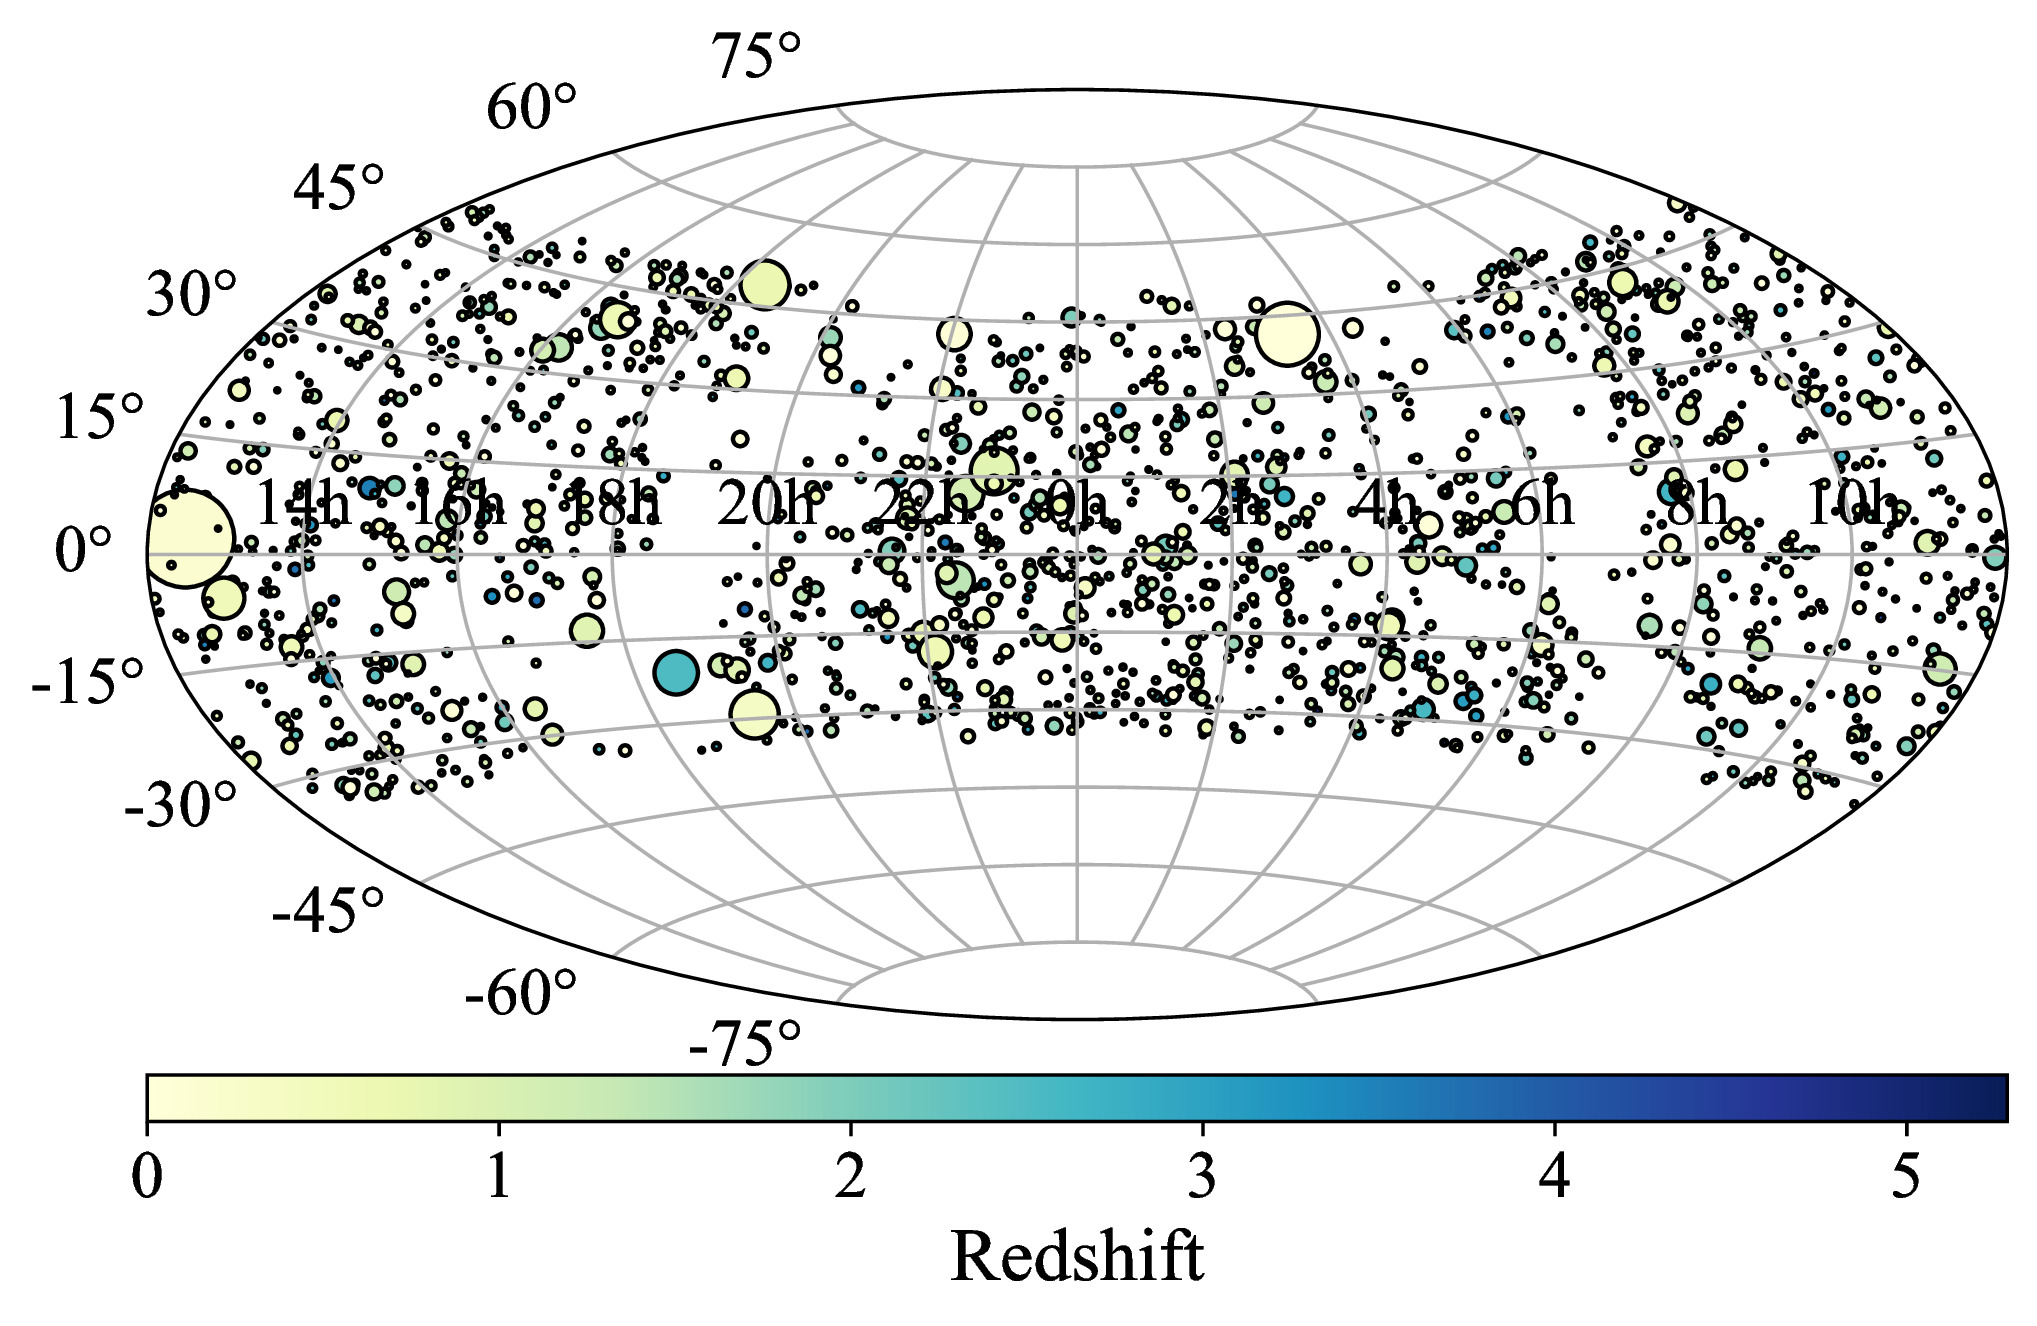
The BLcat aims to fully represent the RATAN-600 long-term measurements of blazars; an external radio data are being systematically included in the catalogue. At present, the catalogue contains more than 1700 blazars, which is almost half of all the Roma-BZCAT sources. We adopted the blazar classification, redshifts, and -band magnitudes from Roma-BZCAT. The BL Lacertae are subclassified as BL Lacertae–type objects, BL Lac candidates, and BL Lac–galaxy dominated sources according to Roma-BZCAT. Fig. 2 shows the distribution of the objects from the catalogue in the sky, with the redshifts designated by the colour, and the source’s flux densities shown by the marker size.
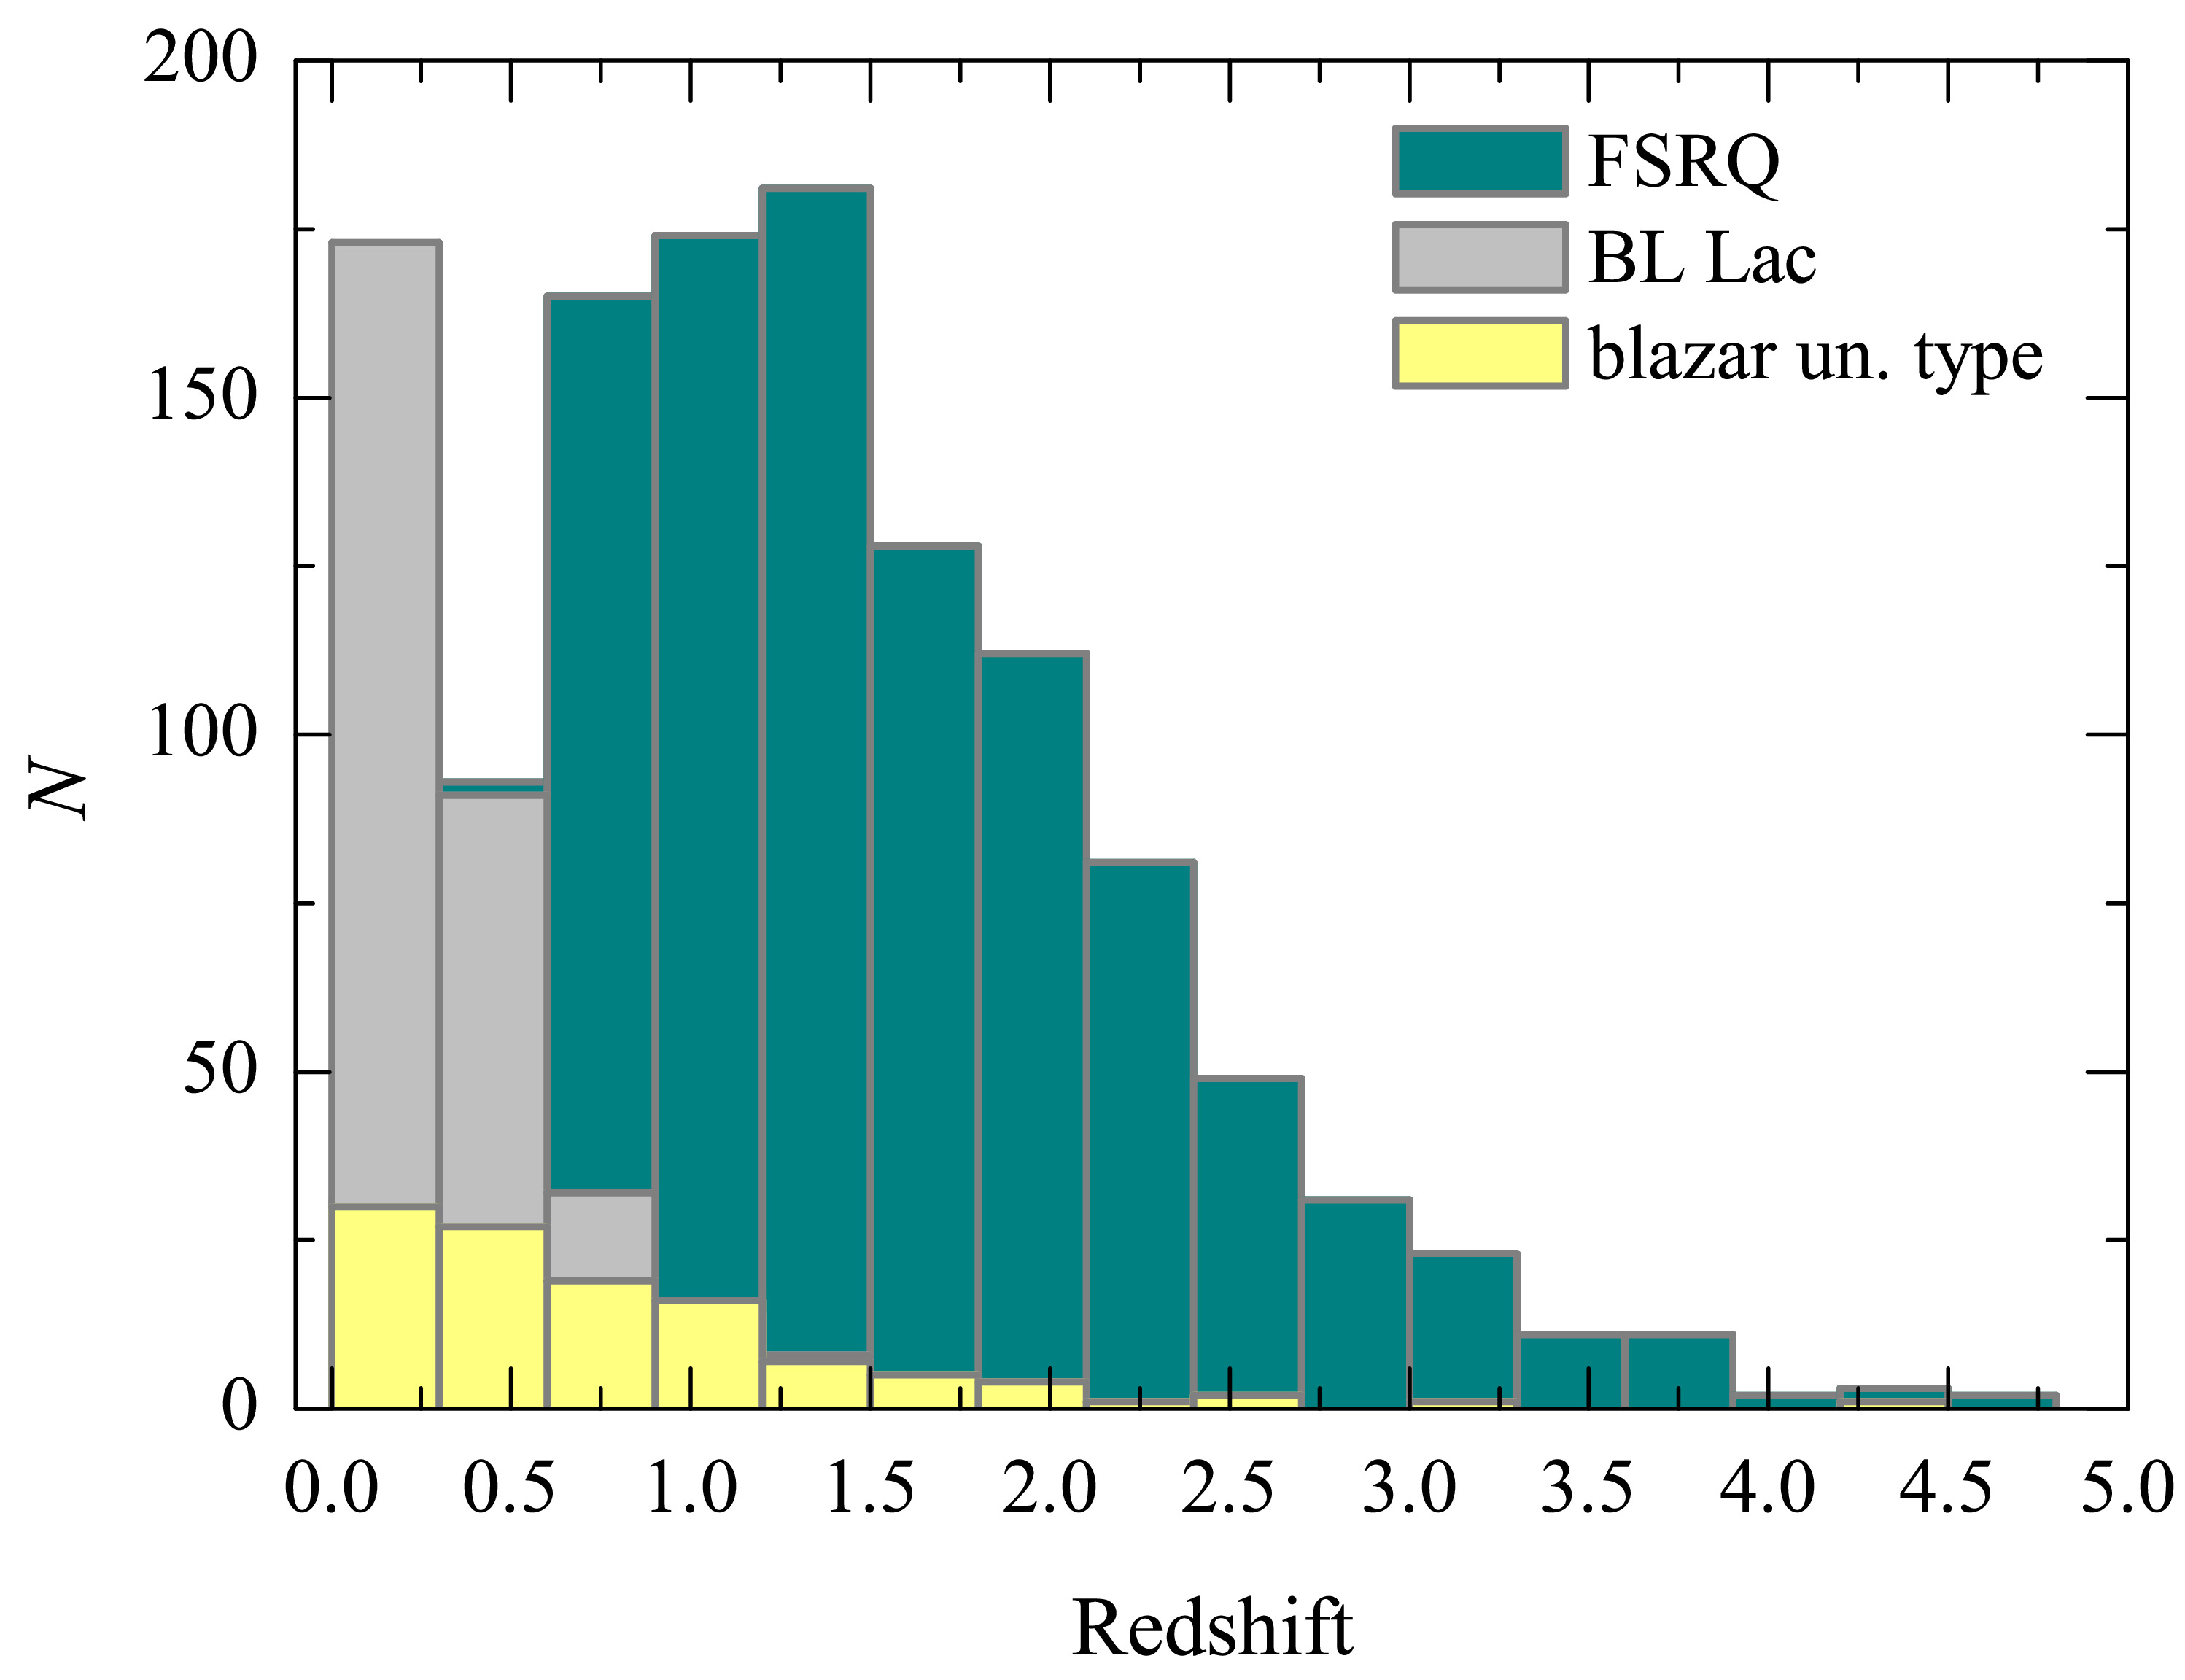
The redshift distribution for different blazar populations is shown in Fig. 3. The median value of is 1.34 for FSRQs, 0.58 for blazars uncertain type, and 0.27 for BL Lacs. FSRQs exhibit larger scatter in a range of redshift, from 0.09 to 5.29.
| Class | (%) | |||
|---|---|---|---|---|
| 2014 | 2022 | |||
| FSRQ | 7 | (2.3) | 1097 | (62.2) |
| BL Lac | 220 | (71.9) | 416 | (23.6) |
| BL Lac candidates | 43 | (14.1) | 32 | (1.8) |
| BL Lac galaxy-dominated | – | 92 | (5.2) | |
| Blazars of uncertain type | 36 | (11.8) | 128 | (7.2) |
| All | 306 | 1765 | ||
3 CATALOGUE’S CONTENTS
3.1 RATAN-600 Data
The observations of blazars with RATAN-600 have been carried out since 2005, and part of the measurements were published in the electronic catalogues Mingaliev et al. (2008); Mingaliev et al. (2012a); Mingaliev et al. (2015); Mufakharov et al. (2015a, b); Mingaliev et al. (2017a); Sotnikova et al. (2019b). RATAN-600 radio continuum spectra are measured simultaneously at several frequencies on a time scale of 3–5 minutes (Korolkov & Pariiskii, 1979; Parijskij, 1993). We used two radiometric complexes working at three (4.7, 11.2, 21.7/22.3 GHz) and six (1.2, 2.3, 4.7, 7.7/8.2, 11.2, 21.7/22.3 GHz) frequencies (Tsybulev, 2011; Tsybulev et al., 2018). The parameters of the radiometers and RATAN antenna system are given in Table 2. The observations were processed using the automated data reduction system (Udovitskiy et al., 2016), which is based on the Flexible Astronomical Data Processing System (FADPS) standard data reduction software developed by Verkhodanov (1997).
The following flux density secondary calibrators were used: 3C48, 3C138, 3C147, 3C161, 3C286, 3C295, 3C309.1, and NGC 7027. The flux density scale is based on the measurements by Baars et al. (1977) and Perley & Butler (2013, 2017), which are in good agreement with each other and differ only within the measurement errors. We also used the traditional RATAN-600 flux density calibrators: J024023, J115435, J134712, and J052116 (Sotnikova et al., 2019a). The measurements of the calibrators were corrected for angular size and linear polarisation according to the data from Ott et al. (1994) and Tabara & Inoue (1980).
A standard error of the flux density includes an uncertainty of the RATAN-600 calibration curve (about 2–10%) and the antenna temperature measurement error. The systematic uncertainty of the absolute flux density scale, which is 3–10% at different frequencies (Baars et al., 1977), is excluded in the total error. The median values of the standard error are 3–10% at 11.2, 8.2, and 4.7 GHz, and 7–20% at 2.3, 1.2, and 22.3 GHz.
At present, the number of RATAN observations is non-uniform over the whole BLcat list, it varies from 1 up to more than 100. The average number of observations is 17. Most blazars, about 65%, have been observed on average 5 times. About 10% of blazars have 15–45 RATAN-600 observational epochs; 22% – 45–70 epochs, and 4% – 70–115 epochs.
| , | , | , | ||
|---|---|---|---|---|
| GHz | GHz | mJy/beam | ||
3.2 External Data
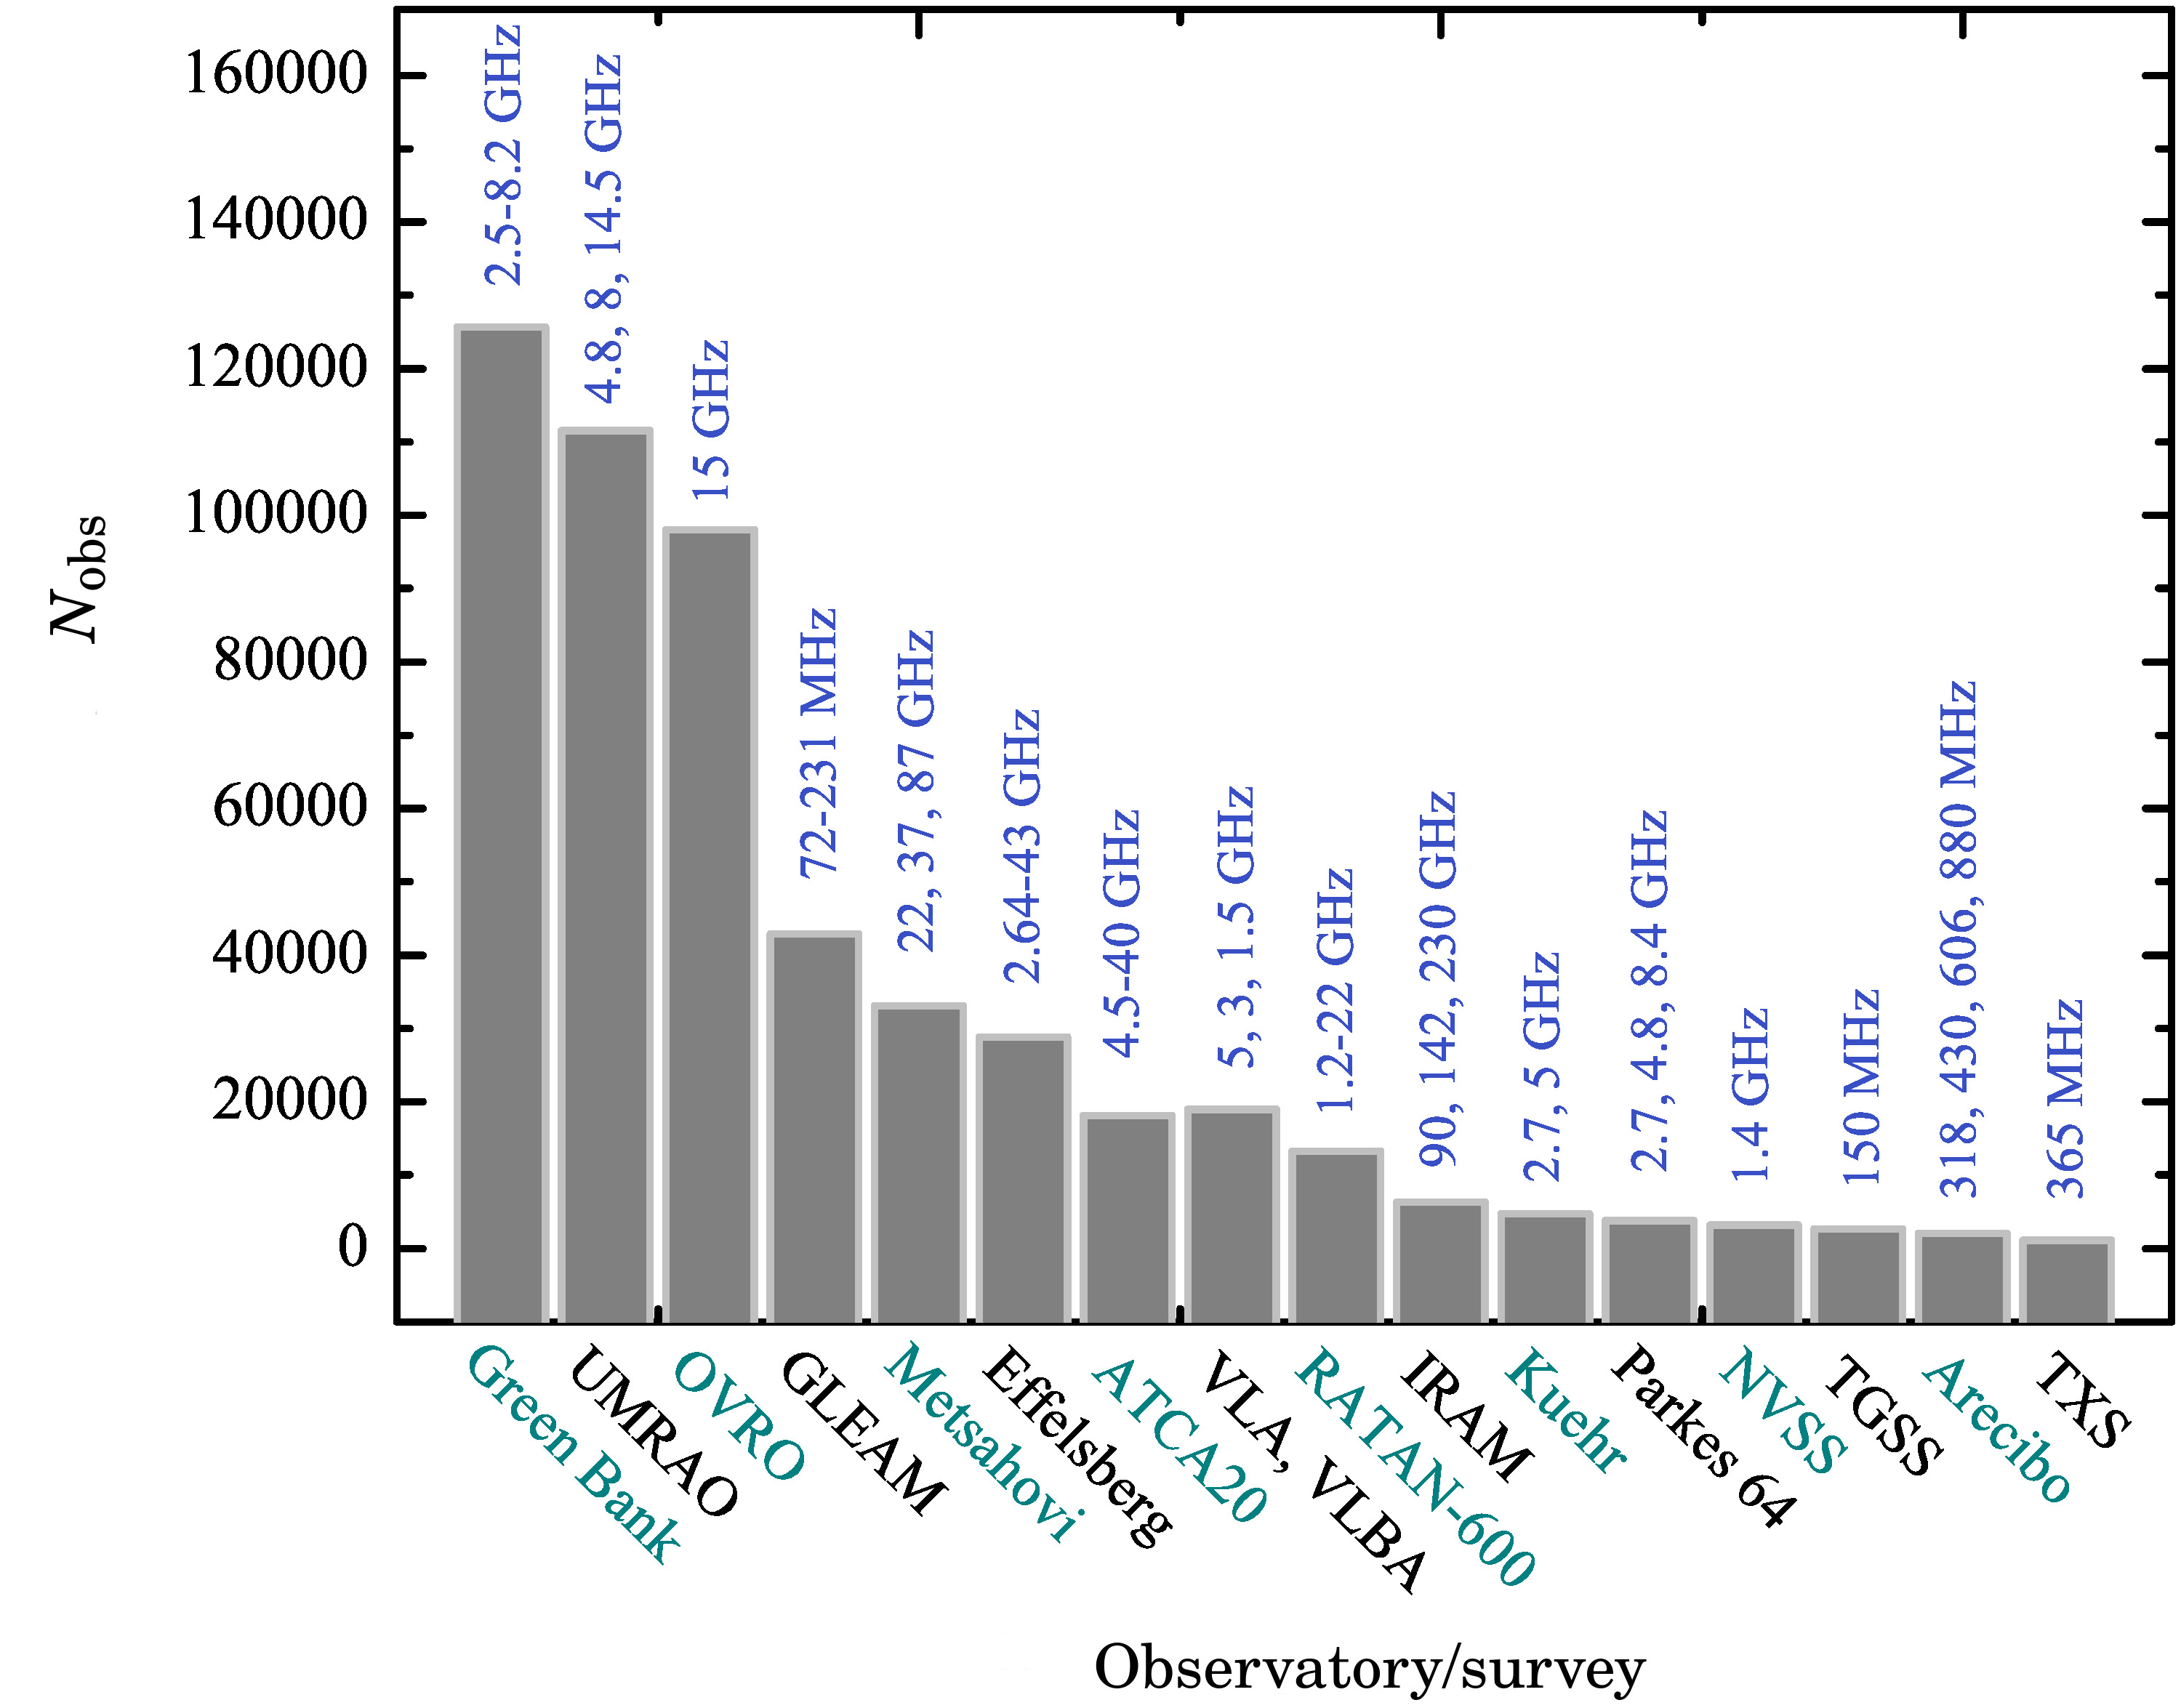
The new BLcat edition collects external radio continuum data from CATS222https://www.sao.ru/cats/, the Astrophysical CATalogs support System database (Verkhodanov et al., 1997, 2005, 2009), available on the Special Astrophysical Observatory website, from NED333http://ned.ipac.caltech.edu, the NASA/IPAC Extragalactic Database, and from the VizieR Information System444https://vizier.u-strasbg.fr/viz-bin/VizieR (Ochsenbein et al., 2000). The data used for the construction of broadband radio continuum spectra and cover the frequency range from tens of MHz up to hundreds of GHz and time period of 30–40 years. The total list with references is given in Table 3. Fig. 4 presents the distribution of main of surveys or monitoring programs contributing to the blazar radio data.
| Catalog/survey | Observatory/telescope | Frequency range, GHz | Refs |
| 87GB, GB6 | GBT | 2.5, 4.85, 8.2 | [1, 2, 3, 4] |
| UMRAO | 4.8, 8, 14.5 | [5] | |
| F-GAMMA | OVRO | 10.8, 15 | [6, 7] |
| GLEAM | MWA | 0.072–0.231 | [8] |
| F-GAMMA | Effelsberg | 2.64–43 | [9] |
| AT20G, PACO | ATCA | 20, 4.5–40 | [10, 11] |
| Metsähovi | 22, 37, 87 | [12, 13, 14] | |
| VLASS | VLA | 3 | [15] |
| VLBA | 1.4, 5 | [16] | |
| RATAN-600 | 1–22 | [17, 18, 19, 20] | |
| IRAM | 90, 142, 230 | [21] | |
| GBT, Parkes | 2.7, 5 | [22] | |
| NVSS | VLA | 1.4 | [23] |
| TGSS | GMRT | 0.15 | [24] |
| PMN | Parkes | 4.85, 8.4 | [25, 26] |
| Arecibo | 0.32, 0.43 | [27] | |
| GBT | 0.61, 0.88, 1.4 | [27] | |
| TXS | UTRAO | 0.365 | [28] |
| Refs: [1, 2, 3, 4] — Lazio et al. (2001); Altschuler (1986), Gregory & Condon (1991); Becker et al. (1991); [5] — Aller et al. (1985); [6, 7] — Richards et al. (2011); Seielstad et al. (1983); [8] — Hurley-Walker et al. (2017); [9] — Angelakis et al. (2019); [10, 11] — Massardi et al. (2011, 2008); [12, 13, 14] — Teraesranta et al. (1998); Terasranta et al. (1992); Teräsranta et al. (2004); [15, 16] — Gordon et al. (2020); Taylor et al. (1996); [17, 18, 19, 20] — Mingaliev et al. (2017b, 2012b); Kovalev et al. (1999); Kiikov et al. (2002); [21] — Reuter et al. (1997); [22] — Kuehr et al. (1981); [23] — Condon et al. (1998); [24] — Intema et al. (2017); [25, 26] — Wright et al. (1990, 1996); [27] — Mitchell et al. (1994); [28] — Douglas et al. (1996). | |||
External data collected by different instruments are often inhomogenous. For example, interferometric observations have higher angular resolution than our RATAN-600 telescope, thus leading to underestimations of source’s flux densities compared to RATAN-600 measurements. On the other hand, measurements from single-dish telescopes with beams larger than those of RATAN-600 may be impacted by confusion with nearby sources, leading to overestimates of source’s flux densities. Noting this we listed and classified all the catalogues from CATS, separating interferometric from single-dish data. We marked interferometric and single-dish measurements with different colours and they are optionally allowed to be drawn in cumulative radio spectrum.
| Epochs | Source | RA | Dec | Rmag | , Jy | , W Hz-1 | Blazar | ||
| name | (J2000.0) | (J2000.0) | type | ||||||
| (1) | (2) | (3) | (4) | (5) | (6) | (7) | (8) | (9) | (10) |
| 1 | 2 | 5BZQJ00011551 | 00:01:05 | 15:51:06 | 2.044 | 18.1 | 0.20 | FSRQ | |
| 2 | 6 | 5BZQJ00011914 | 00:01:08 | 19:14:34 | 3.1 | 21.6 | 0.13 | FSRQ | |
| 3 | 3 | 5BZBJ00010746 | 00:01:18 | 07:46:26 | – | 17.9 | 0.18 | – | BL Lac |
| 4 | 6 | 5BZBJ00010011 | 00:01:21 | 00:11:39 | 0.462 | 19.6 | 0.05 | BL Lac | |
| 5 | 46 | 5BZBJ00020024 | 00:02:57 | 00:24:47 | 0.523 | 19.7 | 0.09 | BL Lac | |
| 6 | 1 | 5BZBJ00041148 | 00:04:04 | 11:48:57 | – | 18.8 | 0.78 | – | BL Lac |
| 7 | 2 | 5BZQJ00044615 | 00:04:16 | 46:15:18 | 1.81 | 20.4 | 0.24 | FSRQ | |
| 8 | 2 | 5BZQJ00051648 | 00:05:17 | 16:48:04 | 0.78 | 18.4 | 0.15 | FSRQ | |
| 9 | 1 | 5BZQJ00050524 | 00:05:20 | 05:24:10 | 1.9 | 16.2 | 0.14 | FSRQ | |
| 10 | 66 | 5BZQJ00053820 | 00:05:57 | 38:20:15 | 0.229 | 17.6 | 0.50 | FSRQ | |
| Column designations: (1)—the entry number, (2)—the number of RATAN-600 observing epochs, (3)—the source name, (4)—right ascension (J 2000, hh:mm:ss), (5)—declination (J 2000, dd:mm:ss), (6)—redshift, (7)—the -band magnitude from USNO-B1, (8)—the average flux density at 4.7 GHz measured based on the RATAN-600 observations, (9)—the average radio luminosity at 4.7 GHz measured based on the RATAN-600 observations, (10)—the blazar type based on the BZCAT classification: BL Lac, BL Lac candidate (BL Lac cand.), BL Lac-galaxy dominated (BL Lac.g.dom.), FSRQ, or a blazar of an uncertain type (Blaz.un.t.). | |||||||||
4 General organisation of the catalogue
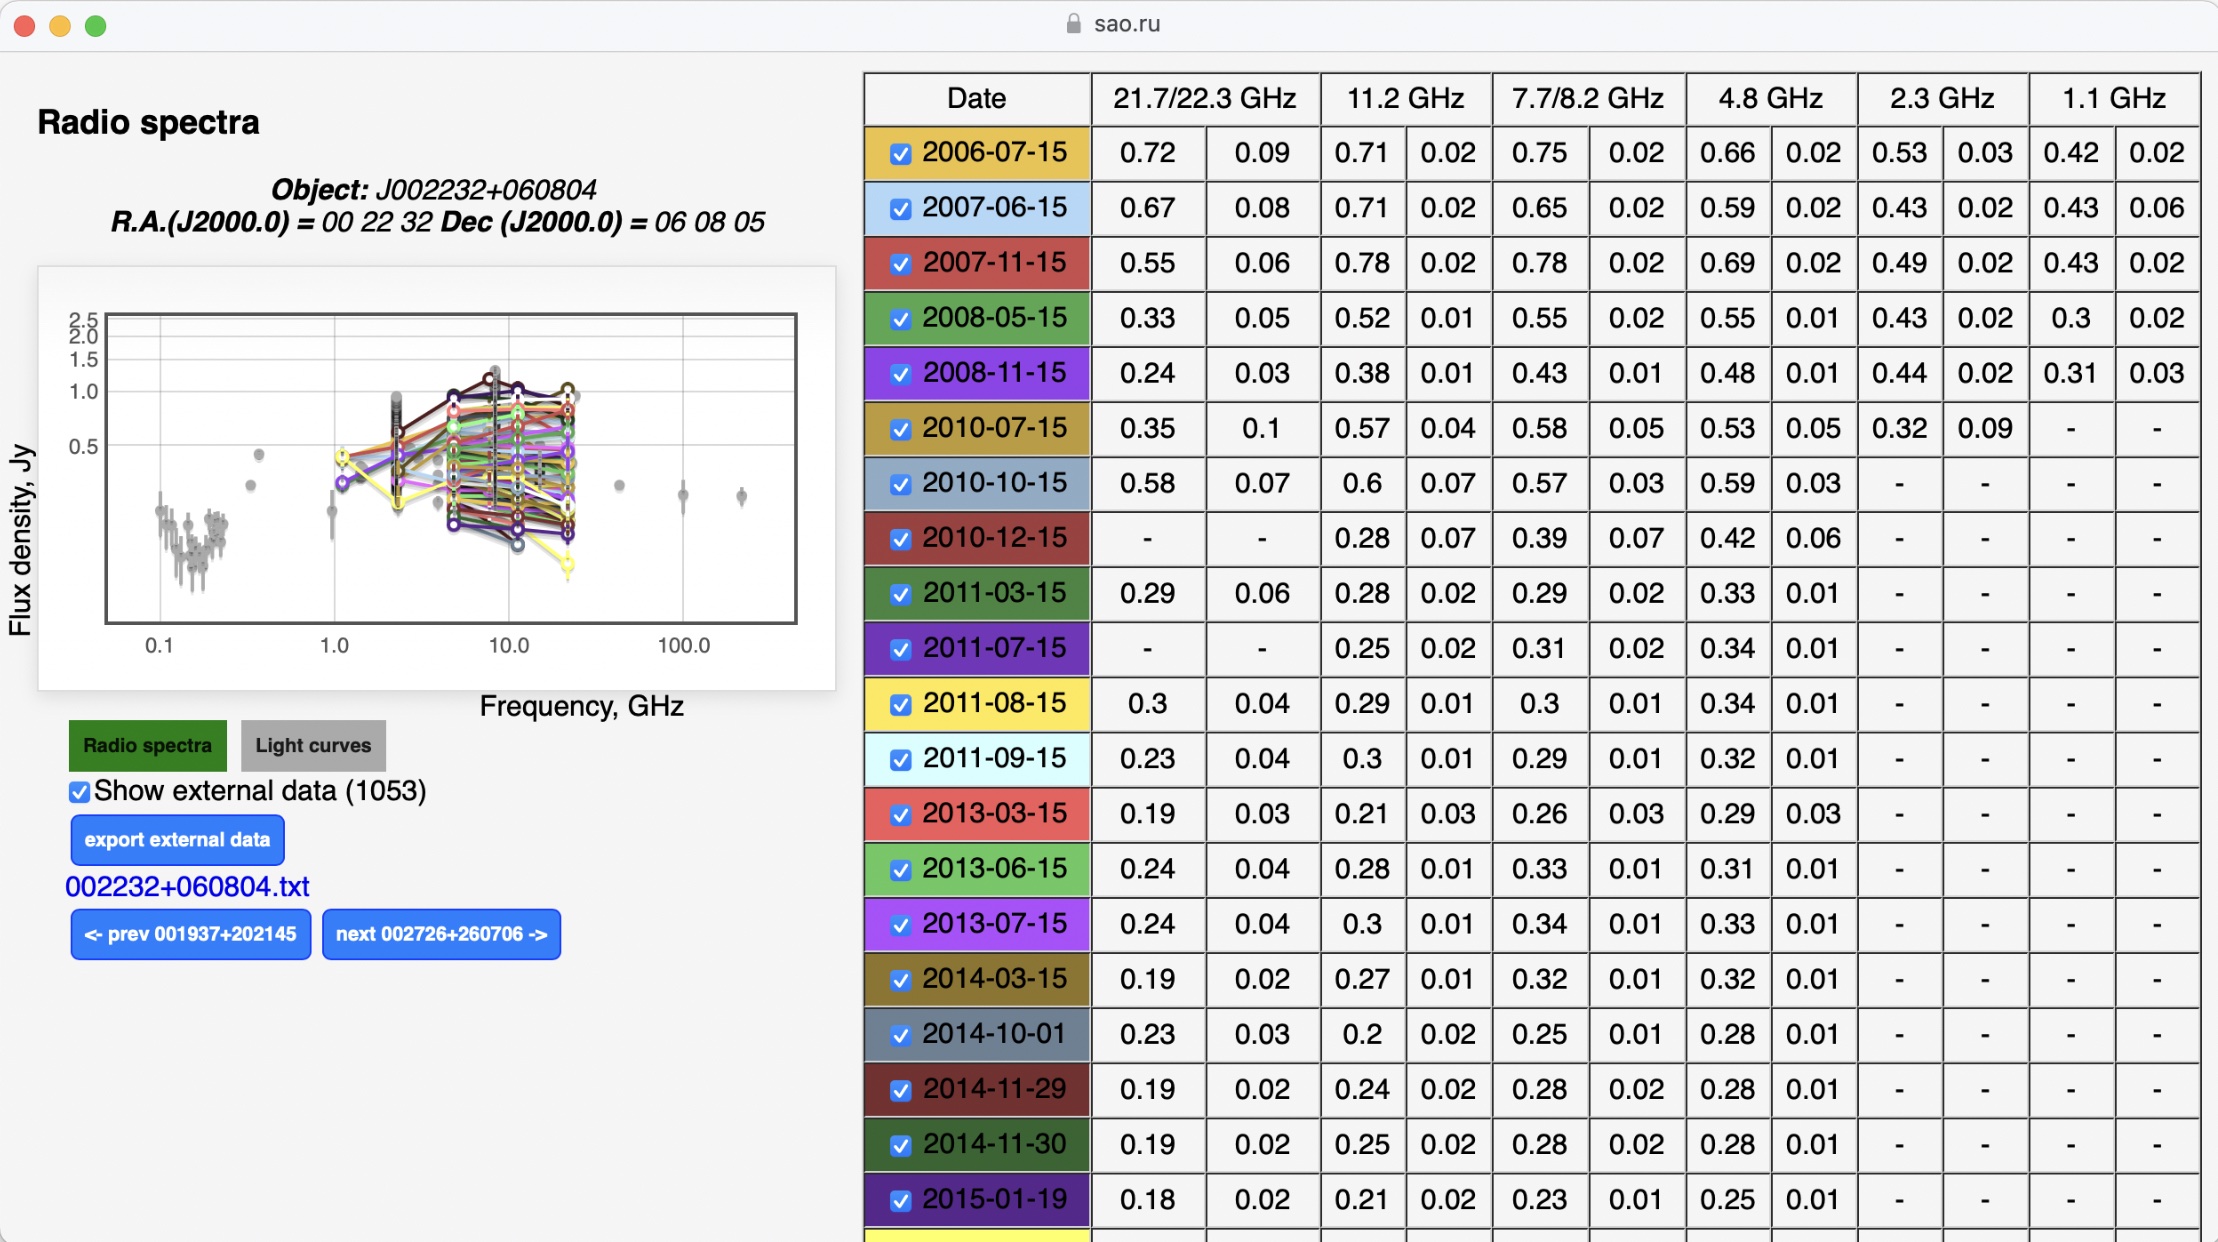
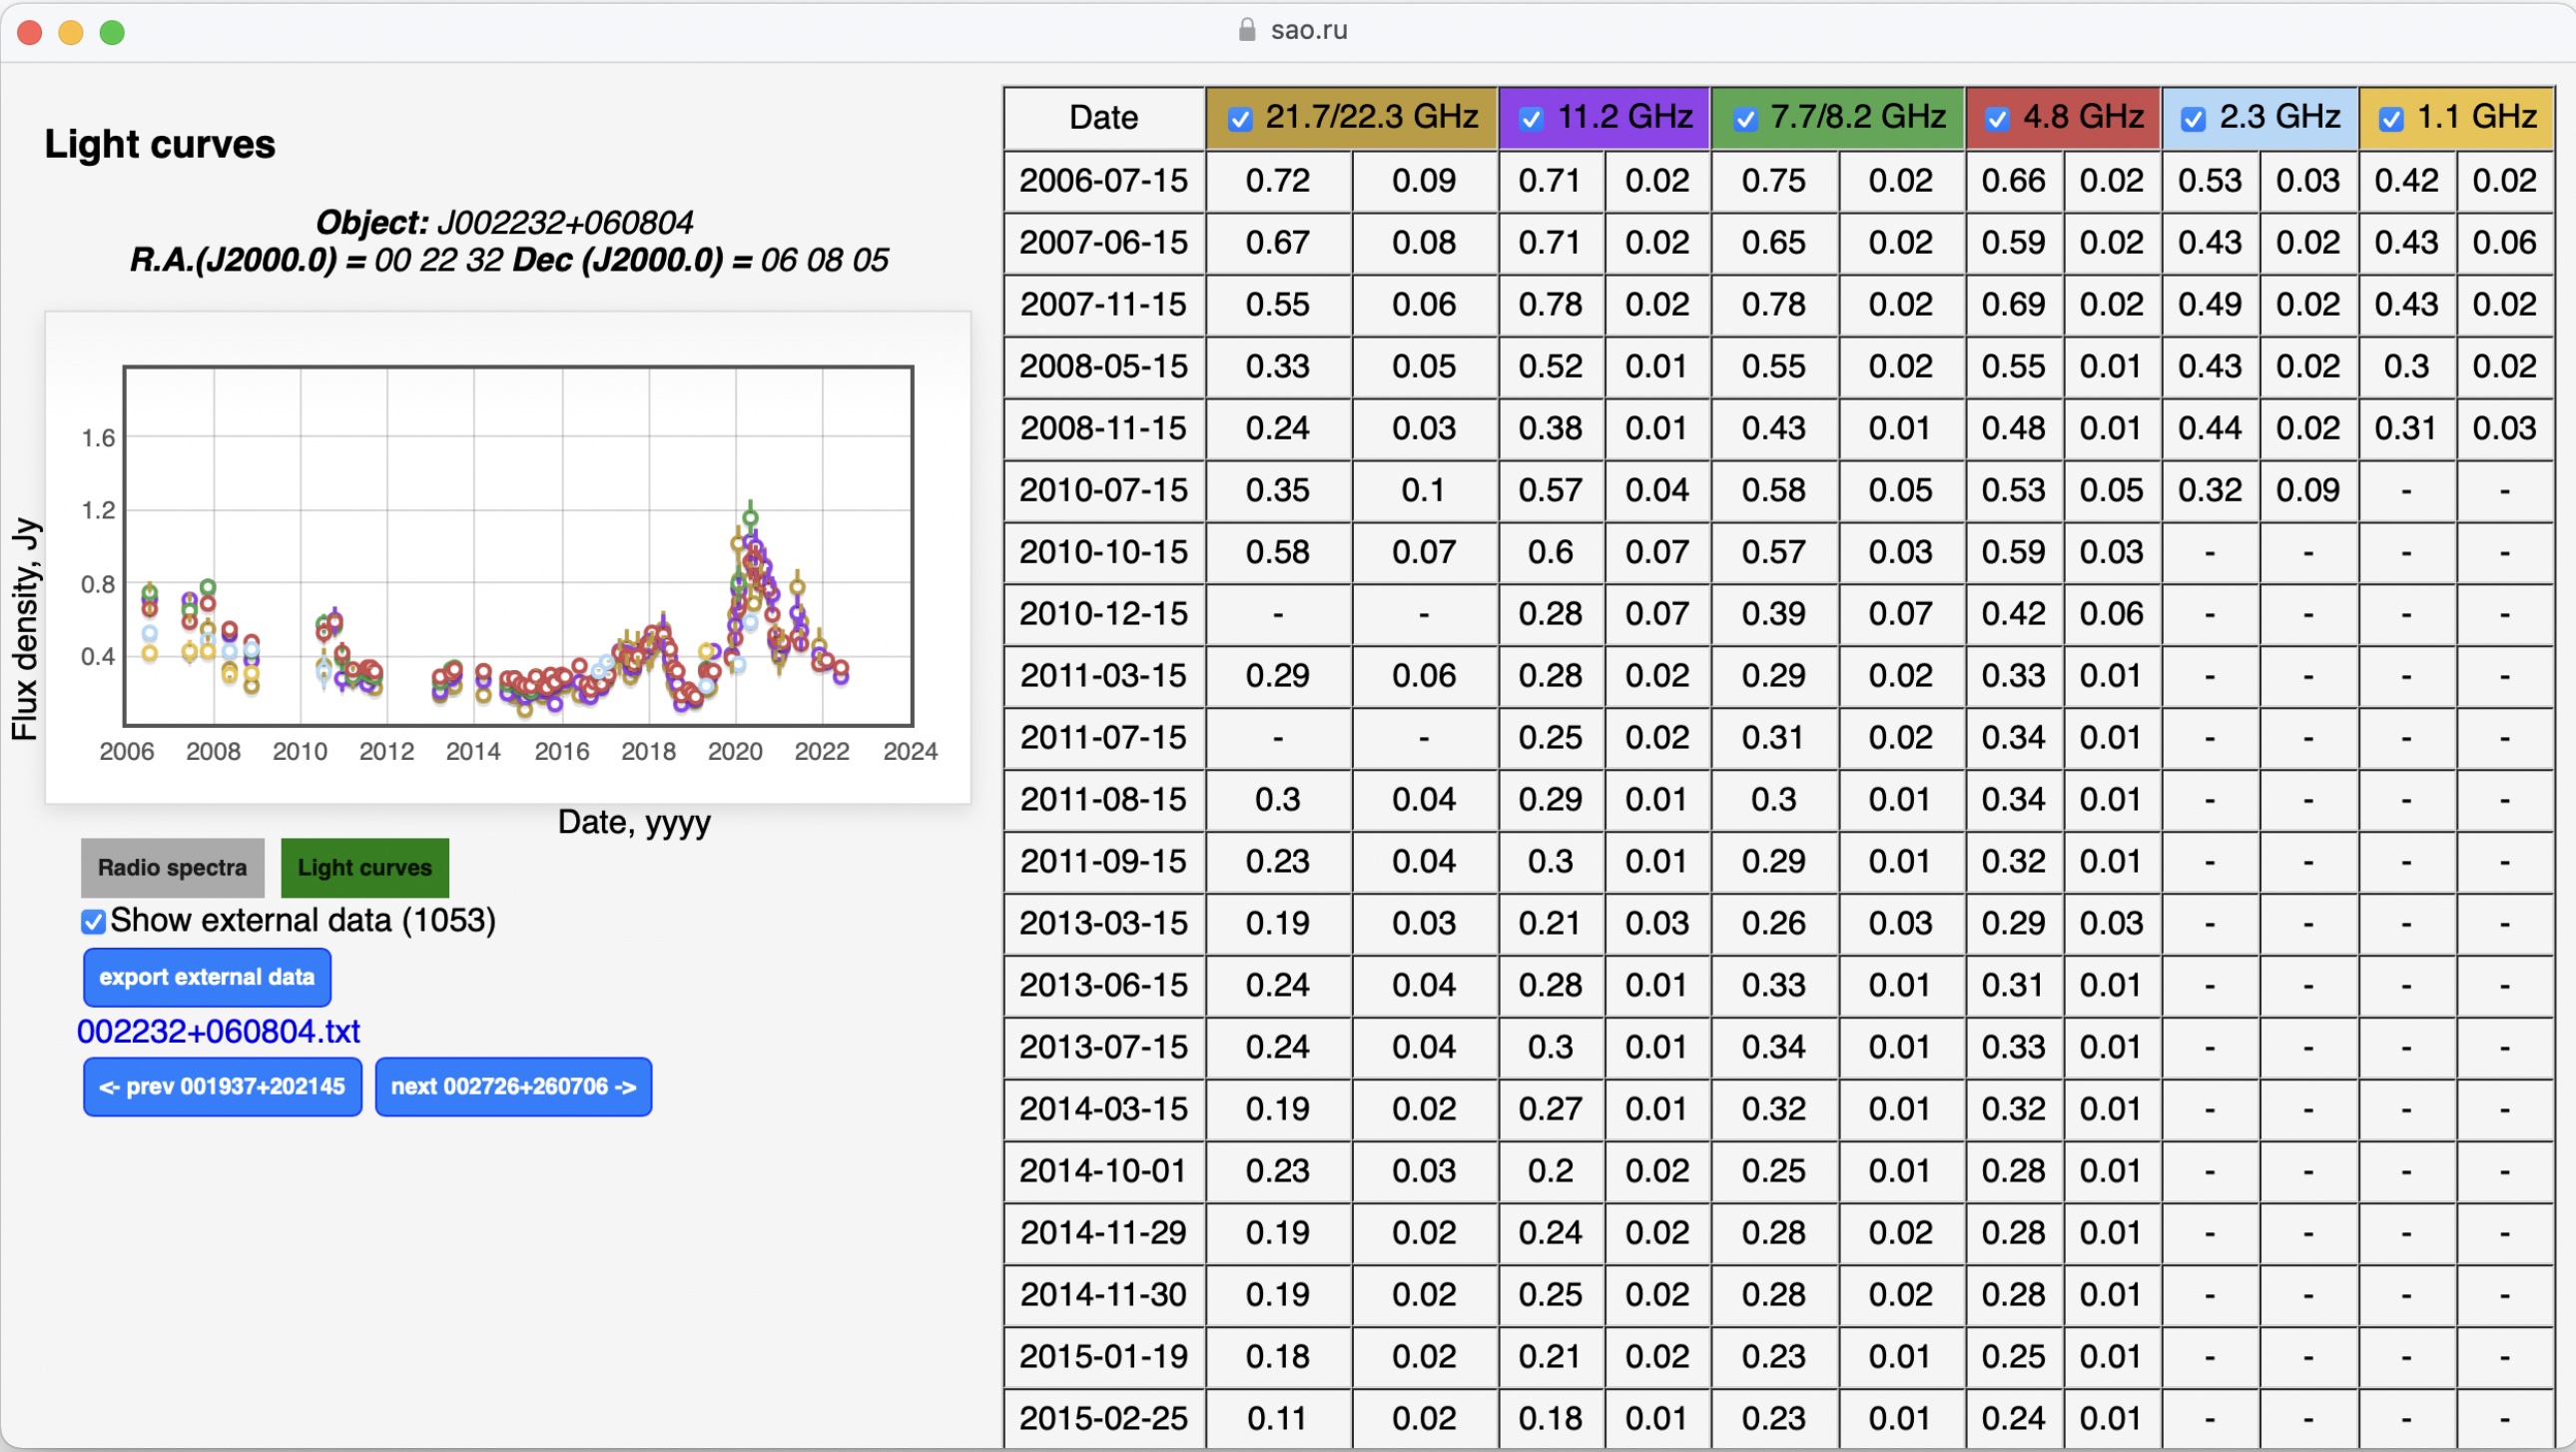
The catalogue is published as an interactive online tool to view and access the data at https://www.sao.ru/blcat/. The main page contains a list of objects with their characteristics placed in columns: the number of RATAN-600 observing epochs for each object, name of the object (in the BZCAT5 format where it is possible), the J 2000 right ascension (RA) and declination (Dec) coordinates, the redshift, the -band magnitude, the averaged flux density at 4.7 GHz, the averaged luminosity at 4.7 GHz, and the type of the blazar (based on the Roma-BZCAT 5th edition). An example of the main table contents is given in Table 4. Each column can be sorted, and the columns containing the number of observing epochs, the redshift, the -band magnitude, the flux density, the radio luminosity, and the blazar type also have distribution statistics. The radio data of any object/s can be accessed by clicking on the “Data explorer” option. It opens a new window with the RATAN-600 data, represented by the flux densities obtained at three to six frequencies quasi-simultaneously, the radio spectrum, and the light curves (an example is shown in Figs. 5 and 6). The radio spectrum could be supplemented with external data (“Show external data”), which can be exported right there (“Export external data”) in the format of a text file containing the blazar name, the frequency, the flux density, and the name of a catalogue or a bibliographic code to identify the literature.
| Blazar type | , Jy | , W Hz-1 | |||||||
|---|---|---|---|---|---|---|---|---|---|
| average | median | average | median | average | median | ||||
| FSRQ | 1097 | 1.47 (0.79) | 1.34 | 1097 | 0.59 (1.29) | 0.32 | 1065 | 5.0 (11.2) | 1.9 |
| BL Lac | 324 | 0.38 (0.35) | 0.27 | 539 | 0.27 (0.42) | 0.11 | 252 | 3.2 (9.7) | 1.9 |
| Blaz.un.t. | 113 | 0.77 (0.71) | 0.58 | 128 | 0.79 (2.33) | 0.31 | 105 | 2.0 (2.5) | 3.5 |
We provide spectral and variability indices, automatically calculated in different frequency intervals. The spectral index defined from the power law , where is the flux density at frequency , and is a spectral slope. It is calculated using the standard formula:
| (1) |
where and are the flux densities at frequencies and , respectively.
The variability index is estimated using the formula adopted from Aller et al. (1992):
| (2) |
where and are the maximum and minimum values of the flux density over all epochs of observations, while and are their root-mean-square errors. The spectral index can be calculated both for a single RATAN-600 observing epoch and for the entire period of observation as an averaged index. Also we provide the estimates of the monochromatic radio luminosity calculated at 4.7 GHz following the equation:
| (3) |
where is the measured flux density at 4.7 GHz, is the redshift, is the average spectral index at 4.7 GHz, and is the luminosity distance. For calculation of luminosity distances, we used the CDM cosmology with km s-1 Mpc-1, , and (Planck Collaboration, 2016). The uncertainties of the parameters (, , and ) are calculated as the square root of the sum of the squared errors of the parameters included in the formula.
| Blazar type | |||||
|---|---|---|---|---|---|
| FSRQ | 0.09 (0.41) | 0.22 (0.44) | 0.13 (0.45) | 0.16 (0.38) | 0.11 (0.52) |
| BL Lac | 0.03 (0.46) | 0.21 (0.54) | 0.17 (0.52) | 0.17 (0.60) | 0.46 (0.64) |
| Blaz.un.t. | 0.10 (0.48) | 0.31 (0.49) | 0.21 (0.56) | 0.01 (0.55) | 0.22 (0.70) |
The content of the main table, measured RATAN-600 flux densities, and calculated parameters (, , and ) could be downloaded (e.g., as a CSV format text file) using the “Export main table and RATAN-600 data” button. On the website there is also the “Help” button, where the description of the catalogue, data, and all the tools are given.
5 THE RADIO PROPERTIES OF BLAZARS IN THE CATALOGUE
This section briefly describes some radio properties of the blazar subsamples in the catalogue. The spectral indices and radio variability were calculated based on observed data obtained using one instrument and at four–six frequencies simultaneously, which minimizes the influence of measurement inhomogeneities on the result. The median and average values of the redshift, flux density, and radio luminosity at 4.7 GHz for FSRQs, BL Lacs, and Blazars of uncertain type are presented in Table 5. The obtained radio properties of the subsamples reflect a wide range of blazar parameters and statistical differences between them.
5.1 Spectral Index
We analysed the averaged radio spectra of blazars compiled from the RATAN-600 quasi-simultaneous measurements over a time period from 2005 to 2022. The spectral indices were calculated using Equation 1. Their median and average values at five frequency intervals are listed in Table 6 for three blazar subsamples. The median values of are , , and for the FSRQ, BL Lac, and Blaz.un.t. types respectively. For the median values are equal to , , and respectively.
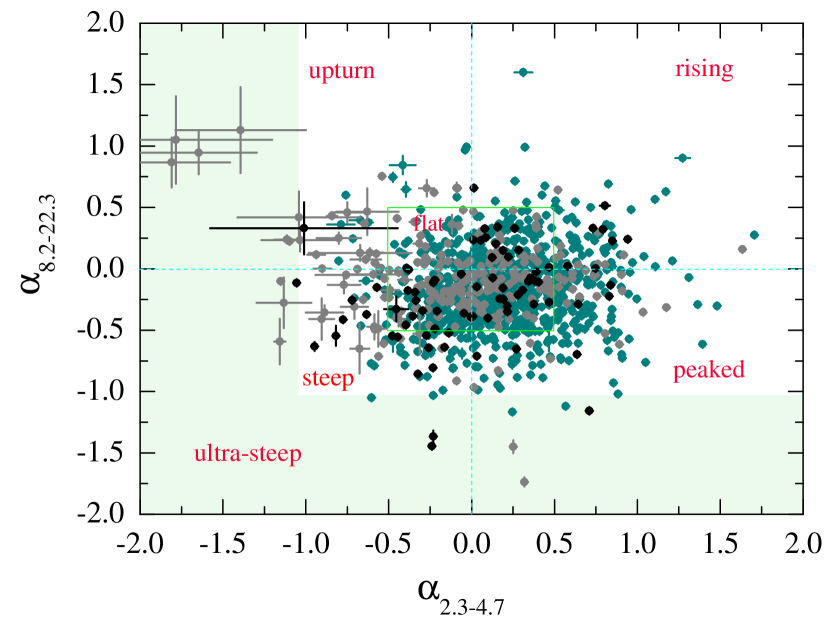
Figure 7 presents the spectral type distribution in a convenient form of a two-colour diagram in which the low-frequency spectral index is plotted against the high-frequency index. The green square corresponds to the spectral index range from to (“blazar box”). The light green color indicates the area of ultra-steep spectra with . The other areas are marked according to the spectral classification criteria from Table 7.
The vast majority of blazars have a flat (876, 50.5%) or rising (476, 27.5%) radio spectrum. We found a small part of blazars (26, 1.5%) having peaked radio spectra with a turnover in their average radio spectrum (Table 7) and spectral indices and , which correspond to the slopes of classical gigahertz-peaked spectrum (GPS) sources (de Vries et al., 1997). A very small number of these blazars (2.2%) have ultra-steep radio spectra with .
| Type | Criteria | (%) | |
|---|---|---|---|
| Flat | 876 | (50.5) | |
| Peaked | , | 26 | (1.5) |
| Rising | 476 | (27.5) | |
| Upturn | , | 109 | (6.3) |
| Steep | 208 | (12) | |
| Ultra-steep | 39 | (2.2) | |
5.2 Variability
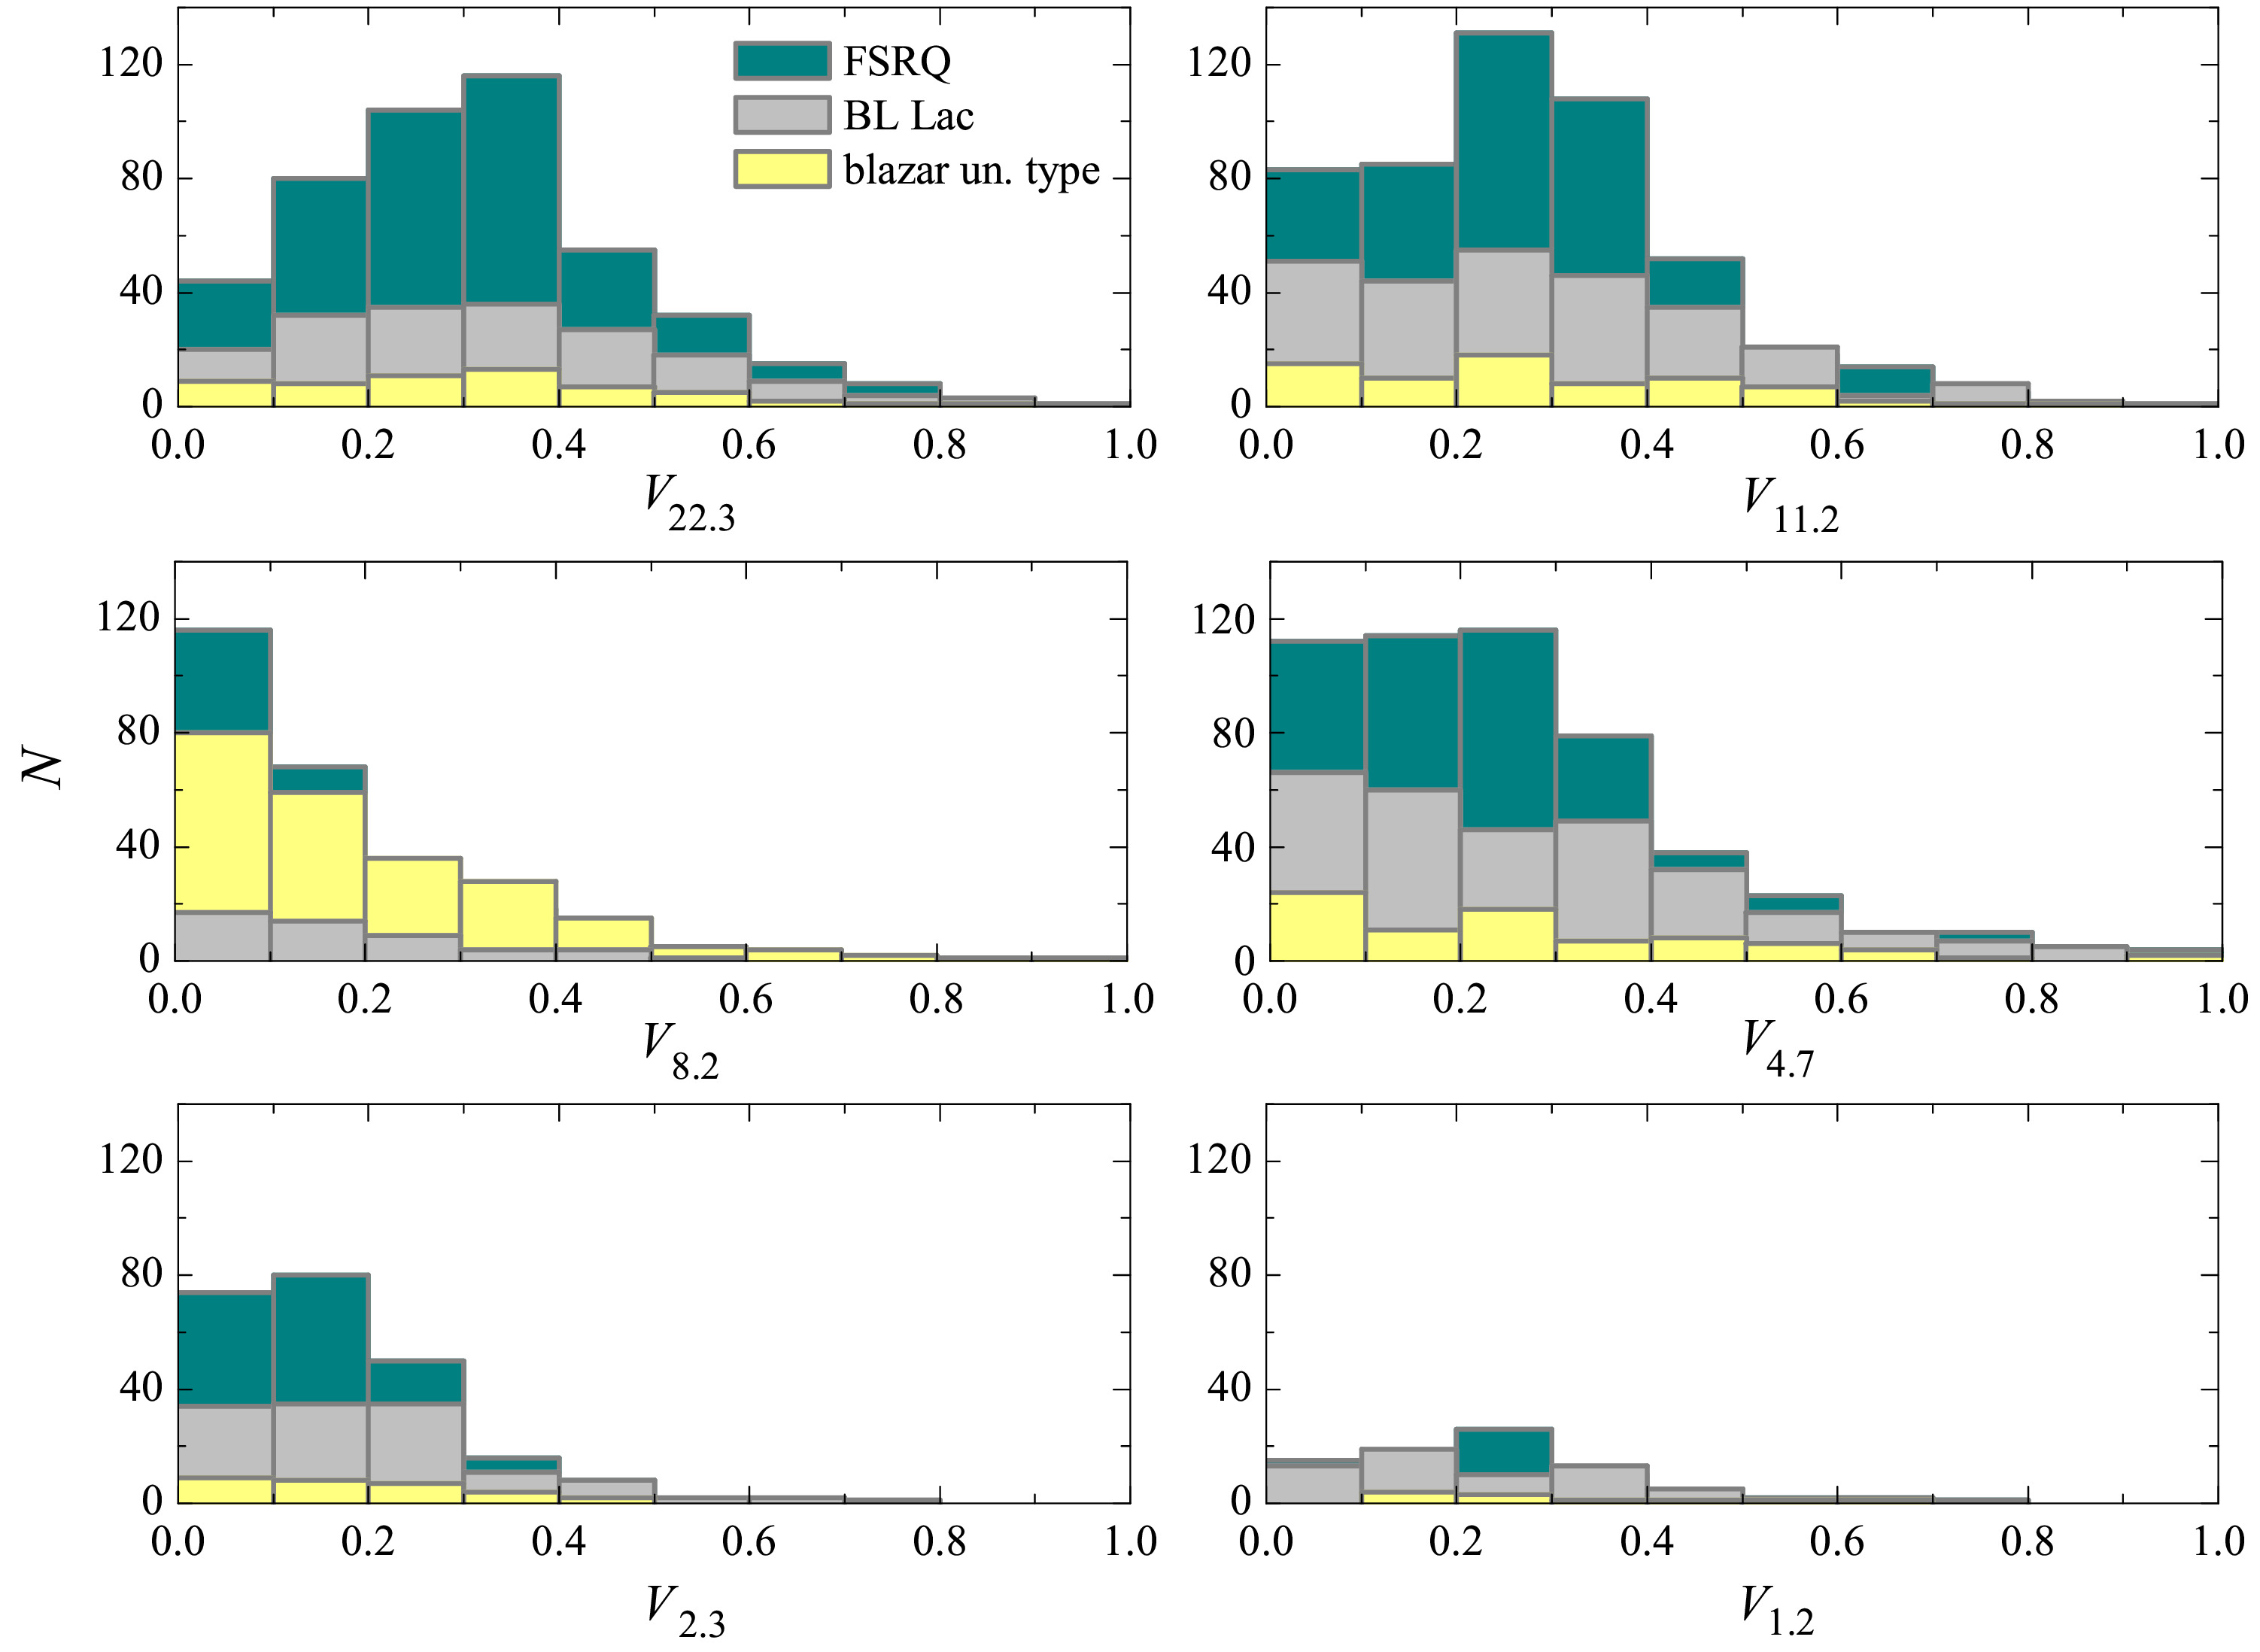
The variability indices (Equation 2) were calculated using quasi-simultaneous RATAN-600 measurements at frequencies of 2.3, 4.7, 7.7/8.2, 11.2, and 21.7/22.3 GHz. The distributions for different subclasses are shown in Fig. 8. The average values of for each type are shown in Table 8. The higher variability indices was found at 22.3 GHz. On average, the BL Lac blazars are more variable at all frequencies. The average and median values at 22.3 GHz span from 0.07 to 0.30 with maximum values of 1.77, 0.90, and 0.89 for FSRQ, BL Lac, and Blaz.un.t.respectively. The maximum variability indices 0.90–1.77 were estimated for FSRQ and BL Lac blazars at 4.7–22.3 GHz. For the Blaz.un.t. subsample the maximum variability indices are slightly lower at almost all frequencies, =0.53–0.89.
| Blazar type | |||||
|---|---|---|---|---|---|
| FSRQ | 0.28 (0.21) | 0.23 (0.23) | 0.10 (0.14) | 0.23 (0.20) | 0.15 (0.12) |
| BL Lac | 0.30 (0.23) | 0.27 (0.20) | 0.17 (0.18) | 0.25 (0.25) | 0.17 (0.15) |
| Blaz.un.t. | 0.26 (0.22) | 0.26 (0.20) | 0.15 (0.14) | 0.15 (0.14) | 0.16 (0.14) |
6 Summary
We present the online “RATAN-600 multi-frequency catalogue of blazars” (BLcat) that summarises radio continuum measurements of more than 1700 objects in the frequency range from tens of MHz up to hundreds of GHz. The quasi-simultaneous data at 1.2–22.3 GHz are represented by the RATAN-600 measurements since 2005, and additional literature data from external sources cover a time period of 30–40 years.
The catalogue provides estimation of flux densities, spectral indices, variability, and radio luminosity for the large blazars list. It is a useful tool for analysing the flare activity and synchrotron radio spectra of AGNs. The catalogue is regularly updated with new RATAN-600 and literature measurements.
The users who will make use of the RATAN-600 multi-frequency catalogue of blazars in a publication are kindly requested to acknowledge the source of the data by referencing this paper.
Acknowledgements
This work is supported in the framework of the national project “Science” by the Ministry of Science and Higher Education of the Russian Federation under the contract 075-15-2020-778. The observations were carried out with the RATAN-600 scientific facility. Observations with RATAN-600 are supported by the Ministry of Science and Higher Education of the Russian Federation. This research has made use of the CATS database, operated at SAO RAS, Russia. This research has made use of the Roma-BZCAT NASA/IPAC Extragalactic Database (NED), which is operated by the Jet Propulsion Laboratory, California Institute of Technology, under contract with the National Aeronautics and Space Administration. This research has made use of the SIMBAD database, operated at CDS, Strasbourg, France
References
- Ajello et al. (2020) Ajello M., et al., 2020, ApJ, 892, 105
- Aller et al. (1985) Aller H. D., Aller M. F., Latimer G. E., Hodge P. E., 1985, ApJS, 59, 513
- Aller et al. (1992) Aller M. F., Aller H. D., Hughes P. A., 1992, ApJ, 399, 16
- Altschuler (1986) Altschuler D. R., 1986, A&AS, 65, 267
- Angelakis et al. (2019) Angelakis E., et al., 2019, A&A, 626, A60
- Baars et al. (1977) Baars J. W. M., Genzel R., Pauliny-Toth I. I. K., Witzel A., 1977, A&A, 61, 99
- Becker et al. (1991) Becker R. H., White R. L., Edwards A. L., 1991, ApJS, 75, 1
- Condon et al. (1998) Condon J. J., Cotton W. D., Greisen E. W., Yin Q. F., Perley R. A., Taylor G. B., Broderick J. J., 1998, AJ, 115, 1693
- Douglas et al. (1996) Douglas J. N., Bash F. N., Bozyan F. A., Torrence G. V., Wolfe C., 1996, AJ, 111, 1945
- Gordon et al. (2020) Gordon Y. A., et al., 2020, Research Notes of the American Astronomical Society, 4, 175
- Gregory & Condon (1991) Gregory P. C., Condon J. J., 1991, ApJS, 75, 1011
- Healey et al. (2007) Healey S. E., Romani R. W., Taylor G. B., Sadler E. M., Ricci R., Murphy T., Ulvestad J. S., Winn J. N., 2007, ApJS, 171, 61
- Hovatta & Lindfors (2019) Hovatta T., Lindfors E., 2019, New Astronomy Reviews, 87, 101541
- Hovatta et al. (2021) Hovatta T., et al., 2021, A&A, 650, A83
- Hurley-Walker et al. (2017) Hurley-Walker N., et al., 2017, MNRAS, 464, 1146
- IceCube Collaboration et al. (2018) IceCube Collaboration et al., 2018, Science, 361, 147
- Intema et al. (2017) Intema H. T., Jagannathan P., Mooley K. P., Frail D. A., 2017, A&A, 598, A78
- Kiikov et al. (2002) Kiikov S. O., Mingaliev M. G., Stolyarov V. A., Stupalov M. S., 2002, Bulletin of the Special Astrophysics Observatory, 54, 5
- Korolkov & Pariiskii (1979) Korolkov D. V., Pariiskii I. N., 1979, Sky & Telesc., 57, 324
- Kovalev et al. (1999) Kovalev Y. Y., Nizhelsky N. A., Kovalev Y. A., Berlin A. B., Zhekanis G. V., Mingaliev M. G., Bogdantsov A. V., 1999, A&AS, 139, 545
- Kovalev et al. (2020) Kovalev Y. A., et al., 2020, Advances in Space Research, 65, 745
- Kuehr et al. (1981) Kuehr H., Witzel A., Pauliny-Toth I. I. K., Nauber U., 1981, A&AS, 45, 367
- Lacy et al. (2020) Lacy M., et al., 2020, PASP, 132, 035001
- Lazio et al. (2001) Lazio T. J. W., Waltman E. B., Ghigo F. D., Fiedler R. L., Foster R. S., Johnston K. J., 2001, ApJS, 136, 265
- Massardi et al. (2008) Massardi M., et al., 2008, MNRAS, 384, 775
- Massardi et al. (2011) Massardi M., Bonaldi A., Bonavera L., López-Caniego M., de Zotti G., Ekers R. D., 2011, MNRAS, 415, 1597
- Massaro et al. (2009) Massaro E., Giommi P., Leto C., Marchegiani P., Maselli A., Perri M., Piranomonte S., Sclavi S., 2009, A&A, 495, 691
- Massaro et al. (2015) Massaro E., Maselli A., Leto C., Marchegiani P., Perri M., Giommi P., Piranomonte S., 2015, Ap&SS, 357, 75
- Mauch et al. (2003) Mauch T., Murphy T., Buttery H. J., Curran J., Hunstead R. W., Piestrzynski B., Robertson J. G., Sadler E. M., 2003, MNRAS, 342, 1117
- Mingaliev et al. (2008) Mingaliev M. G., Sotnikova Y. V., Bursov N. N., Kardashev N. S., Larionov M. G., 2008, VizieR Online Data Catalog, p. J/AZh/84/387
- Mingaliev et al. (2012a) Mingaliev M. G., Sotnikova Y. V., Torniainen I., Tornikoski M., Udovitskiy R. Y., 2012a, VizieR Online Data Catalog, pp J/A+A/544/A25
- Mingaliev et al. (2012b) Mingaliev M. G., Sotnikova Y. V., Torniainen I., Tornikoski M., Udovitskiy R. Y., 2012b, A&A, 544, A25
- Mingaliev et al. (2014) Mingaliev M. G., Sotnikova Y. V., Udovitskiy R. Y., Mufakharov T. V., Nieppola E., Erkenov A. K., 2014, A&A, 572, A59
- Mingaliev et al. (2015) Mingaliev M. G., Sotnikova Y. V., Mufakharov T. V., Erkenov A. K., Udovitskiy R. Y., 2015, VizieR Online Data Catalog (other), 0330, J/other/AstBu/70
- Mingaliev et al. (2017a) Mingaliev M. G., et al., 2017a, VizieR Online Data Catalog, p. J/AN/338/700
- Mingaliev et al. (2017b) Mingaliev M., et al., 2017b, Astronomische Nachrichten, 338, 700
- Mitchell et al. (1994) Mitchell K. J., Dennison B., Condon J. J., Altschuler D. R., Payne H. E., O’Dell S. L., Broderick J. J., 1994, ApJS, 93, 441
- Mufakharov et al. (2015a) Mufakharov T. V., Mingaliev M. G., Sotnikova Y. V., Ya. V. N., Erkenov A. K., 2015a, VizieR Online Data Catalog, p. J/MNRAS/450/2658
- Mufakharov et al. (2015b) Mufakharov T. V., Sotnikova Y. V., Erkenov A. K., Mingaliev M. G., 2015b, VizieR Online Data Catalog (other), 0330, J/other/AstBu/69
- Nieppola et al. (2006) Nieppola E., Tornikoski M., Valtaoja E., 2006, A&A, 445, 441
- Nieppola et al. (2009) Nieppola E., Hovatta T., Tornikoski M., Valtaoja E., Aller M. F., Aller H. D., 2009, AJ, 137, 5022
- Ochsenbein et al. (2000) Ochsenbein F., Bauer P., Marcout J., 2000, A&AS, 143, 23
- Ott et al. (1994) Ott M., Witzel A., Quirrenbach A., Krichbaum T. P., Standke K. J., Schalinski C. J., Hummel C. A., 1994, A&A, 284, 331
- Padovani et al. (2017) Padovani P., et al., 2017, A&ARv, 25, 2
- Parijskij (1993) Parijskij Y. N., 1993, IEEE Antennas and Propagation Magazine, 35, 7
- Perley & Butler (2013) Perley R. A., Butler B. J., 2013, ApJS, 204, 19
- Perley & Butler (2017) Perley R. A., Butler B. J., 2017, ApJS, 230, 7
- Planck Collaboration (2016) Planck Collaboration 2016, A&A, 594, A13
- Plavin et al. (2020) Plavin A., Kovalev Y. Y., Kovalev Y. A., Troitsky S., 2020, ApJ, 894, 101
- Reuter et al. (1997) Reuter H. P., et al., 1997, A&AS, 122, 271
- Richards et al. (2011) Richards J. L., et al., 2011, ApJS, 194, 29
- Salonen et al. (1987) Salonen E., et al., 1987, A&AS, 70, 409
- Seielstad et al. (1983) Seielstad G. A., Pearson T. J., Readhead A. C. S., 1983, PASP, 95, 842
- Sotnikova et al. (2019a) Sotnikova Y. V., Kovalev Y. A., Erkenov A. K., 2019a, Astrophysical Bulletin, 74, 497
- Sotnikova et al. (2019b) Sotnikova Y. V., Mufakharov T. V., Majorova E. K., Mingaliev M. G., Udovitskiy R. Y., Bursov N. N., Semenova T. A., 2019b, VizieR Online Data Catalog (other), 0330, J/other/AstBu/74
- Tabara & Inoue (1980) Tabara H., Inoue M., 1980, A&AS, 39, 379
- Taylor et al. (1996) Taylor G. B., Vermeulen R. C., Readhead A. C. S., Pearson T. J., Henstock D. R., Wilkinson P. N., 1996, ApJS, 107, 37
- Teraesranta et al. (1998) Teraesranta H., et al., 1998, A&AS, 132, 305
- Terasranta et al. (1992) Terasranta H., et al., 1992, A&AS, 94, 121
- Teräsranta et al. (2004) Teräsranta H., et al., 2004, A&A, 427, 769
- Tsybulev (2011) Tsybulev P. G., 2011, Astrophysical Bulletin, 66, 109
- Tsybulev et al. (2018) Tsybulev P. G., Nizhelskii N. A., Dugin M. V., Borisov A. N., Kratov D. V., Udovitskii R. Y., 2018, Astrophysical Bulletin, 73, 494
- Udovitskiy et al. (2016) Udovitskiy R. Y., Sotnikova Y. V., Mingaliev M. G., Tsybulev P. G., Zhekanis G. V., Nizhelskij N. A., 2016, Astrophysical Bulletin, 71, 496
- Urry & Padovani (1995) Urry C. M., Padovani P., 1995, PASP, 107, 803
- Verkhodanov (1997) Verkhodanov O. V., 1997, Astronomical Data Analysis Software and Systems VI, A.S.P. Conference Series, 125, 46
- Verkhodanov et al. (1997) Verkhodanov O. V., Trushkin S. A., Chernenkov V. N., 1997, Baltic Astronomy, 6, 275
- Verkhodanov et al. (2005) Verkhodanov O. V., Trushkin S. A., Andernach H., Chernenkov V. N., 2005, Bulletin of the Special Astrophysics Observatory, 58, 118
- Verkhodanov et al. (2009) Verkhodanov O. V., Trushkin S. A., Andernach H., Chernenkov V. N., 2009, Data Science Journal, 8, 34
- Villata et al. (2002) Villata M., et al., 2002, Mem. Soc. Astron. Italiana, 73, 1191
- White et al. (1997) White R. L., Becker R. H., Helfand D. J., Gregg M. D., 1997, ApJ, 475, 479
- Wright et al. (1990) Wright A. E., Wark R. M., Troup E., Otrupcek R., Hunt D., Cooke D. J., 1990, Publ. Astron. Soc. Australia, 8, 261
- Wright et al. (1996) Wright A. E., Griffith M. R., Hunt A. J., Troup E., Burke B. F., Ekers R. D., 1996, ApJS, 103, 145
- de Vries et al. (1997) de Vries W. H., Barthel P. D., O’Dea C. P., 1997, A&A, 321, 105