Deep Synoptic Array science I: discovery of the host galaxy of FRB 20220912A
Abstract
We report the detection and interferometric localization of the repeating fast radio burst (FRB) source FRB 20220912A during commissioning observations with the Deep Synoptic Array (DSA-110). Two bursts were detected from FRB 20220912A, one each on 2022 October 18 and 2022 October 25. The best-fit position is (R.A. J2000, decl. J2000) = (23:09:04.9, 48:42:25.4), with a 90% confidence error ellipse of ″ and ″ in right ascension and declination respectively. The two bursts have disparate polarization properties and temporal profiles. We find a Faraday rotation measure that is consistent with the low value of rad m-2 reported by CHIME/FRB. The DSA-110 localization overlaps with the galaxy PSO J347.270248.7066 at a redshift , which we identify as the likely host. PSO J347.270248.7066 has a stellar mass of approximately , modest internal dust extinction, and a star-formation rate likely in excess of yr-1. The host-galaxy contribution to the dispersion measure is likely pc cm-3. The FRB 20220912A source is therefore likely viewed along a tenuous plasma column through the host galaxy.
1 Introduction
Eight repeating sources of fast radio bursts (FRBs) have been localized to host galaxies (Chatterjee et al., 2017; Marcote et al., 2020; Macquart et al., 2020; Bhardwaj et al., 2021; Kirsten et al., 2022; Ravi et al., 2022a; Bhandari et al., 2022; Niu et al., 2022). It is not yet established whether there are astrophysical differences between the progenitors of the few FRB sources that have been observed to repeat, and the many FRB sources that have not yet been observed to repeat. Although it is likely that most FRB sources repeat at some level (Ravi, 2019), repeating sources are different from apparent non-repeaters in their burst morphologies and bandwidths (Pleunis et al., 2021), and in their repetition rates (James et al., 2020). No significant differences between the host galaxies of repeaters and apparent non-repeaters are yet evident (Bhandari et al., 2022). The association of persistent radio sources with some repeaters may hint at a unique progenitor class (Law et al., 2022).
Repeating FRB sources offer the best means to identify the objects and mechanisms that can produce radio bursts with energy outputs in excess of erg on s timescales. This is particularly the case when observations of repeaters are placed in the rich context of milliarcsecond-scale localizations. For example, the association of FRB 20121102A with a star-forming region and compact persistent radio source within its dwarf host (Bassa et al., 2017), combined with its extreme and variable Faraday rotation measure (RM; Michilli et al., 2018), are suggestive of a young compact object within its birth supernova remnant (Chen et al., 2022, and references therein). The detection of microstructure in bursts from FRB 20200120E (Majid et al., 2021; Nimmo et al., 2022), together with its association with a globular cluster of M81 (Kirsten et al., 2022), suggest an origin in a recycled pulsar system. Despite its origin in an inter-arm region of its late-type host galaxy (Xu et al., 2022), FRB 20201124A illuminates extreme variability of its sub-AU magneto-ionic environment, suggestive of a magnetar/Be-star binary (Wang et al., 2022). Such observational diversity among the small sample of just eight localized sources motivates the characterization of a larger sample of host galaxies and environments of repeating FRBs.
FRB 20220912A is an intensely active repeating FRB source discovered by the CHIME/FRB collaboration (McKinven & Chime/Frb Collaboration, 2022). 12 bursts were detected in the 400–800 MHz band between 2022 September 12 and 2022 October 15. Throughout this paper, unless otherwise indicated, we adopt the dispersion measure (DM) and RM derived by CHIME/FRB from the brightest reported burst, 219.46 pc cm-3 and rad m-2 respectively. On 2022 October 18, Herrmann (2022) reported the detection of 12 bursts within 49 hr of exposure at teh Stockert telescope, with fluences Jy ms in the 1330–1430 MHz band. A burst rate in excess of 400 hr-1 was found in the 1000–1500 MHz band in observations with the Five hundred meter Aperture Spherical Telescope (FAST; Zhang et al., 2022), and the Arecibo 12-m telescope was used to detect the source at 2.3 GHz (Perera et al., 2022). Deep limits on transient optical emission coincident with several radio bursts from FRB 20220912A were reported by Hiramatsu et al. (2022).
Here we report the detection and interferometric localization of FRB 20220912A during commissioning of the Deep Synoptic Array (DSA-110). Preliminary results from this work were reported via Astronomer’s Telegram (Ravi et al., 2022b, c, d). In §2 we describe the DSA-110 (§2.1) and observations obtained of FRB 20220912A (§2.2), and present the detections (§2.3) and localizations (§2.4) of two bursts. In §3 we present observations of the likely host galaxy of FRB 20220912A, PSO J347.270248.7066, obtained at the W. M. Keck Observatory, together with modeling of fundamental properties of the host. We summarize and discuss implications of these results in §4. Throughout we adopt a flat cosmology with parameters derived by Planck Collaboration et al. (2020), including a Hubble constant of km s-1 Mpc-1, and a matter-density parameter of .
2 DSA-110 observations
2.1 Description of the DSA-110
The DSA-110111https://deepsynoptic.org is a radio interferometer hosted at the Owens Valley Radio Observatory (OVRO). During the observations presented herein, the array was being commissioned with data from 63 antennas being processed. A full description will be presented in Ravi et al. (in prep.), and we here include essential information to support the observational results for FRB 20220912A.
| Parameter | Value |
|---|---|
| Dish diameter (m) | 4.65 |
| Central frequency (MHz) | 1405 |
| Primary beam FWHM (degrees) | 3.4 |
| Bandwidth (MHz) | 187.5 |
| Search SEFD (Jy)aaSystem-equivalent flux density (SEFD) at boresight. | 140 |
| Search-beam channel width (kHz) | 244.141 |
| Search-beam time resolution (s) | 262.144 |
| Search-beam width (arcsec.)bbThis is in the east-west direction. The search beams are fan beams formed with an east-west array, and their sizes are only constrained by the primary beam in the north-south direction. | 134 |
| Number of search beams | 256 |
| Search-beam spacing (arcmin.) | 1 |
| Maximum baseline (m) | 2500 |
| Synthesized beamccMajor and minor-axis diameters at a declination of , assuming natural weighting. The position angle is measured east of north. | 35.4″17.6″@ |
Essential specifications of the DSA-110 at the time of these observations are presented in Table 1. Each DSA-110 antenna is automatically steerable in elevation only, and observes on the meridian. Each antenna is equipped with dual orthogonal linearly polarized receivers and ambient temperature amplifiers that deliver a typical system temperature of 25 K (Weinreb & Shi, 2021). A real-time FRB search is enabled through the coherent combination of 48 antennas located in an east-west line, with a maximum spacing of 400 m. Total-intensity data in 256 coherent fan-shaped search beams are inspected in real time for FRBs, using a modified version of the heimdall software (Barsdell et al., 2012). Triggers from FRB candidates result in the storage of post-filterbank voltage data from the 48 search antennas and 15 outrigger antennas. The 4-bit voltage data are recorded for 61440 samples at 32.768 s time resolution in kHz channels.
Data from all antennas are also continuously correlated in real time in the two linear polarizations only (no cross-polarization products), resulting in the production of visibility data fringestopped on the meridian at the pointing center. Each FRB candidate is accompanied by the storage of 2 hr of visibility data surrounding the trigger time. These visibility data are used to solve for antenna-based complex gains at the trigger time using a sky model. Any Jy calibrator source from the VLA calibrator manual that passes within the primary beam, represents % of the flux within the beam, and is classified as ‘P’ or ‘S’ for the VLA C configuration, is also used to trigger the storage of 10 min of visibility data fringestopped at the calibrator location. These visibility data are used to derive antenna-based bandpass calibrations for the beamformer, and for post-processing of the voltage data.
2.2 Observations of FRB 20220912A
Following the report on FRB 20220912A by CHIME/FRB (McKinven & Chime/Frb Collaboration, 2022) on 2022 October 15, we began a campaign of near-daily observations of transits of the source with the DSA-110. The array was pointed at a declination of 48.7∘. We report on the period between 2022 October 15 and 2022 October 25, during which we observed seven transits of FRB 20220912A and detected two bursts with the real-time system. During each transit the source was within the field of view of the search beams for 25.9 min. As these observations were undertaken during science commissioning, and the precise search completeness was not quantified, we do not quote a derived burst rate from FRB 20220912A.
When not observing FRB 20220912A, the DSA-110 was primarily pointed at a declination of 71.6∘. Daily bandpass calibration was made possible using observations of the source 3C309.1 (J14597140), which has a flux density of 7.6 Jy at a wavelength of 20 cm according to the VLA calibrator manual. Approximate polarization calibration was made possible using voltage data obtained on the standard sources 3C48 and 3C286 (Perley & Butler, 2013) on 2022 October 20.
2.3 Two burst detections
We detected bursts from FRB 20220912A on 2022 October 18 (hereafter Burst 1) and on 2022 October 25 (hereafter Burst 2), on modified Julian dates (MJDs) 59870.22278235404 and 59877.203253573236 respectively. The arrival times correspond to 1530 MHz and the DSA-110 reference position of longitude, latitude. Burst 1 was detected with a signal to noise ratio (S/N) of 12.2 and an approximate DM of 228 pc cm-3, and Burst 2 was detected with an S/N of 8.5 and an approximate DM of 223 pc cm-3. Despite the differences between these DMs and the structure-optimized DM reported by CHIME/FRB (McKinven & Chime/Frb Collaboration, 2022), we associated these detections with FRB 20220912A based on the correspondance between the CHIME/FRB position and the detection search-beam. We attribute these differences to the time-frequency drifting common in repeating FRBs (e.g., Hessels et al., 2019).
Voltage data on each burst were coherently combined in the direction of the detection beams using the 48 core antennas only. Time-frequency data sets in all four Stokes parameters were formed with the native time and frequency resolutions. Incoherent dedispersion at the native time and frequency resolutions was applied. Flattening of the bandpasses in each received polarization was done on a per-antenna basis using observations of 3C309.1 on the same sidereal days as the burst detections. Voltage data obtained during transits of 3C48 and 3C286 were used for polarization calibration under the ideal feed assumption; coupling between the orthogonal polarizations is detected at only the percent level for DSA-110 (Sherman et al., in prep.). Full-Stokes spectra towards 3C48 and 3C286 were formed using the same beamforming procedure as applied to the burst data. Spectra on 3C48 were used to verify the equalization of the amplitude gains in the two linear polarizations, and spectra on 3C286 were used to measure the frequency-dependent phase between the two polarizations.
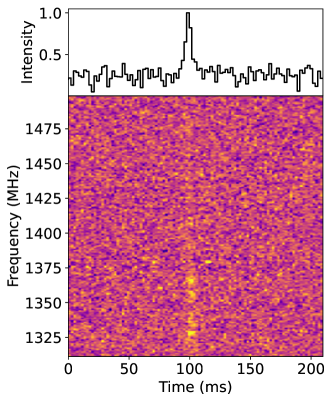
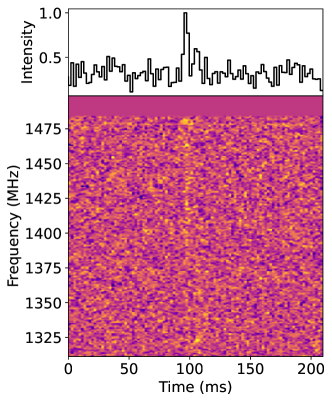
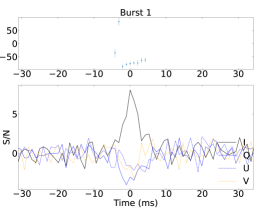
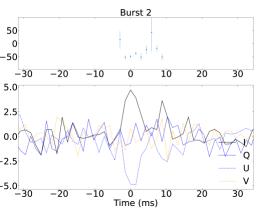
Total intensity dynamic spectra and temporal profiles are shown in Figure 1, and full-Stokes temporal profiles are shown in Figure 2. Voltage data in one out of 16 sub-bands for Burst 2 were corrupted, resulting in the reduced bandwidth evident in Figure 1. The two bursts exhibit different morphologies and polarization characteristics. Burst 1 exhibits a single component whereas Burst 2 exhibits two components with visually different total-intensity spectra. For Burst 1, we measure a linear polarization fraction of and a circular polarization fraction of . For Burst 2, we measure a linear polarization fraction of , with no significant circular polarization, and a different polarization position angle. This is consistent with the report in Zhang et al. (2022) of substantially varying polarization properties between bursts from FRB 20220912A. Although these data have been corrected for an RM of rad m-2 (McKinven & Chime/Frb Collaboration, 2022), an independent RM search of each burst revealed measurements consistent with this value. These data do not have sufficiently high S/N for more detailed inferences to be made.
2.4 Interferometric localization
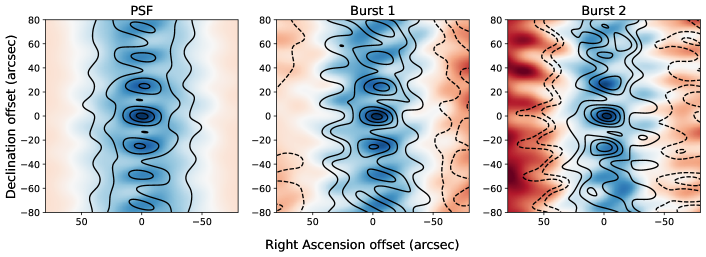
We were able to derive arcsecond-scale localizations for the two bursts detected with DSA-110 from FRB 20220912A. The voltage data obtained for each burst were dedispersed with DMs that maximized the S/N, and correlation products in each orthogonal linear polarization were formed and integrated over 8.36 ms centered on each burst arrival time. These correlation products were written into Common Astronomy Software Applications (CASA; THE CASA TEAM et al., 2022) Measurement Sets (MSs), and all further processing was done using CASA version 5.4.1. Bandpass calibrations were obtained using 10-min observations of 3C309.1 on the same sidereal days as the burst detections, and assuming a flat-spectrum point-source model. So-called “field” MSs were then generated using 10 min of visibility data surrounding the arrival times of each burst, fringestopped at an hour angle of 0 at the midpoint of the observation. Sky models based on the NRAO VLA Sky Survey (NVSS; Condon et al., 1998) were inserted into the field MSs, including all sources brighter than 30 mJy of any size. Extended sources were modeled as elliptical Gaussians. After bandpass calibration, the sky models were used to derive complex gain solutions for each antenna from the field MSs. The bandpass and gain calibration tables were then applied to the burst MSs. Wide-field images of the burst MSs 4.5∘ in diameter with 4100 pixels per side were made using the wsclean software (Offringa et al., 2014) to crudely identify the locations of the bursts. The CASA task tclean was then used to make higher resolution images 5 arcmin and 1000 pixels per side centered on the approximate FRB positions; no deconvolution was applied. In all imaging, natural weighting was used, and baselines shorter than 40 m were discarded due to spurious correlated power on short baselines. The localizations were derived by fitting two-dimensional Gaussians in the image plane to the central lobe of the resulting point-spread function (PSF) in the burst images.
The best-fit position for Burst 1 was (R.A. J2000, decl. J2000) = (23:09:04.90, 48:42:25.4), and the best-fit position for Burst 2 was (R.A. J2000, decl. J2000) = (23:09:04.88, 48:42:25.6).222Ravi et al. (2022c) issued a correction to the preliminary position for Burst 1 quoted in Ravi et al. (2022b). The tests on PSR J19351616 described here revealed an error in the calculation of absolute time in the voltage imaging pipeline (Ravi et al., 2022c). This error resulted in a systematic error in the source positions that was not present in the positions measured by the field imaging pipeline. The tests reported here confirm that both pipelines produce consistent astrometry. Images, with no deconvolution applied, of each burst together with the PSF are shown in Figure 3. In the widefield wsclean images, the image S/N values for the bursts were 11 and 7, found after 10 image-plane CLEAN iterations and measured far from the sources. As the image of Burst 2 is of somewhat worse quality than that of Burst 1, we adopt the position of Burst 1 as the best-fit DSA-110 position of FRB 20220912A.
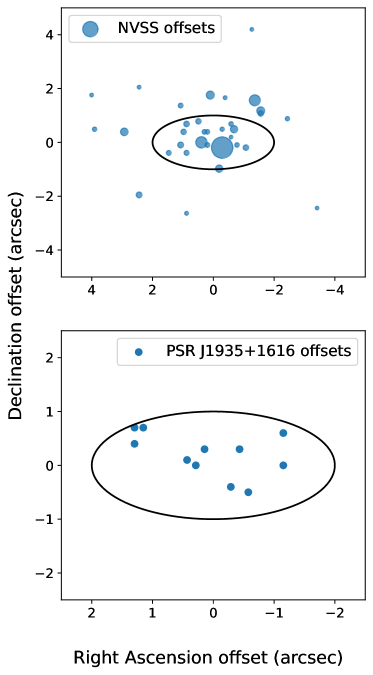
We verified the astrometric accuracy of our results in four ways. First, we compared images of the primary-beam full-width half-maximum (FWHM) areas made with the entire 2.1 s voltage data sets, and with the field MSs, and ensured that bright sources were detected at consistent positions. We then checked the efficacy of the gain calibrations derived from the field MSs by checking the positions of bright ( mJy) compact (″) NVSS sources within the primary-beam FWHM in images of these MSs against NVSS catalog positions. The results are shown in the top panel of Figure 4. Some offsets in derived positions due to the differing synthesized-beam shapes of the DSA-110 and NVSS are expected for resolved sources, and so this check is best used to search for systematic errors in the gain calibrations rather than quantify the localization accuracy. Instead, we checked the absolute astrometry by forming MSs on and imaging two compact bright sources from the Radio Fundamental Catalog (rfc_2022c), J22584937 and J23254806. These sources are close in declination to FRB 20220912A and thus transit through similar portions of the DSA-110 primary beam, and are close in right ascension and thus could be calibrated using gains from the field MSs. The derived position offsets were 0.7″ and 0.4″ respectively from the rfc_2022c positions on 2022 October 18, and 0.5″ and 0.6″ respectively on 2022 October 25. We also conducted observations of the bright pulsar J19351616 over three transits between 2022 October 22 and 2022 October 25, and performed a localization analysis on 11 automatically detected single pulses in exactly the same way as for the FRB 20220912A burst detections. The resulting offsets from the true position of PSR J19351616 (Manchester et al., 2005), corrected for proper motion, are shown in the bottom panel of Figure 4.
Given these tests, we find no evidence for systematic offsets or effects of non-Gaussian noise. We therefore quote the localization as measured along with a conservative theoretical estimate of the statistical uncertainty for a source with an image S/N of 10. Conservatively, the standard error in each coordinate is given by half the synthesized-beam FWHM (Reid et al., 1988). Each error is scaled by 2.14 (e.g., Condon et al., 1998) to derive diameters of the 90% confidence error ellipse. We quote an approximate 90% confidence error ellipse with diameters of 4″ in right ascension and 2″ in declination, as shown in Figure 4.
3 The host galaxy of FRB 20220912A
The DSA-110 position for FRB 20220912A overlaps just a single galaxy, PSO J347.270248.7066 (Figure 5). This galaxy, with an -band magnitude of 19.65 (Magnier et al., 2020), was also noted as a promising host by McKinven & Chime/Frb Collaboration (2022). We therefore consider PSO J347.270248.7066, hereafter PSO J34748, as the likely host galaxy of FRB 20220912A. For example, an analysis of galaxy detections in Pan-STARRS data near the DSA-110 position for FRB 20220912A with the Probabilistic Association of Transients to their Hosts (PATH; Aggarwal et al., 2021) with standard priors and a 50% chance of the host being unseen indicates a 5% false-association probability. In this section we present and interpret optical observations of PSO J34748. Fundamental parameters that we derive for this galaxy are given in Table 2.
3.1 Optical observations
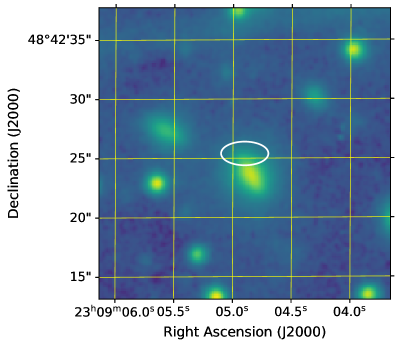
We obtained an optical image of PSO J34748 in the “Ellis-” filter of the Echellette Spectrograph and Imager on the Keck II telescope (Keck-II/ESI; Sheinis et al., 2002). Four 300 s exposures were obtained on 2022 October 24 at an airmass of 1.45 in conditions of ″ seeing. The data were bias-subtracted, flat-fielded, combined and registered using a custom astropy-based pipeline (Astropy Collaboration et al., 2022). An astrometric solution was obtained using the ten nearest unsaturated Gaia Data Release 3 (Gaia Collaboration et al., 2022) stars to the center of PSO J34748. The image is shown in Figure 5, and an approximate calibration against Gaia data implies a limiting magnitude of 26. There is no evidence for any object besides PSO J34748 within the DSA-110 localization region of FRB 20220912A.
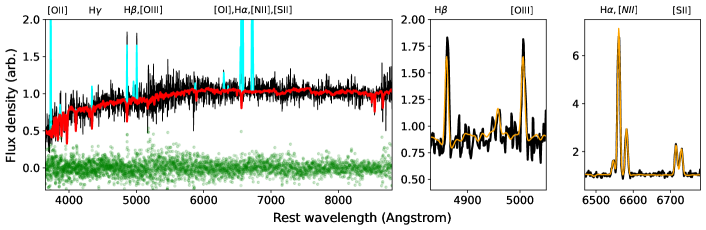
We obtained an optical spectrum of PSO J34748 using the Low-Resolution Imaging Spectrometer on the Keck I telescope (Keck-I/LRIS; Oke et al., 1995). A single 300 s exposure was obtained on 2022 October 19 in conditions of ″ seeing at an airmass of 1.15, using a 1″ slit at a position angle of 254.7∘. Light was split between the blue and red arms using the D560 dichroic, and dispersed using the 400/3400 grism on the blue arm and the 400/8500 grating on the red arm. The line FWHM was approximately 7 Å. The data were processed using standard techniques with the lpipe software (Perley, 2019); flux calibration was carried out using observations of the standard star BD28 4211. A spectrum was extracted from the central square arcsecond of the galaxy; this is shown in Figure 6.
Several emission lines are evident in the spectrum of PSO J34748, at a redshift of . We measure an H line flux of erg s-1 cm-2. The line ratios , , , and imply a composite BPT classification (Kauffmann et al., 2003; Kewley et al., 2006). A two-dimensional Sersic profile fit to the morphology of PSO J34748 in the Keck-II/ESI image, combined with the redshift measurement, indicates an effective radius of kpc. This is consistent with the size-mass relation for late-type galaxies (Shen et al., 2003). The H line flux implies a star-formation rate in the central square arcsecond of the galaxy of approximately 0.1 yr-1, assuming no AGN contribution, and using a conversion factor consistent with Heintz et al. (2020). We note that the Keck-I/LRIS two-dimensional spectrum shows evidence for off-nuclear H emission. Assuming a disk-like galaxy, the inclination derived from a half-light isophote fit is 51∘.
3.2 Host-galaxy modeling
| Parameter | Value |
|---|---|
| Redshift | 0.0771(1) |
| Luminosity distance (Mpc) | 362.4(1) |
| Effective radius (kpc) | 2.2(1) |
| 10.0(1) | |
| Internal | 0.5 |
| SFR ( yr-1) | |
| BPT classification | Composite |
We performed a fit to the optical spectrum of PSO J34748 using the latest iteration of the penalized pixel fitting code pPXF (Cappellari, 2022) to jointly fit the stellar continuum and nebular emission. We adopted the default MILES stellar templates and ran the fit using recommended procedures and parameters. The fit results are shown in Figure 6. An internal dust extinction corresponding to was found, and the fit results were also used for the redshift, line-flux and line-ratio measurements given above.
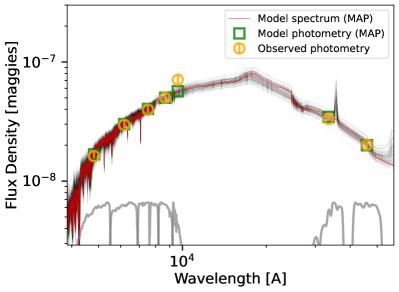
We then fit archival photometry of PSO J34748 from the Pan-STARRS (Magnier et al., 2020) and ALLWISE (Cutri et al., 2021) source catalogs using the Prospector stellar population synthesis modeling code (Johnson et al., 2021). Although the galaxy is marginally detected in 2MASS images, it is not cataloged and we thus did not consider photometry from 2MASS data. ALLWISE detections in bands and were used, together with all five Pan-STARRS bands. We ran Prospector using recommended techniques and standard priors with a ‘delay-tau’ parametric star-formation history, and sampled from the posterior using emcee (Foreman-Mackey et al., 2013). We fixed the internal dust attenuation to the pPXF result, and included a model for dust re-radiation in the likelihood. Results for the galaxy stellar mass and metallicity are given in Table 2. The star-formation history was poorly constrained by the fit. The spectral energy distribution of PSO J34748 is shown in Figure 7, together with the results from the Prospector analysis.
4 Summary and discussion
Two bursts detected by the DSA-110 from the repeating source FRB 20220912A have been used to localize it to (R.A. J2000, decl. J2000) = (23:09:04.90, 48:42:25.4). The two bursts have disparate polarization properties. The 90% confidence error ellipse is ″ and ″ in right ascension and declination respectively. The localization is consistent with a single host galaxy, PSO J347.270248.7066, at . The galaxy has a stellar mass of , and an effective radius of kpc. Nebular emission lines from the nucleus of this galaxy indicates a “composite” BPT classification.
The DM contributed by the FRB host galaxy along its sightline is low. The extragalactic DM, , of FRB 20220912A is approximately 85 pc cm-3 (Cordes & Lazio, 2002; Yao et al., 2017), assuming a modest contribution from the Milky Way halo of 10 pc cm-3 (Keating & Pen, 2020). If we assume that 70% of cosmic baryons contribute to the intergalactic DM of FRB 20220912A, the predicted for is 55 pc cm-3, implying a host DM contribution of 30 pc cm-3. The 90% confidence lower limit on using the model333The model is implemented in https://github.com/FRBs/FRB. for presented in Macquart et al. (2020) is 32 pc cm-3, implying a 90% confidence upper limit on the host DM of 53 pc cm-3.
The host galaxy of FRB 20220912A appears unremarkable in the context of FRB hosts, repeating or so far non-repeating (Bhandari et al., 2022). The low host DM of FRB 20220912A implies a tenuous plasma column towards the source within the host. The small magnitude of the RM reported by McKinven & Chime/Frb Collaboration (2022) and confirmed by us, consistent with a negligible extragalactic RM of rad m-2, is consistent with the low host DM. The small RM also suggests that the variable polarization properties evident between the bursts we detected from FRB 20220912A are an intrinsic effect in the source rather than due to propagation. FRB 20220912A is a remarkably active repeating FRB, from which we detect pulses with variable morphology and polarization, from a host galaxy much like the hosts of other FRB sources.
References
- Aggarwal et al. (2021) Aggarwal, K., Budavári, T., Deller, A. T., et al. 2021, ApJ, 911, 95. doi:10.3847/1538-4357/abe8d2
- Astropy Collaboration et al. (2022) Astropy Collaboration, Price-Whelan, A. M., Lim, P. L., et al. 2022, ApJ, 935, 167. doi:10.3847/1538-4357/ac7c74
- Barsdell et al. (2012) Barsdell, B. R., Bailes, M., Barnes, D. G., et al. 2012, MNRAS, 422, 379. doi:10.1111/j.1365-2966.2012.20622.x
- Bassa et al. (2017) Bassa, C. G., Tendulkar, S. P., Adams, E. A. K., et al. 2017, ApJ, 843, L8. doi:10.3847/2041-8213/aa7a0c
- Bhandari et al. (2022) Bhandari, S., Heintz, K. E., Aggarwal, K., et al. 2022, AJ, 163, 69. doi:10.3847/1538-3881/ac3aec
- Bhardwaj et al. (2021) Bhardwaj, M., Kirichenko, A. Y., Michilli, D., et al. 2021, ApJ, 919, L24. doi:10.3847/2041-8213/ac223b
- Cappellari (2022) Cappellari, M. 2022, arXiv:2208.14974
- THE CASA TEAM et al. (2022) THE CASA TEAM, Bean, B., Bhatnagar, S., et al. 2022, arXiv:2210.02276
- Chatterjee et al. (2017) Chatterjee, S., Law, C. J., Wharton, R. S., et al. 2017, Nature, 541, 58. doi:10.1038/nature20797
- Chen et al. (2022) Chen, G., Ravi, V., & Hallinan, G. W. 2022, arXiv:2201.00999
- Condon et al. (1998) Condon, J. J., Cotton, W. D., Greisen, E. W., et al. 1998, AJ, 115, 1693. doi:10.1086/300337
- Cordes & Lazio (2002) Cordes, J. M. & Lazio, T. J. W. 2002, astro-ph/0207156
- Cutri et al. (2021) Cutri, R. M., Wright, E. L., Conrow, T., et al. 2021, VizieR Online Data Catalog, II/328
- Foreman-Mackey et al. (2013) Foreman-Mackey, D., Hogg, D. W., Lang, D., et al. 2013, PASP, 125, 306. doi:10.1086/670067
- Gaia Collaboration et al. (2022) Gaia Collaboration, Vallenari, A., Brown, A. G. A., et al. 2022, arXiv:2208.00211
- Heintz et al. (2020) Heintz, K. E., Prochaska, J. X., Simha, S., et al. 2020, ApJ, 903, 152. doi:10.3847/1538-4357/abb6fb
- Herrmann (2022) Herrmann, W. 2022, The Astronomer’s Telegram, 15691
- Hessels et al. (2019) Hessels, J. W. T., Spitler, L. G., Seymour, A. D., et al. 2019, ApJ, 876, L23. doi:10.3847/2041-8213/ab13ae
- Hiramatsu et al. (2022) Hiramatsu, D., Berger, E., Metzger, B. D., et al. 2022, arXiv:2211.03974
- James et al. (2020) James, C. W., Osłowski, S., Flynn, C., et al. 2020, MNRAS, 495, 2416. doi:10.1093/mnras/staa1361
- Johnson et al. (2021) Johnson, B. D., Leja, J., Conroy, C., et al. 2021, ApJS, 254, 22. doi:10.3847/1538-4365/abef67
- Kauffmann et al. (2003) Kauffmann, G., Heckman, T. M., Tremonti, C., et al. 2003, MNRAS, 346, 1055. doi:10.1111/j.1365-2966.2003.07154.x
- Keating & Pen (2020) Keating, L. C. & Pen, U.-L. 2020, MNRAS, 496, L106. doi:10.1093/mnrasl/slaa095
- Kewley et al. (2006) Kewley, L. J., Groves, B., Kauffmann, G., et al. 2006, MNRAS, 372, 961. doi:10.1111/j.1365-2966.2006.10859.x
- Kirsten et al. (2022) Kirsten, F., Marcote, B., Nimmo, K., et al. 2022, Nature, 602, 585. doi:10.1038/s41586-021-04354-w
- Law et al. (2022) Law, C. J., Connor, L., & Aggarwal, K. 2022, ApJ, 927, 55. doi:10.3847/1538-4357/ac4c42
- Macquart et al. (2020) Macquart, J.-P., Prochaska, J. X., McQuinn, M., et al. 2020, Nature, 581, 391. doi:10.1038/s41586-020-2300-2
- Magnier et al. (2020) Magnier, E. A., Schlafly, E. F., Finkbeiner, D. P., et al. 2020, ApJS, 251, 6. doi:10.3847/1538-4365/abb82a
- Majid et al. (2021) Majid, W. A., Pearlman, A. B., Prince, T. A., et al. 2021, ApJ, 919, L6. doi:10.3847/2041-8213/ac1921
- Manchester et al. (2005) Manchester, R. N., Hobbs, G. B., Teoh, A., et al. 2005, AJ, 129, 1993. doi:10.1086/428488
- Marcote et al. (2020) Marcote, B., Nimmo, K., Hessels, J. W. T., et al. 2020, Nature, 577, 190. doi:10.1038/s41586-019-1866-z
- McKinven & Chime/Frb Collaboration (2022) McKinven, R. & Chime/Frb Collaboration 2022, The Astronomer’s Telegram, 15679
- Michilli et al. (2018) Michilli, D., Seymour, A., Hessels, J. W. T., et al. 2018, Nature, 553, 182. doi:10.1038/nature25149
- Nimmo et al. (2022) Nimmo, K., Hessels, J. W. T., Kirsten, F., et al. 2022, Nature Astronomy, 6, 393. doi:10.1038/s41550-021-01569-9
- Niu et al. (2022) Niu, C.-H., Aggarwal, K., Li, D., et al. 2022, Nature, 606, 873. doi:10.1038/s41586-022-04755-5
- Offringa et al. (2014) Offringa, A. R., McKinley, B., Hurley-Walker, N., et al. 2014, MNRAS, 444, 606. doi:10.1093/mnras/stu1368
- Oke et al. (1995) Oke, J. B., Cohen, J. G., Carr, M., et al. 1995, PASP, 107, 375. doi:10.1086/133562
- Perera et al. (2022) Perera, Benetge, Perillat, Phil, Fernandez, Felix, et al. 2022, The Astronomer’s Telegram, 15734
- Perley & Butler (2013) Perley, R. A. & Butler, B. J. 2013, ApJS, 206, 16. doi:10.1088/0067-0049/206/2/16
- Perley (2019) Perley, D. A. 2019, PASP, 131, 084503. doi:10.1088/1538-3873/ab215d
- Planck Collaboration et al. (2020) Planck Collaboration, Aghanim, N., Akrami, Y., et al. 2020, A&A, 641, A6. doi:10.1051/0004-6361/201833910
- Pleunis et al. (2021) Pleunis, Z., Good, D. C., Kaspi, V. M., et al. 2021, ApJ, 923, 1. doi:10.3847/1538-4357/ac33ac
- Ravi (2019) Ravi, V. 2019, Nature Astronomy, 3, 928. doi:10.1038/s41550-019-0831-y
- Ravi et al. (2022a) Ravi, V., Law, C. J., Li, D., et al. 2022, MNRAS, 513, 982. doi:10.1093/mnras/stac465
- Ravi et al. (2022b) Ravi, V. 2022, The Astronomer’s Telegram, 15693
- Ravi et al. (2022c) Ravi, V. 2022, The Astronomer’s Telegram, 15716, 1
- Ravi et al. (2022d) Ravi, V., Karambelkar, V., Mena, T. A., et al. 2022, The Astronomer’s Telegram, 15720
- Reid et al. (1988) Reid, M. J., Schneps, M. H., Moran, J. M., et al. 1988, ApJ, 330, 809. doi:10.1086/166514
- Sheinis et al. (2002) Sheinis, A. I., Bolte, M., Epps, H. W., et al. 2002, PASP, 114, 851. doi:10.1086/341706
- Shen et al. (2003) Shen, S., Mo, H. J., White, S. D. M., et al. 2003, MNRAS, 343, 978. doi:10.1046/j.1365-8711.2003.06740.x
- Wang et al. (2022) Wang, F. Y., Zhang, G. Q., Dai, Z. G., et al. 2022, Nature Communications, 13, 4382. doi:10.1038/s41467-022-31923-y
- Weinreb & Shi (2021) Weinreb, S. & Shi, J. 2021, IEEE Transactions on Microwave Theory Techniques, 69, 2345. doi:10.1109/TMTT.2021.3061459
- Xu et al. (2022) Xu, H., Niu, J. R., Chen, P., et al. 2022, Nature, 609, 685. doi:10.1038/s41586-022-05071-8
- Yao et al. (2017) Yao, J. M., Manchester, R. N., & Wang, N. 2017, ApJ, 835, 29. doi:10.3847/1538-4357/835/1/29
- Zhang et al. (2022) Zhang, Yongjun, Niu, Jiarui, Feng, Yi, et al. 2022, The Astronomer’s Telegram, 15733