Effects of supra-arcade downflows interacting with the post-flare arcade
Abstract
Supra-arcade downflows (SADs) are dark voids descending through plasma above the post-flare arcade. Although they are generally viewed as byproducts of flare reconnections in the corona, the nature of SADs is under debate. Here we investigated six distinct episodes of SADs observed in the post-maximum phase of an M-class flare of April 11, 2013. Differential emission measure analysis revealed that SAD cases occurring close to the flare maximum contain an enhanced hot plasma component at 5–7 MK whereas those occurring later exhibited a depression in hot plasma at 7–12 MK compared to the ambient supra-arcade plasma. On-disk location of the flare enabled us to examine in detail the interaction of SADs with the post-flare arcade, whose effects include 1) transverse oscillations of period 160 s in the supra-arcade rays in the wake of voids, 2) footpoint brightening in 1700 Å whose peak is delayed by 22-46 s with respect to the SAD’s arrival at the top of the arcade, and 3) EUV intensity perturbations expanding and propagating with a speed 400 km s-1. On the other hand, due to line-of-sight confusion in the optically thin corona, the ribbon enhancement following the interaction produces an illusion of plasma rebound at the top of the arcade, where the interaction fails to yield significant plasma heating. These effects indicate that the interaction mainly generates MHD waves propagating toward the surface, which may further produce quasi-periodic brightening at flare ribbons, therefore contributing to quasi-periodic flare gradual phase emission in EUV.
1 Introduction
Magnetic reconnection is the fundamental mechanism that energizes the solar eruptive processes. Since the direct observational characterization of magnetic reconnection is difficult (Xue et al., 2016), indirect proxies namely current sheets (Sui & Holman, 2003; Liu et al., 2010; Gou et al., 2019), loop shrinkage (Forbes & Acton, 1996; Wang et al., 1999; Savage et al., 2010), reconnection inflows and outflows (Takasao et al., 2012; Su et al., 2013), etc. are investigated for this purpose. Alongside the reconnection generated plasmoids (or blobs) which appear bright in the extreme ultra-violet (EUV) (Liu, 2013; Awasthi et al., 2018; Gou et al., 2019) and X-ray (Milligan et al., 2010) wavelengths, careful examination of the supra-arcade region during the post-maximum phase of flares also reveal tadpole-shaped dark voids descending towards the post-flare arcade, termed as supra-arcade downflows (SADs; McKenzie & Hudson, 1999). Unlike the bright plasmoids which are mainly observed during the flare maximum, multiple episodes of SADs are observed during the impulsive and main phases (Asai et al., 2004) as well as throughout the prolonged decay phase of the flare (Xue et al., 2020). Therefore, probing the relatively lesser-known thermodynamical and magnetic nature of the SADs can offer new insights into the plasma heating process, particularly during the gradual phase of the flare.
SADs were first identified as blob-shaped depressions in the X-ray intensity in the YOHKOH observations (McKenzie & Hudson, 1999) that descend sunward with a speed generally ranging between 45 to 500 km–s-1(McKenzie, 2000; Asai et al., 2004). The propagation speed of SADs being lower than the ambient Alfvén speed (1000 km–s-1; Verwichte et al., 2005), as well as the free-fall speed, makes their magnetic characteristics elusive. To explain this behaviour, a drag force is proposed by (Scott et al., 2013). Still, as a few SAD cases were found to be spatio-temporally associated with the retracting flux-tubes, it has been argued that the SADs correspond to the cross-section of the flux-tubes (McKenzie, 2000; McKenzie & Savage, 2009; Savage et al., 2010). However, observations reveal that voids are systematically wider than the cross-section of the retracting loops. Savage et al. (2012) reconciled this discrepancy by re-interpreting the SADs as the ‘wakes’ of the retracting loops. Alternatively, Liu (2013) invoked a strong magnetic twist to account for both the size discrepancy between SADs and retracting loops and the depressed density in the SADs. Although the observed causal relationship of the retracting loops with the SADs in a few cases led the investigators to include the retracting flux-tubes (Scott et al., 2013) to model the characteristics of the downflowing voids, it is not always the case. Liu (2013) reported a continuous association between the downflowing voids and the retracting flare loops and inferred the former to be initiating the latter. Further, since the voids are estimated to contain a lower density ( ) plasma compared to “haze” in the supra-arcade region (McKenzie & Hudson, 1999; Reeves et al., 2017; Chen et al., 2017), it is unclear how the rarefied region is developed behind the shrinking loops, which move with a speed smaller than the Alfvén speed (Liu, 2013; Cassak et al., 2013). Further, a few simulation studies, e.g., Maglione et al. (2011), and Cécere et al. (2012), considered plasma temperature in the SAD interior to be higher than that of the surroundings. Therefore, it is crucial to investigate the plasma as well as magnetic-field properties of the SADs as derived from the observations as well as from the models.
Despite the complex nature of the observational characteristics exhibited by SADs, their co-temporal presence with the impulsive non-thermal bursts is indicative of their association with the magnetic reconnection occurring higher up in the corona (Asai et al., 2004; Khan et al., 2007). Liu (2013) argued a common origin of the bright plasmoids in a vertical current sheet (VCS) generated in the wake of an erupting flux rope and a dark void flowing in the flare arcade. He conjectured the dark voids to be a mini-flux rope located in the stretched flux tubes of the VCS. On the other hand, the model of Cassak et al. (2013) revealed these low-density regions to be formed by continuous reconnection outflow jets that carve into the denser supra-arcade region. Additionally, Liu & Wang (2021) noted that supra-arcade rays often exist prior to and/or are standalone, to the downflow events. As the prominence plumes (Berger et al., 2010; Awasthi & Liu, 2019) and SADs exhibit morphological similarity, for instance, the splitting of a downflowing void head (Innes et al., 2014), Rayleigh-Taylor (R–T) instability in the downstream region of the reconnecting current sheet (Guo et al., 2014) is suggested to be a promising mechanism of SADs. In this context, a mixture of instabilities, namely Kelvin-Helmholtz (K–H) & the tearing mode (Cécere et al., 2015), or the Rayleigh–Taylor & the Richtmyer-Meshkov (Shen et al., 2022) have also been argued for the generation of SADs.
The observational fact that SADs pass through, push, or oftentimes even split the structures in the supra-arcade region is indicative of their magnetic nature. Verwichte et al. (2005) interpreted the transverse oscillations generated in the trailing region of the SADs to be the propagating fast magneto-acoustic kink waves. Thus, although the interaction of the SADs with the structures in the supra-arcade region and later with the loop arcade has the potential of unraveling the physical nature of the downflows, it is not well-studied because most SADs are preferentially observed in the limb flares (Savage & McKenzie, 2011). Recently, Samanta et al. (2021) investigated a series of SADs, that occurred during the post-maximum phase of an on-disk M-class flare on April 11, 2013. Focusing their investigation on the collision of descending tadpoles with the post-flare loops, they found quasi-periodic heating of the loop plasma. At least six distinctively clear SAD events occurred throughout 80 minutes during the decay phase of the flare, from which a subset of cases has been investigated in the above paper. To further the understanding of the nature of the interaction of SADs with the features in the supra-arcade region, post-flare loops, and foot-point regions, we carry out an exhaustive analysis of the dynamical and thermal properties of the SADs and their evolution in the present work. Novel results include the presence of hot plasma enclosed in the downflows observed close to the flare-maximum (section 3.1) and the characterization of the enhancements and disturbances generated due to the interaction of SADs with the post-flare loop-arcade (section 3.2). Discussion on the results and conclusions are offered in the section 4.
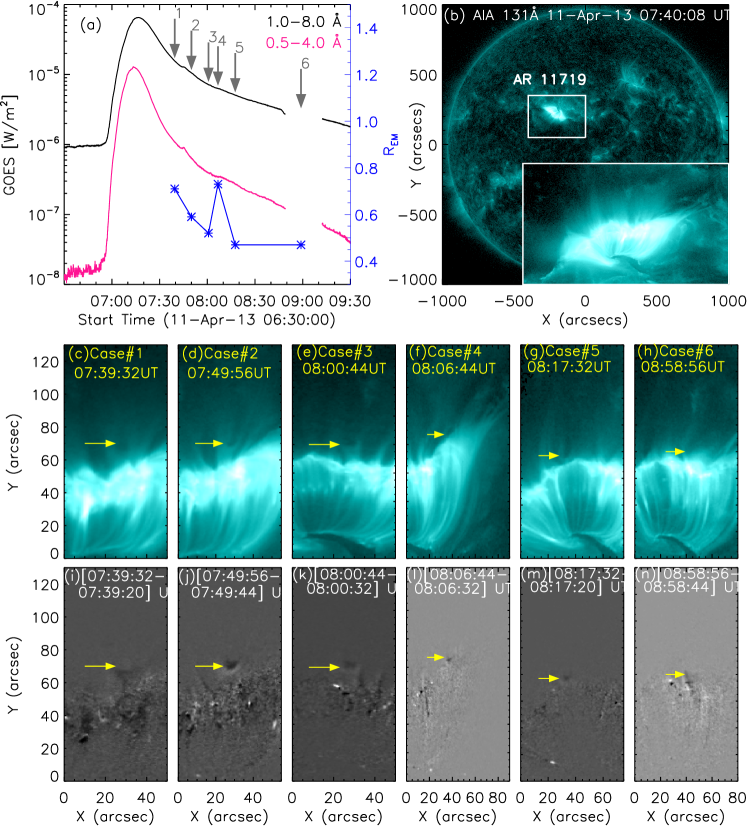
2 Overview of observations and Instruments
We investigate the dynamical and thermal characteristics of SADs that are observed in the post-maximum phase of an M6.5 flare of April 11, 2013, in the active region 11719. Primarily, we have analyzed the extreme ultra-violet (EUV) and ultra-violet (UV) images recorded by the Atmospheric Imaging Assembly (AIA; Lemen et al., 2012) instrument onboard Solar Dynamics Observatory (SDO; Pesnell et al., 2012). AIA provides un-interrupted observations of full-disk Sun in seven EUV channels (94, 131, 171, 193, 211, 304, and 335 Å) and two UV wavelengths (1600 and 1700 Å) with a spatial and temporal cadence of 0.6” and 12 s (24 s for UV channels), respectively (Lemen et al., 2012). The flare maximum occurred at 07:16 UT according to the disk-integrated X-ray intensity profile obtained from the Geostationary Observational Environmental Satellite (GOES; Pesnell et al., 2012) in 1–8 Å and 0.5–4 Å (Figure 1a). The prolonged gradual phase of the flare (Figure 1a)) with its source region located close to the disk center (N10W01, Figure 1b) allowed a unique opportunity to identify at least six distinctively clear cases of SADs observed over 80 minutes (Figure 1c–h). Downflow events will be termed according to their observed sequence, i.e. SAD case#1–6 (annotated in the figure 1a and also in the middle row of the figure).
In particular, EUV images in 131 offer the clearest visibility of the bright “haze” in the supra-arcade region, and dark voids against brighter background (Figure 1b). Therefore, the identification and investigation of the morphological evolution of the dark voids have been made primarily using the image sequence obtained in 131 . The on-disk location of the flaring region enables us to observe the post-flare loop arcade and various structures in the supra-arcade region namely bright rays, dark lanes, haze, etc. (Figure 1b). However, running-difference images have also been prepared to deduce the morphological and kinematical properties of the descending voids (bottom panels of figure 1). This enabled us in identifying six cases of descending voids within 80 minutes of the decay phase of the flare, as marked by yellow arrows in Figure 1a. For most cases, SADs descend toward the post-flare loops that are observed from a side-on perspective; Case #4 is particular in that it descends toward cusp-shaped post-flare loops (figure 1f & figure 1l), i.e., these loops are observed from an oblique face-on perspective. Thus, the curved post-flare arcade allows for an investigation of the effects of SAD interactions with the cusp-shaped loop structures in the supra-arcade region and with the loop-arcade from different geometrical viewpoints.
3 Results
3.1 Thermal properties of the supra-arcade downflows
We deduce the thermodynamical properties of the plasma contained in the supra-arcade downflows in terms of its temperature and emission measure (EM). It is still debated whether the SADs contain plasma of lesser density (and higher temperature) compared to the ambiance or are devoid of plasma. The present investigation of multiple SAD cases spanned across 80 minutes since the first discernible episode (observed within a few minutes after the flare maximum), provides a unique opportunity to probe the thermodynamical nature of SADs that are produced with different flare reconnection rates — most likely at different altitudes and therefore have cooled over different time periods at the time of their arrival at the post-flare arcade.
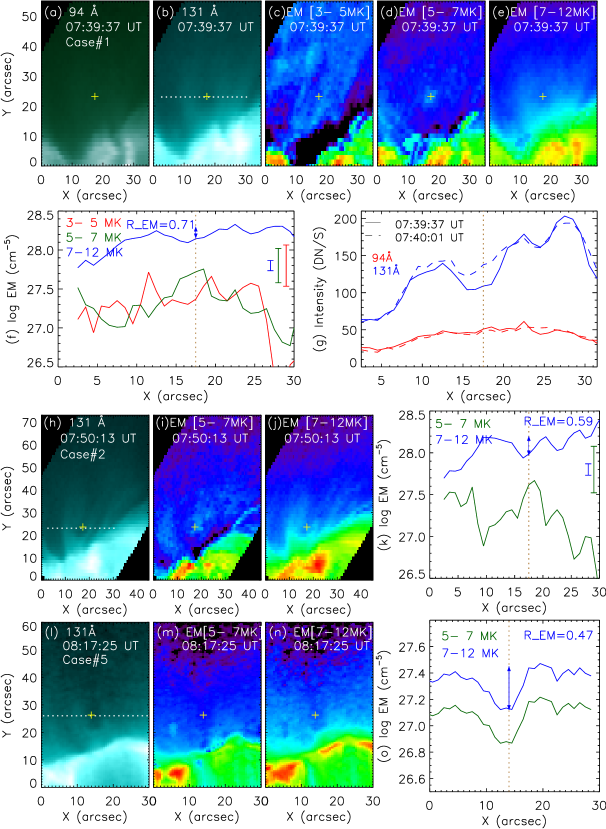
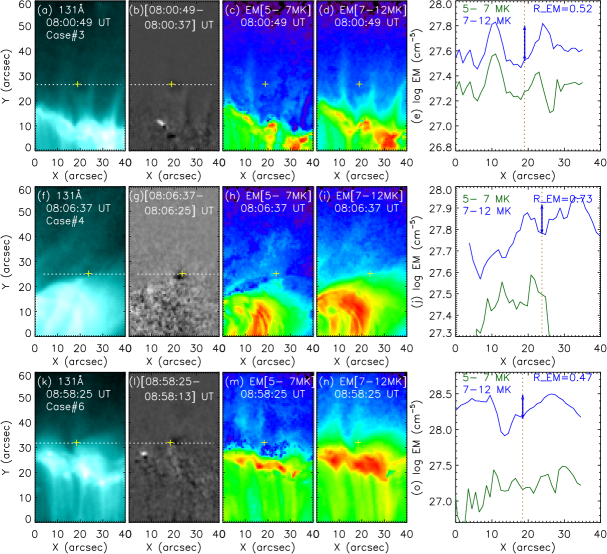
To determine the thermal characteristics of the features observed in the supra-arcade region, we apply the modified sparse inversion technique of Su et al. (2018), originally developed by Cheung et al. (2015). This method analyzes the pixel intensity from the six EUV channels of AIA namely 94 Å, 131 Å, 171 Å, 193 Å, 211 Å, and 335 Å to determine the best-fit emission measure (EM) distribution over temperature. Besides, the implementation of Monte-Carlo simulation enables determining the uncertainty in the EM values derived from this technique. Figure 2 provides the thermodynamical characteristics of three SAD cases, case#1, 2 and 5, observed respectively at 07:39:37 UT, 07:50:13 UT, and 08:17:25 UT. From the investigation of case#1, although a clearer perspective of the ‘haze’ above the post-flare loops is seen in 131 Å compared to that in the 94 Å image, the post-flare loop region appears clearer in the latter wavelength. Further, EM maps have been prepared in three temperature bins (panel (c)–(e)), corresponding to low (3–5 MK), intermediate (5–7 MK), and high temperature (7–12 MK). Clear signatures of hot material within the blob may be noted in the EM map corresponding to 5–7 MK. In agreement, a plot of EM values (Figure 2f) along the horizontal line crossing the blob also shows an enhancement of EM only in the 5–7 MK range at the SAD’s location. To account for the uncertainty involved in the identification of the SAD’s position, EM value on each point along the horizontal line is estimated by taking an average of EM values in 3-pixels spanned vertically and centered on the respective point. Further, the statistical significance of the enhancement has been established by deriving the maximum uncertainty level in the EM values over the plotted range (vertical bars on the right-side of figure 2f). We have determined the intensity profile in 94 and 131 Å wavelengths over the aforesaid horizontal line at two different times – one during the passage of SAD (at 07:39:37 UT), and the other after its passage (at 07:40:01 UT). From the profile, we find elevated levels of emission in 131 Å wavelength within the SAD, which may have significantly contributed to the estimated higher temperature of the SAD interior. Similar to thermal properties of aforementioned SAD, SAD case#2, observed at 07:50:13 UT (Figure 2h–k), exhibited elevated EM values in the 5–7 MK temperature bin at the SAD location (Figure 2i & k). On the contrary, thermal diagnostics of another SAD case#5, observed at 08:17 UT (bottom panel of figure 2), did neither exhibit any discernible signature of enclosed hot material in the EM maps nor revealed any enhancement in the EM values within the SAD. However, we found a trend of increasing level of depression in the EM values () at the SAD location in the 7–12 MK temperature range relative to that of the nearest vertical ray for the cases that occur early in the decay phase compared to those observed later. , defined as the ratio of EM values at the SAD location with that of the nearest vertical bright supra-arcade ray, is estimated to be 0.71, 0.59, 0.52, 0.73, 0.47, and 0.47 for the SAD cases 1 to 6, respectively. Figure 2 presents the analysis of SAD cases 1, 2 and 5, whereas the thermal characteristics of the rest of the cases in presented in the figure 9 (see appendix A). This suggests that the high-temperature plasma content within SADs is increasingly reduced for the cases that occur sequentially later in the decay phase (c.f. figure 1a) except for that corresponding to SAD case #4. The side-on view of the SAD#4 and the presence of ambient bright cusp-shaped loop system allowed to discern the void only as late as very close to the bright post-flare looptop. Further, the EM profile within the SAD#4 in the high-temperature bin (figure 9o) shows an unusual behaviour compared to a typical behaviour of EM depression within the SAD for the rest of the investigated cases. This may possibly explain why R_EM for the SAD#4 is an outlier.
3.2 Investigation of emission and perturbation generated due to supra-arcade downflows
To probe the magnetic field characteristics of descending voids, we investigate the disturbances they produce in the ambient supra-arcade structures (i.e. rays, cusps, etc.) and the post-flare loop arcade.
3.2.1 SAD generated transverse oscillations in the supra-arcade rays
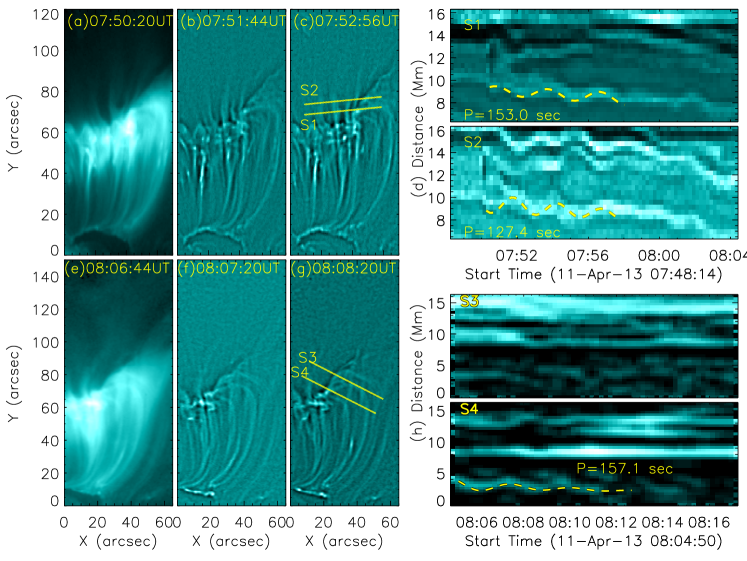
We have processed the 131 Å images with the unsharp-mask technique to highlight the fine structures during the passage of voids. From the original images, we subtract a background image (the mask) that is a smoothed (7 7 pixels) version of the original image. During downward propagation, SADs have been observed to push aside the bright vertical supra-arcade rays in all of the investigated cases. However, we selected to show the detailed analysis of case#2 and case#4 in the top and bottom panels of figure 3, respectively, since they provide different geometrical perspectives.
Following the passage of the voids, the perturbed rays in the supra-arcade region exhibit an oscillatory behavior (figure 3a–c & e–g). We prepare time-distance maps corresponding to the virtual slits placed on the sequence of unsharp-masked 131 Å images to quantify the oscillations. In the top panel corresponding to case#2, slits ‘S1’ and ‘S2’ are placed (figure 3c) across two discernible rays along which the void has descended. Time-distance maps corresponding to the slits exhibit the transverse nature of the oscillation of these rays. We fit the oscillatory pattern with the damped-sinusoidal function (Awasthi & Liu, 2019) which reveals the period of oscillations for case#2 to be varying in the range of 120–160 s.
Similarly, we investigate the oscillatory behavior of the selected post-flare loops due to the passage of void#4 as presented in the bottom panel of the figure 3. From the sequence of unsharp-mask images at 08:07:20 UT and 08:08:20 UT (figure 3f–g and the associated animation covering the entire descent of the void), we found that both sides of the cusp-shaped loop structure exhibited transverse oscillations following the passage of the void. That the cusp-shaped loops face toward us enabled us to identify the transverse oscillations, which may correspond to transverse oscillations of supra-arcade rays due to different viewing angles. The time-distance maps corresponding to slits ‘S3’ and ‘S4’, which span across one of the distinctively clear cusp structures, show the oscillations with a period of 157.1 s.
The detected periods of oscillation in the supra-arcade rays seem to be consistent with the period of standing kink waves (Aschwanden et al., 2002). Further, the change of period at different altitudes of the supra-arcade ray may be related to the magnetic field in different rays or at different altitudes. This may also be caused by the superposition of numerous rays along the line of sight, but it would be difficult to resolve the differences from the EUV images. It may also result from large uncertainties involved in delineating and fitting the oscillatory patterns since for the same ray (flux tube), the oscillation period should be the same.
3.2.2 EUV intensity waves propagating in post-flare loops due to SAD interaction
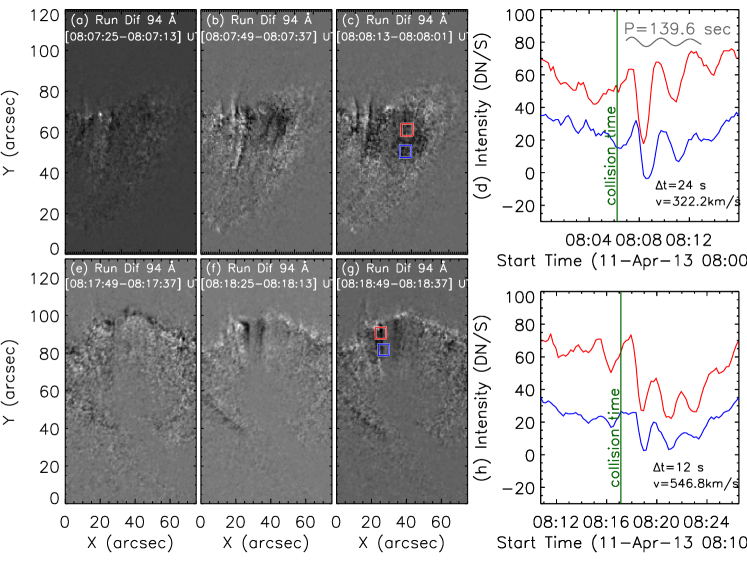
The on-disk location of the flare’s source region provided an opportunity to investigate the effect of SADs’ interaction with the post-flare loops, an aspect not well known. A sequence of running-difference images in 94 and 131 Å wavelengths have been prepared for this purpose. A detailed investigation made on the SAD cases#4 and case#5 is presented in figure 4.
The passage of SAD case#4 over the post-flare loop-arcade resulted in a downward propagating and expanding region of intensity depression in the running-difference images. These wave-like perturbations in the EUV intensity profiles are deduced by averaging the intensity over two square regions of 2” width, placed 10” apart (marked in figure 4c). Thus, the intensity profiles obtained from the two regions along the loops enabled us to deduce the time delay between the wave patterns (24 s as determined by performing lag analysis), and hence the propagation speed of intensity waves, which is estimated to be about 322 km/s. All the SAD cases under investigation produced such intensity waves in the post-flare arcade, as demonstrated for another SAD case in the lower panel of figure 4. In this case, the wave generated due to the collision of the SAD with the post-flare loops has propagated along the loop with a speed of 547 km–. The period of oscillations is estimated to be 140 s.
3.2.3 Investigation of loop-top and foot-point brightenings associated with the descending voids
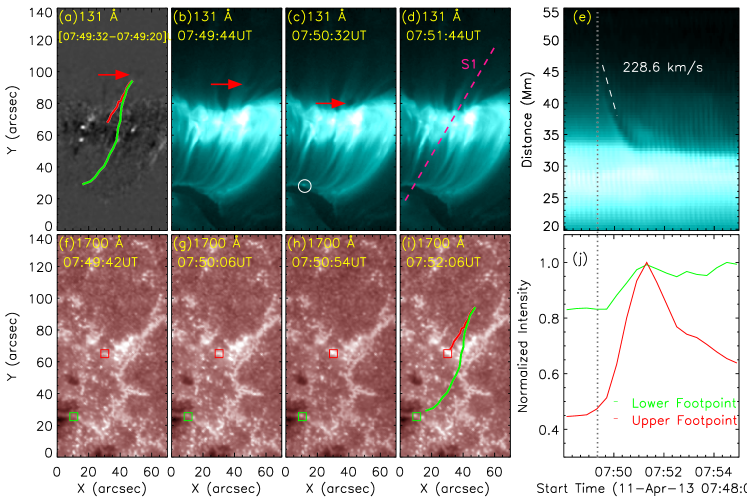
Probing the spatio-temporal and thermodynamical characteristics of the emissions generated due to the interaction of SADs with the cusp-shaped loops in the supra-arcade region and their subsequent collision with the post-flare loops can provide crucial insights into the physical nature of SADs. In this regard, we investigate an SAD event (case#2) which was observed at 07:49 UT (figure 5). To track the propagation of downflows since their earliest appearance in the supra-arcade region and identify the associated footpoint brightenings, sequences of images in 131 and 1700 Å have been analyzed. Against the bright hazy background in the supra-arcade region, which is assumed to be associated with the cusp-shaped loops overlying the post-flare arcade from this side-on viewing angle, the investigated void could be identified in the 131 Å images as early as at 07:49:32 UT (figure 5a–d). Intriguingly, merely 10 seconds after the interaction of the SAD with the loop structure, a kernel-shaped enhancement has been located in the lower ribbon in the 1700 Å image acquired at 07:49:42 UT (figure 5f). It may be noted that although the time-cadence of 131 and 1700 Å images is 12 and 24 seconds, respectively, the time difference between the closest-in-time inter-wavelength images can be shorter, as in this case. From an animation containing the sequence of images in 131, 1700, and 1600 Å wavelengths (supplementary file of figure 5), the spatial and temporal association of ribbon brightening with the SAD’s dynamics can be further elucidated. For consistency, an additional criteria of selecting the closest-in-time 1700 Å that are recorded later than the respective 131 Å image has been implemented for investigating the causal relationship between the SAD’s interaction with the loop and foot-point brightening. Kernel-shaped brightening is also observed along the upper ribbon.
To derive a spatio-temporal relationship between the interaction of the SAD with the post-flare loop-arcade and the ribbon brightening, we prepare time-distance maps corresponding to a virtual slit ‘S1’ (figure 5d&i), placed in a slanted position to cover the kinematics of the descending void as well as the locations of ribbon enhancements. Both the upper and lower ribbons start to brighten as the SAD interacts with the supra-arcade rays as high as at 12 Mm above the post-flare loop arcade, and the enhancements peak as the SAD reaches the top of the post-flare arcade. From the shape and orientation of the post-flare loops, we envisaged a cusp-shaped loop structure relevant to the SAD’s descent, with its foot-points rooted at the locations where brightenings are first spotted in the 1700 Å images. At the foot-point locations, we further derive the time evolution of 1700 Å emission (figure 5j) averaged over a 5” wide square box covering the ribbon enhancement (figure 5f–i). This also confirms that foot-point brightenings are associated with the SAD’s descent.
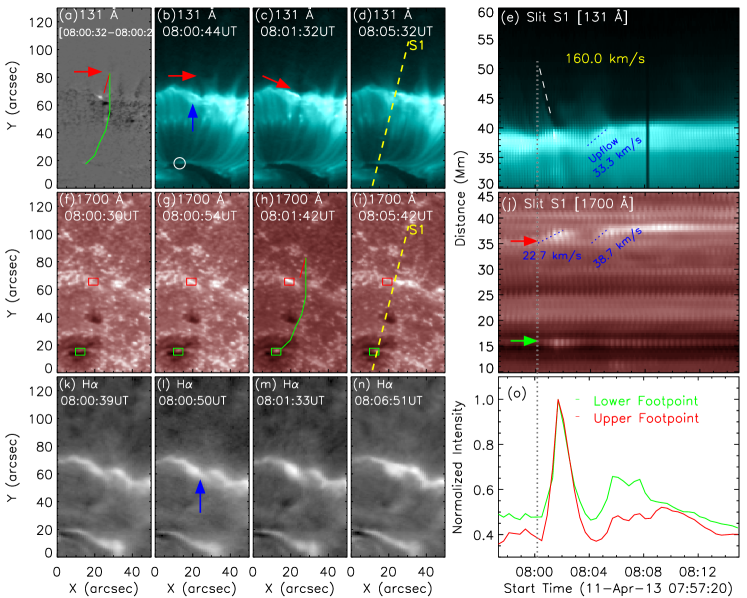
To further explore how the flare ribbons respond to the SAD’s descent, we examine the nature of footpoint emission associated with another SAD case, observed at 08:00 UT (case#3) by analyzing EUV observations in 131 Å and 1700 Å along with H images obtained from Kanzelhoehe Solar Observatory (KSO). Distinctively clear kernel-shaped brightenings are seen at both the ribbons in the 1700 Å images since the earliest discernible appearance of void in the 131 Å images at 08:00:32 UT (figure 6a–b). The spatio-temporal relation of SAD’s descent with the ribbon brightening is further elaborated with the help of the animation prepared from the sequence of images in the 131, and 1700Å, as well as H wavelengths. From the sequence of images in 1700 Å, we further derive intensity profile (figure 6j) averaged over the foot-point region (5” wide square box, marked in green (red) for lower (upper) foot-point in figure 6f–i) of the envisaged loop structure affected by the SAD propagation (drawn in panels (a) and (i) of figure 6) and normalize to the respective peak value.
Next, we prepare a time-distance map from the 131 Å images over a virtual slit placed along the propagation path of the void (S1; drawn in figure 6d). New episode of enhanced emission at the foot-point location appears with a time-delay of 22 s following the SAD’s appearance at the loop-apex in the 131 Å image at 08:00:32 UT (figure 6a) which is located 15 Mm above the bright post-flare loop-top. Besides, the propagation speed of the SAD interaction to the footpoint can be more reliably derived from the peak time of the footpoint brightening relative to the time that the SADs arrive at the top of the post-flare arcade. In this regard, based on the investigation of SAD case#3 presented in figure 6 and associated animation, we obtain the arrival time of downflow at the post-flare looptop to be at 08:01:20 UT, while the intensity profile in 1700Å gives the peak time of the footpoint brightening at 08:01:42 UT (figure 6h). Thus, from the estimated time delay of 22 s and the distance of 21.9 Mm from the loop-top to the footpoint, the propagation speed of perturbation is obtained to be 995 km s-1. Similarly, we have also estimated the propagation speed of the perturbation for case #2, presented in figure 5. Using the arrival time of the SAD at the top of the post-flare loop arcade to be at 07:50:56 UT, the peak emission at the ribbon location at 07:51:18 UT (time-delay = 22 s), and the distance of 25.5 Mm between the SAD’s interaction site at the post-flare looptop and the ribbon brightening location, the speed of perturbation is derived to be 1159 km–s-1. However, the estimation of time-delay between the SAD’s arrival at the post-flare looptop and footpoint brightening may contain a maximum uncertainty of 24 s, due to the different time-cadence of images being recorded in 131 Å(12 s) and 1700 Å(24 s) images. Therefore, the uncertainty in the estimated speeds may be as large as 500 km–s-1.
From the careful analysis of the two cases of SADs’ interaction with the loop system and its effect on the loop footpoints, it is evident that SADs start to interact with the flare loop system before they arrive at the top of the arcade. However, it is hard to determine exactly when the interaction starts because of the increasingly poor contrast between the SADs and the ambient corona with increasing height. Moreover, it is much more accurate to determine the peak than the onset of the ribbon brightening despite the fact that the latter depends on the instrument sensitivity and is interfered by the plage brightening.
3.2.4 Thermal analysis of SAD induced brightening at the collision-site and foot-point
Alongside enhanced kernel-shaped brightening at the lower foot-point region of the loop-system, the collision of SAD#3 with the loop-top also resulted in localized plasma heating close to the collision site (figure 6b), which exhibited an apparent upward motion in the course of time (figure 6b–d). To investigate this association, we prepared a time-distance map (figure 6e) from the 131 Å images corresponding to a virtual slit (‘S1’ shown in figure 6d). Here, the slanted dark lane is due to the void which descends with a speed of 230.8 km–s-1 before getting decelerated near the loop-top. The void continued to be discernible even below the loop-top altitude before its disappearance. An upward motion of the bright material within a few minutes after the collision of the void is marked in blue in figure 6e. This is similar to the results obtained by Samanta et al. (2021) who interpreted the upward motion as the rebound of plasma that has been compressed due to SAD’s collision.
Since the upper ribbon is shadowed by the loop-top as evident from the 131 Å and 1700 Å images (figure 6b&g), and the speed of “upward” motion of the bright material observed in both the aforesaid wavelengths is estimated to be 35 km- (figure 6e&j), it is unclear whether the aforesaid hot material produced after the collision belongs to the loop-top region or the foot-points (ribbon). To resolve this ambiguity, the images acquired in 1700 Å and H wavelengths have been analyzed. The 1700 Å and H images (figure 6g&l) acquired closest-in-time with the EUV 131 Å image have revealed newly appeared enhancements co-spatial to that observed in the 131 Å images (figure 6b; indicated by blue arrow). From the supplementary animation file provided with figure 6, and the time-distance map prepared from the sequence of images in 1700 Å (figure 6e&j) along the slit ‘S1’ (same as that used in 131 Å map), two episodes of “upward moving” brightenings at the location of shadowed (upper) ribbon can be identified. The first instance, at 08:00:32 UT, is a response to the SAD’s interaction with the loop apex as evident by placing a vertical dotted line on the time-distance maps. Following the post-collision submergence of the SAD beneath the post-flare looptop, the second instance of brightening and ribbon expansion occurred at 08:04 UT, exhibiting similar spatial and temporal evolution as well as projected speed to that observed in 131 Å time-distance map. Thus, it is very likely that ribbon brightening and expansion significantly contributes to the brightening and apparent upward motion observed in the 131 Å images at the collision site. Contrary to the “expansion” exhibited by the bright material in the upper-ribbon, the emission originated in the lower-ribbon remained relatively stationary, probably because the lower-ribbon runs across the sunspot, where the magnetic field is quite “rigid”.
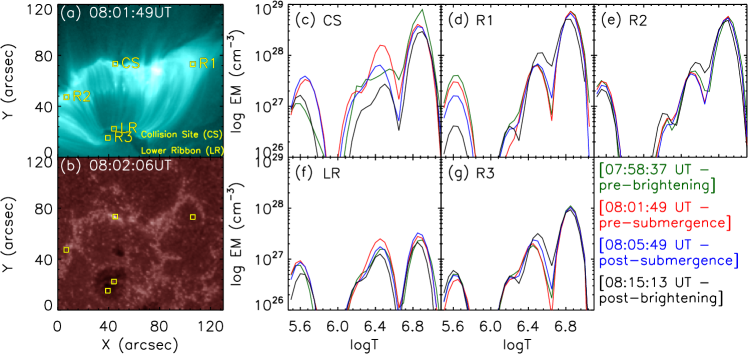
To further delineate whether the brightening at the collision-site corresponds to the looptop altitude or originates at the ribbon location, we investigate the thermodynamical characteristics of the EUV brightenings by analyzing the emission measure maps which are synthesized in the temperature range of 0.5–16 MK ([K] = [5.5–7.2], =0.5) using the procedure described in section 3.1. We deduce emission measure distribution (EM[T]) of the brightenings observed at the collision site (hereafter ‘CS’). Since the upper ribbon is shadowed by the post-flare loops, EM distribution corresponding to the enhancements at the lower (“exposed”) ribbon (hereafter ‘LR’) has also been deduced to distinguish the contribution of ribbon and looptop in the EUV enhancement observed at CS during SAD’s collision. We determine the EM[T] distribution for three additional reference locations (refer to figure 7) to determine the thermodynamical state of plasma – at R1 and R2, which correspond to the top of post-flare arcade yet away from the region affected by the interaction of SAD (R1 at the cusp region, which is exactly the top of post-flare arcade without the plage emission along the line-of-sight; R2 is projected off the upper ribbon but coincident with brightening plages, providing a condition similar to that at CS) – and at R3, which is located at the footpoints of post-flare loops but off the lower ribbon. EUV enhancements at CS (in 131 Å images) and LR (in 1700 Å images) locations have been observed as soon as the SAD interacts with the supra-arcade rays.
In particular, two episodes of EUV brightening at CS have been observed during 08:01 – 08:11 UT during the descent and subsequent submergence of the SAD#3 below the post-flare loop-top. To outline the effects of the SAD’s interaction with the cusp of the post-flare loop-arcade and subsequent submergence on the thermodynamical state of the plasma, we deduce the EM[T] distributions at four time instances – corresponding to two episodes of brightenings related with the SAD’s pre-submergence (08:01:49 UT) and post-submergence (08:05:49 UT) below the post-flare loop-top, and two time instances before (07:58:37 UT), and after (08:15:13 UT) the brightening event (figure 7, also see figure 6o). Due to the dynamical nature, the location of enhancements at CS and LR have been visually identified at each time-instance during 08:00:49 – 08:11:13 UT for determining thermal characteristics whereas the locations of reference points, namely R1, R2, and R3, are kept fixed. Further, the CS and LR locations during the pre- and post-submergence time instances are kept the same as those identified at the onset (08:00:49 UT) and fading (08:11:13 UT) of the brightening, respectively. EM[T] distribution is derived by averaging the EM values over a square region of 6 pixels width from the emission measure maps in respective temperature bins. A comparison of EM[T] distribution of the enhancement at CS with that deduced before (07:58:37 UT) and after (08:15:13 UT) the brightening event (figure 7c) reveal clear enhancements up to 5 MK (), which is not evident at the reference points R1 and R2 (figure 7d & e). Besides, the EM[T] distribution in the hot bump ([K] = [6.7–7.2]) did not show any significant change relative to that deduced at an earlier time as well as those at the reference points R1 and R2 (figure 7d–e). Similarly, EM values at LR are found to be slightly higher than that corresponding to pre- and post-collision time (figure 7f). Similar conclusions can be drawn from the EM[T] distributions corresponding to EUV enhancement observed after the submergence of SAD at 08:05:49 UT.
A detailed analysis of EM[T] distribution at CS revealed that the most prominent feature is not just the enhancement of EM[T] at the warm bump () but at the cold bump (). In particular, EM[T] levels of CS at the cold bump consistently remained at an elevated level during the SAD’s submergence event until 08:13 UT, after which the pre-collision values have been attained, whereas at the two reference regions the cold bump of EM[T] either keeps decreasing (R1) or remains stable (R2) during the same period (figure 7d and animation). Thus, it can be argued that this enhancement at the cold bump is strong evidence for the contribution of enhanced ribbon emission in the transition region, due to Fe VIII () emission lines in the AIA 131 Å passband (see O’Dwyer et al., 2010), to the apparent brightening at the top of the arcade in response to the SAD collision (refer to figure 6), with the brightening at the ribbon location being seen through the top of the flare arcade. Further, since there is no significant change at the hot bump (), the enhancement at the warm bump () cannot be explained by the cooling of the hot plasma (also evident from the animation associated with figure 7, containing the EM[T] distribution for the aforementioned locations during 07:56:49–08:20:13 UT). Unlike SADs that occur earlier in the decay phase, the investigated SAD case does not carry 6 MK plasma, and hence cannot contribute directly to the EM enhancement. Thus, the EM enhancement at the warm bump is indeed due to the collision of SADs upon the flare arcade. Excluding with confidence the possibility of plasma rebound, we surmise that the collision is most likely magnetic in nature, considering the waves induced in the flare arcade and the associated footpoint brightening. However, we cannot exclude the possibility of mechanical heating at the top of the flare arcade, where the plasma could be compressed by the approaching SADs, resulting in the observed enhancement of the EM at 5 MK. On the other hand, we believe that it is unlikely that the plasma was heated to temperatures over 15 MK where AIA does not have sufficient sensitivity O’Dwyer et al. (2010), because there are no appreciable changes of the EM component at 10 MK in response to the collision (Figure 7).
Since the superposition of the top of the post-flare arcade with the upper footpoint can naturally boost the emission and the temperature at the upper ribbon, it may explain the consistently lower EM[T] values corresponding to the lower-ribbon location compared to that at the collision site (figure 7f & g). We also note in passing that in response to the SAD’s interaction with the post-flare arcade, both the brightening in 1700 Å and the EM enhancement at are much more pronounced at the upper (shadowed) ribbon than those at the lower (exposed) ribbon (figure 7), which may indicate asymmetric heating and/or asymmetric loop geometry. Previous studies also report post-flare loops with one half of the loop being hotter and brighter than the other half (see Gou et al., 2016, and references therein).
Thus, our analysis indicates that the bright emission at the collision site generated in response to the SAD’s arrival at and submergence below the top of the post-flare arcade exhibits the presence of hot plasma only up to 5 MK, whereas any substantial change of thermodynamical characteristics of plasma in the temperature larger than MK is not evident. It implies that the brightening at the collision site in projection can be contributed by both the heated plasma at the collision site of the SADs and the cooler plasma at the upper ribbon. The expansion of the latter may be responsible for the apparent “rebound” motion discussed in Samanta et al. (2021).
4 Discussion and Conclusion
Often observed during the post-maximum phase of the flare, supra-arcade downflows (SADs) are dark blob-like features that are believed to descend through the stretched cusp-shaped magnetic-field lines onto the post-flare loop arcade. This work presents the analysis of six episodes of SADs well observed during the decay phase of an M-class flare of April 11, 2013, which occurred in AR 11719 located close to the disk center. Primarily based on the analysis of limb events, previous investigations interpreted that SADs are either the cross-section (McKenzie, 2000; Savage et al., 2010) or the wake (Savage et al., 2012) of the retracting field lines. Alternately, SADs are attributed to the flow channels carved out by the reconnection generated outflow jets (Cassak et al., 2013). Here, we took advantage of the on-disk location of the flare to focus our investigation on probing the interaction of the SADs with the post-flare loop arcade and its low-atmosphere response, leading to our analysis and results differ substantially from those presented in Samanta et al. (2021) who investigated the SADs observed in the same flare.
4.1 Thermal characteristics of SADs
Thermal characteristics of the plasma contained in the SADs have been investigated since their earliest appearance. Our analysis revealed that SAD cases that occurred close to the flare-maximum contained hot plasma of temperature 5–7 MK (see figure 2). If the SADs were reconnection-generated sunward outflows (Asai et al., 2004; Cassak et al., 2013), the enclosed material could be attributed to the plasma heated during reconnection. However, the SAD cases which occurred in the late decay phase of the flare did not exhibit any discernible signature of hot plasma within. The presence of moderately hot plasma inside the SAD cases that occur close to the flare maximum despite its absence in the SAD cases which occur later in the gradual phase could mainly be attributed not only to the time duration passed since the flare peak, which is associated with diminishing reconnection rate, but also to the longer cooling times experienced by the SADs produced at higher and higher altitudes, thus explaining a variety of temperature and density of SADs obtained previously in the literature.
It should be noted that our analysis indicates the presence of 5–7 MK plasma clearly only in 2 cases that occurred earlier, whereas, for the rest of the cases, the derived thermodynamical characteristics within and outside the SADs are similar to that obtained in Savage et al. (2012). We further determined the level of depression of EM values in 7–12 MK at the SAD location relative to the surrounding, which indicates an increasing reduction (71% to 43%) in the high-temperature plasma content in the SADs that occur sequentially later in the decay phase. In comparison, Savage et al. (2012) estimated the depression of the EM values at the SAD location in 10–13 MK by a factor of 4 compared to that of the surrounding plasma. We note that the previously analyzed SAD cases often take place late in the flare decay phase, possibly limited by the observational contrast of SADs relative to the ambient bright supra-arcade region. For example, the SADs in Savage et al. (2012) occurred 90 minutes after the flare maximum. Recently, Bröse et al. (2022) made the investigation of thermal characteristics of five SAD cases that occurred in the gradual phase of an M5.6 flare of 13 January 2015. In their SAD#4 which occurred relatively early in the decay phase, they reported a localized enhancement of the EM-weighted temperature from 8.6 MK to 11 MK during the passing of the SAD. Therefore, more investigations are required for the SAD cases that occur in all stages of the flare decay phase to understand the comprehensive thermodynamical nature of the plasma contained in the SADs.
4.2 Waves & oscillations induced by SADs
Our investigation of SADs’ interaction with the structures in the supra-arcade region and post-flare loops revealed the generation of two distinct wave-like perturbations, namely the transverse oscillations exhibited by supra-arcade rays in the wake of the SAD passage (figure 3), and downward propagating (speed 1000500 km–s-1) and expanding EUV intensity oscillations following the collision of the voids with the post-flare loop-arcade (figure 4). The periods of transverse oscillations of supra-arcade rays as well as those of intensity oscillations in the post-flare loop arcade are both found to be ranging between 120–150s. Since the propagating nature of transverse oscillations in the supra-arcade rays could not be confirmed, the oscillations are temporarily interpreted to be standing kink-waves (Aschwanden et al., 2002). Alternatively, Cooper et al. (2003) suggested that line-of-sight column depth variation of the coronal loops in the kink mode can result in intensity oscillations along the loop. On the other hand, the dynamical characteristics (e.g. period, speed) of intensity oscillations in the post-flare loop-arcade are similar to those obtained in the investigation of Verwichte et al. (2005), who interpreted these sunward propagating waves (phase speeds up to 700 km–s-1) as fast magneto-acoustic kink waves.
4.3 Loop foot-point brightenings associated with SADs
The interaction of the SAD with the apex of cusp-shaped loops in the supra-arcade region is temporally associated with the formation of kernel-shaped brightening at the foot-point region of the loops, as seen by combining 131 Å, 1700 Å, as well as H images (case#2 in Figure 5 and case#3 in Figure 6). By envisaging a cusp-shaped loop structure involved in the interaction with the SAD, the perturbations are estimated to propagate with a speed up to 600 km–s-1 (Figure 5 & Figure 6). Observationally, such interactions appear to be similar to the cases in which SADs flow into the vertical current sheet from the edge-on perspective or into supra-arcade rays from the side-on perspective, resulting in the splitting of the latter structures as revealed in Innes et al. (2014), and more recently in Liu & Wang (2021). Further, the rapid propagation of the energy, and the lack of evidence of localized strong heating induced by SADs at the ‘collision site’ appear to be consistent with the picture proposed by Liu (2013), in which the dark voids (SADs) within the vertical current sheet (VCS) are mini flux-ropes formed during the process of reconnection. Subsequently, the highly stretched, post-reconnection flux tube smooths out its twist concentration, i.e., a plasmoid, as it retracts toward the post-flare arcade to become potential-like through Alfvén waves propagating towards the footpoints (Fletcher & Hudson, 2008). Since in this picture the free energy (magnetic twist) carried by SADs is primarily transported to the surface by Alfvén waves and causes footpoint brightening, it is not expected to observe significant heating surrounding the SADs as found in our analysis.
The collision of the SADs with the post flare loops resulted in intense EUV brightening over a relatively extended region at the collision site in projection, also reported previously by Samanta et al. (2021) who interpreted the apparent upflow of the bright material as rebounding motions. Our investigation of the ribbon response to the SAD’s descent using 1700 Å images (and in H wavelengths) revealed co-temporal, co-spatial enhancements at the upper ribbon with a morphology similar to that observed at the collision site in the EUV images. Moreover, the speed of the ribbon expansion is found to be comparable to the apparent upflow speed of the EUV brightening observed after the collision. We further investigate the thermodynamical characteristics of the enhanced emission to discern the contribution of plasma at the collision-site from that at the ribbon. Since the upper ribbon is shadowed by the post-flare loop-arcade, we utilized enhancements observed in the lower (exposed) ribbon in 1700 Å for this purpose. Emission measure distribution of the brightening generated at the collision site during and after the SAD’s submergence below the post-flare loop top clearly indicates the enhancement of hot plasma only up to 5 MK, particularly in the temperature range . This enhancement suggests that the apparent brightening at the top of the arcade in response to the SAD’s arrival has a significant contribution from the enhanced ribbon emission in the transition region (Fe VIII at ; see O’Dwyer et al. (2010)). Thus, this analysis revealed that the brightening at the collision site is contributed not only by the heated plasma at the collision site of the SADs but also due to the footpoint emission shadowed by the flare arcade superposed along the line of sight. Samanta et al. (2021) found an increment in temperatures of the post-flare loop arcade to 20 MK in 10-15 minutes after the interaction of SADs. Further, recently Bröse et al. (2022) investigated the nature of cooling of supra-arcade fans (SAFs) and coronal loops in a flare event with distinct episodes of SADs observed up to several hours after the impulsive phase. They found the observed cooling time of the SAFs and loops to be significantly longer than that estimated by the theoretical cooling model by Cargill et al. (1995). However, the authors did not investigate how SADs affect the cooling of SAFs and loops in the gradual phase. Therefore, while the localized heating due to downflows has been amply reported in the previous investigations, the present work provides a definitive evidence of heating at the footpoint location associated with the SAD’s descent.
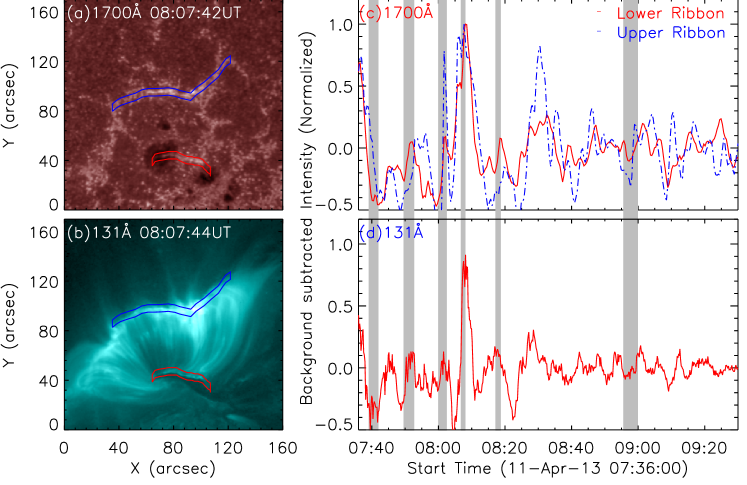
To further examine the association of ribbon brightening as seen in UV (1700 Å) as well as in EUV (131 Å) with the SAD propagation, we deduce the time evolution of averaged intensity over a 6” wide region spanning over the entire ribbon (figure 8). We subtracted the deduced time-series with a background prepared by smoothing the time-series with a boxcar of 20-minute width. The normalized intensity profiles enable us to correlate the time periods of enhancements at the lower and upper ribbons with those of a SAD’s descent until its submergence in the post-flare loops, marked by the grey shaded vertical regions. Except for cases #1 and 6, we find that the foot-point brightenings are temporally linked with the SADs’ interaction with the loops. This is in agreement with the detailed analysis of case#2 and 3, presented in figure 5 & figure 6, respectively. For the cases where the association is not evident, we suspect that the interaction may not be strong enough. This analysis is similar to the investigation made in Asai et al. (2004), where an excellent correlation is found between the downflows and non-thermal bursts in all the cases except one. A periodicity of 10-minute is also found in the E/UV emission corresponding to the ribbon region, in agreement to that obtained by Samanta et al. (2021), who, however, derived the intensities only in 131 Å over the entire flare region. Therefore, our investigation agrees with Samanta et al. (2021) in the sense that the quasi-periodic nature of the EUV emission during the gradual phase of the flare might be regulated by descending SADs but we argue that this emission enlists a definitive contribution from the foot-point. The fractional contribution of the foot-point in the quasi-periodic EUV emission may have important implications for space weather yet remains to be investigated.
Recently, Shen et al. (2022) investigated the nature of dark downflows in a three-dimensional magnetohydrodynamical model of solar flares and compared the model predictions with the nature of downflows as observed. Since our observations also contain the SADs above the arcade, we discuss the present results in context to the simulation of Shen et al. (2022). Similar to observations, the finger-like voids in the simulation are developed in the interface region, i.e., the cusp or above-the-looptop region. However, the dynamic, bright finger-like structures above the loop top in the simulation seem to be different from the stable, extended spikes in observations (e.g., Liu & Wang, 2021). In their synthetic AIA 131 Å image (Fig. 2c in Shen et al., 2022), the termination shock front is still marginally visible as some diffuse, horizontal features; yet in observation, such features may become indiscernible against the stronger background on the disk than above the limb. On the other hand, the simulation does show that some dark voids penetrate deeply into the post-flare arcade and post-flare field lines are disturbed, and the disturbances do propagate along field lines to the surface (see their Supplementary Video 1), which are compared favorably to our observation.
In conclusion, our analysis provides evidence that some SADs occurring close to the flare maximum may contain heated plasma, which may originate from their production sites, where magnetic reconnection is ongoing, and/or result from being compressed by the surrounding coronal plasma though which SADs descend. The combination of prolonged cooling and diminishing reconnection rate may explain the absence of such heated plasma in SADs produced in the late phase, which are associated with reconnections taking place in higher altitudes. The fact that intermittent SADs throughout the flare gradual phase may be associated with flare-ribbon emission enhancements corroborates a potentially important way of transporting flaring energy to the low atmosphere and signifies the role of SADs in quasi-periodic pulsation often observed during the flare gradual phase (Hayes et al., 2019, 2020; Zimovets et al., 2021). Therefore, supra-arcade downflows are an excellent probe of the thermodynamical state of the plasma and energy release mechanism during the gradual phase of flares.
Appendix A Thermal characteristics of the SAD cases 3, 4, and 6
We have investigated the emission distribution (EM[T]) in all of the SAD cases that have been distinctively observed during the decay phase of the flare. While figure 2 shows the analysis of thermal characteristics of the SAD cases 1, 2 and 5, the analysis for rest of the cases is presented in figure 9.
References
- Asai et al. (2004) Asai, A., Yokoyama, T., Shimojo, M., & Shibata, K. 2004, ApJ, 605, L77, doi: 10.1086/420768
- Aschwanden et al. (2002) Aschwanden, M. J., de Pontieu, B., Schrijver, C. J., & Title, A. M. 2002, Sol. Phys., 206, 99, doi: 10.1023/A:1014916701283
- Awasthi & Liu (2019) Awasthi, A. K., & Liu, R. 2019, Frontiers in Physics, 7, 218, doi: 10.3389/fphy.2019.00218
- Awasthi et al. (2018) Awasthi, A. K., Liu, R., Wang, H., Wang, Y., & Shen, C. 2018, ApJ, 857, 124, doi: 10.3847/1538-4357/aab7fb
- Berger et al. (2010) Berger, T. E., Slater, G., Hurlburt, N., et al. 2010, ApJ, 716, 1288, doi: 10.1088/0004-637X/716/2/1288
- Bröse et al. (2022) Bröse, M., Warmuth, A., Sakao, T., & Su, Y. 2022, A&A, 663, A18, doi: 10.1051/0004-6361/202141868
- Cargill et al. (1995) Cargill, P. J., Mariska, J. T., & Antiochos, S. K. 1995, ApJ, 439, 1034, doi: 10.1086/175240
- Cassak et al. (2013) Cassak, P. A., Drake, J. F., Gosling, J. T., et al. 2013, ApJ, 775, L14, doi: 10.1088/2041-8205/775/1/L14
- Cécere et al. (2012) Cécere, M., Schneiter, M., Costa, A., Elaskar, S., & Maglione, S. 2012, ApJ, 759, 79, doi: 10.1088/0004-637X/759/2/79
- Cécere et al. (2015) Cécere, M., Zurbriggen, E., Costa, A., & Schneiter, M. 2015, ApJ, 807, 6, doi: 10.1088/0004-637X/807/1/6
- Chen et al. (2017) Chen, X., Liu, R., Deng, N., & Wang, H. 2017, A&A, 606, A84, doi: 10.1051/0004-6361/201629893
- Cheung et al. (2015) Cheung, M. C. M., Boerner, P., Schrijver, C. J., et al. 2015, ApJ, 807, 143, doi: 10.1088/0004-637X/807/2/143
- Cooper et al. (2003) Cooper, F. C., Nakariakov, V. M., & Tsiklauri, D. 2003, A&A, 397, 765, doi: 10.1051/0004-6361:20021556
- Fletcher & Hudson (2008) Fletcher, L., & Hudson, H. S. 2008, ApJ, 675, 1645, doi: 10.1086/527044
- Forbes & Acton (1996) Forbes, T. G., & Acton, L. W. 1996, ApJ, 459, 330, doi: 10.1086/176896
- Gou et al. (2019) Gou, T., Liu, R., Kliem, B., Wang, Y., & Veronig, A. M. 2019, Science Advances, 5, 7004, doi: 10.1126/sciadv.aau7004
- Gou et al. (2016) Gou, T., Liu, R., Wang, Y., et al. 2016, ApJ, 821, L28, doi: 10.3847/2041-8205/821/2/L28
- Guo et al. (2014) Guo, L. J., Huang, Y. M., Bhattacharjee, A., & Innes, D. E. 2014, ApJ, 796, L29, doi: 10.1088/2041-8205/796/2/L29
- Hayes et al. (2019) Hayes, L. A., Gallagher, P. T., Dennis, B. R., et al. 2019, ApJ, 875, 33, doi: 10.3847/1538-4357/ab0ca3
- Hayes et al. (2020) Hayes, L. A., Inglis, A. R., Christe, S., Dennis, B., & Gallagher, P. T. 2020, ApJ, 895, 50, doi: 10.3847/1538-4357/ab8d40
- Innes et al. (2014) Innes, D. E., Guo, L. J., Bhattacharjee, A., Huang, Y. M., & Schmit, D. 2014, ApJ, 796, 27, doi: 10.1088/0004-637X/796/1/27
- Khan et al. (2007) Khan, J. I., Bain, H. M., & Fletcher, L. 2007, A&A, 475, 333, doi: 10.1051/0004-6361:20077894
- Lemen et al. (2012) Lemen, J. R., Title, A. M., Akin, D. J., et al. 2012, Sol. Phys., 275, 17, doi: 10.1007/s11207-011-9776-8
- Liu (2013) Liu, R. 2013, MNRAS, 434, 1309, doi: 10.1093/mnras/stt1090
- Liu et al. (2010) Liu, R., Lee, J., Wang, T., et al. 2010, ApJ, 723, L28, doi: 10.1088/2041-8205/723/1/L28
- Liu & Wang (2021) Liu, R., & Wang, Y. 2021, A&A, 653, A51, doi: 10.1051/0004-6361/202140847
- Maglione et al. (2011) Maglione, L. S., Schneiter, E. M., Costa, A., & Elaskar, S. 2011, A&A, 527, L5, doi: 10.1051/0004-6361/201015934
- McKenzie (2000) McKenzie, D. E. 2000, Sol. Phys., 195, 381, doi: 10.1023/A:1005220604894
- McKenzie & Hudson (1999) McKenzie, D. E., & Hudson, H. S. 1999, ApJ, 519, L93, doi: 10.1086/312110
- McKenzie & Savage (2009) McKenzie, D. E., & Savage, S. L. 2009, ApJ, 697, 1569, doi: 10.1088/0004-637X/697/2/1569
- Milligan et al. (2010) Milligan, R. O., McAteer, R. T. J., Dennis, B. R., & Young, C. A. 2010, ApJ, 713, 1292, doi: 10.1088/0004-637X/713/2/1292
- O’Dwyer et al. (2010) O’Dwyer, B., Del Zanna, G., Mason, H. E., Weber, M. A., & Tripathi, D. 2010, A&A, 521, A21, doi: 10.1051/0004-6361/201014872
- Pesnell et al. (2012) Pesnell, W. D., Thompson, B. J., & Chamberlin, P. C. 2012, Sol. Phys., 275, 3, doi: 10.1007/s11207-011-9841-3
- Reeves et al. (2017) Reeves, K. K., Freed, M. S., McKenzie, D. E., & Savage, S. L. 2017, ApJ, 836, 55, doi: 10.3847/1538-4357/836/1/55
- Samanta et al. (2021) Samanta, T., Tian, H., Chen, B., et al. 2021, The Innovation, 2, 100083, doi: 10.1016/j.xinn.2021.100083
- Savage & McKenzie (2011) Savage, S. L., & McKenzie, D. E. 2011, ApJ, 730, 98, doi: 10.1088/0004-637X/730/2/98
- Savage et al. (2012) Savage, S. L., McKenzie, D. E., & Reeves, K. K. 2012, ApJ, 747, L40, doi: 10.1088/2041-8205/747/2/L40
- Savage et al. (2010) Savage, S. L., McKenzie, D. E., Reeves, K. K., Forbes, T. G., & Longcope, D. W. 2010, ApJ, 722, 329, doi: 10.1088/0004-637X/722/1/329
- Scott et al. (2013) Scott, R. B., Longcope, D. W., & McKenzie, D. E. 2013, ApJ, 776, 54, doi: 10.1088/0004-637X/776/1/54
- Shen et al. (2022) Shen, C., Chen, B., Reeves, K. K., et al. 2022, Nature Astronomy, 6, 317, doi: 10.1038/s41550-021-01570-2
- Su et al. (2018) Su, Y., Veronig, A. M., Hannah, I. G., et al. 2018, ApJ, 856, L17, doi: 10.3847/2041-8213/aab436
- Su et al. (2013) Su, Y., Veronig, A. M., Holman, G. D., et al. 2013, Nature Physics, 9, 489, doi: 10.1038/nphys2675
- Sui & Holman (2003) Sui, L., & Holman, G. D. 2003, ApJ, 596, L251, doi: 10.1086/379343
- Takasao et al. (2012) Takasao, S., Asai, A., Isobe, H., & Shibata, K. 2012, ApJ, 745, L6, doi: 10.1088/2041-8205/745/1/L6
- Verwichte et al. (2005) Verwichte, E., Nakariakov, V. M., & Cooper, F. C. 2005, A&A, 430, L65, doi: 10.1051/0004-6361:200400133
- Wang et al. (1999) Wang, Y. M., Sheeley, N. R., J., Howard, R. A., Cyr, O. C. S., & Simnett, G. M. 1999, Geophys. Res. Lett., 26, 1203, doi: 10.1029/1999GL900209
- Xue et al. (2020) Xue, J., Su, Y., Li, H., & Zhao, X. 2020, ApJ, 898, 88, doi: 10.3847/1538-4357/ab9a3d
- Xue et al. (2016) Xue, Z., Yan, X., Cheng, X., et al. 2016, Nature Communications, 7, 11837, doi: 10.1038/ncomms11837
- Zimovets et al. (2021) Zimovets, I. V., McLaughlin, J. A., Srivastava, A. K., et al. 2021, Space Sci. Rev., 217, 66, doi: 10.1007/s11214-021-00840-9