Galaxy And Mass Assembly: Galaxy Morphology in the Green Valley, Prominent rings and looser Spiral Arms
Abstract
Galaxies broadly fall into two categories: star-forming (blue) galaxies and quiescent (red) galaxies. In between, one finds the less populated “green valley". Some of these galaxies are suspected to be in the process of ceasing their star-formation through a gradual exhaustion of gas supply or already dead and are experiencing a rejuvenation of star-formation through fuel injection. We use the Galaxy And Mass Assembly database and the Galaxy Zoo citizen science morphological estimates to compare the morphology of galaxies in the green valley against those in the red sequence and blue cloud. Our goal is to examine the structural differences within galaxies that fall in the green valley, and what brings them there. Previous results found disc features such as rings and lenses are more prominently represented in the green valley population. We revisit this with a similar sized data set of galaxies with morphology labels provided by the Galaxy Zoo for the GAMA fields based on new KiDS images. Our aim is to compare qualitatively the results from expert classification to that of citizen science.
We observe that ring structures are indeed found more commonly in green valley galaxies compared to their red and blue counterparts. We suggest that ring structures are a consequence of disc galaxies in the green valley actively exhibiting characteristics of fading discs and evolving disc morphology of galaxies. We note that the progression from blue to red correlates with loosening spiral arm structure.
keywords:
galaxies: bar, galaxies: bulges, galaxies: disc, galaxies: evolution, galaxies: spiral, galaxies: star formation1 Introduction
Previous large-scale surveys of galaxies have revealed a bi-modality in the colour-magnitude diagram of galaxies with two distinct populations: one with blue optical colours and another with red optical colours (Strateva et al., 2001; Baldry et al., 2004; Bell et al., 2004; Martin et al., 2007; Faber et al., 2007; Baldry et al., 2006; Willmer et al., 2006; Ball et al., 2008; Brammer et al., 2009; Mendez et al., 2011; Taylor et al., 2015; Corcho-Caballero et al., 2020; Corcho-Caballero et al., 2021). These populations were dubbed the “blue cloud” (BC), or “star-forming galaxy sequence”, and the “red sequence” (RS) respectively (Driver et al., 2006; Faber et al., 2007; Salim, 2015). The blue cloud and red sequence are best separated at higher stellar mass and mix at lower stellar masses (cf. Taylor et al., 2015).
The Galaxy Zoo (GZ) project (Lintott et al., 2008), which produced morphological classifications for a million galaxies, helped to confirm that this bi-modality is not entirely morphology driven (Salim et al., 2007; Schawinski et al., 2007; Bamford et al., 2009; Skibba et al., 2009, Figure 1). It suggested larger fractions of spiral galaxies in the red sequence111The red sequence was originally known as the color-magnitude relation for early-type galaxies, see the review in Graham (2013). (Masters et al., 2010) and elliptical galaxies in the blue cloud (Schawinski, 2009) than had previously been detected.
The sparsely populated colour-mass space between these two populations, the so-called “Green Valley” (green valley) (Figure 2), provides clues to the nature and duration of a galaxies’ transitions from blue cloud to red sequence. This transition must occur on rapid timescales, otherwise there would be an accumulation of galaxies residing in the green valley, rather than an accumulation in the red sequence as is observed (Arnouts et al., 2007; Martin et al., 2007; Smethurst et al., 2015, 2017; Nogueira-Cavalcante et al., 2017; Bremer et al., 2018; Phillipps et al., 2019; Barone et al., 2022). Alternatively, gas infall onto red sequence galaxies may rejuvenate them into the green valley (e.g. Graham et al., 2017). green valley galaxies have therefore long been thought of as the “crossroads” of galaxy evolution, a transitional population between the two main galactic stages of the star-forming blue cloud and the “red & dead” sequence (Bell et al., 2004; Martin et al., 2007; Faber et al., 2007; Mendez et al., 2011; Schawinski et al., 2014; Pan et al., 2015; Graham, 2019), however, it is possible that these are also red sequence galaxies that have been rejuvenated (Graham et al., 2015, 2017).
The intermediate colours of these green valley galaxies have been interpreted as evidence for recent quenching (suppression) of star formation (Salim et al., 2007; Salim, 2015; Smethurst et al., 2015; Phillipps et al., 2019). Star-forming galaxies are observed to lie on a well defined stellar mass-SFR relation (Martin et al., 2005), however, quenching a galaxy causes it to depart from this relation (Noeske et al., 2007; Peng et al., 2010). The main mechanism for galaxy quenching is thought to be a lack of fuel for star formation. Fading of the star-forming disc, the primary site of star formation, drives the apparent morphological transition of galaxies from spiral to lenticular or elliptical in the galaxies that are quenching and lie in the green valley (Coenda et al., 2018; Bluck et al., 2020; Fraser-McKelvie et al., 2019, 2020a, 2020b).
Kelvin et al. (2018) examined 472 galaxies in the Galaxy And Mass Assembly (GAMA) survey with SDSS imaging visually for signs of disc substructures (e.g., rings, bars, and lenses) with a team of expert classifiers. They found evidence that rings and lenses are more common in the green valley then in red sequence and blue cloud galaxies. Our goal here is to re-examine this result using the GZ morphological estimates using the higher resolution and deeper Kilo-Degree Survey (KiDS) images (Kuijken et al., 2019) of the galaxies in the GAMA survey’s equatorial fields (Driver et al., 2011). Our sample is of similar size as that of Kelvin et al. (2018) (396 vs 472) and there is likely overlap. There are two critical differences: the method of classification and the quality of the data. Our classifications are based on much improved data and arrived at with citizen science voting rather than a small expert panel. Our aim is to examine if the different data and classification schemes arrive at qualitatively the same conclusions for the morphology of the green valley.
2 Data
In this paper, we use GAMA and Galaxy Zoo voting data based of the KiDS imaging.
2.1 GAMA
The GAMA survey is a spectroscopic survey comprised of three equatorial fields and two Southern fields. Its multi-wavelength photometry ranges from ultraviolet to sub-mm wavelengths (Driver et al., 2009; Hopkins et al., 2013; Liske et al., 2015). Redshifts (z) are reliably found to z and the survey is complete to 98% for an apparent magnitude in Sloan Digital Sky Survey -filter (SDSS-) of 19.8 mag in the equatorial fields. Here, we consider only these (G09, G12 and G15), as they overlap with the KiDS (KiDS de Jong et al., 2013; de Jong et al., 2015, 2017; Kuijken et al., 2019), on which the GZ information is based (see next section).
We use GAMA optical photometry from SDSS Stripe-82 photometry Taylor et al. (2011), which is corrected for redshift (K-correction) and internal dust extinction. The final photometry we used is the LAMBDAR photometry (v01) presented in Wright et al. (2017).
Separately, we use stellar masses derived from the spectral energy distribution (SED) model fit using magphys tool (da Cunha et al., 2008), presented in Driver et al. (2016); Wright et al. (2017) (v06 in DR3).
2.2 KiDS GZ
The GZ citizen science project analyzed KiDS (de Jong et al., 2013; de Jong et al., 2015, 2017; Kuijken et al., 2019) images. Citizen scientists answered a series of questions based on KiDS g-band and r-band imaging. A synthetic green channel was constructed as the arithmetic mean of the other two to allow for the construction of three-colour RGB images. Because morphological detail is lost with distance, a limit of is enforced to ensure reliable morphological estimates of kpc-scale structures (e.g. spiral arms, bars). Initially we ran this data with a , however, we realized limitations in the Galaxy Zoo data that limited us to making resolution for many morphological structures difficult. Therefore, we decided on our sample to to limit the bias due to distance effects in the Galaxy Zoo voting.
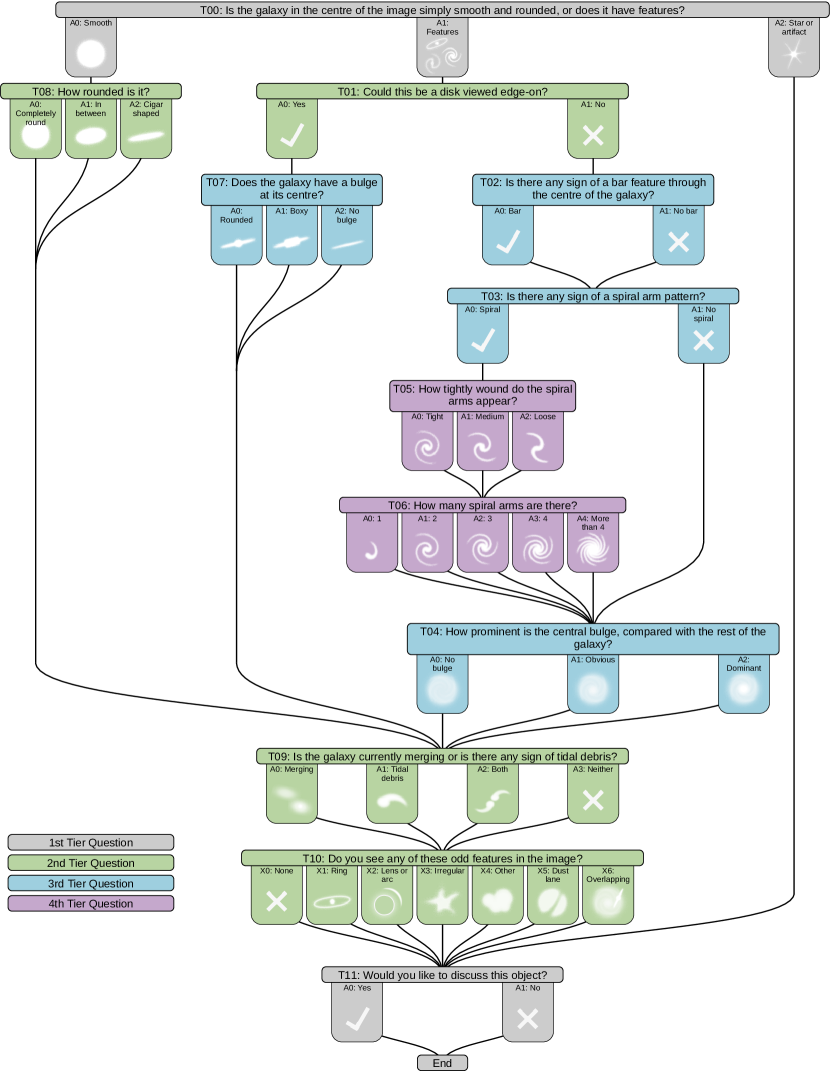
The GZ question tree is presented in Holwerda et al. (2019) and in Figure 1. The full Galaxy Zoo classification is described in Kelvin et al. (in preparation). We focus on the questions that are asked in the GZ question tree (Figure 1) regarding disc galaxy morphology. In section 3, we begin each subsection with the question code and associated question of the morphological features as asked in the GZ questionnaire. These question codes are T00, T01, T02, T03, T04, T05, T06, T09 and T10. We refer the reader to Kelvin et al. (in preparation) for specific details of the GZ analysis. We used an internal GAMA/KiDS catalogue for the subsequent analysis.
2.3 Sample selection
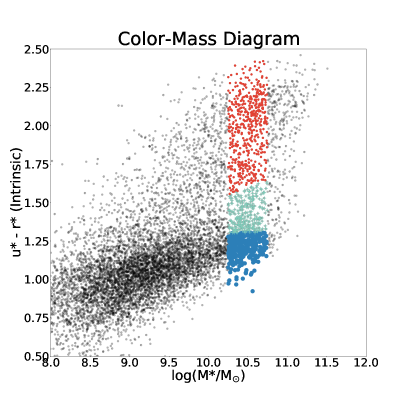
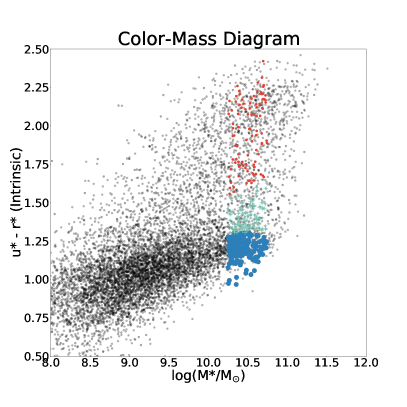
We organized our GZ data by stellar mass, log(, vs. intrinsic stellar population colour plane (* - *) (the population selections are from Bremer et al., 2018). Figure 2 shows our selection of blue cloud, green valley, and red sequence galaxies, based on their stellar mass and rest-frame colour. A second requirement is that these galaxies are disc-dominated following the T00 question (Figure 1) “Is the galaxy in the centre of the image simply smooth and rounded or does it have features?” with any fraction of the votes in favor of any features (). This is to remove any galaxies without features to further examine.
For the first graph in Figure 2 we limited the mass to 10.25 log() 10.75 and a redshift of . This mass range was selected to ensure a complete sample and for a more direct comparison with Kelvin et al. (2018), who select galaxies in the same mass range. This mass range covers the tip of the blue cloud at low z, this is necessary because for galaxies to continue evolving beyond this point, they must transition across the green valley (Bremer et al., 2018). The redshift limit was imposed to ensure that distance effects on the GZ voting are minimal (see the discussion in Willett et al., 2013, on distance effects). Beyond z=0.075, the resolution of KiDS images is not sufficient to discriminate features of a kiloparsec in scale, such as the width of spiral arms and rings. The voting can be corrected using debiasing but the GAMA dataset may be too small for that (but the Galaxy Zoo v4 will be).
The right graph of Figure 2 represents the galaxies in each faction that are voted in the GZ to have any votes for “Could this be a disc viewed edge on” as no and “Is there any sign of a spiral arm pattern?" that registered 30% or higher. (T01 and T03 in the Figure 1 respectively). To do this, we set the voting for T01 results to fraction limits between 0.0001 and 0.9999 to prevent the possible error of galaxies with single votes throwing off the results, and to maximize those votes for features. We continued to do the same with T02, however this time we set the limits between .3 and 1. This allowed us to choose galaxies that had votes for bulges, spiral features and all other morphological features down this branch of the questionnaire. Lastly for this step we limited our selection for spiral features in the same way. We were left with a data set of 176 for blue cloud, 118 for green valley, and 102 for red sequence for the total of 396 in the mass range considered.
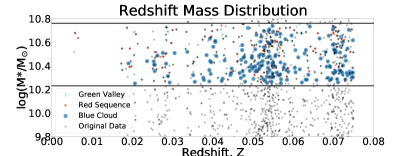
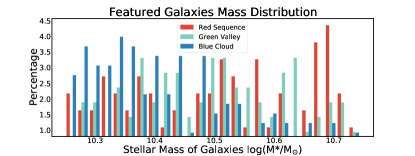
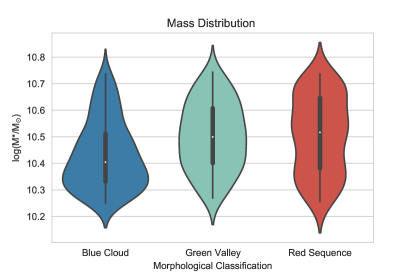
Figure 3 shows the distribution of featured galaxies in redshift (z) and stellar mass (). Our selection is made to the specifications of 10.25 log() 10.75 and z 0.075, the redshift limit of GZ pre-selection for classification. This gives us a good representative volume to compare galaxy morphology. We find that red sequence galaxies are at slightly higher masses than the blue cloud, with the green valley galaxies spanning an intermediate mass range. The galaxy spread is better represented by mass in Figure 4.
3 Results
We compared the normalized fractions of galaxies between the blue cloud, green valley, and red sequence galaxies to generate the voting histograms and violin plots showing sample fractions in the following subsections.
As shown in Figure 1, each tier signified with a code, T##. This code represents question asked in the GZ about a morphological trait with the number denoting the tier of each question. We organized each subsection by these question codes with their represented data in a histogram.
The tool used to compare these data is the Kolmogorov-Smirnov (K-S) two-sample similarity test and the associated p-value calculated for our selection samples. The K-S value provides the maximum difference between any 2 cumulative distributions we consider. The p-value is the probability of the random occurrence of the presented null hypothesis (the distributions are the same).
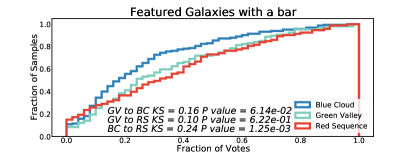
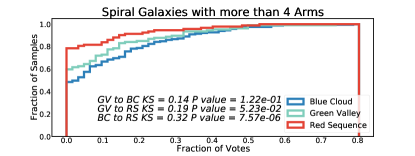
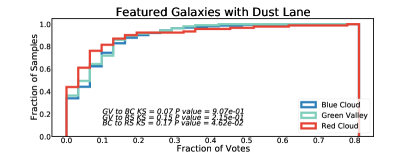
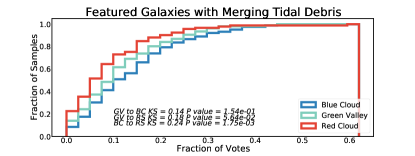
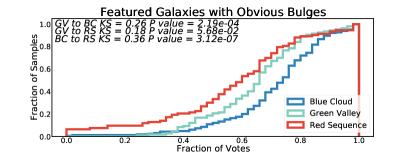
We plot the voting in the Galaxy Zoo in two ways in each of the following Figures. In the top panel, we plot the cumulative histogram of the voting in Galaxy Zoo: on the x-axis is the fraction of voting in favor of the question under consideration and on the y-axis the fraction of the sample is shown. A plot that rises early has a larger fraction of the sample with a low fraction of the votes in favor of this feature being present. In this case, the feature is relatively rare. If the plot rises on the right of the x-axis, a large fraction of the sample has a high fraction of votes (or greater consensus) that this feature is present.
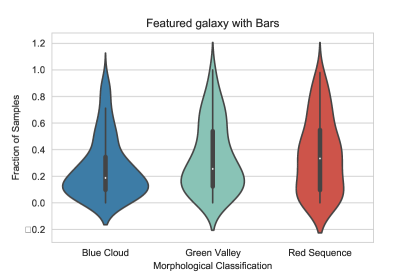
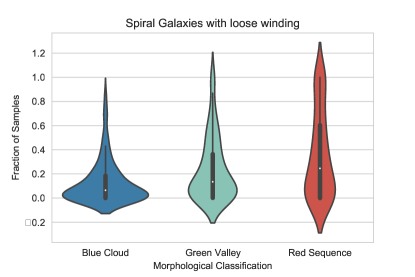
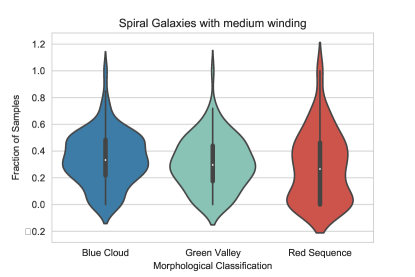
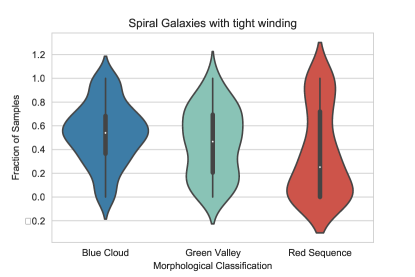
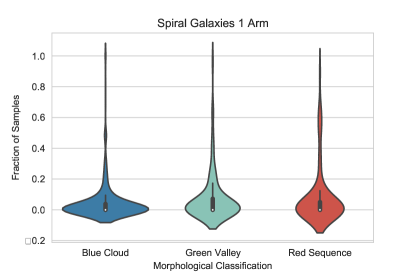
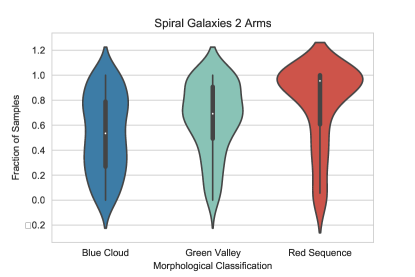
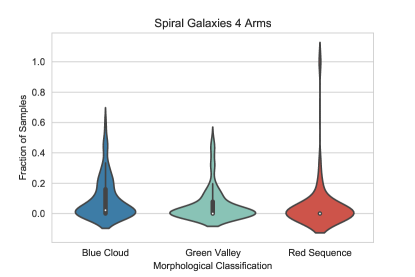
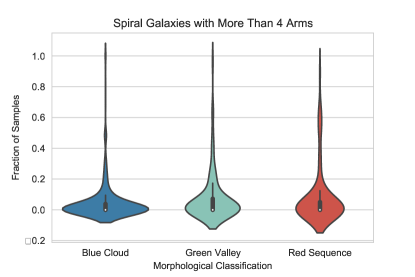
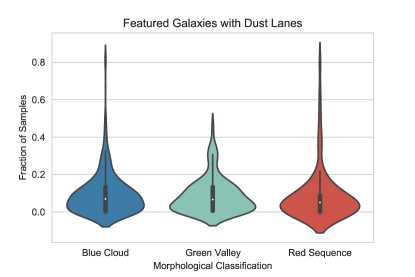
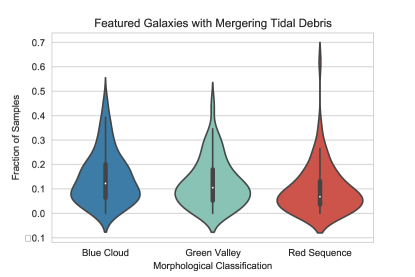
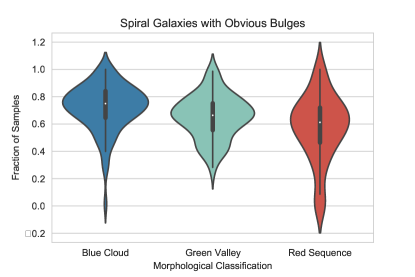
In the lower panel we present the same fraction of the voting in a more traditional histogram, rendered as a violin plot (a mirrored histogram with a kernel density applied to render it into a smooth graph). Because the distribution is slightly smoothed, the range of values in the y-axes in the Figures goes from -0.2 to 1.2 to accommodate the tails resulting from the kernel smoothing. The range and standard deviations of the distribution are also shown as thin and thick horizontal lines.
By combining both graphical visualizations in each plot, we hope to show both when voting behaviour between populations is similar or dissimilar in the cumulative distribution, reflected in the K-S metric, and how the voting behavior looks in each population in a more intuitive histogram rendering.
3.1 Bars
Figure 1, T02: “Is there a sign of a bar feature through the centre of the galaxy?"
Stellar bars are a prime suspect for a morphological feature that aids in quenching, especially quenching from the inside-out (see Masters et al., 2021, for a review).
GZ voting show that red sequence and green valley have a lower fraction of galaxies having bar shaped structures than blue cloud. In our statistical analysis, we have chosen to only include galaxies that were voted as bar galaxies 50 % () or more of the time. From our galaxy sample for each faction, 12.1% of blue cloud, 20.1% of green valley, and 19.3% of red sequence galaxies met this requirement. These percentages are to be expected if the green valley is a transition zone and bars are in fact a predecessor to quenching and long-lived enough to do so. Figure 5 shows the similar voting behaviour in Galaxy Zoo in the red sequence and green valley. The notably different behaviour in the blue cloud shows lower confidence in more of the blue cloud sample of galaxies.
3.2 Featured discs
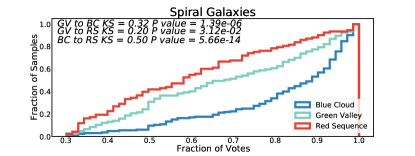
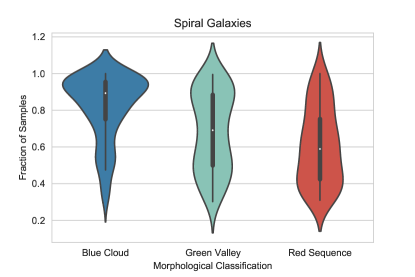
Figure 1, T03: “Is there any sign of a spiral arm pattern?"
Using the voting data from this question showed the galaxies with spiral features in the red sequence, blue cloud, and green valley.
The outcome, as shown in Figure 6, shows that most disc galaxies in the blue cloud are featured galaxies. There are fewer featured galaxies among the disc galaxies of the red sequence. The number of featured galaxies in the green valley falls somewhere in between those present in the blue cloud and red sequence. The fractions of galaxies with discs is possibly an under-estimate as lenticular galaxies are often missed in visual inspections (Graham, 2019).
3.3 Winding of Spiral Arms
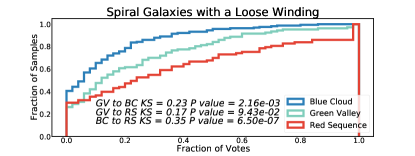
Figure 1, T05: “How tightly wound do the spiral arms appear?”
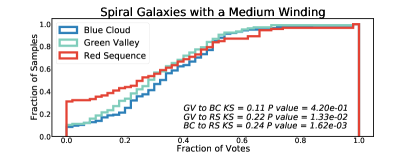
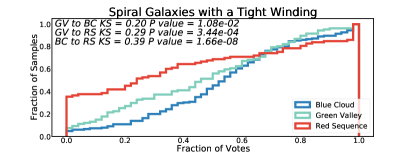
Green valley galaxies tend to follow the blue cloud in behaviour in spiral arm winding of tight and medium, but lead in voting of loose winding. red sequence continues to show the opposite behaviour of the blue cloud (see, for example, Figures 7,8,and 9).
Since T05 is a choice between these three questions and one cannot progress without clicking one option, the plots in Figures 7,8,and 9 are complementary. It shows that loose winding is preferred for blue cloud and tight winding for the red sequence and the green valley voting behaviour is somewhere in between. It also shows that the “medium” option voting is much more similar for all three populations as a compromise option but remains less of a preference for the red sequence galaxies, strongly suggesting that red sequence galaxies have tightly wound arms.
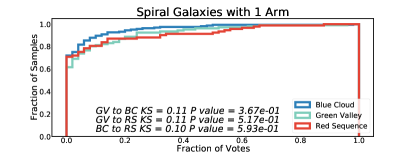
3.4 Number of Spiral Arms
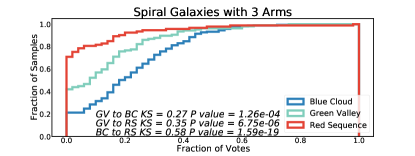
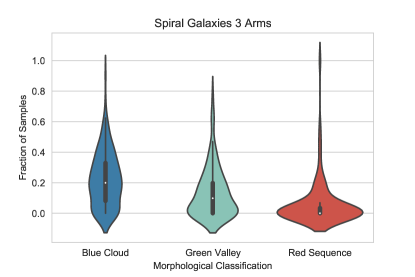
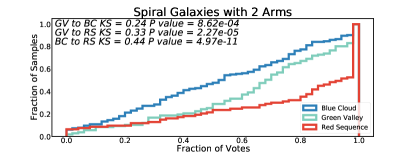
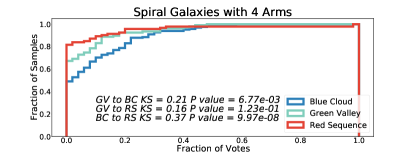
Figure 1, T06: “How many spiral arms are there?”
Green valley galaxies are more symmetric ( rotationally symmetric), as the higher relative voting fraction points out. They are favored to have 2 arms, rather than 1 or 3 (which may be symmetric). Spiral galaxies with an odd number of arms are more commonly found in the blue cloud, the voting suggests (see, for example, Figure 10). The number of arms have been linked to specific star-formation decline (Porter-Temple et al. submitted) and the relative distribution of voting for 3-armed spirals in the red sequence, green valley and blue cloud reflect this.
3.5 Central Bulge Prominence
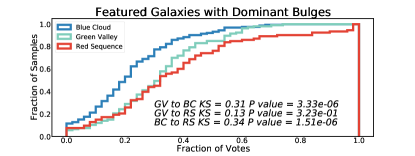
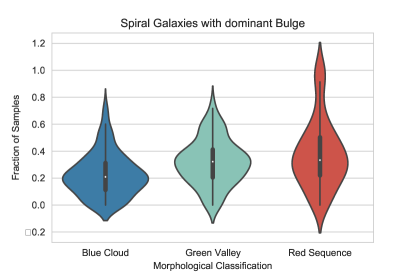
Figure 1, T04: “How prominent is the central bulge, compared with the rest of the galaxy?"
Figure 11 shows the voting behaviour for this question with the highest voting fractions, i.e. largest fraction of the sample with high voting confidence, for a dominant bulge in the red sequence, followed by green valley and blue cloud. This trend is an expected result following the current understanding of galaxy evolution from green valley to red sequence i.e discs fading and turning red and the bulge gaining relative prominence with respect to the disc.
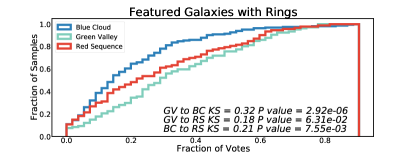
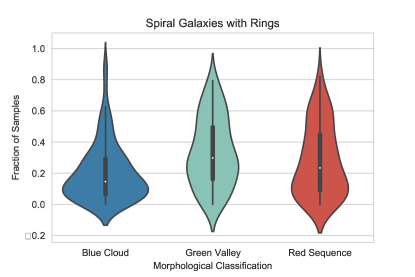
3.6 Rings
Figure 1, T10: “Do you see any of these odd features in the image?"
This last question in the question tree of the Galaxy Zoo (Figure 1) is for citizen scientist to identify rarer morphological phenomena, which are expected to be rare, such as accidental overlaps of galaxies along the line-of-sight (see Keel et al., 2013; Holwerda, 2017, for a discussion on these). One of the options is to identify a ring, as opposed to a lensing object, as this odd feature.
Though the source of rings is still heavily debated, the abundance of inside quenching may be a potential cause (Kelvin et al., 2018). We expect a direct correlation between the presence of bars and rings in featured galaxies if the inside-out quenching theory holds true. We see this behaviour in the blue cloud and the red sequence (steady increase in bars in disc galaxies from blue cloud to red sequence, Figure 5). However, there is an even stronger prevalence of ring galaxies in the green valley (Figure 12). This could be a sign of increased inside quenching or ring formation in the green valley, driven by other possible factors.
4 Discussion
The transition of galaxies from the star-forming blue cloud to the passive red sequence through the green valley is thought to be from a variety of processes, both internal and external and can be in either direction (see Salim, 2015, for a review). There appears to be a relation between galaxy morphology and their transition speed (Schawinski et al., 2014; Smethurst et al., 2015); smooth galaxies undergo a rapid transit through major mergers, intermediate complex galaxies (e.g. S0) undergo minor mergers and galaxy interactions for an intermediate crossing scale, and disc galaxies cross the slowest due to secular processes. In disc galaxies, bars and bulges suspected to play a role in the quenching process (Nogueira-Cavalcante et al., 2017; Gu et al., 2018; Ge et al., 2018; Kelvin et al., 2018). Green valley quenching appears to be ongoing since (Jian et al., 2020) with a mass-dependence on transition speed and phase (Schawinski et al., 2014; Angthopo et al., 2020). Higher mass galaxies appear to quench mostly due to lack of gas supply (Das et al., 2021) and quenching does seem linked to a lack of Circumgalactic Medium (CGM) (Kacprzak et al., 2021). At lower masses, morphological features are thought to influence the quenching speed (Smethurst et al., 2015), motivating our morphological characterization of green valley galaxies.
Citizen scientists were asked if the galaxies they were looking at were ring galaxies. We have analyzed the Galaxy Zoo votes of galaxies of a mass (), as was done in Kelvin et al. (2018). However, we increased the redshift from to thanks to the improved resolution of the KiDS images. This larger sample size gave us very similar overall results to those from Kelvin et al. (2018), i.e. a higher fraction of ring galaxies in green valley featured galaxies. The data presented in Figure 12 demonstrates this behaviour. Initially, we had constrained our sample to z 0.15, the full redshift range of GAMA/GZ data. The results were qualitatively similar but distance effects cannot be fully ruled out and we imposed the limit (the distance KiDS resolution corresponds to a 1 kpc feature).
It is clear that the green valley has a higher concentration of ring featured galaxies than both the red sequence and the blue cloud. This is not the only example of green valley exhibiting its own behaviour, as explained in section 3.3, green valley have an initial behaviour of looser arm windings (Figure 7). We have also shown that the red sequence and green valley have higher concentrations of featured galaxies with bars while the blue cloud possesses the lowest amount of featured galaxies with bars (Figure 5). Earlier studies found that barred galaxies may transition slower (Nogueira-Cavalcante et al., 2017) or that bulges play a role in the transition through the green valley (Ge et al., 2018), some of whom may be rejuvenating rather than quenching (Mancini et al., 2019).
As previously stated, it is theorized that quenching may cause ring formation. The existence of bars may expedite the quenching process, which may in turn lead to faster ring formation. This shows a possible link between in the role bars and rings in galaxy quenching. The green valley represented in the histogram in Figure 5 shows a difference in behaviour than seen with rings in Figure 12. The voting for bars in green valley galaxies in Figure 5 is in between the voting for blue cloud and red sequence. The voting in green valley in Figure 12 is more confident in a rings than either the blue cloud or the red sequence; a larger fraction of the green valley sample has a higher confidence in rings than either comparison sample.
However, by looking at our violin graphs portion of Figure 12, we see that the distribution of the green valley galaxy sample is spread over the whole range of possible values (galaxies with high and low confidence in a ring) while the blue cloud galaxies are mostly clustered at low confidence in rings while the red sequence galaxies resemble a high confidence and a low confidence population. The green valley resemble the red sequence but with higher voting fractions.
This could be due to the fact that this is a transition zone and the younger green valley galaxies have yet to exhibit the bar or ring behaviours that may occur later in their lifetimes in the green valley, just before entering the red sequence. Future studies with even more Galaxy Zoo information will help probe the link between bar and ring formation and the green valley population.
Furthermore, we studied the possibility of a correlation between Dominant bulges and rings (Figures 11 and 12 respectively). Though it does appear that the green valley is in the middle in both the bulge and ring distributions, the role of internal quenching remains unclear. It is not clear why a fading disc will result in either a ring or a tightening of the spiral arm. Perhaps, over time, the reduction of gas in the disc results in a lower density for the spiral density wave (e.g. Roberts et al., 1975; Dobbs & Baba, 2014; Shu, 2016) and thus a different spiral pattern speed. This change in the spiral density wave could lead to either a tightening of the spiral arms or ring formation. This depends however on the dominant formation mechanism for spiral arms (Davis et al., 2019). Rings could quench the disc or the quenching of the disc could form rings.
When all conditions are carefully considered, the preference for green valley galaxies to be classified with rings suggests that any quenching in the green valley is accompanied by subtle changes in disc morphology as well as mere dimming of the disc.
5 Conclusions
We find that the red sequence leads in highest concentration of featured galaxies with bulges. It is followed by the green valley (Figure 11). A lack of new-forming stars in the red sequence leads to a lack of contrast, which may allow bulges to be more visible. This is the diametrically opposite case to bulges in the blue cloud.
Our results match Galaxy Zoo voting (on KiDS images) in confirming that green valley featured galaxies have the most rings in comparison to their blue cloud and red sequence counterparts (Figure 12. This confirms the initial prominence of rings in green valley galaxies found by Kelvin et al. (2018).
Our findings also show a gradual loosening of spiral arms as galaxies enter the green valley. blue cloud galaxies are viewed predominantly with tightly wound arms, while every kind of spiral arm winding is present in the red sequence. A trend is visible in the voting on central bulge prominence; bulges become more dominant from blue cloud to red sequence, with the green valley displaying an intermediate distribution.
Our thorough study of galaxies classified in the green valley indicates that their behaviours typically share characteristics with both the red sequence and blue cloud, placing it in the middle (Figure 6), thereby highlighting the transitional interstitial nature of the green valley.
6 Data Availability
This work is predominantly based on public data from the GAMA survey (available at http://www.gama-survey.org/dr3/) and the Galaxy Zoo catalogue for the GAMA fields, to be released with DR4 (Driver et al. in prep.)
Acknowledgements
The material is supported by NASA Kentucky award No: 80NSSC20M0047 (NASA-REU to L. Haberzettl and D. Smith). D. Smith would like to thank C Nasr for her assistance.
This publication has been made possible by the participation of all the volunteers in the Galaxy Zoo project. Their contributions are individually acknowledged at http://www.GalaxyZoo.org/Volunteers.aspx.
References
- Angthopo et al. (2020) Angthopo J., Ferreras I., Silk J., 2020, MNRAS, 495, 2720
- Arnouts et al. (2007) Arnouts S., et al., 2007, A&A, 476, 137
- Baldry et al. (2004) Baldry I. K., Glazebrook K., Brinkmann J., Ivezić Ž., Lupton R. H., Nichol R. C., Szalay A. S., 2004, ApJ, 600, 681
- Baldry et al. (2006) Baldry I. K., Balogh M. L., Bower R. G., Glazebrook K., Nichol R. C., Bamford S. P., Budavari T., 2006, MNRAS, 373, 469
- Ball et al. (2008) Ball N. M., Loveday J., Brunner R. J., 2008, MNRAS, 383, 907
- Bamford et al. (2009) Bamford S. P., et al., 2009, MNRAS, 393, 1324
- Barone et al. (2022) Barone T. M., et al., 2022, MNRAS, 512, 3828
- Bell et al. (2004) Bell E. F., et al., 2004, ApJ, 600, L11
- Bluck et al. (2020) Bluck A. F. L., et al., 2020, MNRAS, 499, 230
- Brammer et al. (2009) Brammer G. B., et al., 2009, ApJ, 706, L173
- Bremer et al. (2018) Bremer M. N., et al., 2018, MNRAS, 476, 12
- Coenda et al. (2018) Coenda V., Martínez H. J., Muriel H., 2018, MNRAS, 473, 5617
- Corcho-Caballero et al. (2020) Corcho-Caballero P., Ascasibar Y., López-Sánchez Á. R., 2020, MNRAS, 499, 573
- Corcho-Caballero et al. (2021) Corcho-Caballero P., Casado J., Ascasibar Y., García-Benito R., 2021, MNRAS, 507, 5477
- Das et al. (2021) Das A., Pandey B., Sarkar S., 2021, J. Cosmology Astropart. Phys., 2021, 045
- Davis et al. (2019) Davis B. L., Graham A. W., Combes F., 2019, ApJ, 877, 64
- Dobbs & Baba (2014) Dobbs C., Baba J., 2014, PASA, 31, e035. doi:10.1017/pasa.2014.31
- Driver et al. (2006) Driver S. P., et al., 2006, MNRAS, 368, 414
- Driver et al. (2009) Driver S. P., et al., 2009, Astronomy and Geophysics, 50, 050000
- Driver et al. (2011) Driver S. P., et al., 2011, MNRAS, 413, 971
- Driver et al. (2016) Driver S. P., et al., 2016, ApJ, 827, 108
- Faber et al. (2007) Faber S. M., et al., 2007, ApJ, 665, 265
- Fraser-McKelvie et al. (2019) Fraser-McKelvie A., et al., 2019, MNRAS, 488, L6
- Fraser-McKelvie et al. (2020a) Fraser-McKelvie A., et al., 2020a, MNRAS, 495, 4158
- Fraser-McKelvie et al. (2020b) Fraser-McKelvie A., et al., 2020b, MNRAS, 499, 1116
- Ge et al. (2018) Ge X., Gu Q.-S., Chen Y.-Y., Ding N., 2018, arXiv e-prints, p. arXiv:1808.01709
- Graham (2013) Graham A. W., 2013, preprint
- Graham (2019) Graham A. W., 2019, MNRAS, 487, 4995
- Graham et al. (2015) Graham M. L., Sand D. J., Zaritsky D., Pritchet C. J., 2015, preprint
- Graham et al. (2017) Graham A. W., Janz J., Penny S. J., Chilingarian I. V., Ciambur B. C., Forbes D. A., Davies R. L., 2017, ApJ, 840, 68
- Gu et al. (2018) Gu Y., Fang G., Yuan Q., Cai Z., Wang T., 2018, preprint
- Holwerda (2017) Holwerda B., 2017, The Cluster Population of UGC 2885, HST Proposal
- Holwerda et al. (2019) Holwerda B. W., et al., 2019, AJ, 158, 103
- Hopkins et al. (2013) Hopkins A. M., et al., 2013, MNRAS, 430, 2047
- Jian et al. (2020) Jian H.-Y., et al., 2020, ApJ, 894, 125
- Kacprzak et al. (2021) Kacprzak G. G., Nielsen N. M., Nateghi H., Churchill C. W., Pointon S. K., Nanayakkara T., Muzahid S., Charlton J. C., 2021, MNRAS, 500, 2289
- Keel et al. (2013) Keel W. C., Manning A. M., Holwerda B. W., Mezzoprete M., Lintott C. J., Schawinski K., Gay P., Masters K. L., 2013, PASP, 125, 2
- Kelvin et al. (2018) Kelvin L. S., et al., 2018, MNRAS, 477, 4116
- Kuijken et al. (2019) Kuijken K., et al., 2019, A&A, 625, A2
- Lintott et al. (2008) Lintott C. J., et al., 2008, MNRAS, 389, 1179
- Liske et al. (2015) Liske J., et al., 2015, MNRAS, 452, 2087
- Mancini et al. (2019) Mancini C., et al., 2019, MNRAS, 489, 1265
- Martin et al. (2005) Martin D. C., et al., 2005, ApJ, 619, L1
- Martin et al. (2007) Martin D. C., et al., 2007, ApJS, 173, 342
- Masters et al. (2010) Masters K. L., et al., 2010, MNRAS, 404, 792
- Masters et al. (2021) Masters K. L., et al., 2021, MNRAS, 507, 3923
- Mendez et al. (2011) Mendez A. J., Coil A. L., Lotz J., Salim S., Moustakas J., Simard L., 2011, ApJ, 736, 110
- Noeske et al. (2007) Noeske K. G., et al., 2007, ApJ, 660, L43
- Nogueira-Cavalcante et al. (2017) Nogueira-Cavalcante J. P., Gonçalves T. S., Menéndez-Delmestre K., Sheth K., 2017, preprint
- Pan et al. (2015) Pan Y. C., Sullivan M., Maguire K., Gal-Yam A., Hook I. M., Howell D. A., Nugent P. E., Mazzali P. A., 2015, MNRAS, 446, 354
- Peng et al. (2010) Peng C. Y., Ho L. C., Impey C. D., Rix H., 2010, AJ, 139, 2097
- Phillipps et al. (2019) Phillipps S., et al., 2019, MNRAS, 485, 5559
- Roberts et al. (1975) Roberts W. W. J., Roberts M. S., Shu F. H., 1975, ApJ, 196, 381
- Salim (2015) Salim S., 2015
- Salim et al. (2007) Salim S., et al., 2007, ApJS, 173, 267
- Schawinski (2009) Schawinski K., 2009, MNRAS, 397, 717
- Schawinski et al. (2007) Schawinski K., et al., 2007, ApJS, 173, 512
- Schawinski et al. (2014) Schawinski K., et al., 2014, MNRAS, 440, 889
- Shu (2016) Shu F. H., 2016, ARA&A, 54, 667
- Skibba et al. (2009) Skibba R. A., et al., 2009, MNRAS, 399, 966
- Smethurst et al. (2015) Smethurst R. J., et al., 2015, MNRAS, 450, 435
- Smethurst et al. (2017) Smethurst R. J., Lintott C. J., Bamford S. P., Hart R. E., Kruk S. J., Masters K. L., Nichol R. C., Simmons B. D., 2017, MNRAS, 469, 3670
- Strateva et al. (2001) Strateva I., et al., 2001, AJ, 122, 1861
- Taylor et al. (2011) Taylor E. N., et al., 2011, MNRAS, 418, 1587
- Taylor et al. (2015) Taylor E. N., et al., 2015, MNRAS, 446, 2144
- Willett et al. (2013) Willett K. W., et al., 2013, MNRAS, 435, 2835
- Willmer et al. (2006) Willmer C. N. A., et al., 2006, ApJ, 647, 853
- Wright et al. (2017) Wright A. H., et al., 2017, MNRAS, 470, 283
- da Cunha et al. (2008) da Cunha E., Charlot S., Elbaz D., 2008, MNRAS, 388, 1595
- de Jong et al. (2013) de Jong J. T. A., Verdoes Kleijn G. A., Kuijken K. H., Valentijn E. A., 2013, Experimental Astronomy, 35, 25
- de Jong et al. (2015) de Jong J. T. A., et al., 2015, A&A, 582, A62
- de Jong et al. (2017) de Jong J. T. A., et al., 2017, A&A, 604, A134
Appendix A Supplemental Figures
In this section we supplied the histograms that were represented by the rest of the GAMA questions that were not in the main text.
| KS Values For Histograms | |||
|---|---|---|---|
| Figure | green valley to blue cloud | green valley to red sequence | blue cloud to red sequence |
| 5:Bars | 0.16 | 0.10 | 0.24 |
| 6:Spiral | 0.32 | 0.20 | 0.50 |
| 7:Loose | 0.23 | 0.17 | 0.35 |
| 8:Medium | 0.11 | 0.22 | 0.24 |
| 9:Tight | 0.20 | 0.29 | 0.39 |
| 10:3 Arms | 0.27 | 0.35 | 0.58 |
| 11:Dominate Bulge | 0.31 | 0.13 | 0.34 |
| 12:Rings | 0.32 | 0.18 | 0.21 |
| 13:1 Arm | 0.11 | 0.11 | 0.10 |
| 14:2 Arm | 0.24 | 0.33 | 0.44 |
| 15:4 Arm | 0.21 | 0.16 | 0.37 |
| 16:4+ Arms | 0.14 | 0.19 | 0.32 |
| 17:Dust Lane | 0.07 | 0.15 | 0.17 |
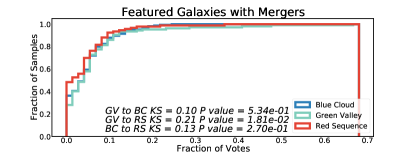
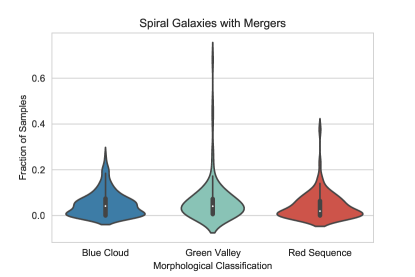
| 18:Mergers | 0.10 | 0.21 | 0.13 |
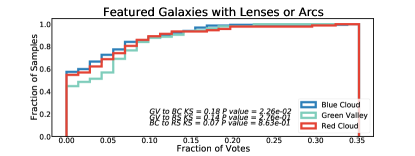
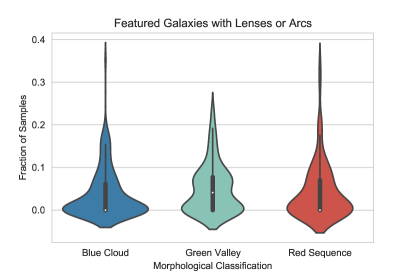
| 19:Lenses or Arcs | 0.14 | 0.14 | 0.07 |
| 20:Tidal Debri | 0.18 | 0.14 | 0.24 |
| 21:Obvious Bulges | 0.36 | 0.26 | 0.18 |
| P Values For Histograms | |||
|---|---|---|---|
| Figure | green valley to blue cloud | green valley to red sequence | blue cloud to red sequence |
| 5:Bars | |||
| 6:Spiral | |||
| 7:Loose | |||
| 8:Medium | |||
| 9:Tight | |||
| 10:3 Arms | |||
| 11:Dominate Bulge | |||
| 12:Rings | |||
| 13:1 Arm | |||
| 14:2 Arm | |||
| 15:4 Arm | |||
| 16:4+ Arms | |||
| 17:Dust Lane | |||
| 18:Mergers | |||
| 19:Lenses or Arcs | |||
| 20:Tidal Debri | |||
| 21:Obvious Bulges | |||