11email: tiina.liimets@asu.cas.cz 22institutetext: Tartu Observatory, University of Tartu, Observatooriumi 1, 61602 Tõravere, Estonia 33institutetext: Nordic Optical Telescope, Rambla José Ana Fernández Pérez 7, ES-38711 Breña Baja, Spain 44institutetext: Department of Physics and Astronomy, Aarhus University, Munkegade 120, DK-8000 Aarhus C, Denmark 55institutetext: Instituto de Física y Astronomía, Universidad de Valparaíso, Gran Bretaña 1111, Playa Ancha, Valparaíso 2360102, Chile 66institutetext: Tuorla Observatory, Department of Physics and Astronomy, University of Turku, FI-20014 Turku, Finland 77institutetext: Viborg Katedralskole, Gl.Skivevej 2, 8800 Viborg, Denmark 88institutetext: Department of Physics, University of Warwick, Coventry CV4 7AL, UK 99institutetext: Institut d’astrophysique de Paris, CNRS, UMR 7095 & Sorbonne Universités, UPMC Paris 6, Boulevard Arago, 75014 Paris, France
V838 Mon: A slow waking up of Sleeping Beauty?††thanks: Tables 2 and 4 are only available in electronic form at the CDS via anonymous ftp to cdsarc.cds.unistra.fr (130.79.128.5) or via https://cdsarc.cds.unistra.fr/cgi-bin/qcat?J/A+A/
Abstract
Context. V838 Monocerotis is a peculiar binary that underwent an immense stellar explosion in 2002, leaving behind an expanding cool supergiant and a hot B3V companion. Five years after the outburst, the B3V companion disappeared from view, and has not returned to its original state.
Aims. We investigate the changes in the light curve and spectral features to explain the behaviour of V838 Mon during the current long-lasting minimum.
Methods. A monitoring campaign has been performed over the past 13 years with the Nordic Optical Telescope to obtain optical photometric and spectroscopic data. The datasets are used to analyse the temporal evolution of the spectral features and the spectral energy distribution, and to characterise the object.
Results. Our photometric data show a steady brightening in all bands over the past 13 years, which is particularly prominent in the blue. This rise is also reflected in the spectra, showing a gradual relative increase in the continuum flux at shorter wavelengths. In addition, a slow brightening of the H emission line starting in 2015 was detected. These changes might imply that the B3V companion is slowly reappearing. During the same time interval, our analysis reveals a considerable change in the observed colours of the object along with a steady decrease in the strength and width of molecular absorption bands in our low-resolution spectra. These changes suggest a rising temperature of the cool supergiant along with a weakening of its wind, most likely combined with a slow recovery of the secondary due to the evaporation of the dust and accretion of the material from the shell in which the hot companion is embedded. From our medium-resolution spectra, we find that the heliocentric radial velocity of the atomic absorption line of Ti i 6556.06 Å has been stable for more than a decade. We propose that Ti i lines are tracing the velocity of the red supergiant in V838 Mon, and do not represent the infalling matter as previously stated.
Key Words.:
Stars: individual: V838 Mon – stars: evolution – stars: peculiar – stars: mass-loss – techniques: photometric – techniques: spectroscopic1 Introduction
V838 Monocerotis (V838 Mon) is a peculiar star discovered in January 2002 (Brown et al. 2002) when it underwent a tremendous stellar explosion, creating a dense envelope of expanding molecular matter (Kamiński et al. 2011; Exter et al. 2016). The eruption lasted three months, consisting of two or three maxima depending on the wavelength, and has been studied by many authors (e.g. Munari et al. 2002; Crause et al. 2003, and references therein). The nature of the explosion is still uncertain. Currently, the most accepted model favours a stellar merger, placing V838 Mon in a rare class of objects, luminous red novae. The aftermath of the eruption was a cool L-type supergiant (SG) with a photospheric temperature between 2000 and 2300 K (Evans et al. 2003; Pavlenko et al. 2006). The hot B3V secondary was discovered spectroscopically in October 2002 (Desidera & Munari 2002; Wagner & Starrfield 2002). Hence, the progenitor of the outburst could have been a triple (or higher multiple) system.
Shortly after the maximum brightness, a spectacular light echo occurred (Henden et al. 2002) that was observable for several years. The light echo of V838 Mon is the most studied light echo in the history of astronomy using ground-based observations (e.g. Crause et al. 2005, Liimets et al. 2007, and references therein) and the Hubble Space Telescope (Bond et al. 2003; Bond 2007).
For a few years following the 2002 outburst V838 Mon displayed a stable light curve until November-December 2006, when it experienced an eclipse-like event (Goranskij 2006; Bond 2006) that lasted about 70 days. At first, it was considered to be an eclipse of the hot B3V companion. However, the emission line spectrum, associated with the secondary, remained strong during this period (Tylenda et al. 2009). Later on, it was shown by Tylenda et al. (2009) that the brief dimming was caused by the interaction of the expelled matter from the 2002 outburst. The system recovered from the fading to its original brightness only to experience another deeper (Goranskij & Barsukova 2008) and still ongoing minimum. The second decline took more than two years to reach the minimum brightness (Goranskij et al. 2020, hereafter GOR20, and our Fig. 1), and during this period the B3V star also disappeared from the spectrum. Large amounts of dust, formed in 2007-2008 from the matter expelled during the 2002 outburst, have reached the hot component (Tylenda et al. 2011). The interferometric observations show that V838 Mon is surrounded by an extended disc-like dusty environment (Chesneau et al. 2014; Ortiz-León et al. 2020; Kamiński et al. 2021; Mobeen et al. 2021). Accretion from this dust has led to the formation of a shell around the B3V star (Mobeen et al. 2021), which is most likely the cause of the continuing occultation. The subsequent evolution of this dust shell is governed by evaporation due to ionising radiation from the hot secondary, and by ongoing accretion from the replenishing material supplied from the ejecta and the wind of the primary.
In this paper we analyse data collected during the ongoing minimum, and shed light on the cause of the photometric and spectroscopic variability during these years. In Sect. 2 we present our data and the reduction procedures. Our results are presented in Sect. 3, which are discussed in Sect. 4, and our conclusions are summarised in Sect. 5.
2 Observations and data reduction
2.1 Optical photometry
The bases of this paper are the data collected since 2009 with the 2.56 m Nordic Optical Telescope111https://www.not.iac.es (NOT) equipped with the cryogenically cooled Alhambra Faint Object Spectrograph and Camera222http://www.not.iac.es/instruments/alfosc (ALFOSC). Bessel filters and interference filter (NOT ID no. 12) with a central wavelength of 797 nm and FWHM 157 nm were exploited. The Bessel filters are equivalent to the Johnson-Cousins system. The measurements in ALFOSC filter were calibrated using the fixed colour terms provided at the ALFOSC website333http://www.not.iac.es/instruments/alfosc/zpmon/, which were obtained using the Landolt standard stars in the standard system, and therefore take into account the transformation to system. Observations were conducted through normal observing programmes444Proposals P39-410; P42-044; P44-042; P46-015; P48-030; P50-038; P52-032; P54-024; P56-025; P58-025, and on 2019 November 29 via the FINCA observing school. Several measurements were obtained in each season (in earlier years once a month, in later years once every six months), with and bands being more frequent, approximately every two weeks. In total V838 Mon was observed on 100 nights with a typical seeing of . Our complementary photometric data, obtained with the telescopes at the Tartu Observatory (TO) and South African Astronomical Observatory (SAAO) between the years 2002 and 2019, are described in Appendix A.
All the data were bias and flat-field corrected using either the Interactive Data Language (IDL) for data taken up to 2007 or (IRAF)555IRAF is distributed by the National Optical Astronomy Observatory, which is operated by the Association of Universities for Research in Astronomy (AURA) under cooperative agreement with the National Science Foundation. for data collected afterwards. For the telescopes at TO dark current correction was also performed. For all the different datasets the magnitude measurements were done using aperture photometry, which provides reliable measurements during all states of V838 Mon (e.g. Crause et al. 2003; Henden 2007, GOR20). We note that our observations are not contaminated by the light echo. The transformation from an instrumental system to a standard Johnson-Cousins photometric system was performed using the colour transformation coefficients obtained by observing Landold standard fields for each telescope666For NOT the coefficients can be found at http://www.not.iac.es/instruments/alfosc/zpmon/ and comparison stars in the field of view (FOV), which were checked beforehand for possible variability, a suspicion triggered by the photometric discrepancies mentioned in Afşar & Bond (2007). For the variability check we cross-matched the standard magnitudes of V838 Mon’s comparison stars presented in the literature (Munari et al. 2002; Goranskij et al. 2004; Munari et al. 2005) and we calculated our own standard magnitudes of the stars presented in Munari et al. (2002). We conclude that all the stars that we could test of the latter are suitable comparison stars. The analyses could not be performed for star , which was out of our FOV, and stars and were too faint in to give reliable measurements from our data. In addition, due to the faintness of the V838 Mon starting from 2008, we added to our list three stars (designated as and ), and checked their stable photometric nature. Table 1 lists the standard magnitudes of all comparison stars measured in this work. These objects, together with the brighter ones from Munari et al. (2002), were used to calibrate instrumental magnitudes of all data in this work. Mostly, more than four comparison stars were used in obtaining the standard magnitude of V838 Mon. The log of all the photometric data of V838 Mon is provided in the online table (see Table 2 for representative lines), and the measurements are presented in Fig. 1. The errors in Table 2 for the TO and SAAO data are a combination of the Poissonian error of instrumental magnitudes and the uncertainties of the colour transformation. For our main dataset from NOT the errors in the are the standard deviation of V838 Mon standard magnitudes when using several comparison stars. The errors of instrumental magnitudes are negligible in these filters. In band the Poissonian noise of the instrumental magnitudes was also taken into account; during the start of our NOT observations, when V838 Mon was as faint as 21 magnitudes, the noise was considerable.
From here on, we refer to the filters in this work as .
| IDM02 | ID | RAJ2000 | DEJ2000 | |||||
|---|---|---|---|---|---|---|---|---|
| f | 106.024244 | -3.844027 | 14.652 0.045 | 14.670 0.012 | 14.121 0.006 | 13.776 0.006 | 13.411 0.009 | |
| g | 106.010135 | -3.881230 | 15.173 0.037 | 14.975 0.011 | 14.613 0.006 | 14.413 0.005 | 14.139 0.008 | |
| h | 106.004135 | -3.874533 | 15.486 0.048 | 15.421 0.013 | 14.800 0.007 | 14.452 0.006 | 14.111 0.009 | |
| j | 106.031128 | -3.851698 | 15.426 0.046 | 15.618 0.012 | 15.050 0.006 | 14.676 0.006 | 14.239 0.009 | |
| k | 106.021087 | -3.810408 | 16.760 0.022 | 16.354 0.015 | 15.524 0.008 | 15.033 0.007 | 14.585 0.011 | |
| m | 106.004593 | -3.842428 | 17.481 0.056 | 17.325 0.015 | 16.551 0.008 | 16.074 0.008 | 15.630 0.013 | |
| n | 106.003805 | -3.862652 | — | 18.650 0.018 | 17.803 0.012 | 17.309 0.013 | 16.741 0.027 | |
| p | 106.025250 | -3.820849 | — | 19.374 0.024 | 18.478 0.015 | 17.909 0.018 | 17.341 0.039 | |
| r | 106.058063 | -3.888445 | 15.735 0.048 | 15.641 0.013 | 15.020 0.007 | 14.630 0.006 | 14.240 0.009 | |
| s | 105.981531 | -3.834276 | 18.060 0.057 | 17.748 0.014 | 17.058 0.008 | 16.631 0.009 | 16.105 0.016 | |
| t | 106.058678 | -3.866647 | 17.964 0.056 | 17.786 0.014 | 17.111 0.008 | 16.654 0.009 | 16.207 0.017 |
| JD | B | V | R | I | Instrument | ||||||
|---|---|---|---|---|---|---|---|---|---|---|---|
| 2452336.30 | 9.798 | 0.025 | 7.843 | 0.018 | HPC | ||||||
| 2452342.32 | 9.066 | 0.087 | 7.211 | 0.021 | 6.263 | 0.018 | 5.347 | 0.032 | HPC | ||
| 2452343.26 | 9.051 | 0.026 | 7.173 | 0.018 | 5.166 | 0.024 | HPC | ||||
| 2452348.39 | 9.465 | 0.023 | 7.316 | 0.029 | 6.293 | 0.015 | 5.291 | 0.038 | HPC | ||
| 2452349.32 | 9.541 | 0.007 | 7.423 | 0.016 | 6.367 | 0.016 | 5.347 | 0.023 | HPC |
2.2 Infared photometry
V838 Mon was observed with NOTCam777The Nordic Optical Telescope’s near-IR Camera and spectrograph http://www.not.iac.es/instruments/notcam/ on 2010 May 11 and 2020 March 2. The high-resolution camera (0.079”/pix) was used to spread the flux over many pixels, and imaging through the broad-band filters , , and was obtained. Due to the brightness of V838 Mon in 2010, the shortest recommended exposure times were used along with some defocusing, most notably for and . The FOV contained three 2MASS stars that were used for calibration. In 2020 the target was even brighter and we added a small cold stop in the beam to reduce the transmission to roughly 20%. In this case the field stars became too faint for calibrations, and we observed a standard star field at a similar airmass just before the target, using the same stop. Reduction of the dithered images was done with the notcam.cl IRAF package, following a standard procedure with flat-fielding, sky-subtraction, shifting, and adding of frames by median combination to exclude bad pixels. Photometry was done using large apertures, and the error in the magnitudes is dominated by the uncertainty in the calibration stars. The analysis performed in this paper requires the -band magnitudes in the Bessell & Brett (1988) photometric system. Therefore, we transformed our 2MASS calibrated magnitudes into using the relations provided by the IRSA webpage888https://irsa.ipac.caltech.edu/data/2MASS/docs/releases/allsky/. Results are presented in Table 3. In all the following analyses the magnitudes are used.
| Date | ||||
|---|---|---|---|---|
| [mag] | [mag] | [mag] | [mag] | |
| 2010-05-11 | 7.00 0.06 | 5.86 0.04 | 5.10 0.11 | 5.14 0.11 |
| 2020-03-02a𝑎aa𝑎aPublished in Woodward et al. (2021) | 6.59 0.05 | 5.55 0.05 | 4.76 0.05 | 4.80 0.05 |
2.3 Spectroscopy with the Nordic Optical Telescope
Low-resolution long-slit spectra were regularly collected, with NOT and ALFOSC, on a total of 28 nights starting from 2009. The observations were typically carried out twice a year, occasionally more frequently. Full optical coverage was achieved with grism 4 and a slit width of mostly providing spectral dispersion of 3 Å pix-1 (R 600 at 6600 Å). Typical exposure times were 400 seconds which provides a S/N between 10 and 100 over the usable spectral range (4500 – 9000 Å). In this way, the saturation of the red part of the cool star spectrum was avoided.
Additional medium-resolution spectra were acquired on 28 nights. These were taken around the H 6562.8 Å line with grism 17 and a slit width of mostly . The spectra cover the range between 6330 and 6870 Å and have a dispersion of 0.26 Å pix-1 (R 9000 at 6600 Å). The exposure times usually varied between 500 and 1200 seconds guaranteeing a S/N ratio 100. In addition, a spectrum from September 2007 with the similar set-up is used in this work for comparison purposes. All spectra obtained with NOT were observed with the slit at the parallactic angle.
The standard data reduction steps were performed with the MIDAS software package in the context of long-slit spectra. The flux calibration is based on the matching of the synthetic photometry of the instrumental flux in the NOT ALFOSC bands to the quasi-simultaneous high-precision photometry (cf. Sects. 2.1, 3.1, and 3.2). For synthetic photometry and brightness zero-point fluxes we used the database provided by the Spanish Virtual Observatory101010svo2.cab.inta-csic.es/theory/newov2/syph.php. For clearer demonstration of the evolution of spectral shape (spectrophotometric gradient) of V838 Mon (cf. Sects. 3.3.1 and 3.3.2) we performed relative flux normalisation using points selected in the stellar continuum at 7560 Å and 6577 Å, which we expect are close to the real continuum, for the grism 4 and 17 settings, respectively. Telluric correction was omitted due to the strong contamination with the stellar molecular absorption bands. The dates of the spectral observations are indicated in Fig. 1. A complete log as well as the data can be acquired from the NOT FITS Header Archive111111http://www.not.iac.es/observing/forms/fitsarchive/. The representative example of reduced spectra is available in the CDS.
3 Results
We note that most of the analyses in this article are based on the data from NOT in order to use a single telescope+instrument+filter set. This is important due to the extreme colours of V838 Mon during the past decade, which result in possible calibration difficulties (see Appendix B).
3.1 Light curve of V838 Mon
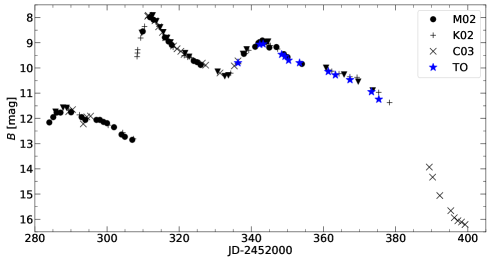
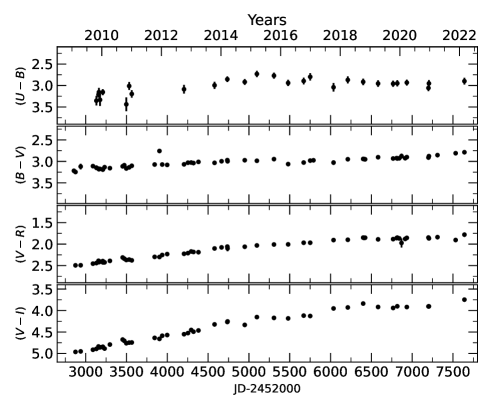
The measurements of the full light curve in the different bands are presented in Table 2 and are shown in Fig. 1. We note the lack of -band measurements prior to 2007. Our first -band magnitudes are from early 2007 when the brightness was approximately equal to the magnitude. The results presented in this section also contain and measurements previously presented by Liimets et al. (2007). In addition, we added ALFOSC data presented by Kolka et al. (2009). We note that these had a calibration error resulting in an offset of less than 0.1 mag that we have corrected in the present work.
In Fig. 1 the light curve starts from early 2002 with the outburst (see also Fig. 13). Then a period of quiescence follows with rather stable magnitudes, until late 2006 when a small eclipse-like event occurs (see Fig. 1 in Munari et al. 2007a and references therein). This event was not covered by our observations and is therefore not visible in Fig. 1. The unexpected brightness drop of the system lasted 70 days (Goranskij 2006; Bond 2006) and was deeper in the bluer bands (), while it remained almost unnoticed in and .
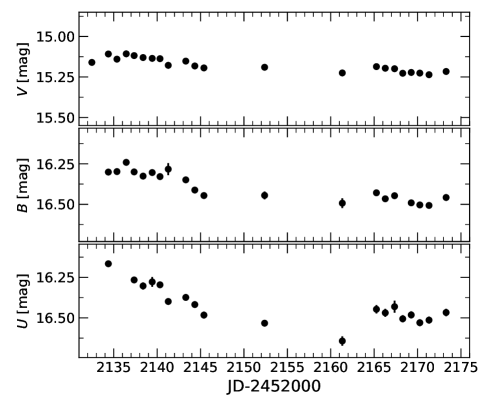
After the short eclipse-like event V838 Mon recovered to the pre-eclipse brightness, only to enter into a deeper minimum. During the first 1.5 months of the second decline our SAAO data were obtained (grey area in Fig. 1). V838 Mon was observed on 22 nights, from 2007 January 31 to March 13. Figure 2 shows the SAAO -band observations where the overall decline in brightness is visible. Noteworthy is also the day-to-day variability of V838 Mon, which is most likely inherent to the system. Just as the overall decline is more pronounced in , so is the daily variability larger in bluer bands, while the brightness is almost unchanged in and .
Between March 2007 and the beginning of 2008 V838 Mon continued to fade, and it took more than two years to reach to the lowest brightness in band (see Fig. 1 and Goranskij & Barsukova 2008). The deep fading affected mostly the blue bands. The drop in brightness was around 5 magnitudes in and 3 magnitudes in , while it was only about 0.5 magnitude in and almost unnoticed in and . Our homogeneous set of NOT observations starts when the deep minimum was reached (around 2009). Since then the light curve has shown a slow but steady brightening in all bands. A gradual brightening was detected before the 2006 eclipse-like event as well (see year 2004 in Fig. 1 and Crause et al. 2005). Variabilities with timescale of about a month are noticeable, especially in the and bands, for which we have the best temporal coverage. This variability is more clearly seen in Fig. 14. It displays very similar patterns in both the and bands. This variability is further analysed in the next paragraph. Finally, the change in the colours (see Fig. 5 and GOR20) implies that V838 Mon has become bluer during the past decade, approaching a constant value since about 2018.
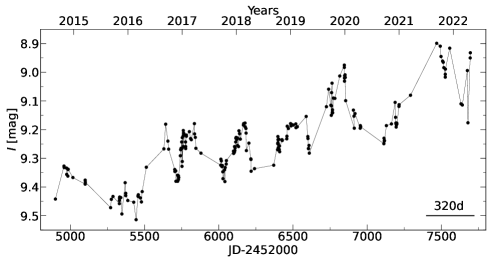
Period analyses. GOR20 found in their -band light curve, starting from the year 2017 (see also their Fig. 12), quasi-periodic variability with a possible period of about 320 days. The light curve variability during the past decade, with a similar timescale, is also evident in other photometric bands (see Fig. 1 and 14). We decided to check the potential periodical nature of these fluctuations more thoroughly. Firstly, we recreated Fig. 12 from GOR20 together with their additional data points for the past three years, which were collected after their publication and are freely available from their online table.121212http://www.vgoranskij.net/v838mon.ne3 The resulting -band light curve is presented in Fig. 4. It is clear that the 320-day semi-periodic variability does not continue after the year 2019. Secondly, to obtain more quantitative results, we combined our NOT data with the comparable GOR20 data in the bands and performed period analyses using a Lomb-Scargle periodogram (Lomb 1976; Scargle 1982), which is suitable for unevenly spaced data points. We note here that we did not find a clear periodic variability. Therefore, we refrain from showing periodograms or folded light curves. However, we do mention indicative variations on timescales of 100-300 days in all filters. In addition, a repeating period of 49 days in all bands was found.
3.2 Spectral energy distribution
The homogeneous set of photometric observations collected with NOT provide us a possibility to study changes in the spectral energy distribution (SED) of V838 Mon during the past decade when the system experienced the deep minimum. In our analyses we take into account the recent ALMA observations (Kamiński et al. 2021), which clearly show that both stars are surrounded with a distinct circumstellar dust cloud and that the SG is not large enough to engulf the B3V star. The extensive SED analyses of the GOR20 concentrate mostly for the years before the current deep fading and cannot therefore be directly compared with our estimates.
In order to obtain the SED, the conversion from magnitudes to fluxes was done using zero magnitude fluxes from Casagrande & VandenBerg (2014). For dereddening of the photometric data we followed earlier works of Tylenda (2005), Munari et al. (2007a), Kamiński et al. (2009), and Tylenda & Kamiński (2012), and adopted the standard extinction law with a value of , the interstellar extinction curve of Cardelli et al. (1989), and a colour excess of V838 Mon of mag from Tylenda (2005).
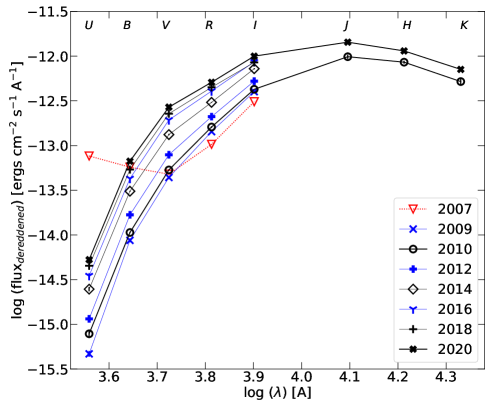
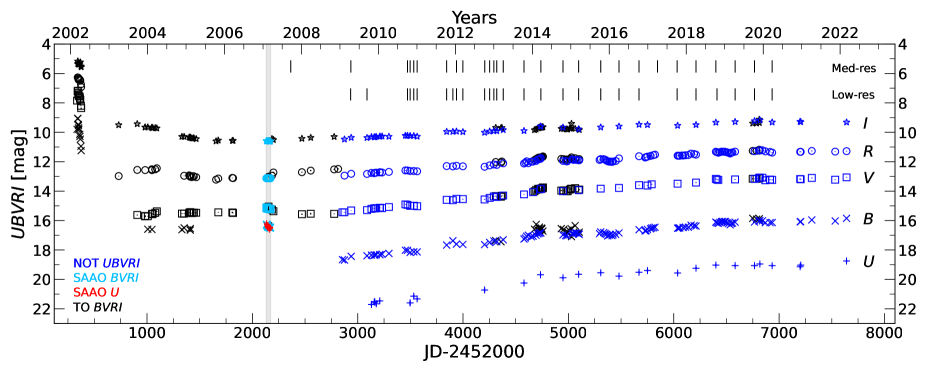
In Fig. 5 we present the SED of V838 Mon from our NOT data at various selected dates between 2009 and 2020. For better visualisation, the photometric values are connected and the curves are shown alternating in black and blue. For comparison we also included in red the SED as it appeared in early 2007 after the short eclipse-like event based on our SAAO data.
It is obvious that in 2007 the blue component was still contributing significantly to the SED, in particular to the and band, whereas the red was dominated by the cool SG. During the current deep minimum, the B3V star seems to be completely occulted. However, we note an overall increase in brightness (also shown in SED analyses of GOR20 using data), with more pronounced changes in the bluer bands compared to the almost static behaviour in the infrared () bands. This rise in fluxes might be caused either by a change in the properties of the cool SG and its environment, by a steady decrease in the absorption along the line of sight towards the B3V companion, or by a combination of the two, which we believe is most plausible (see discussion in Sect. 4).
The many uncertainties and unknowns for such a scenario, especially the unknown values of circumstellar reddening along the lines of sight towards the two objects (which is most likely very different, see Sect. 4), prevent us from performing a detailed analysis of the temporal evolution of the SED, but some simple estimations can be done. For example, considering that the -band flux in 2007 is entirely from the hot companion, we can fit it with a model SED (e.g. ATLAS9, Howarth 2011) utilising the parameters of a B3V star ( K, ) to obtain an estimate of the stellar radius ( R⊙) and luminosity ( L⊙) for a distance of 5.9 kpc (Ortiz-León et al. 2020), in agreement with a main sequence star of about 6 M⊙. On the other hand, if we assume that the fluxes in 2020 are purely from the red supergiant (RSG) with a proposed temperature of K (Kamiński et al. 2021) and , the SG’s current radius, resulting from fitting the near-IR fluxes with a corresponding SED model, would be of the order of R⊙ in agreement with a strongly inflated object. However, the reliability of these values requires the (unlikely) case that both stars experience no circumstellar extinction.
A further simple test can be done regarding the circumstellar extinction towards the B3V companion. Using the same model SED as before, a circumstellar dust composition similar to the interstellar composition, and assuming that the -band flux in 2010 and 2020 corresponds purely to the hot companion, a minimum circumstellar extinction of mag and mag, respectively, is needed to suppress the star’s blue emission. Because the contribution of the cool component cannot be ignored for these measured low flux values, these are only a very crude lower limits to the real extinction, but they might point towards a possible slight recovery of the hot companion.
3.3 Spectral analyses
3.3.1 Low-resolution spectra
The spectral evolution of V838 Mon is depicted in Fig. 6. At each epoch intense molecular absorption bands dominate the spectral appearance. Most pronounced are the bands of vanadium oxide (VO) and titanium oxide (TiO). A multitude of absorption bands from these two molecules is typically seen in the atmospheres of stars with spectral type late-M (Kirkpatrick et al. 1999; Kamiński et al. 2009; Levesque 2017) and has been reported to dominate the spectrum of V838 Mon following its outburst in 2002 (e.g. Kamiński et al. 2009, GOR20).
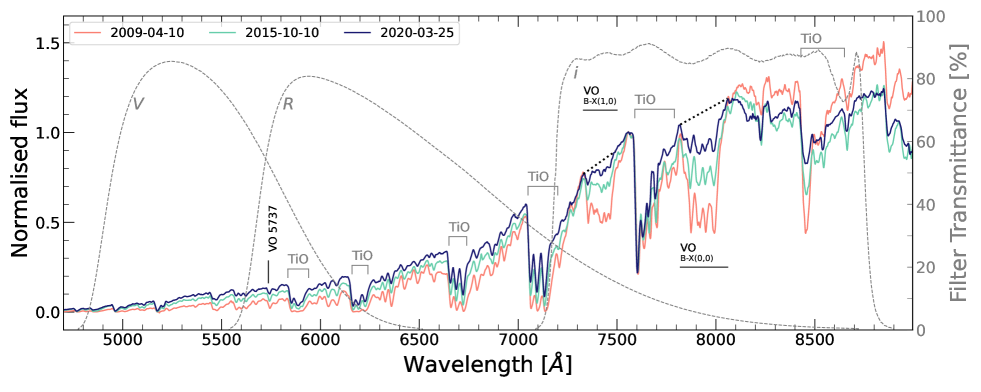
For easier comparison, the calibrated spectra were normalised at 7560 Å, which we consider to be a line-free region (i.e. a continuum region). In this way, the intensities match at a single wavelength, but the change in the shape of the continuum remains conserved. The individual spectra shown in Fig. 6 were selected to best represent the changes over the entire observing period, and the remaining spectra (not shown) fall between the limiting cases shown by the red and blue curves. Inspection of the spectra reveals a remarkable secular trend both in the spectrophotometric gradient and in the depth of molecular absorption features.
The low resolution of our spectra limits the usability of the molecular bands, which otherwise provide a superb tool for characterising their formation region, as demonstrated by Kamiński et al. (2009) based on high-resolution spectra. However, we identified a few VO bands (highlighted in Fig. 6) that appear to be measurable and the least contaminated by neighbouring absorption features in the complex spectrum of V838 Mon.
For all observing epochs, we measured the depth of the VO band head C-X(0,0) R4 ( Å) relative to the adjacent continuum. In addition, we measured the pseudo-equivalent widths of the VO band structures B-X(1,0) and B-X(0,0) within the wavelength limits 7330 to 7500 Å and 7820 to 8060 Å, respectively, as shown in Fig. 6. The measurements of the absorption depth and of the equivalent widths throughout our entire spectral series are listed in Table 4, and their temporal evolution is shown in Fig. 7. A clear, continuous decrease in the strength of the band head and in the equivalent widths by more than a factor of two can be seen during the 11-year observing interval.
| VO | ||||
|---|---|---|---|---|
| JD-2452000 | rel. depth | B-X(1,0) | B-X(0,0) | |
| days | [mag] | |||
| 2932.36 | 4.95 | 0.67 | 42.1 | 90.4 |
| 3088.74 | 4.91 | 0.62 | 40.8 | 84.2 |
| 3497.72 | 4.76 | 0.58 | 33.9 | 88.3 |
| 3532.61 | 4.75 | 0.58 | 38.5 | 82.5 |
| 3564.49 | 4.75 | 0.59 | 36.8 | 81.3 |
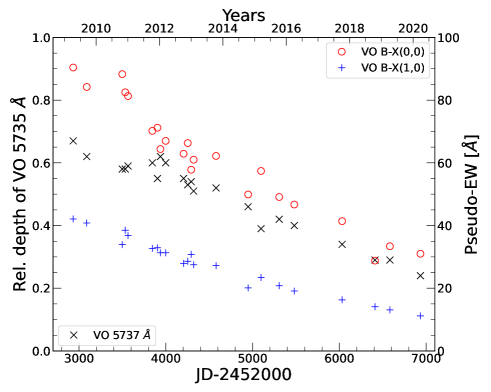
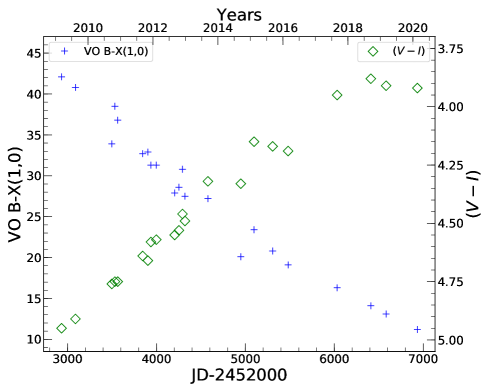
Our chosen normalisation also reveals a decrease in the spectrophotometric gradient, meaning that the continuum was redder in 2009 and has continuously become bluer since then (see Fig. 6), which is best described by the colour measurements in Table 4 and depicted in Fig. 8. The possible origin of this trend is discussed in Sect. 4
3.3.2 Medium-resolution spectra
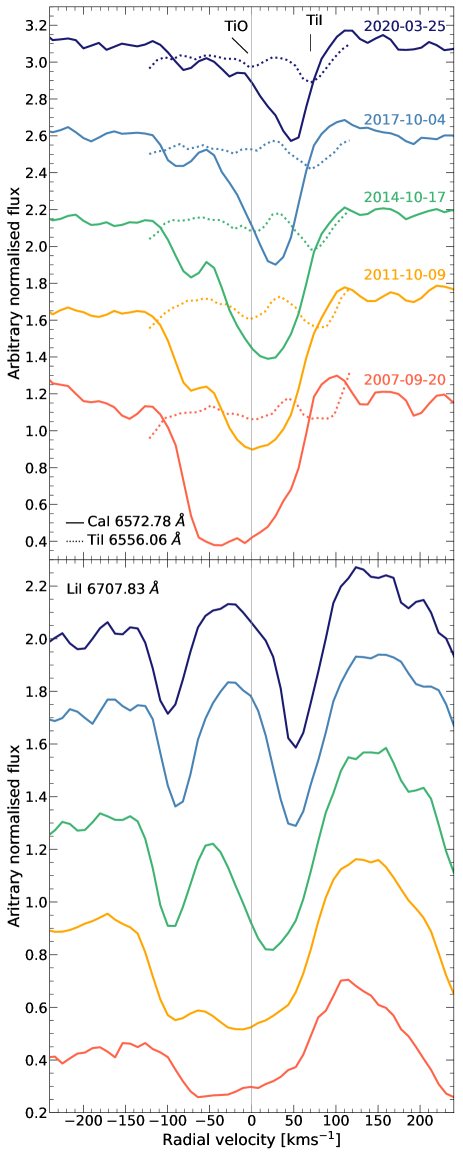
Our medium-resolution spectra spread from 6360 to 6860 Å. This wavelength range does not include the 7560 Å used for normalisation of the low-resolution spectra. Therefore, the normalisation of the calibrated spectra had to be done at a different position, for which we selected a central, presumably line-free region around 6577 Å. For demonstration purpose of the linear temporal behaviour of the spectral features, we show in Fig. 9 three example spectra spreading from 2011 to 2020, together with an archival spectrum from 2007 before the disappearance of the hot binary component in 2008. As for the low-resolution cases, the spectra are dominated by the molecular absorption bands of TiO, and the weakening of these bands with time is clearly seen. In addition to the molecular bands, the high-resolution spectra also display prominent atomic lines. These are the two resonance lines (Ca i 6572.78 Å, Li i 6707.83 Å) and H. They are identifed in Fig. 9 along with the weak Ti i 6556.06 Å line. This latter line serves as an example of relatively stable features in the spectra of V838 Mon.
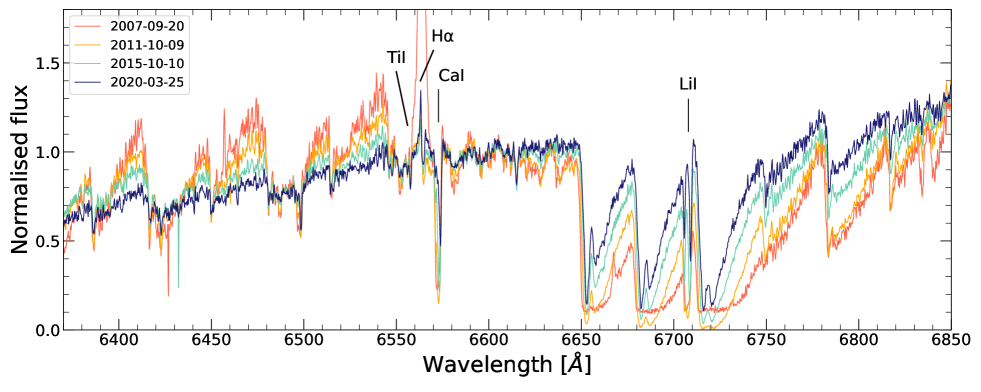
The region around H is depicted in more detail and for more epochs in Fig. 10. The H emission in 2007 was very strong, whereas it was only a minor feature between 2011 and 2014. Only thereafter does it seem that the emission component has started a (very slow) recovery.
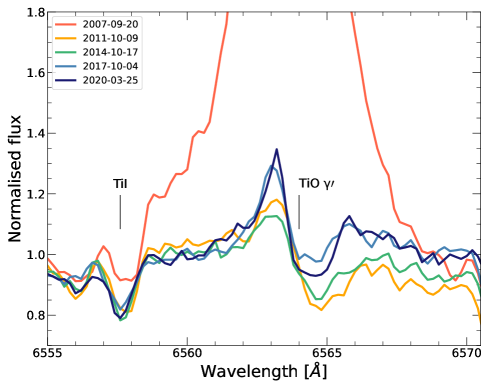
When interpreting the shape and intensity of the H line one should be aware that the profile might be contaminated with the band head of the TiO (0-1) band arising at Å (see identification in Tylenda et al. 2011, their Fig. 1). The superposition of the TiO absorption band with the red wing of the H emission makes the H profile appear like an inverse P Cygni line. For clarity we indicate the position of the TiO 6564 Å band head in Fig. 10.
Turning to the profiles of the resonance lines of Ca i and Li i, their temporal variation is depicted in radial velocity scale in the top and bottom panels of Fig. 11, respectively, for five selected dates. In 2007 both lines displayed a P Cygni-type profile with a shallow red-shifted emission component and a single, broad blue-shifted absorption component. The emission component is more easily seen for Ca i, whereas the Li i profile shape is influenced by the underlying wing of the adjacent molecular absorption bands. This P Cygni-type profile has changed significantly during our monitoring period. A double-absorption has emerged with a broader and more intense red component. This is more clearly seen in Li i, and is only apparent in the 2014 spectrum of Ca i. This red absorption component moves further redwards with time, and a general weakening of the whole absorption is seen in parallel with the weakening of the molecular absorption bands.
Finally, we compare in Fig. 11 the temporal evolution of the Ca i 6572.78 Å line profile with that of the weak Ti i 6556.06 Å line. Both lines are plotted in radial velocity scale for several selected dates. Interestingly, Ti i appears rather stable in both its radial velocity (around 75 km s-1) and absorption strength. Moreover, its radial velocity nearly coincides with the redmost wing of the Ca i absorption.
Possible reasons for the spectral variability seen during the past 13 years are discussed in Sect. 4.
4 Discussion
Our photometric and spectroscopic monitoring of V838 Mon over more than a decade reveal
-
•
a steady brightening in all photometric bands, particularly in the optical (Fig. 5),
-
•
a continuous weakening of the molecular absorption bands (Fig. 7),
-
•
a slight strengthening of the H emission (Fig. 10), and
-
•
significant changes in the profile shapes and radial velocities of the resonance lines Ca i 6572.78 Å and Li i 6707.83 Å along with a presumably stable radial velocity of Ti i 6556.06 Å (Fig. 11).
Possible causes for these trends are discussed in the following in the context of the current knowledge about the stellar and circumstellar properties of V838 Mon.
Since the eruption in 2002, V838 Mon appears as a cool SG star embedded in a large-scale, dense envelope of expanding material (Kamiński et al. 2011; Exter et al. 2016) and with an ongoing stellar mass-loss (Kamiński et al. 2009). Infrared and radio interferometric measurements revealed that this cool SG is surrounded by a disc-like dusty envelope (Chesneau et al. 2014; Ortiz-León et al. 2020; Kamiński et al. 2021; Mobeen et al. 2021). The dust has most likely condensed from the material ejected during the 2002 outburst (Wisniewski et al. 2008) and causes intense mid- to far-infrared excess emission (Woodward et al. 2021). The ejected material, and in particular the extended dusty envelope seems to be responsible for the disappearance of the hot companion from both the spectra and the SED. However, in addition to the large-scale dusty envelope, the B3V companion seems to be embedded within a thick dusty, possibly spherical envelope on small scales (see Fig. 6 in Mobeen et al. 2021). This envelope might represent material being accreted by the hot component.
Looking only at the photometric brightening (Fig. 5) and the clear decline in the colour (Fig. 8) one could speculate that the observed change in SED suggests a reduction in circumstellar extinction due to the expansion, and hence dilution of the ejected material, and dilution of the spherical dust envelope around the B3V component due to ongoing accretion of material that is not further replenished and/or due to a reduced mass-loss from the SG star. The expanding molecular environment has been identified as contributing significantly to the observed molecular absorption (Kamiński et al. 2009; Tylenda et al. 2011). The continuous weakening of the molecular absorption bands could thus also be interpreted as being due to less dense absorbing material surrounding the star, and recent investigations by Davies & Plez (2021) have shown that the mass-loss of cool SGs significantly alters the strength of the molecular absorption bands. The circumstellar dust traced by interferometric observations seems not to be along the line of sight towards the cool SG, but confined to an elongated disc-like structure that is seen under a moderate inclination angle (Chesneau et al. 2014; Kamiński et al. 2021; Mobeen et al. 2021). In contrast, the wind of the SG might contain a dusty component, but in that case it was found to be semi-transparent (with an optical depth of 1.44 at 0.55 m, Woodward et al. 2021) or even optically thin, and hence plays no significant role for a possible circumstellar extinction (Kamiński et al. 2021). An alternative (or additional) explanation for the steady changes seen in both photometry and spectroscopy might therefore be related to a change (increase) in effective temperature, especially because the molecular absorption bands are considered as important temperature indicators in cool SGs (e.g. Levesque 2017).
From the spectroscopic point of view, V838 Mon appeared as an L-type star after its outburst in 2002 (Evans et al. 2003), and the star had been assigned a SG state based on the strength of the molecular absorption bands in the optical (Evans et al. 2003) and near-infrared spectra (Geballe et al. 2007). The low resolution of our spectra hampers a more detailed analysis and proper fitting with atmospheric models. Moreover, as has been shown by Davies et al. (2013), the temperatures obtained from TiO band modelling turn out to be systematically lower than the temperatures derived from fitting the SED in the near-IR, and these authors consider the SED method to be the more reliable one. Nevertheless, our measurements of the depth and equivalent widths of some of the VO band features (see Fig. 7) point towards changes in the spectral appearance that resemble an increase in temperature, at least in a qualitative way.
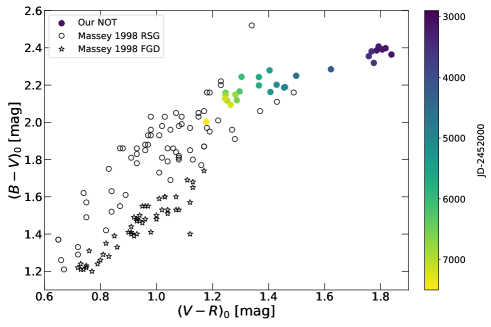
A solid check for low surface gravity objects has been established by Massey (1998) based on the displacement of SGs in the versus colour-colour diagram from dwarf stars with equal temperatures. In Fig. 12 we display this colour-colour diagram for the sample of red SGs (black circles) along with foreground (dwarf) stars (black stars), both taken from Massey (1998, their Table 2). Their data include photometrically classified as well as spectroscopically confirmed RSGs in three galaxies in the Local Group: NGC 6822, M33, and M31 (see also their Fig. 10). Our dereddened measurements of V838 Mon are included in this diagram, and their colour-coding refers to the observing epochs. We note a clear temporal evolution of V838 Mon in this diagram, starting in the upper right corner (far beyond even the coolest normal red supergiants) and gradually approaching the region of the coolest RSG. We also note a clear separation between the positions of V838 Mon and the dwarf stars in this diagram. Taken together, these two facts confirm that the star is a strongly inflated low-gravity object whose effective temperature has seemingly increased during the past 13 years that were covered by our observations.
With the knowledge that V838 Mon resembles the coolest RSG, we utilise the power-law relation between the intrinsic colour and the effective temperature that was derived by Levesque et al. (2005) for classical RSG. This relation can only be applied to our data from 2010 and 2020 due to the lack of near-infrared photometry for all other epochs. As mentioned in Sect. 2.2, our magnitudes were transformed into the needed Bessell & Brett (1988) photometric system. Our values for )0 of mag and mag deliver effective temperature values of K and K in the years 2010 and 2020, respectively, and thus point to a temperature increase of K within ten years. We can further exploit our colour and estimate the temperature using the empirical colour versus temperature calibration of RSG by Worthey & Lee (2011). From our dereddened colours we obtain the to be 317050 K and 339050 K for 2010 and 2020, respectively. For this we adopted the solar metallicity (Z=0.02) (suitable assumption for V838 Mon according to Kipper et al. 2004) and log(g)=0 that were used for V838 Mon by Kamiński et al. (2009) and Tylenda et al. (2011). These temperature estimates are in agreement with our temperature calculations using the power-law relation by Levesque et al. (2005). Therefore, we conclude that the change in )0 colour between 2010 and 2020 indicates a change in temperature of the giant of K. Both of our temperature estimates using the colour compare well with those of Kamiński et al. (2021), who obtained values of 3300 K and 3500 K from modelling of their spectra taken in 2012 and 2020, respectively. It is noteworthy that these temperature values are considerably higher than what was obtained from Planckian fits found in the literature (e.g. Loebman et al. 2015), and emphasises the poor representation of cool SG stars’ SEDs with black-body functions. On the other hand, these temperature values are also lower than is typically seen for classical Galactic RSGs, which seem to have a lower temperature limit of around K (see e.g. Taniguchi et al. 2021). This peculiar behaviour of V838 Mon suggests that its (apparent) photosphere may be more inflated and cooler, similar to very cool (lower mass) giants.
The rise in blue continuum along with the weakening of the molecular absorption bands suggest a trend for increasing effective temperature of the cool SG star; however, we should keep in mind that the B3V companion, which we have so far neglected in our discussion, also contributes to the total continuum. The disappearance of this companion is interpreted as being due to the engulfment of the star by the extended dusty envelope and the formation of a compact dust shell embedding the secondary on much smaller scales (Mobeen et al. 2021). This compact shell was created by accretion of the dust from the reservoir provided by the matter ejected during the 2002 outburst, and is further fed by wind material released from the RSG. Hence, the rise in mainly the - and -band fluxes during the past decade could also be interpreted as a slow but continuous recovery of the hot companion (see discussion in Sect. 3.2). Support for this interpretation is provided by the fact that the flux in the mid-infrared (m) considerably decreased between 2008 and 2019 (Woodward et al. 2021), indicating that a significant amount of warm dust has disappeared either due to expansion and cooling or due to evaporation by the radiation from the hot companion. Furthermore, the steadily decreasing wind of the RSG (as we show below) cannot replenish and maintain the dust reservoir from which the material is accreted to the secondary, resulting in a dilution of the circumstellar matter around the B3V companion. In either case, the medium hiding the hot companion has started to become more transparent. In this context we note that the H emission, which originates from the hot companion, gradually increased during the past decade (Fig. 10). Compared to the spectra presented by Loebman et al. (2015, their Fig. 2), in which the emission component of H during the observing period between 2010 and 2012 reached values of times the continuum, our latest observations reveal an H emission up to 1.3 times the continuum.131313A proper estimate of the emission flux in H requires detailed modelling of the superimposed TiO -band absorption (see Fig. 10), which is beyond the scope of the present investigation. This obvious increase in H emission, also reported by GOR20 based on their data from 2012 to 2018, supports the suggestion of a gradual reappearance of the hot companion.
Based on the resemblance of the V838 Mon spectrum with spectra of RSG we compare the characteristics of its light curve with corresponding features amongst ordinary RSGs (cf. Levesque 2017, Chapter 7 and Kiss et al. 2006). We note the similarity of the behaviour of V838 Mon to the sub-class of irregularly variable RSGs, both in the values of amplitudes (approximately 0.2 mag) and timescales (hundreds of days). The 49-day cycle may not strictly follow this trend. The milder amplitude in the I band is similar to RSGs as well. We note that the possible reasons for the photometric variability also seem be common with RSGs: pulsations, convection at the surface, mass-loss, and dust production variability.
Next we turn to the temporal evolution in the resonance line profiles shown in Fig. 11. In 2007 the Ca i and Li i lines both displayed pure P Cygni profiles, while a splitting into two absorption components becomes evident for our data from 2011 on. According to the analysis by Tylenda et al. (2011), the bluer of these absorption components is formed in the matter ejected in 2002 and presumably represents a fast moving shell. A comparison of the strengths of the shell absorption components in both Ca i and Li i implies that the opacity in the Li line is higher than in the Ca line. Because the opacity drops with the drop in density of the expanding shell material, which for an assumed constant expansion velocity becomes proportional to where is the distance from the star, the weakening of the less opaque shell component in Ca and its slightly smaller blue-shifted velocity compared to Li is evidence for a density and velocity gradient within the expanding shell. In contrast, the redder of the two absorption components is similar in both lines and is formed most probably in the ongoing wind of V838 Mon. The existence of such a wind is evident from the representative P Cygni-type profiles of the persistent K i 7698 Å resonance line presented in Munari et al. (2007b, their Fig. 6,) and Kamiński et al. (2021, their Fig. 7,) over the years 2002–2020. This potassium line is a good example to demonstrate that even at epochs when the Ca i and Li i resonance lines suggest a weakening of the wind (see Fig. 11), the high ground-level population of K i still results in saturated wind profiles over all Doppler velocities (Fig. 7 in Kamiński et al. 2021). A similar saturation was present in Ca i and Li i in 2007.
Finally, we turn our attention to the atomic absorption line Ti i 6556.06 Å, which is present in our medium-resolution spectra (Figs. 10 and 11) and has had a stable position between the years 2009 and 2020 with a radial velocity of km s-1 and a full width at the continuum level of 85 km s-1. When comparing the Ti i profile in our spectra with profiles of Ti i lines (6556.06 Å line among them) in higher resolution spectra (see Fig. 3 panel c in Tylenda et al. 2011) it is clear that the line profiles are asymmetric, displaying a clear blue wing or blend. This asymmetry, when fitting the entire profile in our significantly lower resolution data with a single Gaussian, results in a systematic underestimation of the line’s radial velocity. Figure 3 of Tylenda et al. (2011) clearly shows that the real radial velocity of the Ti i line has a value closer to +90 km s-1. A similar narrow velocity component of km s-1 has been found in the lines of the CO fundamental and first overtone bands (Geballe et al. 2007) and in a number of atomic lines and high-excitation molecular bands (Tylenda et al. 2009), and has been interpreted by these authors as infall. In particular the lines of V i (see Tylenda et al. 2009, their Fig. 3) display only this red-most velocity component, just as our Ti i 6556 Å line. Considering that in the cooler envelope (or wind) these atoms are completely bound in the molecules TiO and VO, the absorption lines of atomic Ti i and V i must arise in a hotter region in (or close to) the stellar photosphere. Support for this interpretation comes from the fact that the excitation potential of the lower level of the Ti i 6556 Å transition is 1.46 eV, whereas most of the other atomic lines observable in the optical spectrum of V838 Mon with wind-modified profiles have lower excitation potentials (Tylenda et al. 2011). In addition, Kamiński et al. (2021) have measured in the 2020 SALT high-resolution spectrum of V838 Mon the absorption components with heliocentric velocity of +85 km s-1 in several lines from highly excited states. These pieces of evidence and the persistence of this absorption line (and red-most absorption component in many other lines, see Fig. 3 in Tylenda et al. 2009) for more than 15 years speaks against an interpretation as matter infall or stellar contraction: a contraction with a constant velocity of km s-1 over a time span of 15 years would mean that the material has travelled a distance of more than . Chesneau et al. (2014) reported on a possible contraction of the SG’s radius by from about to about within a ten-year period. Such a contraction causes a red-shifted velocity of just km s-1. It is also worth mentioning that starting from the year 2002 all the P Cygni profiles measured in the spectrum of V838 Mon have had emission peaks at heliocentric velocities km s-1 (Munari et al. 2007b; Kamiński et al. 2009, 2021), and under the assumption of spherical winds, the position of the emission peak indicates the radial velocity of the star. We note here that in the light of the recent ALMA observations (Kamiński et al. 2021), which resolve the position of both components in V838 Mon, it is clear that the maximum flux emission is located at the position of the RSG (see their Fig. 3). Therefore, the above-mentioned radial velocity represents the velocity of the RSG, rather than the true barycentric (i.e. systemic) velocity of the system.
5 Conclusions
We present new extensive and homogeneous observational datasets of the intriguing object V838 Mon. Before calibrating the photometric data we performed a solid stability check of the comparison stars. Our photometric and spectroscopic monitoring of this peculiar target over more than a decade reveals important insights into its temporal evolution. We note a brightening in photometry, in particular in the blue bands, and a simultaneous weakening of the molecular absorption bands. The resonance lines of Ca i and Li i consist of two absorption components, a blue-shifted one tracing the expanding shell and a red-shifted one originating from the ongoing but steadily weakening wind from the SG. The continuous strengthening of the H emission traces the gentle reappearance of the hot companion. Moreover, the detection of the persistent Ti i line at about km s-1 refers to the radial velocity of the RSG component rather than matter infall as previously proposed.
We note that all the observed changes discussed in Sect. 4 may be the result of multiple, combined effects. An illustrative example is the observed gradual increase in continuum flux in the blue, which most likely is caused by the interplay of (i) an increase in effective temperature of the SG star, (ii) a drop in the extinction by the circumstellar dust around both the SG and the hot companion, and (iii) a weakening of the SG star’s wind. How much each of these effects contributes requires comprehensive modelling of combined, high-quality photometric and high-resolution spectroscopic data. While such a thorough analysis is beyond the reach of our spectroscopic data, our results can serve at least as a homogeneous set of observational constraints for future modelling of the challenging binary system V838 Mon.
Acknowledgements.
We thank the anonymous referees for the constructive suggestions that helped to improve the manuscript. Based on observations made with the Nordic Optical Telescope, owned in collaboration by the University of Turku and Aarhus University, and operated jointly by Aarhus University, the University of Turku and the University of Oslo, representing Denmark, Finland and Norway, the University of Iceland and Stockholm University at the Observatorio del Roque de los Muchachos, La Palma, Spain, of the Instituto de Astrofisica de Canarias. The data presented here were obtained with ALFOSC, which is provided by the Instituto de Astrofisica de Andalucia (IAA) under a joint agreement with the University of Copenhagen and NOT. Observations on 2019 November 29 were done as part of the NOT science school for upper secondary school students organised in Tuorla Observatory. In addition, this paper uses observations made at the South African Astronomical Observatory (SAAO). Analyses done in this paper use a GAIA shoftware. GAIA is a derivative of the Skycat catalogue and image display tool, developed as part of the VLT project at ESO. Skycat and GAIA are free software under the terms of the GNU copyright. The 3D facilities in GAIA use the VTK library. For further details, see http://starlink.eao.hawaii.edu/starlink T.L., M.K., and B.D. acknowledge financial support from the Czech Science Foundation (GA ČR, grant numbers 20-00150S and 19-18647S). The Astronomical Institute of the Czech Academy of Sciences is supported by the project RVO:67985815. This project has received funding from the European Union’s Framework Programme for Research and Innovation Horizon 2020 (2014-2020) under the Marie Skłodowska-Curie Grant Agreement No. 823734. All the data from the NOT can be acquired through the NOT FITS Header Archive141414http://www.not.iac.es/observing/forms/fitsarchive/. The rest of the data can be obtained from TL on a reasonable request.References
- Afşar & Bond (2007) Afşar, M. & Bond, H. E. 2007, AJ, 133, 387
- Bessell & Brett (1988) Bessell, M. S. & Brett, J. M. 1988, PASP, 100, 1134
- Bond (2006) Bond, H. E. 2006, The Astronomer’s Telegram, 966, 1
- Bond (2007) Bond, H. E. 2007, in Astronomical Society of the Pacific Conference Series, Vol. 363, The Nature of V838 Mon and its Light Echo ASP Conference Series, Vol. 363, Proceedings of the conference held 16-19 May, 2006 in Los Concajos, La Palma, Spain. Edited by Romano, L. M. Corradi and Ulisse Munari. San Francisco: Astronomical Society of the Pacific, 2007., p.130, ed. R. L. M. Corradi & U. Munari, 130
- Bond et al. (2003) Bond, H. E., Henden, A., Levay, Z. G., et al. 2003, Nature, 422, 405
- Brown et al. (2002) Brown, N. J., Waagen, E. O., Scovil, C., et al. 2002, IAU Circ., 7785, 1
- Cardelli et al. (1989) Cardelli, J. A., Clayton, G. C., & Mathis, J. S. 1989, ApJ, 345, 245
- Casagrande & VandenBerg (2014) Casagrande, L. & VandenBerg, D. A. 2014, MNRAS, 444, 392
- Chesneau et al. (2014) Chesneau, O., Millour, F., De Marco, O., et al. 2014, A&A, 569, L3
- Crause et al. (2003) Crause, L. A., Lawson, W. A., Kilkenny, D., et al. 2003, MNRAS, 341, 785
- Crause et al. (2005) Crause, L. A., Lawson, W. A., Menzies, J. W., & Marang, F. 2005, MNRAS, 358, 1352
- Davies et al. (2013) Davies, B., Kudritzki, R.-P., Plez, B., et al. 2013, ApJ, 767, 3
- Davies & Plez (2021) Davies, B. & Plez, B. 2021, MNRAS, 508, 5757
- Desidera & Munari (2002) Desidera, S. & Munari, U. 2002, IAU Circ., 7982, 1
- Evans et al. (2003) Evans, A., Geballe, T. R., Rushton, M. T., et al. 2003, MNRAS, 343, 1054
- Exter et al. (2016) Exter, K. M., Cox, N. L. J., Swinyard, B. M., et al. 2016, A&A, 596, A96
- Geballe et al. (2007) Geballe, T. R., Rushton, M. T., Eyres, S. P. S., et al. 2007, A&A, 467, 269
- Goranskij (2006) Goranskij, V. 2006, The Astronomer’s Telegram, 964, 1
- Goranskij & Barsukova (2008) Goranskij, V. P. & Barsukova, E. A. 2008, The Astronomer’s Telegram, 1821, 1
- Goranskij et al. (2020) Goranskij, V. P., Barsukova, E. A., Burenkov, A. N., et al. 2020, Astrophysical Bulletin, 75, 325
- Goranskij et al. (2004) Goranskij, V. P., Shugarov, S. Y., Barsukova, E. A., & Kroll, P. 2004, Informational Bulletin on Variable Stars, 5511, 1
- Henden et al. (2002) Henden, A., Munari, U., & Schwartz, M. 2002, IAU Circ., 7859, 1
- Henden (2007) Henden, A. A. 2007, in Astronomical Society of the Pacific Conference Series, Vol. 363, The Nature of V838 Mon and its Light Echo, ed. R. L. M. Corradi & U. Munari, 3
- Howarth (2011) Howarth, I. D. 2011, MNRAS, 413, 1515
- Kamiński et al. (2009) Kamiński, T., Schmidt, M., Tylenda, R., Konacki, M., & Gromadzki, M. 2009, ApJS, 182, 33
- Kamiński et al. (2011) Kamiński, T., Tylenda, R., & Deguchi, S. 2011, A&A, 529, A48
- Kamiński et al. (2021) Kamiński, T., Tylenda, R., Kiljan, A., et al. 2021, A&A, 655, A32
- Kimeswenger et al. (2002) Kimeswenger, S., Lederle, C., Schmeja, S., & Armsdorfer, B. 2002, MNRAS, 336, L43
- Kipper et al. (2004) Kipper, T., Klochkova, V. G., Annuk, K., et al. 2004, A&A, 416, 1107
- Kirkpatrick et al. (1999) Kirkpatrick, J. D., Reid, I. N., Liebert, J., et al. 1999, ApJ, 519, 802
- Kiss et al. (2006) Kiss, L. L., Szabó, G. M., & Bedding, T. R. 2006, MNRAS, 372, 1721
- Kolka et al. (2009) Kolka, I., Liimets, T., Kankare, E., Pursimo, T., & Datson, J. 2009, The Astronomer’s Telegram, 2211, 1
- Levesque (2017) Levesque, E. M. 2017, Astrophysics of Red Supergiants (IOP Publishing)
- Levesque et al. (2005) Levesque, E. M., Massey, P., Olsen, K. A. G., et al. 2005, ApJ, 628, 973
- Liimets et al. (2007) Liimets, T., Kolka, I., & Kipper, T. 2007, in Astronomical Society of the Pacific Conference Series, Vol. 363, The Nature of V838 Mon and its Light Echo ASP Conference Series, Vol. 363, Proceedings of the conference held 16-19 May, 2006 in Los Concajos, La Palma, Spain. Edited by Romano, L. M. Corradi and Ulisse Munari. San Francisco: Astronomical Society of the Pacific, 2007., p.174, ed. R. L. M. Corradi & U. Munari, 174
- Loebman et al. (2015) Loebman, S. R., Wisniewski, J. P., Schmidt, S. J., et al. 2015, AJ, 149, 17
- Lomb (1976) Lomb, N. R. 1976, Ap&SS, 39, 447
- Massey (1998) Massey, P. 1998, ApJ, 501, 153
- Mobeen et al. (2021) Mobeen, M. Z., Kamiński, T., Matter, A., Wittkowski, M., & Paladini, C. 2021, A&A, 655, A100
- Munari et al. (2007a) Munari, U., Corradi, R. L. M., Henden, A., et al. 2007a, A&A, 474, 585
- Munari et al. (2002) Munari, U., Henden, A., Kiyota, S., et al. 2002, A&A, 389, L51
- Munari et al. (2005) Munari, U., Henden, A., Vallenari, A., et al. 2005, A&A, 434, 1107
- Munari et al. (2007b) Munari, U., Navasardyan, H., & Villanova, S. 2007b, in Astronomical Society of the Pacific Conference Series, Vol. 363, The Nature of V838 Mon and its Light Echo, ed. R. L. M. Corradi & U. Munari, 13
- Ortiz-León et al. (2020) Ortiz-León, G. N., Menten, K. M., Kamiński, T., et al. 2020, A&A, 638, A17
- Pavlenko et al. (2006) Pavlenko, Y. V., van Loon, J. T., Evans, A., et al. 2006, A&A, 460, 245
- Scargle (1982) Scargle, J. D. 1982, ApJ, 263, 835
- Taniguchi et al. (2021) Taniguchi, D., Matsunaga, N., Jian, M., et al. 2021, MNRAS, 502, 4210
- Tylenda (2005) Tylenda, R. 2005, A&A, 436, 1009
- Tylenda & Kamiński (2012) Tylenda, R. & Kamiński, T. 2012, A&A, 548, A23
- Tylenda et al. (2009) Tylenda, R., Kamiński, T., & Schmidt, M. 2009, A&A, 503, 899
- Tylenda et al. (2011) Tylenda, R., Kamiński, T., Schmidt, M., Kurtev, R., & Tomov, T. 2011, A&A, 532, A138
- Wagner & Starrfield (2002) Wagner, R. M. & Starrfield, S. G. 2002, IAU Circ., 7992, 2
- Wisniewski et al. (2008) Wisniewski, J. P., Clampin, M., Bjorkman, K. S., & Barry, R. K. 2008, ApJ, 683, L171
- Woodward et al. (2021) Woodward, C. E., Evans, A., Banerjee, D. P. K., et al. 2021, AJ, 162, 183
- Worthey & Lee (2011) Worthey, G. & Lee, H.-c. 2011, ApJS, 193, 1
Appendix A Complementary optical photometry
During the years 2002–2008 photometric observations of V838 Mon were carried out at Tartu Observatory (TO) with the 0.6 m ZEISS telescope and a thermoelectrically cooled CCD camera HPC. Filters in the Johnson-Cousins system were used. Starting from 2013, an Andor Ikon-L (IKON) with an Optec Inc. Bessell filter set has been used. The FOV of both cameras is . During these years, data from 48 observing nights were collected.
In addition, starting from 2014, the 31.4 cm telescope Planewave CDK 12.5 (also known as RAITS) in TO was used to obtain photometric data of V838 Mon on 24 nights. The telescope is equipped with a CCD camera consisting of a Apogee Alta U42 camera and a set of second-generation Astrodon Bessell filters. The FOV of that telescope is .
From 2007 January 31 to March 13 higher cadence observations were secured at the South African Astronomical Observatory (SAAO). A 1.0 m telescope was exploited, equipped with a STE4 CCD camera (FOV ) and filters. In total 22 photometric measurements were acquired.
Appendix B Aligning datasets from different telescopes
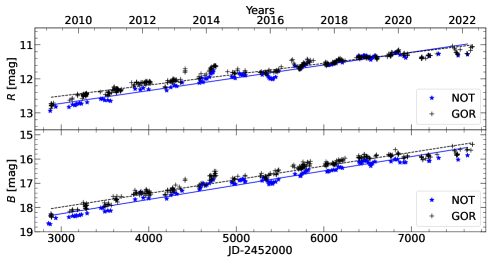
As pointed out by Henden (2007), in early 2002 it was easy to align light curves obtained with different instruments, while later, due to the extreme colours of V838 Mon, no comparison stars with matching colours have been available, and hence matching has not been trivial. The offsets between published photometric datasets are also discussed in GOR20. As an example, we plot in Fig. 13 our TO data from 2002 (in blue) together with literature values (in black). A reasonably good match can be seen between the datasets. In Fig. 14 we plot our magnitudes taken with NOT starting from 2009 together with the data of GOR20 collected during the same period.151515http://www.vgoranskij.net/v838mon.ne3 A straight line is fitted through each dataset. As can be seen, the fitted lines in the filter can be considered parallel, implying a constant offset of about 0.4 mag between our NOT and GOR20 standard magnitudes. In the band the fitted lines are not parallel, probably due to the above-mentioned calibration difficulties. The issue of offsets changing over time was also pointed out by GOR20.
Similar offsets were found between our NOT and some of the TO data starting from 2008. This is especially obvious for the data from RAITS (black points in Fig. 1) taken in 2014 and 2015, which in addition to the calibration difficulties might also result from the rather small telescope size and from the faintness of the V838 Mon during the past ten years in bluer bands. On the other hand, the possible reason for the small systematic offset may be related to the exact position and shape of filter transmittance curve relative to the sharp-edged spectral features of V838 Mon.
However, because our measurements fit well with other published data during the 2002 outburst, we consider our calculated standard magnitudes to be reliable. Moreover, we restrict our analysis of the light curve from 2009 onwards to the homogeneous data collected with NOT because these data were obtained with a uniform telescope and instrument setting.