The CGM2 Survey: Quenching and the Transformation of the Circumgalactic Medium
Abstract
This study addresses how the incidence rate of strong absorbers in a galaxy’s circumgalactic medium (CGM) depends on galaxy mass and, independently, on the amount of star formation in the galaxy. We use HST/COS absorption spectroscopy of quasars to measure absorption within 400 projected kpc and 300 km s-1 of 52 galaxies. The galaxies have redshifts , stellar masses , and spectroscopic classifications as star-forming or passive. We compare the incidence rates of high column density absorption ( cm-2) near star-forming and passive galaxies in two narrow stellar mass ranges and, separately, in a matched halo mass range. In all three mass ranges, the covering fraction within 150 kpc is higher around star-forming galaxies than around passive galaxies with greater than -equivalent statistical significance. On average, the CGM of star-forming galaxies contains more than the CGM of passive galaxies with the same mass. This difference is evidence for a CGM transformation that happens together with galaxy quenching and is not driven primarily by halo mass.
linetools (Prochaska et al., 2017),
matplotlib (Hunter, 2007),
numpy (Harris et al., 2020),
pandas (Wes McKinney, 2010)
1 Introduction
The circumgalactic medium (CGM) is the extended halo of gas surrounding a galaxy and a key site in the baryon cycle that governs a galaxy’s supply of fuel for star formation. Its physical state mediates the accretion of intergalactic gas and can affect the outcome of feedback processes (i.e., whether winds stall or escape). The physical state of the CGM is set by the interaction of many factors: radiative cooling, the gravitational potential of the host dark matter halo, energy and momentum injection by feedback, and a variety of other possibly important effects such as cosmic rays and magnetic fields. Different relative contributions of these factors can yield qualitatively different CGM structures. A classic example is that when considering gravity and radiative cooling, maintaining a hot, quasi-static CGM inside a stable virial shock requires a sufficiently high halo mass (e.g. Birnboim & Dekel, 2003; Dekel & Birnboim, 2006). In the absence of other factors, intergalactic gas can accrete onto the host galaxies of lower mass haloes without shocking (e.g. White & Rees, 1978; Kereš et al., 2005). How the balance of these factors affects and is affected by host galaxy properties is a key question for understanding galaxy evolution.
One part of this question is the role of the CGM in how central galaxies in sub-group scale halos ( ) quench. We are still learning how CGM observables differ around star-forming and passive galaxies. When comparing the CGM between these galaxy classes, it is necessary to control for a number of potentially confounding variables. CGM properties and observables depend on distance (observationally, on the impact parameter, ) from a galaxy, galaxy mass (stellar or halo) and color, redshift, environment, and, for some tracers, angular location relative to a galaxy (e.g., Bergeron 1986; Bahcall et al. 1991; Chen et al. 2001; Stocke et al. 2006; Bordoloi et al. 2011; Werk et al. 2013; Johnson et al. 2015; Tejos et al. 2016; Burchett et al. 2016). At the very least, it is necessary to control for impact parameter and galaxy mass and to restrict comparisons to reasonably narrow redshift ranges. Comparisons between star-forming and passive galaxies have been done with the necessary controls for cool ( K) metal enriched gas traced by (Bordoloi et al., 2011; Lan, 2020; Anand et al., 2021) and for hot ( K) gas traced by X-ray emission (Comparat et al., 2022; Chadayammuri et al., 2022). Star-forming galaxies have higher equivalent widths of cool gas tracers than passive galaxies, but results are still unclear for X-ray emission.
There is a paucity of constraints on gas in the intermediate temperature range, . When metal-enriched, gas in this temperature range can be traced by the ion . This gas may be near thermal equilibrium (Faerman et al., 2017; Voit, 2019) or it may be part of cooling inflows or outflows (Heckman et al., 2002; Bordoloi et al., 2017; McQuinn & Werk, 2018; Qu & Bregman, 2018). Some may instead be tracing cool gas ( K) that is diffuse enough for the extragalactic background to photoionize oxygen to (, Tripp et al., 2008; Stern et al., 2018). measurements strongly suggest the presence of a warm-hot phase (Burchett et al., 2018).
Low redshift star-forming galaxies in general (i.e., without controlling for galaxy mass) have higher detection rates and typical column densities than passive galaxies (Tumlinson et al., 2011; Johnson et al., 2015; Zahedy et al., 2019). The only mass-controlled comparison of absorber statistics between star-forming and passive galaxies thus far is found in the supplementary materials of Tumlinson et al. (2011), but its results are inconclusive. Because the star-forming galaxies in all other comparisons have lower average masses than the passive galaxies, the interpretation of the difference in absorber statistics is ambiguous: is the dichotomy driven by differences in halo mass or is it the result of some distinct process associated with quenching?
Which interpretation is correct bears on the connection between feedback, the CGM, and galaxy quenching. If there is no difference in around star-forming and passive galaxies at fixed mass, then the dichotomy is caused by a change in CGM structure as a function of halo mass and the different halo mass distributions of star-forming and passive galaxies. This scenario has been suggested in works such as Oppenheimer et al. (2016), Fielding et al. (2017), and Sanchez et al. (2019). If instead there is a difference at fixed mass, then the dichotomy is caused by some process other than the quasi-hydrostatic evolution of a growing halo. In one example of such a scenario, integrated active galactic nucleus (AGN) feedback heats and partially drives out the CGM (Mathews & Prochaska, 2017; Suresh et al., 2017; Davies et al., 2020a; Oppenheimer et al., 2020; Terrazas et al., 2020; Zinger et al., 2020). Finding that the dichotomy persists at fixed mass would not automatically mean that quenching disrupts the CGM or some change in the CGM causes quenching: both changes could be caused by a third process, such as interaction with large scale structure. However, it would mean a more direct connection between the state of a galaxy and its CGM than the scenario where star-forming and passive galaxies of the same mass can have the same CGM.
In this work, we compare incidence rates around star-forming and passive galaxies with stellar masses () between and controlling for impact parameter and stellar mass and, in a separate comparison, approximately controlling for halo mass (). For the halo mass comparison, we account for the different clustering properties of star-forming and passive galaxies by using star-formation-dependent stellar-mass-to-halo-mass relations when estimating halo masses. We build our sample by combining galaxy- absorber pairs from a compilation of new and literature measurements published in Tchernyshyov et al. (2022) (Paper I) with a small number of additional observations from the CUBS survey (Chen et al., 2020). The dataset is described in §2. The mass-controlled comparison between star-forming and passive galaxies is described in §3. We discuss the implications of our findings in §4 and summarize our results in §5. We assume a flat-universe CDM cosmology with km s-1 Mpc-1 and (Planck Collaboration et al., 2016). Stellar masses are derived assuming a Chabrier (2003) initial mass function.
2 Data
We analyze a mass and impact parameter matched set of galaxy- absorber pairs. Most of the galaxy masses, impact parameters, and associated column densities are taken from the galaxy-absorber data compiled in Paper I. This dataset combines measurements from the CGM2 survey (Wilde et al., 2021) and the literature (Werk et al., 2013; Johnson et al., 2015; Keeney et al., 2018; Zahedy et al., 2019). We also include three galaxy-absorber pairs from the CUBS survey (Chen et al., 2020; Cooper et al., 2021; Boettcher et al., 2021; Cooper et al., 2021). In cases where information on galaxy environment is available, we exclude galaxies from our analysis if they are within 1 Mpc and 600 km s-1 of a more massive galaxy.
We do not use the galaxy classifications from Paper I, which were based on fitting galaxy templates to photometric measurements. Instead, we use spectroscopic classifications. For galaxies from Johnson et al. (2015) and the CUBS survey, we adopt the classifications given in those works. For the remainder of the sample, we make our own spectroscopic classifications.
We use three classification criteria: H emission equivalent width, H emission equivalent width, and the 4000Å decrement 111We use the 100Å-wide interval definition of , with intervals 3850–3950Å and 4000–4100Å (Balogh et al., 1999).. We use multiple criteria because the galaxy spectra were taken with different instruments and cover different galaxy restframe wavelength ranges. We measure H and H equivalent widths by fitting the galaxy spectra with superpositions of stellar templates and emission lines. Fitting is done with pPXF (Cappellari, 2017) using the MILES stellar library (Falcón-Barroso et al., 2011). We measure by integrating the galaxy spectra over the appropriate interval and taking the ratio of the results.
Not all quantities are measurable from all spectra. Of the ones that are measured from a spectrum, we adopt the classification according to the most preferred quantity, where the order of preference is H, then H, then . A galaxy is classified as star-forming if it has an H equivalent width greater than 6Å, a H equivalent width greater than 2Å, or less than 1.6 (Kauffmann et al., 2003; Sánchez et al., 2014). The quantities usually agree on a galaxy’s classification. Taken pairwise, H and H, H and , and H and agree in 42/42, 34/36, and 41/49 instances, respectively.
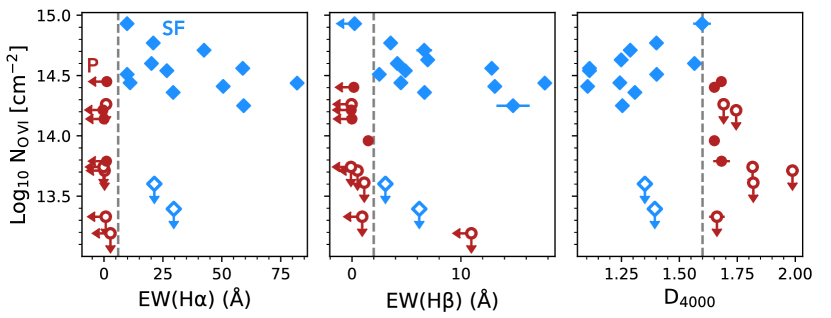
The star formation indicator cuts split the galaxies at low impact parameters into mostly low and mostly high subsamples. Figure 1 shows as a function of the three indicators around galaxies with kpc. The two star-forming non-detections have larger impact parameters than all but one of the other star-forming galaxies shown. Apart form these two non-detections, galaxies on the star-forming side of the classification thresholds have higher than most passive galaxies.
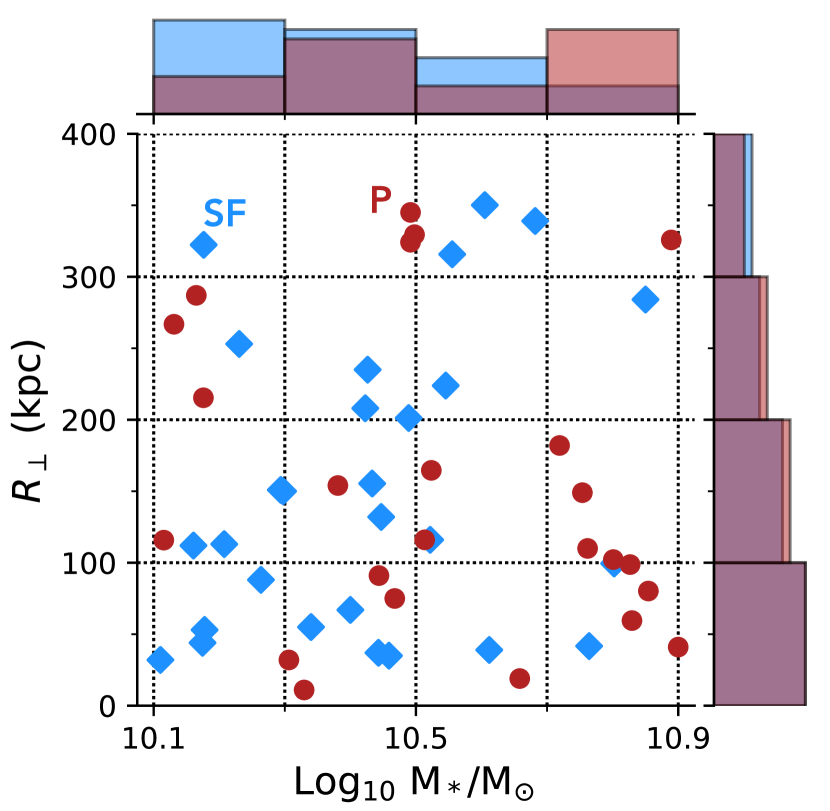
We focus on galaxies with stellar masses between and . Paper I included galaxies with masses ranging from to . In that sample, the overwhelming majority of photometrically-classified passive galaxies have . For this work, we initially spectroscopically classified all of those galaxies with . The sample contains no passive galaxies with mass less than and no star-forming galaxies with mass greater than . To get a closer match in , we restrict the sample to bracket this mass range. The stellar masses and impact parameters of galaxies in this range are shown in Figure 2.
To enable a test of the hypothesis that differences between star-forming and passive galaxies are driven by halo mass, we estimate halo masses for the galaxies in the sample. We match the observed galaxies to central galaxies from the UNIVERSEMACHINE mock catalogs (Behroozi et al., 2019) conditioning on star-formation class, stellar mass, and redshift. We classify mock galaxies to be star-forming or passive using a yr-1 sSFR cut, use a tolerance of dex for matching on stellar mass, and take the nearest redshift available (in all cases, ). This procedure yields between 800 and 2800 matching mock galaxies per observed galaxy, each with a halo mass. We summarize an observed galaxy’s possible halo mass distribution by its 16th, 50th, and 84th percentiles. The median halo masses of the star-forming and passive samples overlap for . With this halo mass estimation procedure, star-forming and passive galaxies in this halo mass range have and , respectively.
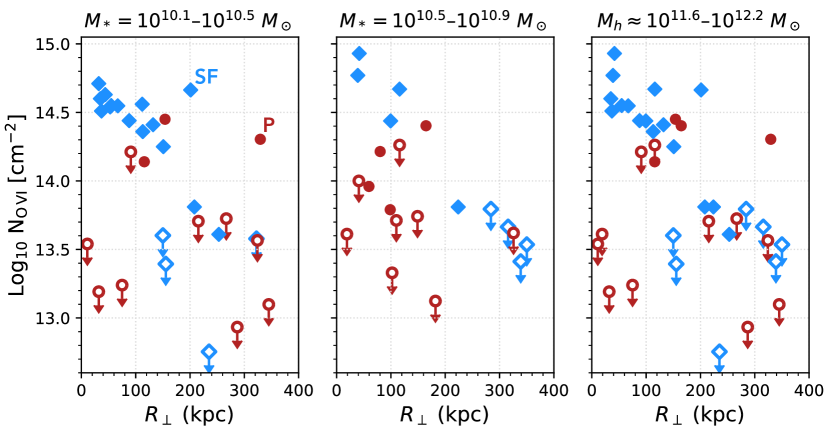
We compare star-forming and passive galaxies in three mass sub-samples: (lower stellar mass), (higher stellar mass), and (matched halo mass). The matched halo mass sub-sample partially overlaps with each of the matched stellar mass sub-samples. The impact parameters and column densities of galaxies in these sub-samples are shown in Figure 3. The right panel shows a subset of the galaxies in the left and middle panels. The distributions of measurements in all three panels are qualitatively similar. Star-forming galaxies have distinct inner and outer column density regimes, with uniformly high column densities in the inner region and a broad, generally lower distribution of column densities in the outer region. Passive galaxies have a broad distribution of column densities at all impact parameters, with a possible tendency towards higher column densities at low impact parameters. The inner star-forming galaxy column densities are greater than almost all of the inner passive galaxy column densities.
3 Analysis and Results
We quantify the incidence of strong absorbers around star-forming and passive galaxies by calculating covering fractions, the number of detections above a threshold (“hits”) over the number of observations. We adopt a detection threshold of cm-2, which is just above the least constraining upper limit in the sample. An upper limit that is greater than the threshold is ambiguous, meaning that using a lower threshold would require discarding part of the sample.
The number of hits in a sample of fixed size given a covering fraction has a binomial distribution. Assuming a beta distribution prior on the covering fraction, the posterior probability distribution for the covering fraction is itself a beta distribution. We use the Jeffreys prior, Beta, and use the 16th and 84th quantiles of the covering fraction posterior probability distribution as a 68% (1-equivalent) credible interval.
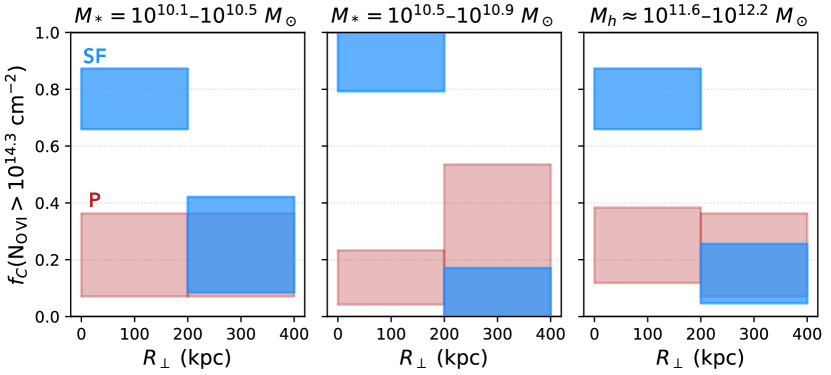
From visual inspection of Figure 3, there is an obvious need for covering fractions to depend on impact parameter. We include an impact parameter dependence by splitting each mass-selected sub-sample into inner and outer regions. Figure 4 shows inner and outer covering fractions for the three mass sub-samples and a dividing of 200 kpc. The inner covering fraction around star-forming galaxies is higher than that around passive galaxies. The outer covering fractions of the two galaxy classes are consistent, with overlapping 68% credible intervals.
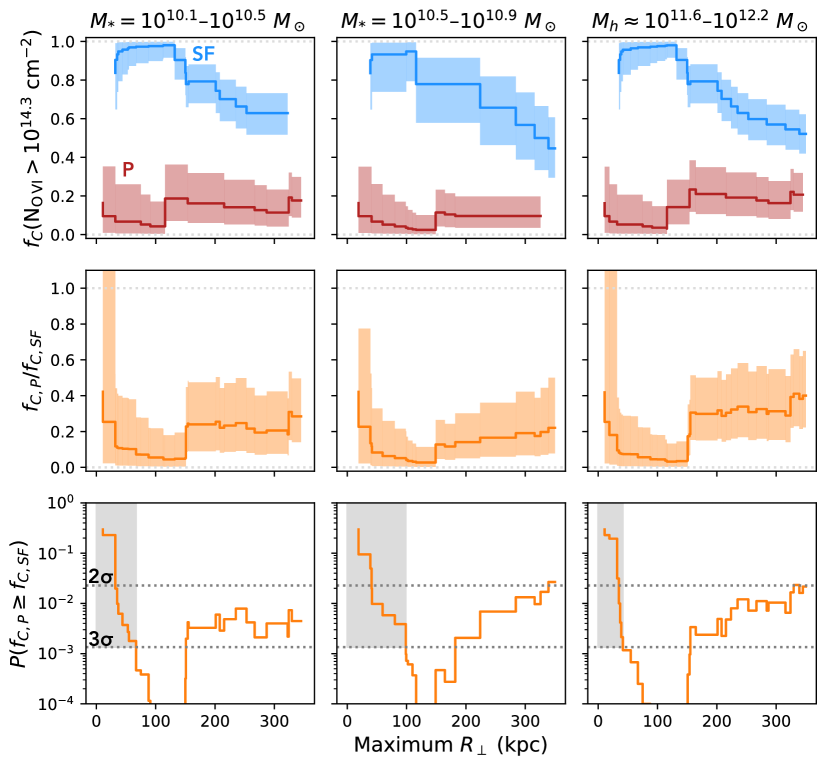
To quantitatively compare the inner covering fractions for the two galaxy classes, we calculate their ratio as a function of maximum inner impact parameter. The top row of Figure 5 shows inner covering fractions at all impact parameters spanned by each mass-selected sub-sample. These covering fractions are cumulative: measurements used to calculate the covering fraction at are also used to calculate the covering fraction at . The star-forming galaxy covering fractions decline outside about 150 kpc. The passive galaxy covering fractions are similar at all impact parameters. The middle row shows the ratio . The probability distribution over the ratio is estimated by integrating over the joint distribution of the two covering fractions, , over lines of fixed ratio.
The bottom row of the figure shows the probability that this ratio is greater than one. We consider a probability less than about 0.00135 to be statistically significant evidence222This is the probability of drawing a value that is lower than from a Gaussian distribution. that is greater than . If there are too few measurements, the probability can never be below this threshold. For all maximum impact parameters that are less than about 150 kpc and where there are enough measurements, the probability is below the threshold. The decrease in significance for greater dividing impact parameters is likely physical and can be explained by the decline in the star-forming galaxy covering fraction. In all three mass-matched sub-samples, there are significantly more strong absorbers near star-forming galaxies than near passive galaxies. These results show that there is a statistically significant dichotomy in around star-forming and passive galaxies at fixed stellar mass and at fixed halo mass.
4 Discussion
4.1 Comparison with previous work on and star formation
The present study builds on Tumlinson et al. (2011), which found that there is a higher incidence rate of strong absorption around star-forming galaxies than around passive galaxies at . The supplementary material of Tumlinson et al. (2011) contains a comparison of detection rates between the galaxy classes restricted to a mass range where star-forming and passive galaxies in their overlap, . They find that with -level significance, the detection rate is higher for star-forming galaxies, a suggestive result that motivated our current work.
Like a number of other observational studies (Johnson et al., 2015; Zahedy et al., 2019), we confirm the general finding that there is an dichotomy between star-forming and passive galaxies. We extend the result by establishing with high statistical significance that the dichotomy persists when controlling for stellar mass or halo mass. The difference in incidence around passive galaxies is evidence for a CGM transformation that is associated with how central galaxies in this mass range quench.
4.2 Galaxy quenching and CGM transformation
Recent theory and analyses of cosmological hydrodynamic simulations offer a candidate for the required CGM transformation: the heating and ejection of CGM gas by integrated black hole feedback (Mathews & Prochaska, 2017; Suresh et al., 2017; Davies et al., 2020a; Terrazas et al., 2020; Zinger et al., 2020; Oppenheimer et al., 2020). In the EAGLE and Illustris-TNG simulations, galaxies quench when the integrated amount of black hole feedback of the appropriate type exceeds the binding energy of the CGM and ejects some fraction of it from the halo. The bulk of the gas remaining in the CGM after quenching is hotter and more diffuse than before, and as a result has a long cooling time. Nelson et al. (2018) find that in Illustris-TNG, the mass also drops once a galaxy quenches. This galaxy quenching mechanism is consistent with our observations (and some observational studies of central galaxy quenching, e.g., Reines & Volonteri 2015; Piotrowska et al. 2022) because its onset is determined by black hole mass, rather than by galaxy stellar mass or halo mass. Other quenching mechanisms, such as those in which the interaction of a halo with large scale structure cuts off the supply of intergalactic gas to the central galaxy (Aragon Calvo et al., 2019; Winkel et al., 2021), would also be consistent.
4.2.1 High passive galaxy : geometric or temporal variation?
While most absorbers associated with passive galaxies have low column densities, this is not universal. Of the sixteen passive galaxies in our sample with kpc, two have values typical of star-forming galaxies. Put another way, the distribution for sightlines near passive galaxies is shifted to lower compared to for star-forming galaxies, but does have a high tail.
The simplest explanations for these two cases is misclassification or interloping absorption. Both galaxies have secure classifications, with very low hydrogen emission equivalent widths and values that are greater than the threshold of 1.6. Their values are less than the median for the passive galaxy sample, so there is a possibility that these galaxies quenched relatively recently. Interloping absorption can be significant: Ho et al. (2021) find that in the EAGLE simulations, the column density of absorbers within km s-1 of a galaxy can be twice that of absorbers with radius less than . This could be the explanation for one of the galaxies, where we do not have good info on environment. The other galaxy is found in a CGM2 quasar field with spectroscopy that is complete to a -band magnitude of 22 within 600 kpc, a depth sufficient to detect galaxies down to . No other galaxies are detected within 600 kpc of the sightline and 600 km s-1 of the passive galaxy in question, suggesting that the high column density is not attributable to an interloping galaxy’s CGM.
Possible physical explanations for the the high tail include a patchy distribution and a lag between quenching and CGM transformation. If around a typical passive galaxy is found in localized, anisotropically distributed structures, the low sample-averaged incidence rate would reflect a low per-galaxy covering fraction. However, these structures would need to have total column densities close to those of sightlines through a star-forming galaxy’s CGM. A different explanation is that the CGM transformation as seen in starts later or takes longer than quenching. In this interpretation, the passive galaxies with high column densities are ones that quenched recently.
Examples of both of these options, within-halo spatial and between-halo temporal variation, have been seen in cosmological hydrodynamic simulations. Nelson et al. (2018) find that in the TNG100 simulation, the distribution is smooth and approximately isotropic around star-forming galaxies but patchy and obviously anisotropic around passive galaxies. Oppenheimer et al. (2020) analyze the evolution of black hole mass, star formation rate, and the CGM in the EAGLE simulation. They find that a galaxy quenches at approximately the same time as the most rapid phase of growth for the galaxy’s black hole. The fraction of total halo mass found as gas in a galaxy’s CGM starts to sharply decline at the same time, but the covering fractions of ion absorption, including , do not drop until about 1 Gyr after quenching. Appleby et al. (2022) compare CGM properties between star-forming, passive, and intermediate (“green valley”) galaxies from the SIMBA simulation. They define galaxies to be in the green valley if their sSFR is between and yr-1. Based on studies of the correlation between sSFR and , galaxies with these sSFRs are more likely than not to have (e.g. Bluck et al., 2020; Angthopo et al., 2020), meaning that we would classify most of them as being passive. Appleby et al. (2022) find that these galaxies have covering fractions that are intermediate between those of galaxies with lower or higher sSFR, which would be another example of between-halo temporal variation.
While all three of these simulations show a decline in the incidence rate of absorption as a result of integrated black hole feedback, they implement the feedback in different ways (Schaye et al., 2015; Weinberger et al., 2017; Davé et al., 2019). These implementation differences lead to differences in bulk properties such as CGM mass as a fraction of halo mass (e.g. Davies et al., 2020b; Tillman et al., 2022) and could mean that different mechanisms are responsible for the reduction in incidence rates in each simulation. It is not obvious whether simulation resolution has a noticeable effect on the comparisons we make above because covering fractions are a relatively coarse CGM property. Some works find that refinement beyond the resolution of these three simulations ( ) does not substantially change coarse CGM properties (van de Voort et al., 2019; Peeples et al., 2019; Suresh et al., 2019). Conversely, Hummels et al. (2019) find that using finer resolution can reduce column densities throughout the CGM and Lochhaas et al. (2021) find that resolution affects what fraction of energy in CGM gas is thermal rather that non-thermal.
4.2.2 The case of M31
Our observations consist of a single sightline per galaxy, and so cannot distinguish within-halo variation from between-halo variation. The CGM of the Milky Way’s nearest massive neighbor, M31, has been measured along multiple sightlines (Lehner et al., 2015, 2020). We would classify M31 as passive and slightly more massive than the most massive galaxies we consider333The nominal is 10.93, where we have applied a Kroupa to Chabrier initial mass function conversion factor of (Zahid et al., 2012). The sSFR is yr-1 (Lewis et al., 2015; Williams et al., 2017).. Lehner et al. (2020) measure along eight sightlines with kpc, with four of these eight sightlines at kpc. and measurements within 250 and 400 kpc, respectively, are greater than cm-2. In our higher stellar mass passive galaxy sub-sample, the corresponding hit rates are and . Using Barnard’s exact test for 2-by-2 contingency tables (Barnard, 1947), the probability of M31 having a covering fraction that is less than or equal to that of the to passive sample is less than 0.1%, a greater-than-3 tension. We propose three (non-mutually exclusive) ways of resolving this tension: a coincidence of observations with a coherent spatial feature; variation being a between-halo temporal effect; and the possibility of different modes of quenching.
Lehner et al. (2020) find that ions other than with tend to be detected in a particular direction relative to M31 and suggest that this absorption may be arising in an accreting IGM filament. The sightlines are in this direction, and so could also be related to this hypothetical filament. Large structures between the Milky Way and M31 are found in simulations of Local Group analogues (Nuza et al., 2014; Damle et al., 2022) and a bridge of hot K gas between the galaxies has been detected in X-ray emission (Qu et al., 2021).
The second possibility is that M31 quenched recently and the CGM transformation is not yet apparent in UV-accessible CGM tracers. Williams et al. (2017) find that M31 had a burst of star formation about 2 Gyr ago and Lewis et al. (2015) find that the star formation rate has been mostly declining for the past 400 Myr. M31 could therefore still be in the period between quenching and a drop in metal absorber incidence.
Finally, it is possible that not all quenching is accompanied by a CGM transformation. Unlike many passive galaxies, M31 has spiral structure and a substantial gaseous disk ( ; Carignan et al. 2006). The band luminosity of M31 is (Huchra et al., 2012; Willmer, 2018) and its is about . This -mass-to-luminosity ratio is greater than that of % of early type galaxies in the ATLAS3D survey, but is typical for a low redshift massive spiral galaxy (Serra et al., 2012). Its high gas mass would suggest that M31 has not undergone the interstellar medium “blowout” associated with quenching in recent cosmological hydrodynamic simulations. Internal dynamics driven by structure in a galaxy can reduce the star formation efficiency of available gas (“bar quenching”; Tubbs 1982; Khoperskov et al. 2018; Newnham et al. 2020). M31 is known to have a bar and so could be affected by this mechanism (Athanassoula & Beaton, 2006; Dorman et al., 2015; Feng et al., 2022). The CGM would not be affected by the bar, allowing a star-forming galaxy level of with a low sSFR.
4.3 Cool and hot gas in the CGM of quenched galaxies
If around galaxies with is mostly collisionally ionized and found in K gas, then the dichotomy implies that quenching is associated with a drop in the amount of warm gas in a galaxy’s CGM. There is evidence that passive galaxies in the same mass range also have less K gas than the corresponding star-forming galaxies. Cool gas is traced by ions such as . Analyses of the covering fractions of strong absorbers as a function of impact parameter, stellar mass, and star formation rate find that the covering fraction is several times lower near passive galaxies than near star-forming galaxies (Bordoloi et al., 2011; Lan, 2020; Anand et al., 2021).
The situation is less clear for gas that is too hot to be traced by ( K). Emission from hot gas can be detected in X-rays. Comparat et al. (2022) and Chadayammuri et al. (2022) use eROSITA data to measure X-ray emission around stellar-mass-controlled star-forming and passive galaxy samples and find conflicting results. Comparat et al. (2022) find that passive galaxies are associated with more X-ray emission while Chadayammuri et al. (2022) find the opposite. Chadayammuri et al. (2022) argue that the discrepancy is driven by differences in how emission from groups and clusters is treated for galaxies other than the group and cluster centrals. Determining which interpretation of the data is correct will tell us whether the CGM transformation associated with quenching mostly heats gas or also drives some of it out of the halo. If warm gas is driven out as well as heated, the passive galaxy X-ray emission should be weaker. If the gas is heated but remains in the CGM, then the passive galaxy X-ray emission should be stronger.
5 Conclusion
We study the incidence rate of strong absorption in the circumgalactic medium of star-forming and passive central galaxies with stellar masses between and . The galaxy--absorber pair sample is drawn from Tchernyshyov et al. (2022) and references therein and from the CUBS survey (Chen et al., 2020). The absorber impact parameters span to 400 physical kpc. To separate differences due to galaxy stellar or halo mass from differences related to galaxy quenching, we compare the two galaxy classes in narrow stellar mass ranges, and , and, separately, in a relatively narrow estimated halo mass range, .
For each combination of mass range and galaxy class, we further split the galaxies by impact parameter into an inner and outer region. We measure covering fractions of sightlines with cm-2 for these two regions and calculate probabilities that the inner star-forming galaxy covering fractions are less than or equal to the inner passive galaxy covering fractions. We also explore some possible origin scenarios for the small number of strong absorbers that are still found around passive galaxies.
Our observational results on the incidence rate of strong absorbers around star-forming and passive galaxies in the mass ranges , , and are as follows:
-
•
Within 150 kpc, the covering fraction of strong absorbers is approximately for star-forming galaxies and for passive galaxies.
-
•
In each mass range and within 150 kpc, the probability that star-forming galaxy covering fractions are less than or equal to passive galaxy covering fractions is less than 0.001. At greater than -equivalent statistical significance, the incidence rate of strong absorption in the CGM is greater around star-forming galaxies than around passive galaxies with the same stellar or halo mass.
From these observational results, we reach the following conclusions:
-
•
There is a dichotomy in the incidence rate of strong absorption in the CGM of star-forming and passive galaxies at fixed stellar mass and at fixed halo mass.
-
•
The quenching of a central galaxy at low redshift is, in most cases, accompanied by a transformation of the galaxy’s CGM. This change is not driven by the mass of the galaxy’s dark matter halo.
-
•
There may be a delay between galaxy quenching and an observable change in the incidence rate of . Alternatively (or jointly), there may be a less common mode of quenching in which the CGM is not substantially changed.
References
- Anand et al. (2021) Anand, A., Nelson, D., & Kauffmann, G. 2021, MNRAS, 504, 65, doi: 10.1093/mnras/stab871
- Angthopo et al. (2020) Angthopo, J., Ferreras, I., & Silk, J. 2020, MNRAS, 495, 2720, doi: 10.1093/mnras/staa1276
- Appleby et al. (2022) Appleby, S., Davé, R., Sorini, D., Cui, W., & Christiansen, J. 2022, arXiv e-prints, arXiv:2207.04068. https://arxiv.org/abs/2207.04068
- Aragon Calvo et al. (2019) Aragon Calvo, M. A., Neyrinck, M. C., & Silk, J. 2019, The Open Journal of Astrophysics, 2, 7, doi: 10.21105/astro.1697.07881
- Astropy Collaboration et al. (2013) Astropy Collaboration, Robitaille, T. P., Tollerud, E. J., et al. 2013, A&A, 558, A33, doi: 10.1051/0004-6361/201322068
- Astropy Collaboration et al. (2018) Astropy Collaboration, Price-Whelan, A. M., Sipőcz, B. M., et al. 2018, AJ, 156, 123, doi: 10.3847/1538-3881/aabc4f
- Astropy Collaboration et al. (2022) Astropy Collaboration, Price-Whelan, A. M., Lim, P. L., et al. 2022, ApJ, 935, 167, doi: 10.3847/1538-4357/ac7c74
- Athanassoula & Beaton (2006) Athanassoula, E., & Beaton, R. L. 2006, MNRAS, 370, 1499, doi: 10.1111/j.1365-2966.2006.10567.x
- Bahcall et al. (1991) Bahcall, J. N., Jannuzi, B. T., Schneider, D. P., et al. 1991, ApJ, 377, L5, doi: 10.1086/186103
- Balogh et al. (1999) Balogh, M. L., Morris, S. L., Yee, H. K. C., Carlberg, R. G., & Ellingson, E. 1999, ApJ, 527, 54, doi: 10.1086/308056
- Barnard (1947) Barnard, G. A. 1947, Biometrika, 34, 123, doi: 10.1093/biomet/34.1-2.123
- Behroozi et al. (2019) Behroozi, P., Wechsler, R. H., Hearin, A. P., & Conroy, C. 2019, MNRAS, 488, 3143. https://arxiv.org/abs/1806.07893
- Bergeron (1986) Bergeron, J. 1986, A&A, 155, L8
- Birnboim & Dekel (2003) Birnboim, Y., & Dekel, A. 2003, MNRAS, 345, 349, doi: 10.1046/j.1365-8711.2003.06955.x
- Bluck et al. (2020) Bluck, A. F. L., Maiolino, R., Sánchez, S. F., et al. 2020, MNRAS, 492, 96, doi: 10.1093/mnras/stz3264
- Boettcher et al. (2021) Boettcher, E., Chen, H.-W., Zahedy, F. S., et al. 2021, ApJ, 913, 18, doi: 10.3847/1538-4357/abf0a0
- Bordoloi et al. (2017) Bordoloi, R., Wagner, A. Y., Heckman, T. M., & Norman, C. A. 2017, ApJ, 848, 122. https://arxiv.org/abs/1605.07187
- Bordoloi et al. (2011) Bordoloi, R., Lilly, S. J., Knobel, C., et al. 2011, ApJ, 743, 10. https://arxiv.org/abs/1106.0616
- Burchett et al. (2018) Burchett, J. N., Tripp, T. M., Wang, Q. D., et al. 2018, MNRAS, 475, 2067. https://arxiv.org/abs/1705.05892
- Burchett et al. (2016) Burchett, J. N., Tripp, T. M., Bordoloi, R., et al. 2016, ApJ, 832, 124. https://arxiv.org/abs/1512.00853
- Cappellari (2017) Cappellari, M. 2017, MNRAS, 466, 798, doi: 10.1093/mnras/stw3020
- Carignan et al. (2006) Carignan, C., Chemin, L., Huchtmeier, W. K., & Lockman, F. J. 2006, ApJ, 641, L109, doi: 10.1086/503869
- Chabrier (2003) Chabrier, G. 2003, PASP, 115, 763. https://arxiv.org/abs/astro-ph/0304382
- Chadayammuri et al. (2022) Chadayammuri, U., Bogdán, Á., Oppenheimer, B. D., et al. 2022, ApJ, 936, L15, doi: 10.3847/2041-8213/ac8936
- Chen et al. (2001) Chen, H.-W., Lanzetta, K. M., & Webb, J. K. 2001, ApJ, 556, 158, doi: 10.1086/321537
- Chen et al. (2020) Chen, H.-W., Zahedy, F. S., Boettcher, E., et al. 2020, MNRAS, 497, 498, doi: 10.1093/mnras/staa1773
- Comparat et al. (2022) Comparat, J., Truong, N., Merloni, A., et al. 2022, A&A, 666, A156, doi: 10.1051/0004-6361/202243101
- Cooper et al. (2021) Cooper, T. J., Rudie, G. C., Chen, H.-W., et al. 2021, MNRAS, 508, 4359, doi: 10.1093/mnras/stab2869
- Damle et al. (2022) Damle, M., Sparre, M., Richter, P., et al. 2022, MNRAS, 512, 3717, doi: 10.1093/mnras/stac663
- Davé et al. (2019) Davé, R., Anglés-Alcázar, D., Narayanan, D., et al. 2019, MNRAS, 486, 2827, doi: 10.1093/mnras/stz937
- Davies et al. (2020a) Davies, J. J., Crain, R. A., Oppenheimer, B. D., & Schaye, J. 2020a, MNRAS, 491, 4462. https://arxiv.org/abs/1908.11380
- Davies et al. (2020b) Davies, J. J., Crain, R. A., & Pontzen, A. 2020b, arXiv e-prints, arXiv:2006.13221. https://arxiv.org/abs/2006.13221
- Dekel & Birnboim (2006) Dekel, A., & Birnboim, Y. 2006, MNRAS, 368, 2, doi: 10.1111/j.1365-2966.2006.10145.x
- Dorman et al. (2015) Dorman, C. E., Guhathakurta, P., Seth, A. C., et al. 2015, ApJ, 803, 24, doi: 10.1088/0004-637X/803/1/24
- Faerman et al. (2017) Faerman, Y., Sternberg, A., & McKee, C. F. 2017, ApJ, 835, 52. https://arxiv.org/abs/1602.00689
- Falcón-Barroso et al. (2011) Falcón-Barroso, J., Sánchez-Blázquez, P., Vazdekis, A., et al. 2011, A&A, 532, A95, doi: 10.1051/0004-6361/201116842
- Feng et al. (2022) Feng, Z.-X., Li, Z., Shen, J., et al. 2022, ApJ, 933, 233, doi: 10.3847/1538-4357/ac7964
- Fielding et al. (2017) Fielding, D., Quataert, E., McCourt, M., & Thompson, T. A. 2017, MNRAS, 466, 3810. https://arxiv.org/abs/1606.06734
- Harris et al. (2020) Harris, C. R., Millman, K. J., van der Walt, S. J., et al. 2020, Nature, 585, 357, doi: 10.1038/s41586-020-2649-2
- Heckman et al. (2002) Heckman, T. M., Norman, C. A., Strickland, D. K., & Sembach, K. R. 2002, ApJ, 577, 691. https://arxiv.org/abs/astro-ph/0205556
- Ho et al. (2021) Ho, S. H., Martin, C. L., & Schaye, J. 2021, arXiv e-prints, arXiv:2110.01633. https://arxiv.org/abs/2110.01633
- Huchra et al. (2012) Huchra, J. P., Macri, L. M., Masters, K. L., et al. 2012, ApJS, 199, 26, doi: 10.1088/0067-0049/199/2/26
- Hummels et al. (2019) Hummels, C. B., Smith, B. D., Hopkins, P. F., et al. 2019, ApJ, 882, 156, doi: 10.3847/1538-4357/ab378f
- Hunter (2007) Hunter, J. D. 2007, Computing in Science and Engineering, 9, 90, doi: 10.1109/MCSE.2007.55
- Johnson et al. (2015) Johnson, S. D., Chen, H.-W., & Mulchaey, J. S. 2015, MNRAS, 449, 3263. https://arxiv.org/abs/1503.04199
- Kauffmann et al. (2003) Kauffmann, G., Heckman, T. M., White, S. D. M., et al. 2003, MNRAS, 341, 33, doi: 10.1046/j.1365-8711.2003.06291.x
- Keeney et al. (2018) Keeney, B. A., Stocke, J. T., Pratt, C. T., et al. 2018, ApJS, 237, 11. https://arxiv.org/abs/1805.08767
- Kereš et al. (2005) Kereš, D., Katz, N., Weinberg, D. H., & Davé, R. 2005, MNRAS, 363, 2, doi: 10.1111/j.1365-2966.2005.09451.x
- Khoperskov et al. (2018) Khoperskov, S., Haywood, M., Di Matteo, P., Lehnert, M. D., & Combes, F. 2018, A&A, 609, A60, doi: 10.1051/0004-6361/201731211
- Lan (2020) Lan, T.-W. 2020, ApJ, 897, 97, doi: 10.3847/1538-4357/ab989a
- Lehner et al. (2015) Lehner, N., Howk, J. C., & Wakker, B. P. 2015, ApJ, 804, 79, doi: 10.1088/0004-637X/804/2/79
- Lehner et al. (2020) Lehner, N., Berek, S. C., Howk, J. C., et al. 2020, ApJ, 900, 9. https://arxiv.org/abs/2002.07818
- Lewis et al. (2015) Lewis, A. R., Dolphin, A. E., Dalcanton, J. J., et al. 2015, ApJ, 805, 183, doi: 10.1088/0004-637X/805/2/183
- Lochhaas et al. (2021) Lochhaas, C., Tumlinson, J., O’Shea, B. W., et al. 2021, ApJ, 922, 121, doi: 10.3847/1538-4357/ac2496
- Mathews & Prochaska (2017) Mathews, W. G., & Prochaska, J. X. 2017, ApJ, 846, L24. https://arxiv.org/abs/1708.07140
- McQuinn & Werk (2018) McQuinn, M., & Werk, J. K. 2018, ApJ, 852, 33. https://arxiv.org/abs/1703.03422
- Nelson et al. (2018) Nelson, D., Kauffmann, G., Pillepich, A., et al. 2018, MNRAS, 477, 450. https://arxiv.org/abs/1712.00016
- Newnham et al. (2020) Newnham, L., Hess, K. M., Masters, K. L., et al. 2020, MNRAS, 492, 4697, doi: 10.1093/mnras/staa064
- Nuza et al. (2014) Nuza, S. E., Parisi, F., Scannapieco, C., et al. 2014, MNRAS, 441, 2593, doi: 10.1093/mnras/stu643
- Oppenheimer et al. (2016) Oppenheimer, B. D., Crain, R. A., Schaye, J., et al. 2016, MNRAS, 460, 2157. https://arxiv.org/abs/1603.05984
- Oppenheimer et al. (2020) Oppenheimer, B. D., Davies, J. J., Crain, R. A., et al. 2020, MNRAS, 491, 2939. https://arxiv.org/abs/1904.05904
- Peeples et al. (2019) Peeples, M. S., Corlies, L., Tumlinson, J., et al. 2019, ApJ, 873, 129, doi: 10.3847/1538-4357/ab0654
- Piotrowska et al. (2022) Piotrowska, J. M., Bluck, A. F. L., Maiolino, R., & Peng, Y. 2022, MNRAS, 512, 1052, doi: 10.1093/mnras/stab3673
- Planck Collaboration et al. (2016) Planck Collaboration, Ade, P. A. R., Aghanim, N., et al. 2016, A&A, 594, A13. https://arxiv.org/abs/1502.01589
- Prochaska et al. (2017) Prochaska, J. X., Tejos, N., Crighton, N., et al. 2017, Linetools/Linetools: Third Minor Release, v0.3, Zenodo, doi: 10.5281/zenodo.1036773
- Qu & Bregman (2018) Qu, Z., & Bregman, J. N. 2018, ApJ, 862, 23. https://arxiv.org/abs/1804.08784
- Qu et al. (2021) Qu, Z., Huang, R., Bregman, J. N., & Li, J.-T. 2021, ApJ, 907, 14, doi: 10.3847/1538-4357/abc9b9
- Reines & Volonteri (2015) Reines, A. E., & Volonteri, M. 2015, ApJ, 813, 82, doi: 10.1088/0004-637X/813/2/82
- Sanchez et al. (2019) Sanchez, N. N., Werk, J. K., Tremmel, M., et al. 2019, ApJ, 882, 8, doi: 10.3847/1538-4357/ab3045
- Sánchez et al. (2014) Sánchez, S. F., Rosales-Ortega, F. F., Iglesias-Páramo, J., et al. 2014, A&A, 563, A49, doi: 10.1051/0004-6361/201322343
- Schaye et al. (2015) Schaye, J., Crain, R. A., Bower, R. G., et al. 2015, MNRAS, 446, 521, doi: 10.1093/mnras/stu2058
- Serra et al. (2012) Serra, P., Oosterloo, T., Morganti, R., et al. 2012, MNRAS, 422, 1835, doi: 10.1111/j.1365-2966.2012.20219.x
- Stern et al. (2018) Stern, J., Faucher-Giguère, C.-A., Hennawi, J. F., et al. 2018, ApJ, 865, 91. https://arxiv.org/abs/1803.05446
- Stocke et al. (2006) Stocke, J. T., Penton, S. V., Danforth, C. W., et al. 2006, ApJ, 641, 217, doi: 10.1086/500386
- Suresh et al. (2019) Suresh, J., Nelson, D., Genel, S., Rubin, K. H. R., & Hernquist, L. 2019, MNRAS, 483, 4040, doi: 10.1093/mnras/sty3402
- Suresh et al. (2017) Suresh, J., Rubin, K. H. R., Kannan, R., et al. 2017, MNRAS, 465, 2966. https://arxiv.org/abs/1511.00687
- Tchernyshyov et al. (2022) Tchernyshyov, K., Werk, J. K., Wilde, M. C., et al. 2022, ApJ, 927, 147, doi: 10.3847/1538-4357/ac450c
- Tejos et al. (2016) Tejos, N., Prochaska, J. X., Crighton, N. H. M., et al. 2016, MNRAS, 455, 2662, doi: 10.1093/mnras/stv2376
- Terrazas et al. (2020) Terrazas, B. A., Bell, E. F., Pillepich, A., et al. 2020, MNRAS, 493, 1888. https://arxiv.org/abs/1906.02747
- Tillman et al. (2022) Tillman, M. T., Burkhart, B., Tonnesen, S., et al. 2022, arXiv e-prints, arXiv:2210.02467. https://arxiv.org/abs/2210.02467
- Tripp et al. (2008) Tripp, T. M., Sembach, K. R., Bowen, D. V., et al. 2008, ApJS, 177, 39. https://arxiv.org/abs/0706.1214
- Tubbs (1982) Tubbs, A. D. 1982, ApJ, 255, 458, doi: 10.1086/159846
- Tumlinson et al. (2011) Tumlinson, J., Thom, C., Werk, J. K., et al. 2011, Science, 334, 948. https://arxiv.org/abs/1111.3980
- van de Voort et al. (2019) van de Voort, F., Springel, V., Mandelker, N., van den Bosch, F. C., & Pakmor, R. 2019, MNRAS, 482, L85, doi: 10.1093/mnrasl/sly190
- Voit (2019) Voit, G. M. 2019, ApJ, 880, 139. https://arxiv.org/abs/1811.04976
- Weinberger et al. (2017) Weinberger, R., Springel, V., Hernquist, L., et al. 2017, MNRAS, 465, 3291, doi: 10.1093/mnras/stw2944
- Werk et al. (2013) Werk, J. K., Prochaska, J. X., Thom, C., et al. 2013, ApJS, 204, 17. https://arxiv.org/abs/1212.0558
- Wes McKinney (2010) Wes McKinney. 2010, in Proceedings of the 9th Python in Science Conference, ed. Stéfan van der Walt & Jarrod Millman, 56 – 61, doi: 10.25080/Majora-92bf1922-00a
- White & Rees (1978) White, S. D. M., & Rees, M. J. 1978, MNRAS, 183, 341, doi: 10.1093/mnras/183.3.341
- Wilde et al. (2021) Wilde, M. C., Werk, J. K., Burchett, J. N., et al. 2021, ApJ, 912, 9. https://arxiv.org/abs/2008.08092
- Williams et al. (2017) Williams, B. F., Dolphin, A. E., Dalcanton, J. J., et al. 2017, ApJ, 846, 145, doi: 10.3847/1538-4357/aa862a
- Willmer (2018) Willmer, C. N. A. 2018, ApJS, 236, 47, doi: 10.3847/1538-4365/aabfdf
- Winkel et al. (2021) Winkel, N., Pasquali, A., Kraljic, K., et al. 2021, MNRAS, 505, 4920, doi: 10.1093/mnras/stab1562
- Zahedy et al. (2019) Zahedy, F. S., Chen, H.-W., Johnson, S. D., et al. 2019, MNRAS, 484, 2257. https://arxiv.org/abs/1809.05115
- Zahid et al. (2012) Zahid, H. J., Dima, G. I., Kewley, L. J., Erb, D. K., & Davé, R. 2012, ApJ, 757, 54, doi: 10.1088/0004-637X/757/1/54
- Zinger et al. (2020) Zinger, E., Pillepich, A., Nelson, D., et al. 2020, MNRAS, 499, 768. https://arxiv.org/abs/2004.06132