Measurements of the angular momentum-mass relations in the Simba simulation
Abstract
We present measurements of the specific angular momentum content () of galaxies drawn from the Simba cosmological hydrodynamic simulations. For the stellar, H i and baryonic matter components we demonstrate the existence of extremely tight relations between and the mass contained within the radius at which the H i mass surface density decreases to 1 M⊙ pc-2. These relations are broadly consistent with a variety of empirical measurements. We confirm the observational result that the scatter in the stellar – relation is driven largely by H i content, and measure the dependence of its scatter on the deviations of galaxies from other important scaling relations. For a given stellar mass, H i-rich/poor galaxies have more/less-than-average stellar specific angular momentum. A similar, yet weaker, correlation exists for H i mass fraction. Overall, our results demonstrate the utility of the Simba simulations as a platform for understanding and contextualising the data and results from forthcoming large galaxy surveys.
1 Introduction
An important goal in modern astronomy is to quantitatively understand the processes by which galaxies build up their mass in a hierarchical formation scenario. The dynamical characteristics of a galaxy serve as a proxy for the formation history of the system, including interactions with other galaxies. In a CDM Universe, the growth of structure is governed by the tidal field of an irregular matter distribution, resulting in the transfer of angular momentum from the tidal field to collapsing proto-galaxies (e.g., Peebles 1969). Angular momentum therefore plays a key role in the formation and evolution of galaxies.
In recent years, several investigators have carried out measurements of the specific angular momentum content of nearby observed galaxies. The manner in which the measurement is made depends to a large extent on the characteristics of the available data. The simplest approach that is often applied to relatively large samples of galaxies involves approximating by adopting a constant-value measure of a galaxy’s rotation velocity (such as ) and a particular measure of its radial extent (such as effective radius). While the method is relatively quick and easy to apply, it can lead to the introduction of random and systematic errors in , which need to be reliably estimated. Fall [1983] used this approach to demonstrate the existence of a power-law relation between the stellar specific angular momenta, , of a sample of galaxies and their stellar masses, . Romanowsky and Fall [2012] extended the study of Fall [1983] by carrying out what was the largest investigation of galaxies in the plane to date. More precise measurements of can be generated for galaxies that are both spatially and kinematically well-resolved. Kinematic maps from H i interferometers and optical or infrared telescopes equipped with an integral field spectroscopy unit are well suited to producing high-precision observational measurements of . The pioneering work of Obreschkow and Glazebrook [2014] focused on using azimuthally-averaged velocity and mass-density profiles of a sample of 16 spiral galaxies from The H i Nearby Galaxy Survey [Walter et al., 2008] to measure as a function of galactocentric radius. The scatter in their relations was shown to be driven largely by bugle mass fraction. Cortese et al. [2016] used 2D resolved line-of-sight velocity maps of the stellar and ionised gas content of 488 galaxies from the SAMI survey [Croom et al., 2012] to show that increases monotonically with , while the scatter in the relation is strongly correlated with optical morphology. Posti et al. [2018] applied the high-precision method to 92 galaxies from the Spitzer Photometry and Accurate Rotation Curves sample [Lelli et al., 2016] to produce an improved estimate of the – relation over a large range of stellar mass. More recently, Hardwick et al. [2022] used a hybrid approach based on single-value measures of velocity (from single-dish H i velocity width measurements) and measures of the spatially-resolved mass content of 564 nearby galaxies in the eXtended GALEX Arecibo SDSS Survey [Catinella et al., 2018] to show the scatter in the local – relation to be driven mainly by H i gas fraction (at lower masses) and bulge fraction (at higher masses).
Various galaxy properties have been identified as contributors to scatter in measured – relations. Galaxy morphology is a main driver. The study of Romanowsky and Fall [2012] used extended kinematic data for nearby bright galaxies of all types. They showed ellipticals and spirals to form two parallel tracks in the – plane. The improved accuracy of measurements offered by the study of Obreschkow and Glazebrook [2014] based on spatially-resolved multi-wavelength imaging led to the discovery of galaxy bulge mass fraction being the dominant driver in the baryonic – relation. Cortese et al. [2016] showed that for stellar masses M⊙, the scatter in the – relation is related to the stellar light distribution, hence morphology, of galaxies. They attribute this finding to the fact that, at fixed stellar mass, the contribution of ordered motions to the dynamical support of galaxies varies significantly. Posti et al. [2018] measured that the Fall relation extends to dwarf galaxies as a single, unbroken power-law. The showed that the tightness of the relation is improved if one considers only the disk components of spiral galaxies, and that its slope is closer to that of dark matter haloes. Gillman et al. [2019] used adaptive optics integral field observations of 34 star-forming galaxies from to measure inclination-corrected rotational velocities, half-light sizes and stellar masses, and investigated how the – relation for their sample evolves with cosmic time. They demonstrated an evolution in angular momentum content that is likely driven by the internal redistribution of angular momentum from the accretion of material. Mancera Piña et al. [2021a] measured the stellar and gas specific angular momenta for a sample of nearby galaxies, and discussed their internal correlations. They found disk scale length and gas fraction to be significant contributors to scatter in their relations. Mancera Piña et al. [2021b] extended the efforts of Mancera Piña et al. [2021a], further showing gas-rich galaxies to have larger stellar and baryonic momenta (but lower gas momenta) than gas-poor galaxies, at fixed mass.
Several authors have used cosmological simulations to study the – relation. Genel et al. [2015] used the Illustris cosmological simulation [Sijacki et al., 2015] to generate distinct stellar – relations for late-type and early-type galaxies. They showed the relations to correspond to different retention factors of the specific angular momentum generated by cosmological tidal torques. They further found feedback (in the forms of galactic winds and active galactic nuclei) to play a role in controlling the relations. Teklu et al. [2015] also studied the stellar – relation using hydrodynamical cosmological simulations taken from the set of Magneticum Pathfinder simulations111www.MAGNETICUM.org. Among other things, they showed the specific angular momentum of the stars in disk galaxies is slightly smaller compared to that of the cold gas. Obreja et al. [2016] showed galaxies from simulations taken from the Numerical Investigation of a Hundred Astrophysical Objects (NIHAO) project [Wang et al., 2015] to fall on top of observed ones in the stellar – plane. The disc and spheroid components of the galaxies show shallower correlations between and than the theoretical expectations for pure spirals and ellipticals. Lagos et al. [2017] used the Evolution and Assembly of GaLaxies and their Environments simulation suite [Schaye et al., 2015] to study the redshift evolution of specific angular momentum within galaxies. They found and (baryonic angular momentum) to be strongly correlated with stellar and baryonic mass, and showed the scatter in the relations to correlate with various morphological proxies such as gas fraction, stellar age, etc. Stevens et al. [2018] used the Dark Sage semi-analytic model [Stevens et al., 2016] to study the connection between atomic gas fraction and a global instability parameter determined by the ratio of disk specific angular momentum to mass. Stevens et al. [2018] demonstrated a clear correlation between gas fraction and disk specific angular momentum at fixed disk mass. Semi-analytic models were also used by Zoldan et al. [2018] to predict a strong dependence of the specific angular momentum of galaxies on their cold gas content. Spirals decomposed into bulge and disk subcomponents were found to follow similar trends. El-Badry et al. [2018] used a suite of cosmological zoom-in simulations from the Feedback In Realistic Environments project [Hopkins et al., 2014] to show that the ratio of specific angular momentum of gas in the central galaxy to that of its dark matter halo increases significantly with galaxy mass. They claim the reason for the reduced angular momentum of baryons in low-mass haloes to be due to the fact that low-mass haloes accrete gas less efficiently at late times, when the mean specific angular momentum content of accreted gas is highest.
In this work, we use the Simba cosmological hydrodynamical simulations [Davé et al., 2019] to measure relationships between specific angular momentum and mass for various mass components of galaxies. We compare our results to those based on observational data, and use the information that Simba provides to search for systematic variations of scatter in the stellar – relation with scatter in other important scaling relations. Demonstrating that the Simba simulations produce – relations that are consistent with empirical results serves to further promote them as a platform for understanding and interpreting data and results from forthcoming galaxy surveys.
The layout of this paper is as follows. We present in Section 2 the sample of Simba galaxies we use for this study, as well as our method of measuring their specific angular momentum content. In Section 3 we show the – relations we measure for the various mass components of the Simba galaxies. We offer a discussion of the results in Section 4, and investigate the properties of the residuals in Section 5. Finally, our results are summarised in Section 6.
2 Data
2.1 Simulations
In this work we used the Simba cosmological galaxy formation simulations [Davé et al., 2019] to measure the H i dynamics of galaxies. Simba is run with Gizmo’s meshless finite mass hydrodynamics and includes detailed prescriptions for sub-resolution star formation and feedback processes, including black hole growth. We utilised the high-resolution box consisting of dark matter particles and gas elements within a periodic volume. The resulting mass resolutions for dark matter particles and gas elements are M⊙ and M⊙, respectively.
Simba does not explicitly model (owing to resolution limitations) physical processes giving rise to the cold phase of the interstellar medium. Self-shielding and a prescription for H2 fraction based on gas metallicity work together to transform ionised gas into atomic and molecular phases. The chemical enrichment model used by Simba tracks 9 metals during the simulation, tracking enrichment due to Type Ia and Type II supernovae and asymptotic giant brach stars. Star formation is modelled using an H2-based Schmidt [1959] relation that uses the H2 density and dynamical time. A Chabrier [2003] stellar initial mass function is assumed in order to compute stellar evolution. Simba uses a 6-D friends-of-friends algorithm to group star and gas particles into galaxies. The interested reader is referred to Davé et al. [2019, 2020] and Glowacki et al. [2020] for further details regarding star formation, feedback and other galaxy formation physics employed by Simba.
2.2 Sample
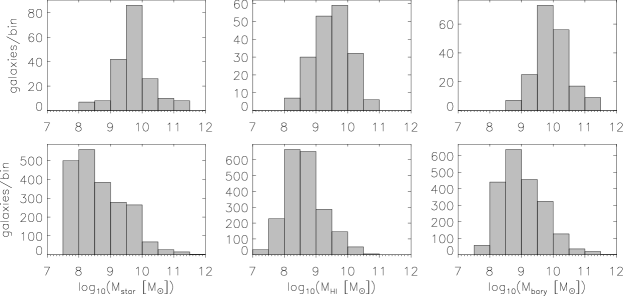
We used a sample of Simba galaxies taken from Glowacki et al. [2021]. Those authors applied the following H i mass, stellar mass and specific star formation rate cuts to the galaxies in the high-resolution Simba snapshot: M⊙, M⊙, yr. These cuts were made in order to build a sample of galaxies that are actively forming stars and which have masses above the numerical resolution limits of the high-resolution simulation. An additional cut was made on dynamical morphology in order to ensure the galaxies have their dynamics dominated by rotation. Galaxies with were selected as being disk-dominated, where is the fraction of energy invested in ordered rotation [Sales et al., 2012]. Finally, H i total intensity maps of all galaxies surviving these cuts were generated and visually inspected in order to further remove a small number of galaxies that have experienced a recent merger. The final galaxy sample is of size 187. We treat this sample as being representative of nearby spiral galaxies that are gas-rich, star-forming, and that have well-defined disks dominated by rotation. Distributions of the stellar masses, H i masses and baryonic masses for the galaxies are shown in Figure 1.
2.3 Method
Given a simulated galaxy consisting of particles, is calculated as
| (1) |
where and are the position and velocity vectors of particle , and are the position and velocity vectors of the centre of mass (of all the particles), and is the mass of particle . This calculation is carried out for each of a galaxy’s stellar, H i and baryonic mass components. In order to ensure an accurate calculation of a galaxy’s H i angular momentum content, we considered only the fraction of each gas particle’s mass that corresponds to neutral atomic hydrogen.
In order to make our results more directly comparable to empirical results in the literature, we consider only the particles that are within a radius of their centre of mass, where is the radius at which the H i mass surface density of a galaxy drops to 1 M⊙ pc-2. This is the radius typically used by observers to mark the H i edge of a galaxy. We did also carry out all analyses using radius limits of 2 and 3 and found there to be no significant changes in our main results.
3 Results
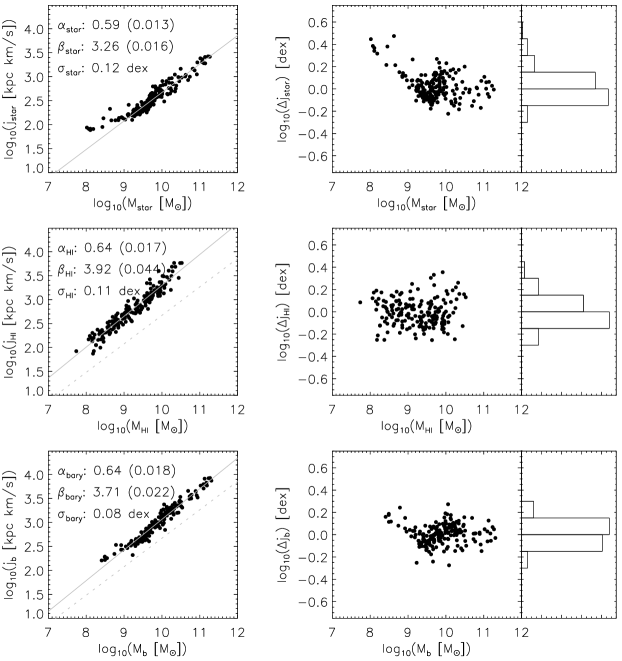
Figure 2 shows in its left column as a function of , with both quantities measured at radius for the stellar, H i and baryonic mass components of the Simba galaxies. All measurements have been made using Equation 1. For each – relation, we carried out a least-squares fit to as a function of :
| (2) |
This is equivalent to a power-law dependence (). In order to generate uncertainty measures for and , we carried out 100 fits to each – relation, each time using a 50% random subset of the data. The uncertainties we quote are the differences between the 90-th and 10-th percentiles of the resulting parameter sets. Each panel in the right column of Figure 2 shows the distribution of the vertical distances between the data points and the best-fit model. The parameters and statistics for the various – relations are collected in Table 1.
| Mass component | |||
|---|---|---|---|
| stars | 0.08 | ||
| H i | 0.11 | ||
| baryons | 0.08 |
The – relations we measure for the Simba galaxies are all clearly linear (in log-log space) with small amounts of scatter. The H i relation is consistent with a single, unbroken power law that describes both dwarf and more massive galaxies. The same is true for the stellar and baryonic relations for masses M⊙. Below this mass limit there is a clear upturn in both of the relations. This is likely due to the fact that in the Simba simulations, galaxies with M⊙ do not experience any black hole feedback. When black hole feedback does turn on at M⊙, it stalls growth, which causes a pile up of galaxies below this mass threshold. Our power-law fits to the stellar and baryonic relations consider only those galaxies above M⊙. We discuss the relations in further detail in the next section.
4 Discussion
In this section, we discuss our parameterised Simba – relations and compare them to empirical results from the literature.
Traditionally, the stellar relation has drawn the most attention. The parameters of and measured for our – relation compare favourably with a variety of results from the literature, some of which we list here. Romanowsky and Fall [2012] used approximations for the specific angular momentum content of spiral and elliptical galaxies to place nearby bright galaxies on a – diagram. For their entire sub-sample of spirals, they measured and with a residual rms scatter of 0.20 dex. They found similar trends for the bulge and disk subcomponents of their spiral galaxies. Cortese et al. [2016] used homogenous resolved velocity maps for a large sample of galaxies to show that at fixed stellar mass, disk-dominated systems have higher specific angular momentum than bulge-dominated galaxies. For their full sample, their power-law index is measured to be . Posti et al. [2018] accurately determined the empirical – relation for 92 nearby galaxies spanning morphologies from S0 to Irr and the stellar mass range . Over this entire mass range, they found the relation to be well-described by a single power-law with index and with intercept and . Mancera Piña et al. [2021a] used a larger sample of nearby galaxies (from a variety of surveys) to generate an almost identical result: .
While the stellar – relation was first studied as far back as 1983, the gas and baryonic relations have received attention much more recently. The pioneering study of Obreschkow and Glazebrook [2014] offered high-precision measurements of the specific angular momenta contained in the baryonic components of 16 nearby spiral galaxies from the THINGS sample. They found , and (bulge fraction) to be strongly and irreducibly correlated. Late-type galaxies were shown to scatter around a mean relation while any subsample of fixed followed a relation . Mancera Piña et al. [2021a] also studied the baryonic – relation, finding it to be well-modelled by a single power-law with slope over a large mass range that includes dwarf galaxies. Other authors had suggested that dwarf galaxies have higher-than-expected fractions of baryonic specific angular momentum, and invoked scenarios involving feedback processes and cold gas accretion to explain their findings. However, results such as ours and those of Mancera Piña et al. [2021a] - results that indicate the existence of a single power-law that well-describes the full mass range of galaxies - suggest that feedback and accretion processes work in similar ways for most galaxies.
Several studies have focused on the gaseous – relation in recent years. Butler et al. [2017] extended the efforts of Obreschkow and Glazebrook [2014] to 14 low-mass, gas-rich galaxies from the LITTLE THINGS sample. They found the specific angular momentum of H i to be about 2.5 times higher than that of the stars. Mancera Piña et al. [2021a] again found an unbroken power-law for the – relation based on their galaxy sample, yet one with a higher slope of . They again emphasise the fact that dwarfs seems to obey the same relation as high-mass galaxies. In this work, we do not find the H i – relation to have a slope that is higher than those of the stellar and baryonic relations. Rather, we find the slopes of the H i and the baryonic – relations in Simba to be essentially identical, and very close to 2/3. The zero-point of our H i – relation is a factor higher than that of the stellar relation, which is similar, yet more extreme, than the finding of Butler et al. [2017].
In this study, we have not considered the dark matter – relation of the Simba galaxies. Theoretical arguments are often used to show for dark matter haloes (e.g., see Obreschkow and Glazebrook 2014). However, our finding that the stellar, H i and baryonic – relations for the Simba galaxies have power-law indices close to 2/3 do not necessarily imply the same value for dark matter haloes. Some authors (e.g., Liao et al. 2017) have shown to be the case for particular numerical simulations, yet further investigation is needed.
5 Residuals
Several authors have investigated the possibility that the scatter in the – relation varies systematically with other galaxy parameters. Fall [1983] suggested that the Hubble sequence may be related to the systematic variation in at a fixed . Using a larger sample of galaxies spanning a broader morphology range, Romanowsky and Fall [2012] showed that the scatter correlates with morphology across the Hubble sequence. The high-precision measurements of Obreschkow and Glazebrook [2014] showed bulge mass fraction to be strongly correlated with specific baryon angular momentum and mass. Cortese et al. [2016] confirmed these findings for a larger sample, showing both visual morphology and Sersic index within one effective radius to contribute to – scatter. Posti et al. [2018] showed that the stellar – relation becomes tighter when considering only the disc components of spiral galaxies (i.e. by removing the bulge contribution to the light profile). The result, they say, possibly indicates a simpler link to dark matter haloes of discs compared to bulges. Mancera Piña et al. [2021a] found internal correlations inside their various – relations, showing disc scale length and gas richness to be significant drivers of scatter. Mancera Piña et al. [2021b] demonstrated tight correlations between , and the cold gas fraction of the interstellar medium. An important implication of these findings is that, statistically, important galaxy properties such as morphology (or other structural parameters) can be predicted once the mass and specific angular momentum of the galaxy are known.
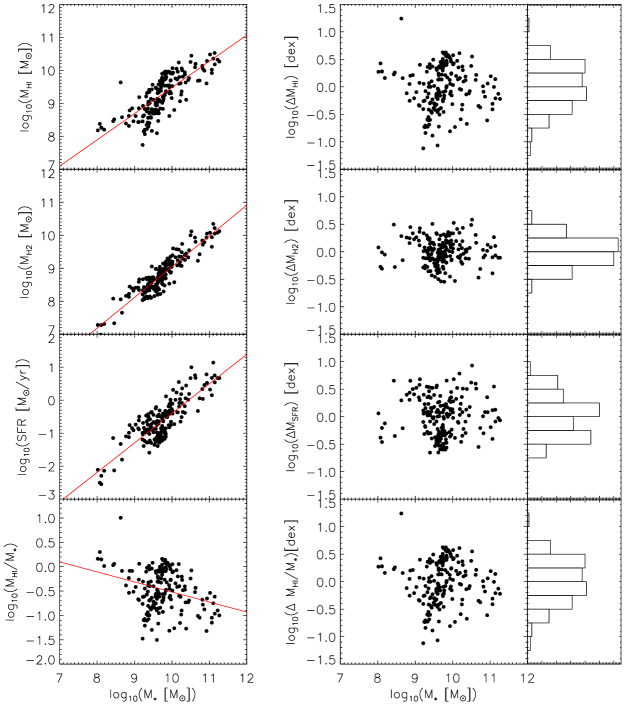
In this section, we search for evidence of links between – scatter and various galaxy properties. Figure 3 shows in its left column several important galaxy scaling relations that are produced by Simba: H i mass (), H2 mass (), star formation rate (SFR) and H i mass fraction ( ) as functions of for the 187 galaxies in our sample. A strong power-law dependence on exists for all of the galaxy properties222Note that these relations are not generally true when considering all Simba galaxies (e.g., Davé et al. 2020), but only for the sample of star-forming disks we have selected.. To each set of points we fit a straight line (in – space) to parameterise the mean trend. The panels in the middle column of Figure 3 show the residuals calculated by subtracting each set of points from its best-fitting line, as a function of stellar mass. The panels in the last column of Figure 3 show the 1-dimensional distributions of the residuals. The outlying galaxy seen in the top and bottom rows of Figure 3 is the only one in our sample that has not undergone any significant merger activity. This could explain its very high H i mass.
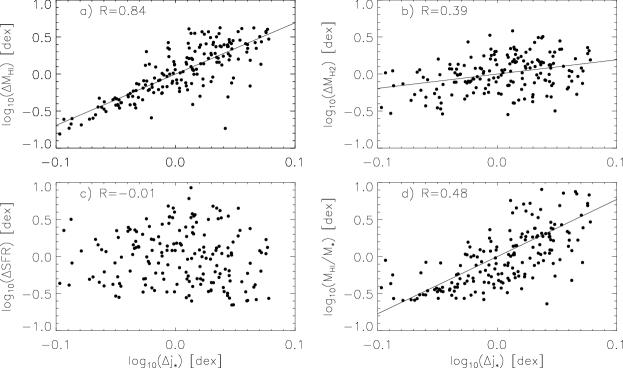
In Figure 4 we compare the residuals from the – relation to the residuals from the scaling relations shown in the left column of Figure 3. This allows us to check whether the – scatter is correlated with the deviations of galaxies from these important scaling relations. The results shown in panel (a) of Figure 4 clearly indicate that for a given stellar mass, a galaxy’s scatter about the – relation is highly correlated with its deviation from the mean – relation. H i content is a strong driver of residual. For a given , galaxies that have more/less-than-average H i mass also have more/less-than-average specific stellar angular momentum. The straight line shown in panel (a) is a fit to the data, it has slope . Thus, a galaxy’s deviation of 0.1 dex from the mean – typically corresponds to a dex departure from the mean – relation. Panel (b) shows there is a comparatively weak relation between a galaxy’s scatter and its H2 content. Panel (c) suggests there is no dependence of a galaxy’s residual on its deviation from the mean SFR– relation. Finally, panel (d) shows H i mass fraction () to also be strongly linked to a galaxies content, albeit to a lesser extent than H i mass.
The fact that – scatter is linked most strongly to H i content and H i mass fraction is consistent with the results of Obreschkow et al. [2016]. Their parameter-free model suggests the neutral atomic mass fractions of disc galaxies to be linearly related to their specific angular momentum content. Galaxies with higher angular momentum content are expected to retain a higher fraction of their neutral atomic has (which is dominated by H i), hence appearing to have an H i excess relative to galaxies with lower specific angular momentum content. The filamentary nature of gas accretion could be linked to a galaxy’s content. So-called “cold flows” (e.g., Kereš et al. 2005, Dekel et al. 2009) are able to transfer gas from the virial radius of a dark matter halo directly to its inner region containing the dominant galaxy. Gas accreted via this cold mode tends to have higher specific angular momentum than the dark matter halo, some of which is deposited into the central dominant galaxy. Related to this accretion scenario is the manner in which stellar disks are thought to grow from inside-out. Peebles [1969] suggested that when gas disks acquire angular momentum from gravitational torques, is it the low angular momentum gas that most quickly settles and forms stars at inner radii. Simulations of disk formation (e.g., Mo et al. 1998, Somerville et al. 2008) have shown that galaxies must grow from the inside out in order to reproduce various observed scaling relations. These types of angular momentum acquisition scenarios could be responsible for our observation that for a given stellar mass, Simba galaxies with higher content are those with higher content.
6 Summary
In this work, we have measured the – relations for the stellar, H i and baryonic mass components for a set of 187 galaxies from the Simba cosmological hydrodynamical simulations. We compare the measured relations to existing empirical results, and search for systematic trends of residuals in the – relation with galaxy properties such as H i mass, mass, star formation rate and H i mass fraction.
For all mass components, we find the specific angular momenta of galaxies to be related via a power law to their masses. Our measured relations exhibit very little scatter and hold over several orders of magnitude in mass. The stellar - relation has a power-law index , agreeing broadly with the empirical values found in several observational studies, yet with much less scatter, suggesting that measurement uncertainties (related to sample biases and assumptions behind the measurements) are the dominant source of scatter in the observations.
We compare the residuals of galaxies in the – relation to those from other important galaxy scaling relations. There exists a strong dependence on the H i content of a galaxy. It is the excess or deficiency of a galaxy’s H i mass that is clearly linked to its deviation from the mean – relation. For a given , galaxies that have more/less-than-average H i also have more/less-than-average stellar specific angular momentum. We interpret this as being linked to the H i build-up histories of galaxies, specifically by means of cold mode accretion.
Our finding that the Simba simulations produce tight – relations that are consistent with empirical results, as well as other important scaling relations that other authors have reported Simba to reproduce, further suggest that Simba will serve as a reliable platform for contextualising the results from ongoing and forthcoming large galaxy surveys carried out with instruments such as MeerKAT, ASKAP and eventually the SKA.
7 Acknowledgements
We are sincerely grateful to the anonymous referee for providing very useful and constructive comments that improved the quality of this study. We thank Robert Thompson for developing Caesar, and the yt team for development and support of yt. EE acknowledges that this research is supported by the South African Radio Astronomy Observatory, which is a facility of the National Research Foundation, an agency of the Department of Science and Technology. This work is based on the research project supported wholly/in part by the National Research Foundation of South Africa (grant number 115238). RD acknowledges support from the Wolfson Research Merit Award program of the U.K. Royal Society. MG acknowledges support from the Inter-University Institute for Data Intensive Astronomy (IDIA), and by the Australian Government through the Australian Research Council’s Discovery Projects funding scheme (DP210102103).
The computing equipment to run Simba was funded by BEIS capital funding via STFC capital grants ST/P002293/1, ST/R002371/1 and ST/S002502/1, Durham University and STFC operations grant ST/R000832/1. DiRAC is part of the National e-Infrastructure. We acknowledge the use of computing facilities of IDIA for part of this work. IDIA is a partnership of the Universities of Cape Town, of the Western Cape and of Pretoria. We acknowledge the use of the ilifu cloud computing facility — www.ilifu.ac.za, a partnership between the University of Cape Town, the University of the Western Cape, the University of Stellenbosch, Sol Plaatje University, the Cape Peninsula University of Technology and the South African Radio Astronomy Observatory.
References
- Butler et al. [2017] Butler, K.M., Obreschkow, D., Oh, S.H., 2017. Angular Momentum of Dwarf Galaxies. APJL 834, L4. doi:10.3847/2041-8213/834/1/L4, arXiv:1612.03752.
- Catinella et al. [2018] Catinella, B., Saintonge, A., Janowiecki, S., Cortese, L., Davé, R., Lemonias, J.J., Cooper, A.P., Schiminovich, D., Hummels, C.B., Fabello, S., Geréb, K., Kilborn, V., Wang, J., 2018. xGASS: total cold gas scaling relations and molecular-to-atomic gas ratios of galaxies in the local Universe. mnras 476, 875--895. doi:10.1093/mnras/sty089, arXiv:1802.02373.
- Chabrier [2003] Chabrier, G., 2003. Galactic Stellar and Substellar Initial Mass Function. PASP 115, 763--795. doi:10.1086/376392, arXiv:astro-ph/0304382.
- Cortese et al. [2016] Cortese, L., Fogarty, L.M.R., Bekki, K., van de Sande, J., Couch, W., 2016. The SAMI Galaxy Survey: the link between angular momentum and optical morphology. mnras 463, 170--184. doi:10.1093/mnras/stw1891, arXiv:1608.00291.
- Croom et al. [2012] Croom, S.M., Lawrence, J.S., Bland-Hawthorn, J., Bryant, J.J., Fogarty, L., Richards, S., Goodwin, M., Farrell, T., Miziarski, S., Heald, R., Jones, D.H., Lee, S., Colless, M., Brough, S., Hopkins, A.M., Bauer, A.E., Birchall, M.N., Ellis, S., Horton, A., Leon-Saval, S., Lewis, G., López-Sánchez, Á.R., Min, S.S., Trinh, C., Trowland, H., 2012. The Sydney-AAO Multi-object Integral field spectrograph. mnras 421, 872--893. doi:10.1111/j.1365-2966.2011.20365.x, arXiv:1112.3367.
- Davé et al. [2019] Davé, R., Anglés-Alcázar, D., Narayanan, D., Li, Q., Rafieferantsoa, M.H., Appleby, S., 2019. SIMBA: Cosmological simulations with black hole growth and feedback. MNRAS 486, 2827--2849. doi:10.1093/mnras/stz937, arXiv:1901.10203.
- Davé et al. [2020] Davé, R., Crain, R.A., Stevens, A.R.H., Narayanan, D., Saintonge, A., Catinella, B., Cortese, L., 2020. Galaxy cold gas contents in modern cosmological hydrodynamic simulations. MNRAS 497, 146--166. doi:10.1093/mnras/staa1894, arXiv:2002.07226.
- Dekel et al. [2009] Dekel, A., Birnboim, Y., Engel, G., Freundlich, J., Goerdt, T., Mumcuoglu, M., Neistein, E., Pichon, C., Teyssier, R., Zinger, E., 2009. Cold streams in early massive hot haloes as the main mode of galaxy formation. NAT 457, 451--454. doi:10.1038/nature07648, arXiv:0808.0553.
- El-Badry et al. [2018] El-Badry, K., Quataert, E., Wetzel, A., Hopkins, P.F., Weisz, D.R., Chan, T.K., Fitts, A., Boylan-Kolchin, M., Kereš, D., Faucher-Giguère, C.A., Garrison-Kimmel, S., 2018. Gas kinematics, morphology and angular momentum in the FIRE simulations. mnras 473, 1930--1955. doi:10.1093/mnras/stx2482, arXiv:1705.10321.
- Fall [1983] Fall, S.M., 1983. Galaxy formation - Some comparisons between theory and observation, in: Internal Kinematics and Dynamics of Galaxies, pp. 391--398.
- Genel et al. [2015] Genel, S., Fall, S.M., Hernquist, L., Vogelsberger, M., Snyder, G.F., Rodriguez-Gomez, V., Sijacki, D., Springel, V., 2015. Galactic Angular Momentum in the Illustris Simulation: Feedback and the Hubble Sequence. apjl 804, L40. doi:10.1088/2041-8205/804/2/L40, arXiv:1503.01117.
- Gillman et al. [2019] Gillman, S., Swinbank, A.M., Tiley, A.L., Harrison, C.M., Smail, I., Dudzevičiūtė, U., Sharples, R.M., Best, P.N., Bower, R.G., Cochrane, R., Fisher, D., Geach, J.E., Glazebrook, K., Ibar, E., Molina, J., Obreschkow, D., Schaller, M., Sobral, D., Sweet, S., Trayford, J.W., Theuns, T., 2019. The dynamics and distribution of angular momentum in HiZELS star-forming galaxies at z = 0.8-3.3. mnras 486, 175--194. doi:10.1093/mnras/stz765, arXiv:1903.05148.
- Glowacki et al. [2020] Glowacki, M., Elson, E., Davé, R., 2020. The baryonic Tully-Fisher relation in the SIMBA simulation. MNRAS 498, 3687--3702. doi:10.1093/mnras/staa2616, arXiv:2003.03402.
- Glowacki et al. [2021] Glowacki, M., Elson, E., Davé, R., 2021. The redshift evolution of the baryonic Tully-Fisher relation in SIMBA. MNRAS 507, 3267--3284. doi:10.1093/mnras/stab2279, arXiv:2011.08866.
- Hardwick et al. [2022] Hardwick, J.A., Cortese, L., Obreschkow, D., Catinella, B., Cook, R.H.W., 2022. xGASS: characterizing the slope and scatter of the stellar mass-angular momentum relation for nearby galaxies. mnras 509, 3751--3763. doi:10.1093/mnras/stab3261, arXiv:2111.15048.
- Hopkins et al. [2014] Hopkins, P.F., Kereš, D., Oñorbe, J., Faucher-Giguère, C.A., Quataert, E., Murray, N., Bullock, J.S., 2014. Galaxies on FIRE (Feedback In Realistic Environments): stellar feedback explains cosmologically inefficient star formation. mnras 445, 581--603. doi:10.1093/mnras/stu1738, arXiv:1311.2073.
- Kereš et al. [2005] Kereš, D., Katz, N., Weinberg, D.H., Davé, R., 2005. How do galaxies get their gas? MNRAS 363, 2--28. doi:10.1111/j.1365-2966.2005.09451.x, arXiv:astro-ph/0407095.
- Lagos et al. [2017] Lagos, C.d.P., Theuns, T., Stevens, A.R.H., Cortese, L., Padilla, N.D., Davis, T.A., Contreras, S., Croton, D., 2017. Angular momentum evolution of galaxies in EAGLE. MNRAS 464, 3850--3870. doi:10.1093/mnras/stw2610, arXiv:1609.01739.
- Lelli et al. [2016] Lelli, F., McGaugh, S.S., Schombert, J.M., 2016. SPARC: Mass Models for 175 Disk Galaxies with Spitzer Photometry and Accurate Rotation Curves. aj 152, 157. doi:10.3847/0004-6256/152/6/157, arXiv:1606.09251.
- Liao et al. [2017] Liao, S., Chen, J., Chu, M.C., 2017. A Universal Angular Momentum Profile for Dark Matter Halos. apj 844, 86. doi:10.3847/1538-4357/aa79fb, arXiv:1612.00117.
- Mancera Piña et al. [2021a] Mancera Piña, P.E., Posti, L., Fraternali, F., Adams, E.A.K., Oosterloo, T., 2021a. The baryonic specific angular momentum of disc galaxies. AAP 647, A76. doi:10.1051/0004-6361/202039340, arXiv:2009.06645.
- Mancera Piña et al. [2021b] Mancera Piña, P.E., Posti, L., Pezzulli, G., Fraternali, F., Fall, S.M., Oosterloo, T., Adams, E.A.K., 2021b. A tight angular-momentum plane for disc galaxies. AAP 651, L15. doi:10.1051/0004-6361/202141574, arXiv:2107.02809.
- Mo et al. [1998] Mo, H.J., Mao, S., White, S.D.M., 1998. The formation of galactic discs. mnras 295, 319--336. doi:10.1046/j.1365-8711.1998.01227.x, arXiv:astro-ph/9707093.
- Obreja et al. [2016] Obreja, A., Stinson, G.S., Dutton, A.A., Macciò, A.V., Wang, L., Kang, X., 2016. NIHAO VI. The hidden discs of simulated galaxies. mnras 459, 467--486. doi:10.1093/mnras/stw690, arXiv:1603.01703.
- Obreschkow and Glazebrook [2014] Obreschkow, D., Glazebrook, K., 2014. Fundamental Mass-Spin-Morphology Relation Of Spiral Galaxies. APJ 784, 26. doi:10.1088/0004-637X/784/1/26, arXiv:1312.4543.
- Obreschkow et al. [2016] Obreschkow, D., Glazebrook, K., Kilborn, V., Lutz, K., 2016. Angular Momentum Regulates Atomic Gas Fractions of Galactic Disks. APJL 824, L26. doi:10.3847/2041-8205/824/2/L26, arXiv:1605.04927.
- Peebles [1969] Peebles, P.J.E., 1969. Origin of the Angular Momentum of Galaxies. APJ 155, 393. doi:10.1086/149876.
- Posti et al. [2018] Posti, L., Fraternali, F., Di Teodoro, E.M., Pezzulli, G., 2018. The angular momentum-mass relation: a fundamental law from dwarf irregulars to massive spirals. AAP 612, L6. doi:10.1051/0004-6361/201833091, arXiv:1804.04663.
- Romanowsky and Fall [2012] Romanowsky, A.J., Fall, S.M., 2012. Angular Momentum and Galaxy Formation Revisited. APJS 203, 17. doi:10.1088/0067-0049/203/2/17, arXiv:1207.4189.
- Sales et al. [2012] Sales, L.V., Navarro, J.F., Theuns, T., Schaye, J., White, S.D.M., Frenk, C.S., Crain, R.A., Dalla Vecchia, C., 2012. The origin of discs and spheroids in simulated galaxies. MNRAS 423, 1544--1555. doi:10.1111/j.1365-2966.2012.20975.x, arXiv:1112.2220.
- Schaye et al. [2015] Schaye, J., Crain, R.A., Bower, R.G., Furlong, M., Schaller, M., Theuns, T., Dalla Vecchia, C., Frenk, C.S., McCarthy, I.G., Helly, J.C., Jenkins, A., Rosas-Guevara, Y.M., White, S.D.M., Baes, M., Booth, C.M., Camps, P., Navarro, J.F., Qu, Y., Rahmati, A., Sawala, T., Thomas, P.A., Trayford, J., 2015. The EAGLE project: simulating the evolution and assembly of galaxies and their environments. mnras 446, 521--554. doi:10.1093/mnras/stu2058, arXiv:1407.7040.
- Schmidt [1959] Schmidt, M., 1959. The Rate of Star Formation. APJ 129, 243. doi:10.1086/146614.
- Sijacki et al. [2015] Sijacki, D., Vogelsberger, M., Genel, S., Springel, V., Torrey, P., Snyder, G.F., Nelson, D., Hernquist, L., 2015. The Illustris simulation: the evolving population of black holes across cosmic time. mnras 452, 575--596. doi:10.1093/mnras/stv1340, arXiv:1408.6842.
- Somerville et al. [2008] Somerville, R.S., Barden, M., Rix, H.W., Bell, E.F., Beckwith, S.V.W., Borch, A., Caldwell, J.A.R., Häußler, B., Heymans, C., Jahnke, K., Jogee, S., McIntosh, D.H., Meisenheimer, K., Peng, C.Y., Sánchez, S.F., Wisotzki, L., Wolf, C., 2008. An Explanation for the Observed Weak Size Evolution of Disk Galaxies. apj 672, 776--786. doi:10.1086/523661, arXiv:astro-ph/0612428.
- Stevens et al. [2016] Stevens, A.R.H., Croton, D.J., Mutch, S.J., 2016. Building disc structure and galaxy properties through angular momentum: the DARK SAGE semi-analytic model. mnras 461, 859--876. doi:10.1093/mnras/stw1332, arXiv:1605.00647.
- Stevens et al. [2018] Stevens, A.R.H., Lagos, C.d.P., Obreschkow, D., Sinha, M., 2018. Connecting and dissecting galaxies’ angular momenta and neutral gas in a hierarchical universe: cue DARK SAGE. MNRAS 481, 5543--5559. doi:10.1093/mnras/sty2650, arXiv:1806.07402.
- Teklu et al. [2015] Teklu, A.F., Remus, R.S., Dolag, K., Beck, A.M., Burkert, A., Schmidt, A.S., Schulze, F., Steinborn, L.K., 2015. Connecting Angular Momentum and Galactic Dynamics: The Complex Interplay between Spin, Mass, and Morphology. apj 812, 29. doi:10.1088/0004-637X/812/1/29, arXiv:1503.03501.
- Walter et al. [2008] Walter, F., Brinks, E., de Blok, W.J.G., Bigiel, F., Kennicutt, Robert C., J., Thornley, M.D., Leroy, A., 2008. THINGS: The H I Nearby Galaxy Survey. aj 136, 2563--2647. doi:10.1088/0004-6256/136/6/2563, arXiv:0810.2125.
- Wang et al. [2015] Wang, L., Dutton, A.A., Stinson, G.S., Macciò, A.V., Penzo, C., Kang, X., Keller, B.W., Wadsley, J., 2015. NIHAO project - I. Reproducing the inefficiency of galaxy formation across cosmic time with a large sample of cosmological hydrodynamical simulations. mnras 454, 83--94. doi:10.1093/mnras/stv1937, arXiv:1503.04818.
- Zoldan et al. [2018] Zoldan, A., De Lucia, G., Xie, L., Fontanot, F., Hirschmann, M., 2018. Structural and dynamical properties of galaxies in a hierarchical Universe: sizes and specific angular momenta. MNRAS 481, 1376--1400. doi:10.1093/mnras/sty2343, arXiv:1803.08056.