Graphene-Induced Energy Transfer for Quantitative Membrane Biophysics at Sub-Nanometer Accuracy
Abstract
Graphene-induced energy transfer (GIET) is a recently developed fluorescence-spectroscopic technique that achieves sub-nanometric optical localization of fluorophores along the optical axis of a microscope. GIET is based on the near-field energy transfer from an optically excited fluorescent molecule to a single sheet of graphene. It has been successfully used for estimating inter-leaflet distances of single lipid bilayers, and for investigating the membrane organization of living mitochondria. In this study, we use GIET to measure the cholesterol-induced subtle changes of membrane thickness at the nanoscale. We quantify membrane thickness variations in supported lipid bilayers (SLBs) as a function of lipid composition and increasing cholesterol content. Our findings demonstrate that GIET is an extremely sensitive tool for investigating nanometric structural changes in bio-membranes.
GAU]Third Institute of Physics – Biophysics, Georg August University, Friedrich-Hund-Platz 1, 37077 Göttingen, Germany
GAU]Third Institute of Physics – Biophysics, Georg August University, Friedrich-Hund-Platz 1, 37077 Göttingen, Germany
GAU]Third Institute of Physics – Biophysics, Georg August University, Friedrich-Hund-Platz 1, 37077 Göttingen, Germany
\alsoaffiliationCluster of Excellence “Multiscale Bioimaging: from Molecular Machines to Networks of Excitable Cells” (MBExC), University of Göttingen, Germany
{tocentry}
![[Uncaptioned image]](/html/2211.03517/assets/GIETCholesterolMembraneTOC.png)
Lipid membranes are one of the fundamental building blocks of cells and form the division between a cell’s interior and its environment and between different sub-cellular compartments (mitochondria, nucleus, endoplasmic reticulum etc.). They are composed of lipid bilayers which are decorated with transmembrane and peripheral proteins that are involved in a myriad of different processes and functions (sensing and signal transduction, ion and nutrient transport, endo- and exocytosis etc.). The lipid bilayers themselves are made of amphipathic phospholipid molecules. Among them, cholesterol (Chol) is most abundant (30 ) and plays a crucial role in defining a membrane’s architecture and dynamics 1, 2, 3. Previous studies have shown that Chol increases lipid ordering in membranes, thus decreasing the area per lipid molecule and increasing the overall thickness of the membrane 4, 5, 6, 7, which has direct impact on membrane function 8, 9, 10, 11. For measuring subtle changes in membrane structure and thickness, different experimental methods have been used such as small-angle x-ray scattering (SAXS) 12 or small-angle neutron scattering (SANS) 13. These experimental studies are complemented by all-atom and coarse-grained molecular dynamics simulations 5, 14, 15, 8 for providing insight into the structural organization of lipid bilayers with Ångstrom resolution. Complementary, fluorescence spectroscopy has been widely used to study membrane dynamics (lipid lateral diffusivity, local membrane viscosity) 16, but it is not easy to see with structural variations on the length scale of membrane thickness (5 nm). For that purpose, one has to use Förster resonance energy transfer (FRET) spectroscopy, 17 which requires labeling with two different fluorescent probes, but even then, measuring membrane thickness values with Ångstrom resolution remains challenging. One reason is the difficulty of making FRET measurement of length values quantitatively accurate by taking into account all the complexity of a FRET experiment such as possible direct excitation of acceptor, bleed through of emission from donor, relative sensitivity of detection at different wavelengths, and in particular the usually unknown relative orientation of donor and acceptor molecules with respect to each other and the studied system.
An alternative for measuring distances along one direction with Ångstrom resolution is graphene-induced energy transfer (GIET) 18, 19 imaging/spectroscopy. This method is based on the strongly distance-dependent quenching of a fluorescent molecule by a single planar sheet of graphene. This leads to a strong modulation of a fluorophore’s intensity and fluorescence lifetime as a function of its distance from the graphene, with full quenching directly on the surface of the graphene and nearly full recovery of bulk fluorescence properties at around 25 nm away from the graphene. Thus, over a range of ca. 25 nm, one can use the graphene-induced quenching for measuring a distance of a fluorophore to the graphene with extreme accuracy by simply measuring its fluorescence lifetime and converting this value into a distance (see supporting info ’Working principle of GIET’ and Ref. 20). GIET was originally introduced as an advanced variant of the metal-induced energy transfer (MIET) 21, where one uses a metal film instead of graphene as the quenching material which covers a dynamic range of ca. 200 nm but with a correspondingly eight-fold reduced spatial resolution. The high spatial resolution of GIET makes it an ideal tool for resolving structural details in small systems such as protein complexes or lipid membranes within a size range of 5-20 nm. Previously, we have demonstrated the capabilities of GIET by measuring inter-leaflet distances in supported lipid bilayers (SLBs) 18 and by mapping the activity-dependent organization of mitochondrial membranes 22. In the current work, we use GIET for quantifying thickness variations in SLBs as a function of Chol content with sub-nanometer resolution, which is impossible to do with other fluorescence-spectroscopic techniques.
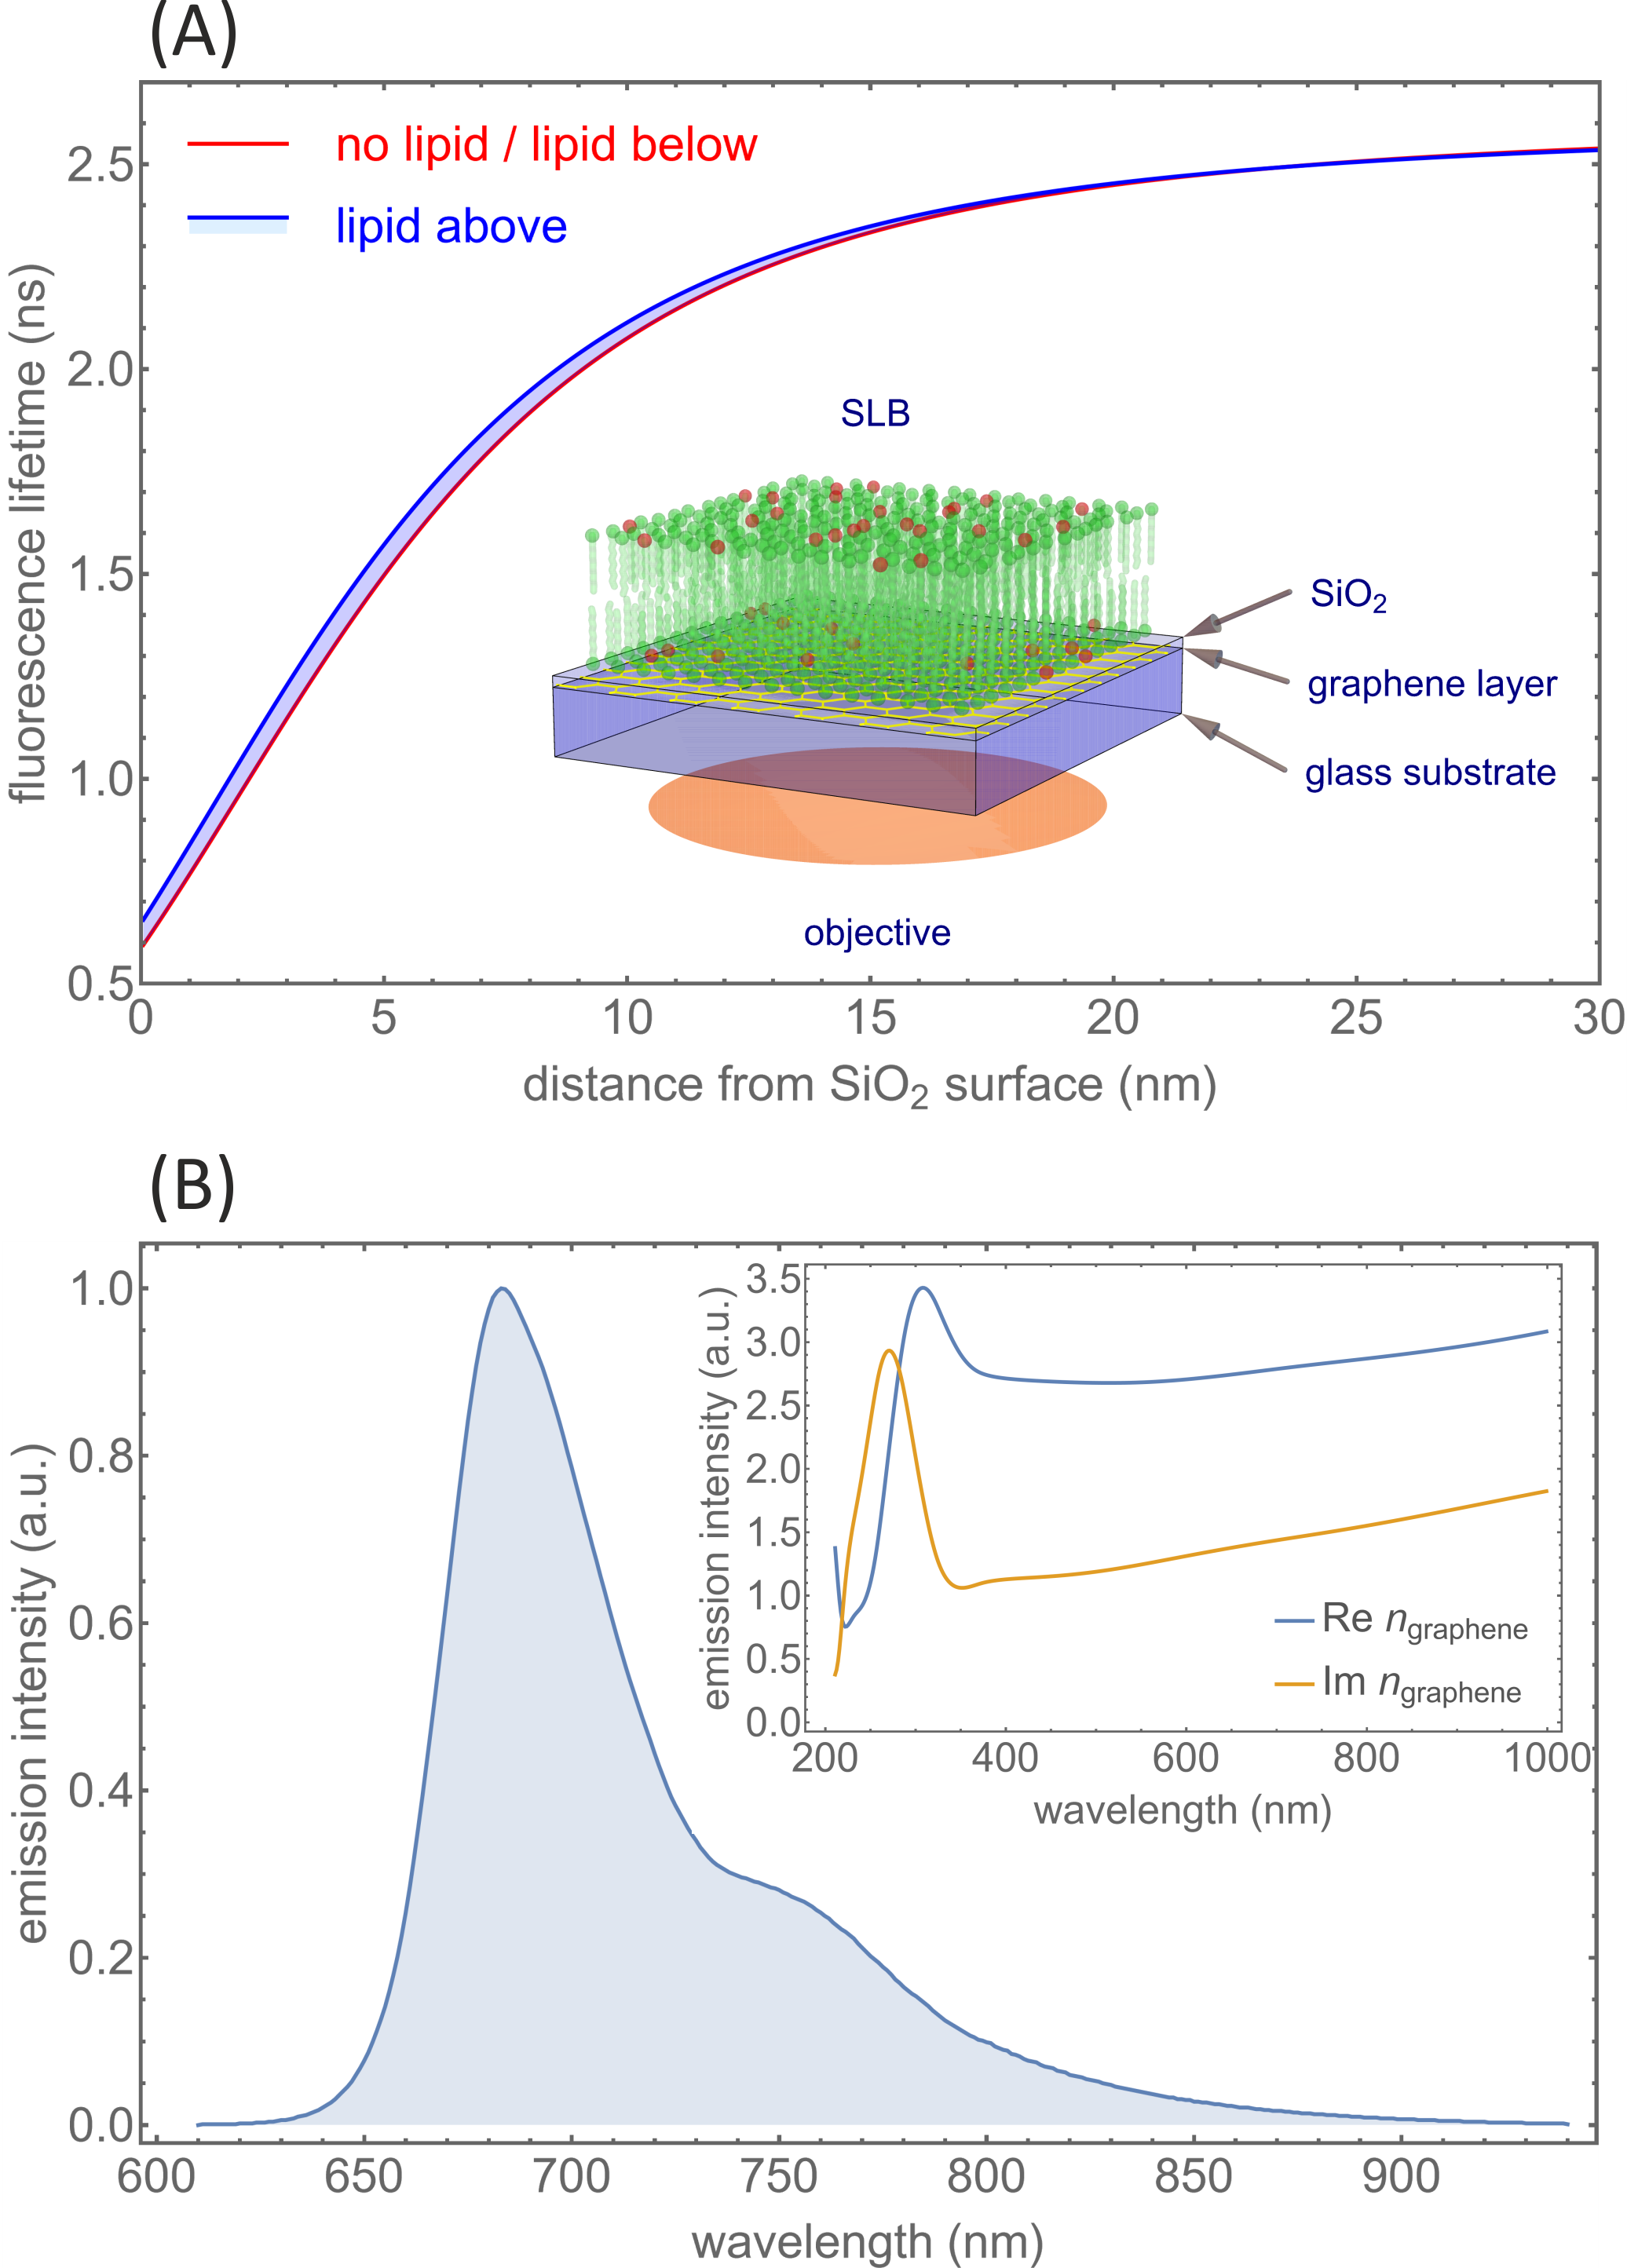
The core of GIET is the GIET calibration curve which represents the lifetime-versus-distance dependence, see Figure 1. It is calculated in a semi-classical electrodynamics framework by treating a fluorescent dye as an ideal oscillating electric dipole emitter, and then solving Maxwell’s equations in the presence of the GIET substrate/sample for such an emitter as the electromagnetic field source. The inset of Figure 1(A) presents a schematic of the GIET substrate with sample: From bottom to top, the GIET substrate consists of a single sheet of graphene deposited on top of a glass coverslip and then covered with a 10 nm thick quartz layer (SiO2) using chemical vapor deposition (see ’Substrate preparation’ in Supporting info). SLBs with few fluorescently labeled lipids (Atto655 head group labeling) are prepared using vesicle fusion (see supporting information ’sample preparation’). From the solution of Maxwell’s equations, one can then calculate the total emission power of the emitter which is assumed to be proportional to the radiative transition rate form the dye’s excited state to its ground state. Knowing also the fluorescence lifetime and quantum yield of the dye in free space (with no GIET substrate or sample) allows then to compute the final GIET calibration curve - for the details see section ’Working principle of GIET’ in Supporting Information. One additional detail that has to be taken into account is that fluorescent dyes have broad emission spectra, and that the dielectric properties of graphene (i.e. its complex-valued refractive index) are wavelength-dependent, which is taken into account by computing the emission rate as a function of wavelength and then averaging the result with the emission spectrum as weight function. Finally, the result depends also on the relative orientation of the dye with respect to the GIET substrate, so that this orientation has also to be known a priori and then used in he calculations. For the Atto655 dye used in the current study, we have determined all these parameters in separate measurements and found the values = 2.6 ns, = 0.36, and a fluorophore orientation parallel to the membrane surface.18 The emission spectrum of Atto655 and the graphene dispersion curve required for the calculations are shown in Figure 1(B). When calculating the GIET calibration curve, we took also into account the presence of the SLB with refractive index 1.46. This is shown by the blue shaded region in Figure 1(A) that is covered by GIET calibration curves for dyes in the presence of a SLB on top with varying thickness from 0 nm to 8 nm. Remarkably, the presence of a SLB does not affect the GIET calibration curve for dyes above the SLB - these curves are indistinguishable from the GIET calibration curve in the absence of a SLB, see red curve in Figure 1(A). The presence of the SLB can shift the GIET calibration curve for dyes below the SLB by up to 0.6 nm to the left with respect to the calibration curve for dyes above the SLB.
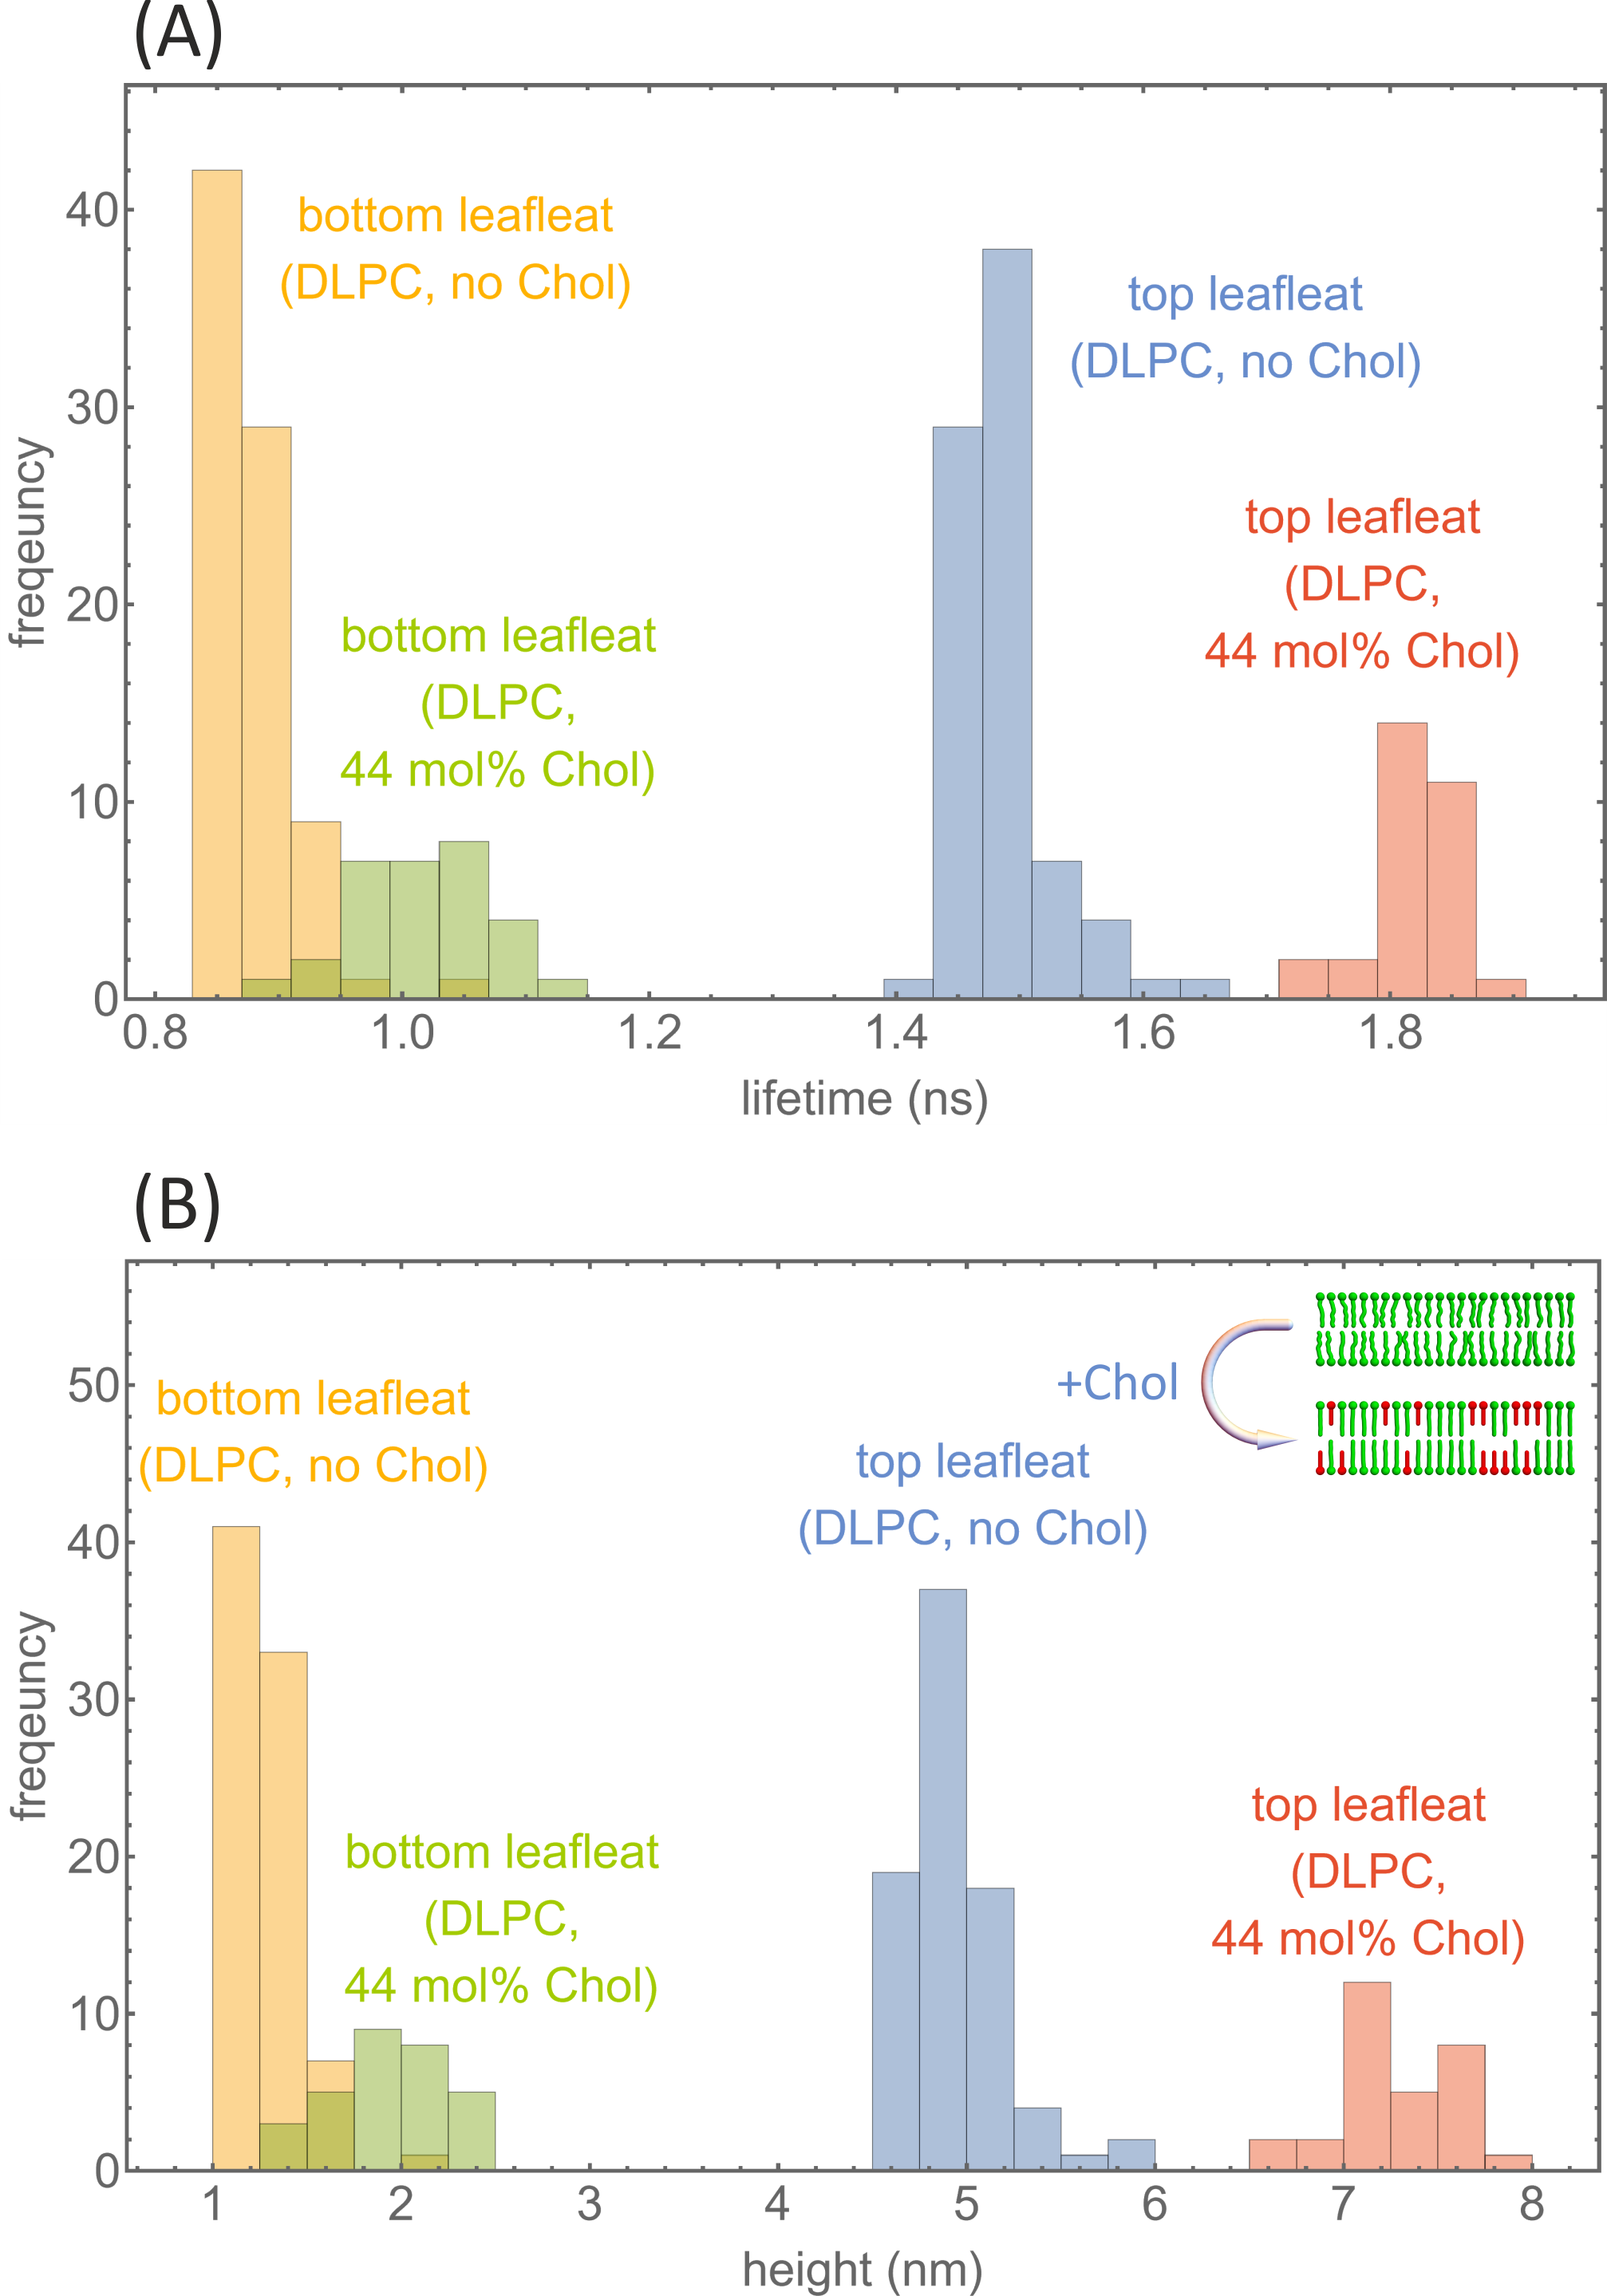
For determining values of bilayer thickness, fluorescence decay curves of fluorescently labeled SLBs on GIET substrates were recorded at 20∘C by scanning areas of 5 5 µm2 with a custom-built confocal microscope. We divided each measurement into bunches of 106 photons and fitted the corresponding TCSPC curves of each bunch with a bi-exponential decay curve to obtain distributions of the short and long fluorescence lifetime component, see an example in Figure 2(A) for a DLPC SLB (see below) with no and with 44 mol% Chol (see Supporting Information section ’Data evaluation’ the details of lifetime fitting). These lifetime values were then converted into distance values using the pre-calculated GIET calibration curves.
The long lifetime components , corresponding to the dyes labeling lipid head groups in the top leaflet, were converted into height values by using the ’no lipid/lipid below’ curve shown in Figure 1. However, for converting the short lifetime components , corresponding to dyes in the bottom leaflet, into height values , we had to use an iterative procedure. In that case, the GIET calibration curve that relates a measured lifetime to the height value depends on the SLB thickness itself, which is calculated as the difference between the height value of dyes above the SLB minus the height value of dyes below the SLB. The height value is already known from the conversion of the long lifetime component . Thus, is found by solving the implicit equation with . This is done by iteratively evaluating starting with and then updating the value of with any new value of . After 5 iterations, the results for and do not change anymore. The resulting height histograms for the lifetime data shown in Figure 2 are presented in Figure 2(B).
| bilayer thickness (nm) | ||||
|---|---|---|---|---|
| SLB | No Chol | 15 mol% Chol | 30 mol% Chol | 44 mol% Chol |
| DLPC (12:0) | 3.7 0.4 (15) | 4.9 0.1 (39) | 5.1 0.4 (18) | 5.4 0.4 (30) |
| DOPC (18:1) | 5.4 0.4 (29) | 6.3 0.5 (18) | 6.3 0.7 (17) | 5.6 0.4 (20) |
| DPhPC (16:0) | 4.3 0.4 (21) | 5.1 0.3 (16) | 6.4 0.5 (18) | 6 1 (15) |
For studying the dependence of SLB thickness on Chol concentration, we chose three different lipids for preparing SLBs. The first two SLBs were made with the saturated fatty acids 1,2-dilauroyl-sn-glycero-3-phosphocholine (12:0, DLPC) and 1,2-diphytanoyl-sn-glycero-3-phosphocholine (16:0, DPhPC), and the third SLB was prepared with the mono-unsaturated fatty acid 1,2-dioleoyl-sn-glycero-3-phosphocholine (18:1, DOPC). For all three SLBs, we performed measurements for increasing Chol content of 0, 15, 30, and 44 mol%. DPhPC consists of saturated branched chain hydrocarbons, and is mainly found in archaebacterial membranes. DPhPC is known to readily form bilayers 23 and has been used for preparing model membranes in previous studies 24, 25.
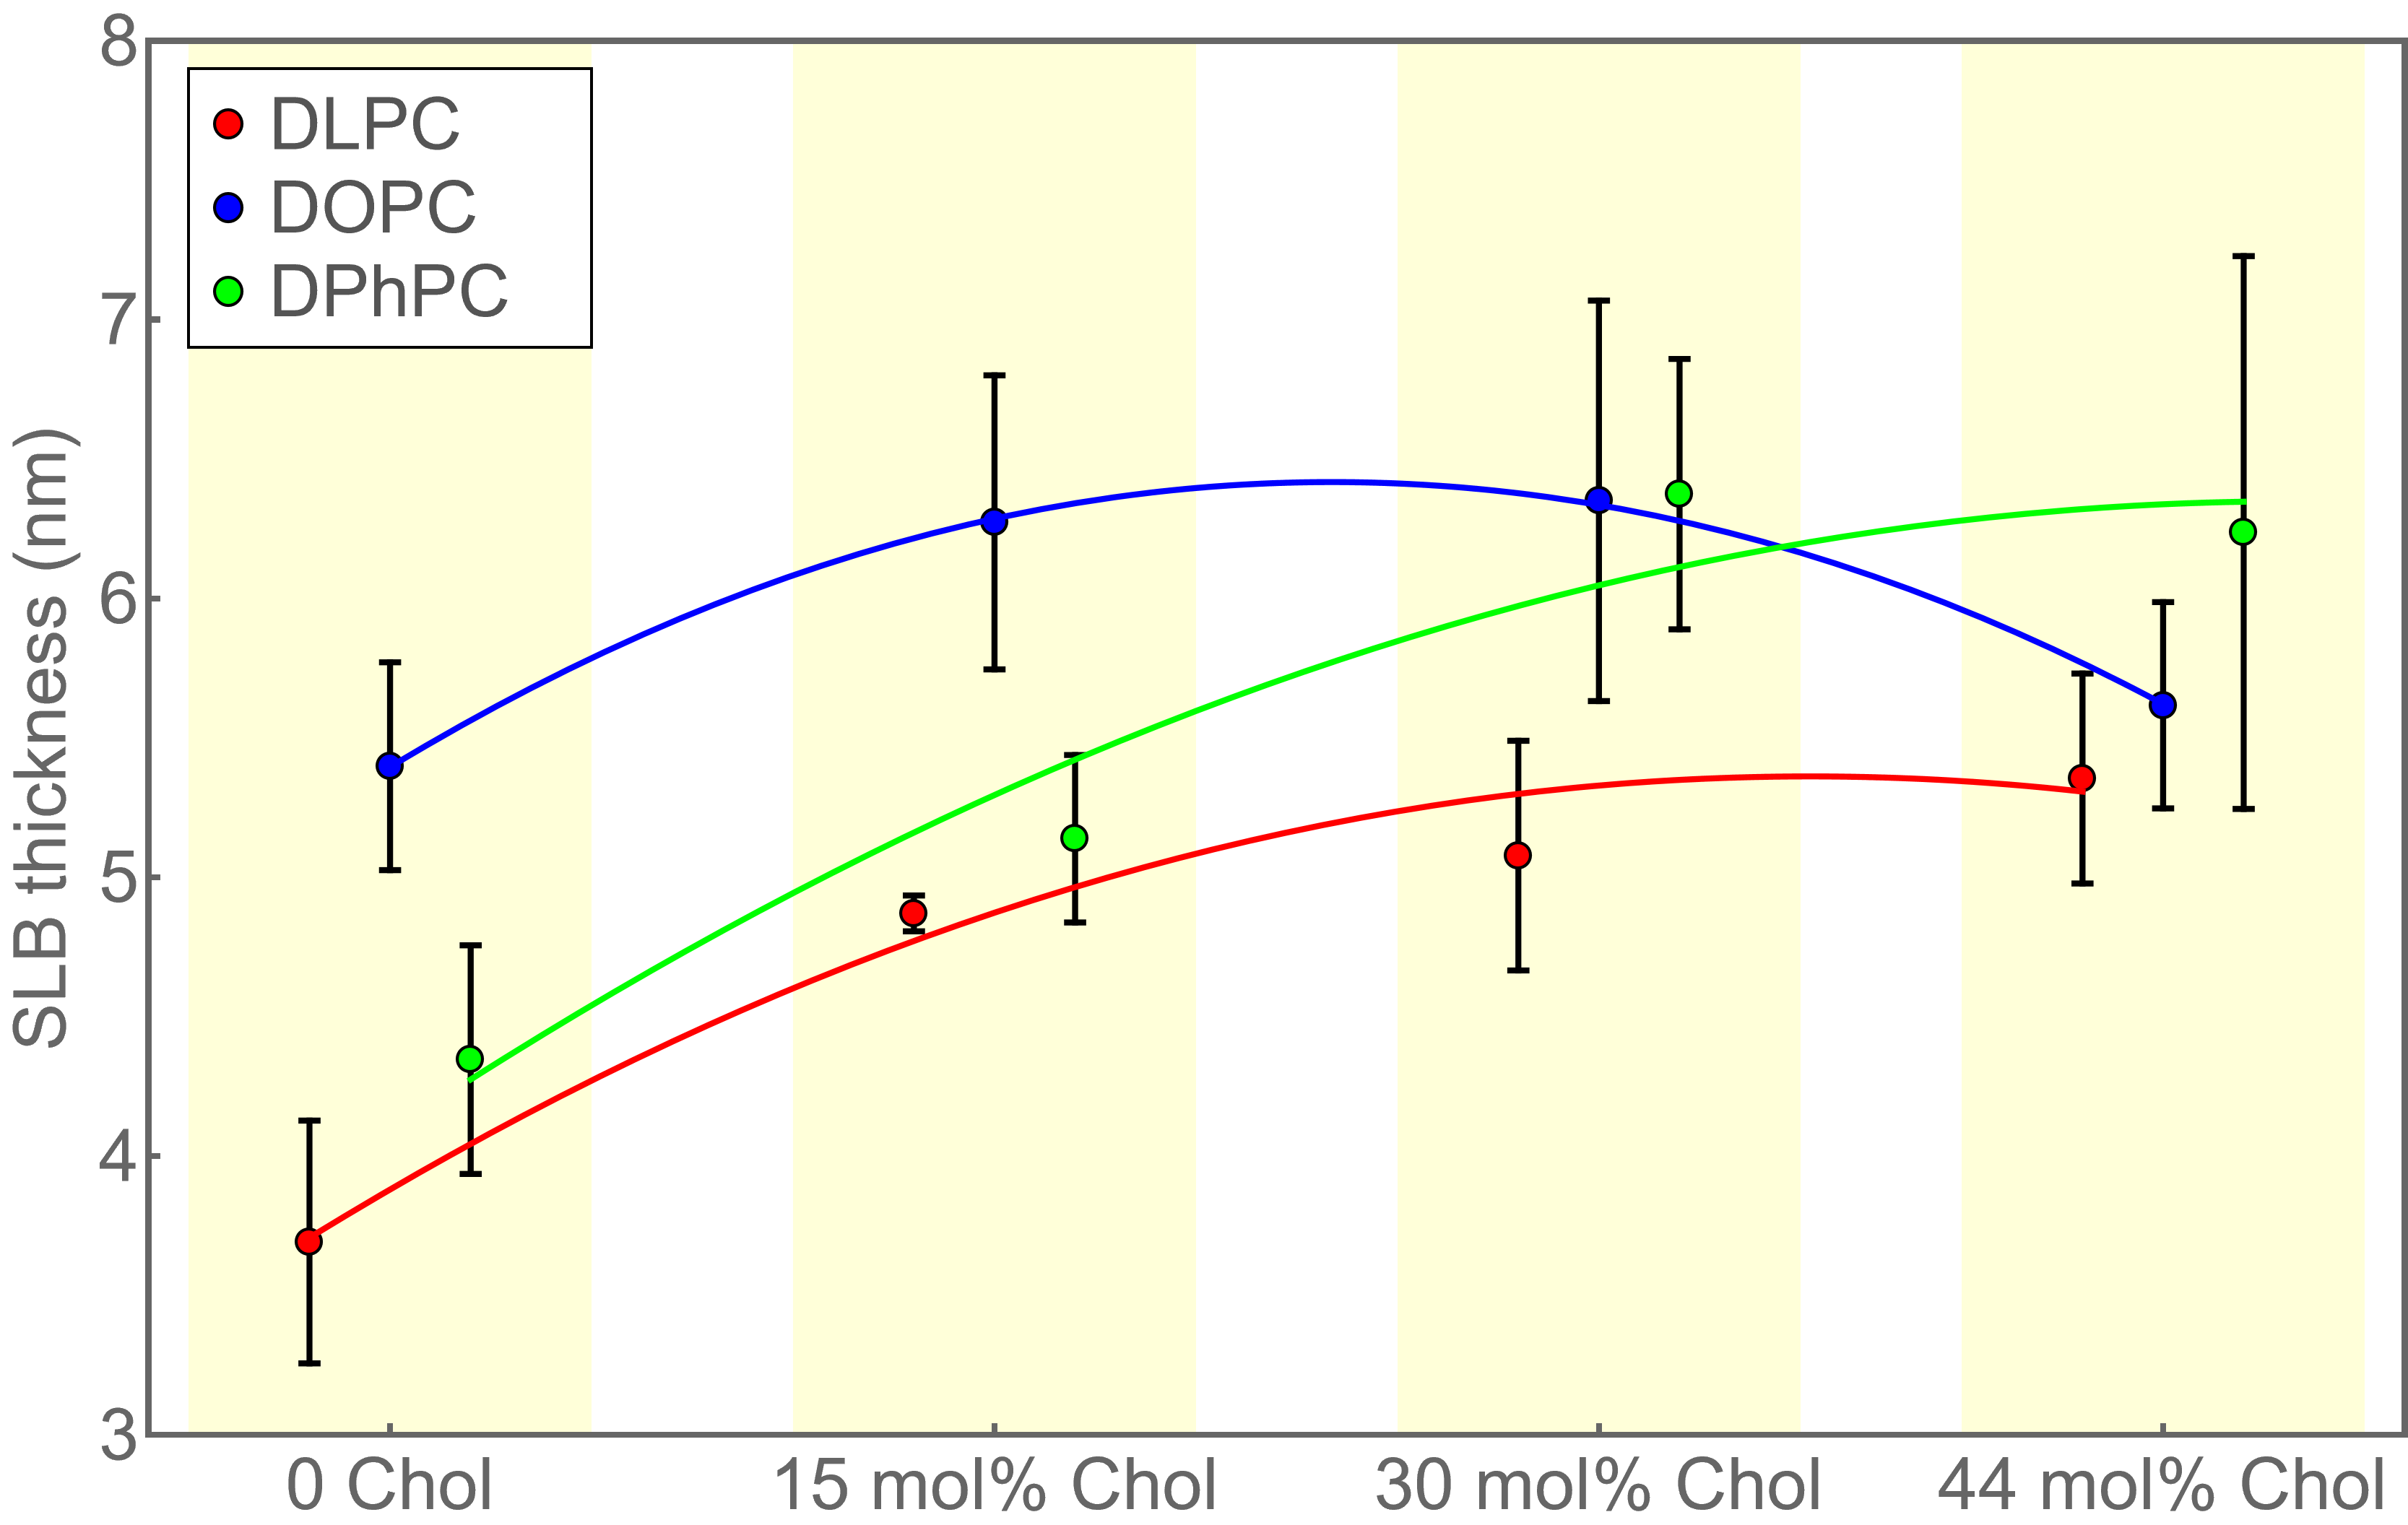
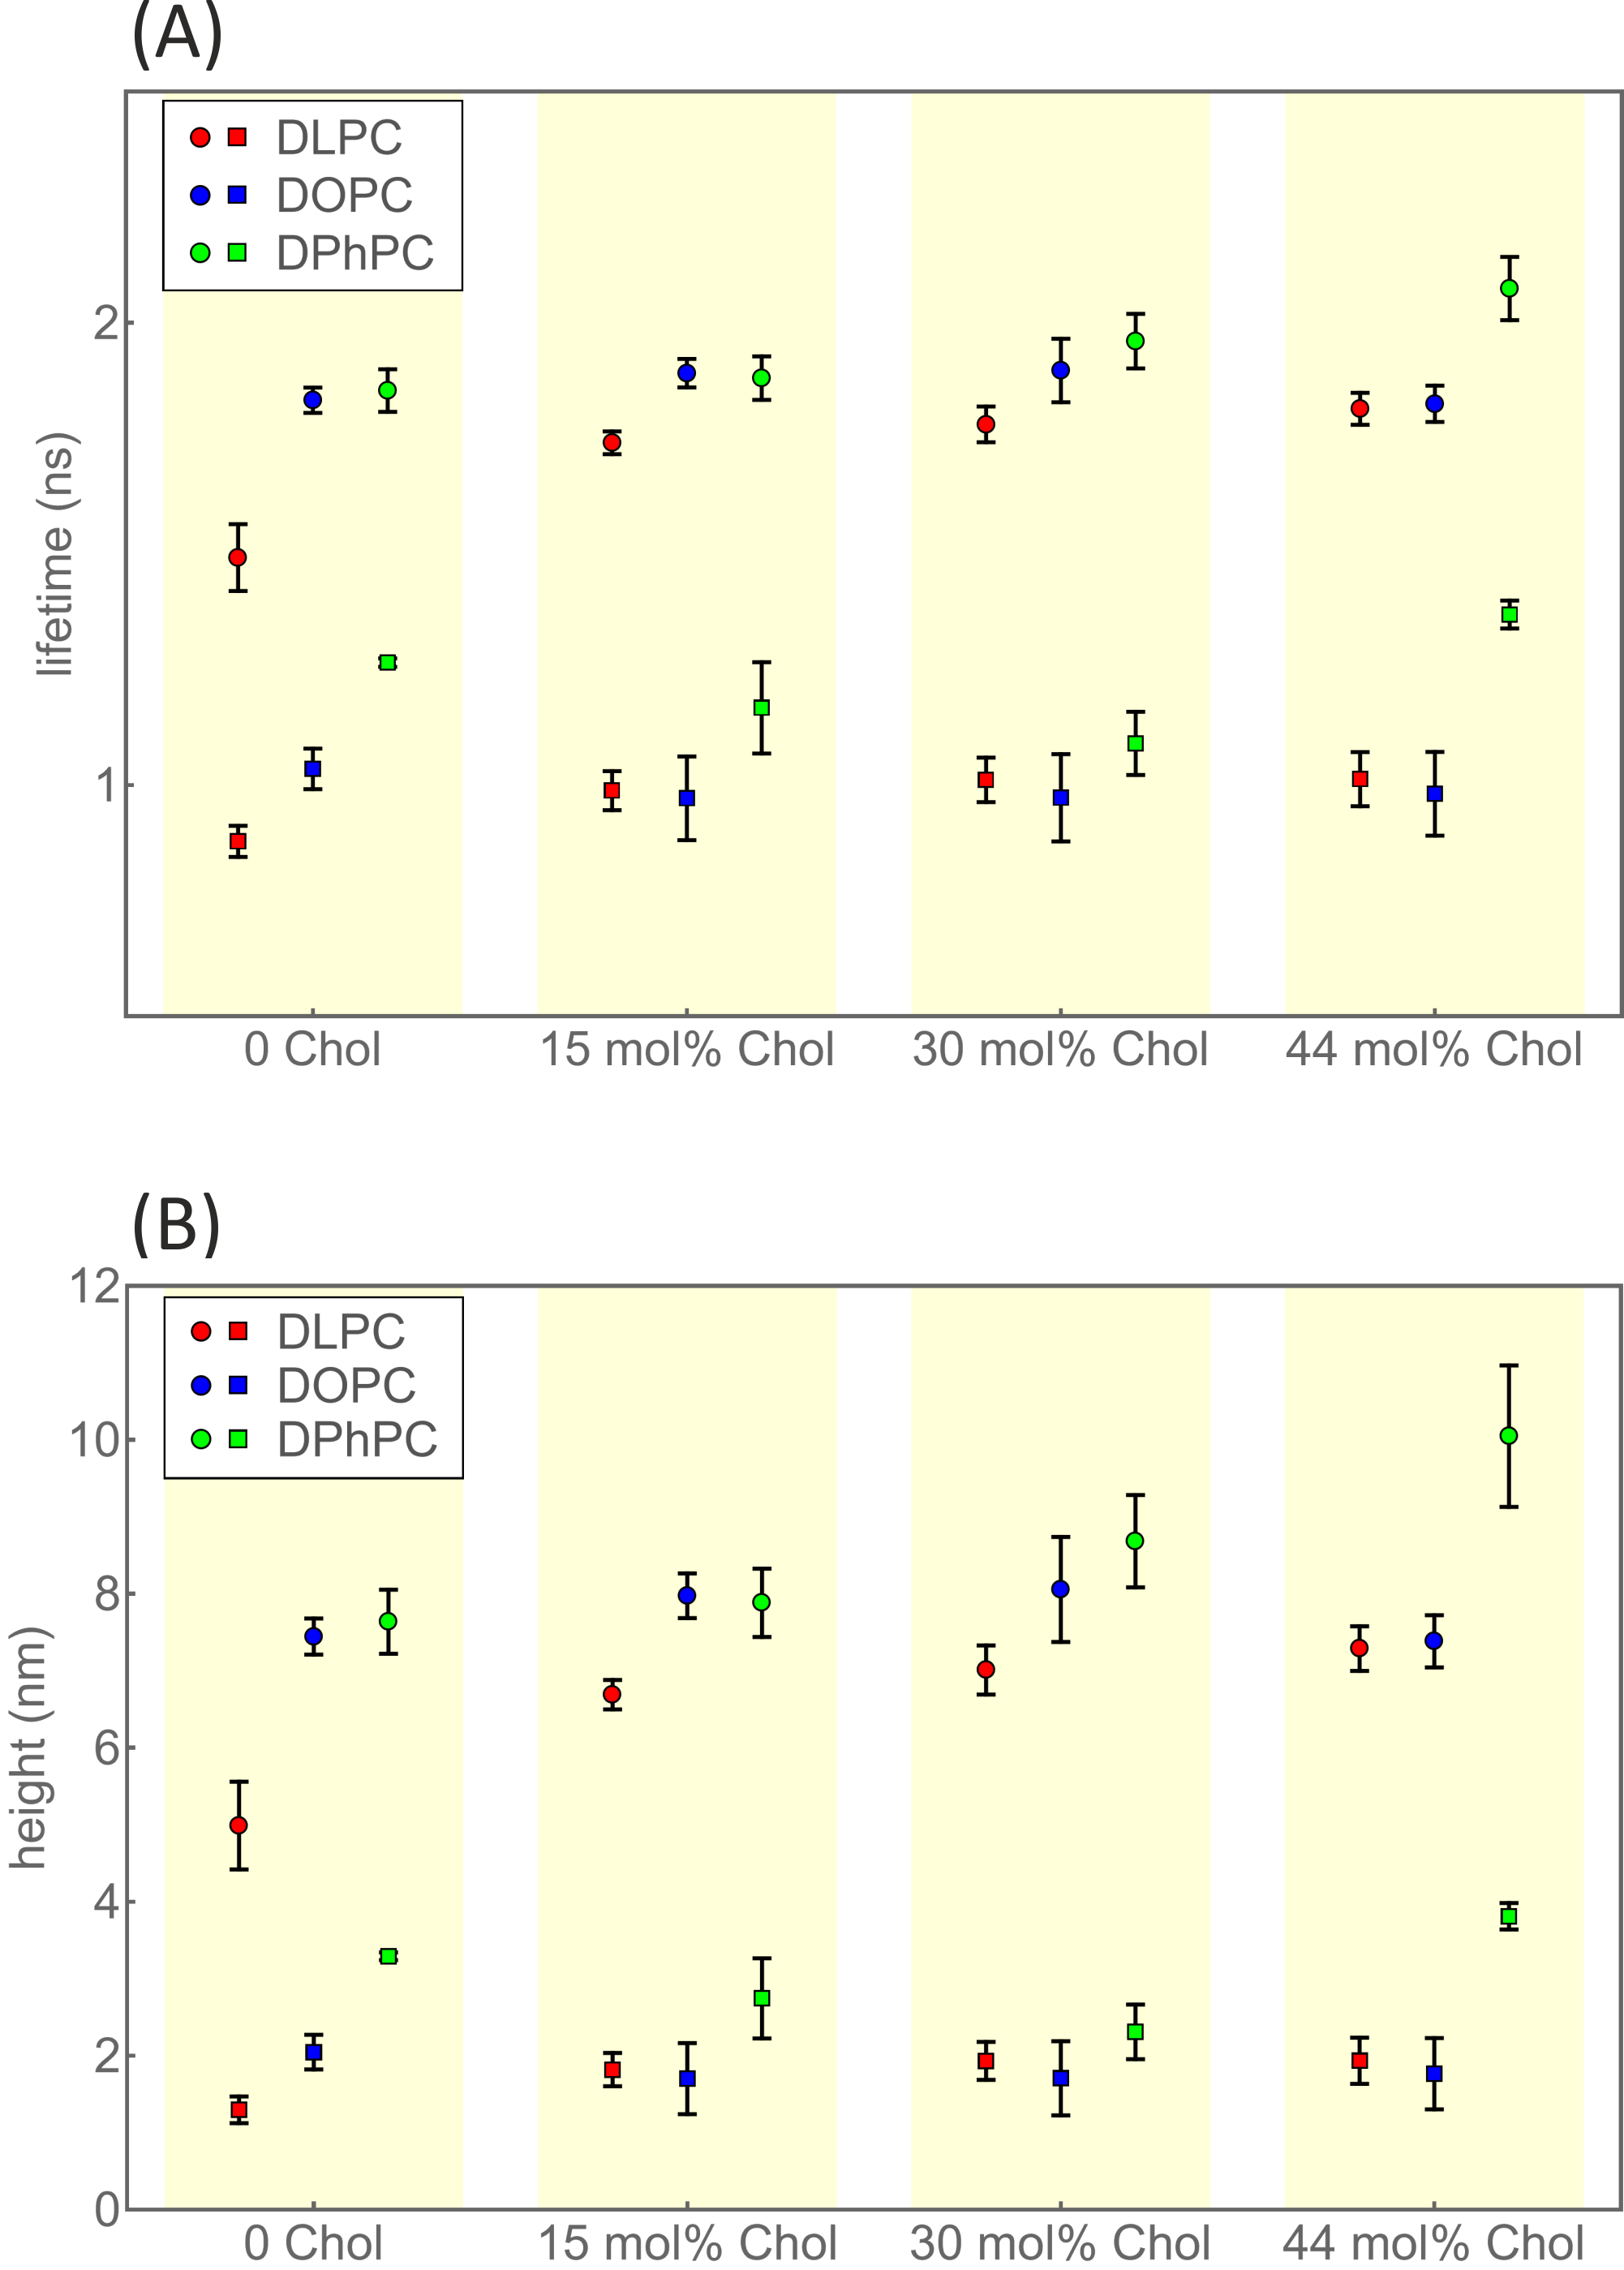
We determined the height and resulting thickness values for the twelve SLBs prepared from the three lipids DOPC, DLPC, DPhPC and for four Chol concentrations of 0, 15, 30 and 44 mol%. The determined height values are displayed in Figure 3 and listed in the tables in the Supplementary Information. The obtained thickness values are shown in Figure 4 and summarized in Table 1. We estimated the errors of our measurements by dividing each measurement into bunches of one million photons, analyzing each bunch separately, and calculating from these results the mean values and standard deviations. For better visualizing the general trend of bilayer thickness as a function of Chol concentration, we fitted these dependencies by parabolic curves, without implying that this is the correct physical model to apply.
An important result of our GIET-based thickness measurements is that we consistently achieve a measurement accuracy of ca. 0.5 nm (as estimated from the standard deviations). The exception is the DPhPC SLB with 44 mol% Chol showing a standard deviation of 1 nm. We attribute this to SLB heterogeneity which cannot be spatially resolved by the diffraction-limited lateral resolution of our confocal scanning microscope, but which leads to variations in the determined fluorescence lifetime values.
Our obtained thickness value for a Chol-free DLPC SLB is in excellent agreement with previous findings from x-ray scattering and independent GIET measurements 26, 18. Moreover, literature values do also suggest a nonlinear increase in bilayer thickness of DLPC SLB with increasing molar fractions of Chol 13, in accordance to our current findings. It should be mentioned that the length of the linker between dye and lipid head-group as well as the size of the dye itself increase the apparent bilayer thickness as measured by our method, so that our values are systematically larger (and have to be) than those determined by SAXS and SANS, which measure the direct lipid head-group to head-group distance. Literature values of bilayer thickness for Chol-free DPhPC SLBs range from 3.6-4.4 nm 27, 28, 29, in good agreement with our value of 4.3 0.4 nm. However, no literature reports for Chol-containing DPhPC SLBs are available. The most interesting behavior show DOPC SLBs, with an increase of bilayer thickness for small Chol concentrations and a decrease at large Chol concentrations. These results are in good agreement with previously reported experimental and computational studies 30, 31, showing a similar trend in thickness variation of DOPC SLB as a function of Chol content. Furthermore, the thickness values for Chol-free DOPC SLBs agree well with literature values obtained by using atomic force microscopy 32, and with our previous measurements using GIET 18.
Above the phase-transition temperature, SLBs are supposed to exhibit a liquid-disordered () phase, where the hydrocarbon tails of lipids are loosely packed and randomly oriented. Adding Chol to an SLB induces the formation of a liquid-ordered () phase that will grow in size with increasing Chol concentration (’condensing effect’) 5, 4. In the phase, hydrocarbon tails are extended and more closely packed, and Chol condensing leads to a decrease of area per lipid that is considerably more pronounced than one would expect for the case of ideal mixing, where the area per molecule would be a weighted average of Chol and lipid areas.
Another effect of Chol on membrane organization is that it reduces the tilt angle of lipid backbones (with respect to the direction perpendicular to the membrane) and thus increases the inter-leaflet distance between lipid head-groups 33, 34. This explains the Chol-induced increase in thickness of DLPC and DPhPC SLBs, both composed of saturated lipids where adding Chol increases local order and reduces tilting (condensing effect). For SLBs containing unsaturated lipids, a recent study using neutron spin-echo (NSE) spectroscopy, solid-state nuclear magnetic resonance (NMR) spectroscopy, and molecular dynamics (MD) simulations has shown that Chol stiffens the membrane by increasing its lipid packing 6. Another atomistic MD simulation of DOPC membranes reported an initial increase of membrane thickness with increasing Chol concentration, followed by a decrease for Chol concentrations above 35 mol 30. The explanation is that in DOPC membranes, acyl-chains are much less ordered than in membranes containing high concentrations of saturated lipids 35, 36, 37, 38. When adding Chol, this leads first to a reduction of lipid tilt angle for accommodating more space to incorporate Chol 30, which is later counteracted by reducing the order of lipid tails at high cholesterol concentrations 31. This leads first to an increase of bilayer thickness at moderate Chol concentrations, followed by thickness reduction beyond a critical Chol concentration (thinning effect). Our results show that the transition from thickening to thinning occurs between 30 and 44 mol% Chol concentration.
To summarize, GIET is a powerful fluorescence-spectroscopic tool for membrane biophysics. We demonstrated this here by studying the impact of Chol on membrane thickness, showing that GIET can easily resolve changes in membrane thickness with an accuracy of ca. 5 Ångstrom. An important advantage of GIET is its experimental simplicity, requiring only a conventional fluorescence lifetime imaging microscope (FLIM). Potential further applications of GIET in membrane biophysics can be the precise localization of membrane-associated proteins (or other biomolecules) with respect to a membrane, or the study of membrane dynamics by combining GIET with fluorescence correlation spectroscopy.
ASSOCIATED CONTENT
Supporting Information The supporting information is available free of charge. Reagents, Substrate preparation, Sample preparation, Experimental setup, Working principle of GIET imaging, Data evaluation, table S1 enlisting all fluorescence lifetime values and heights corresponding to bottom and top leaflets for DLPC, DOPC and DPhPC.
Present addresses A.G.: Department of Biotechnology and Biophysics, Biocenter, University of Würzburg, Am Hubland, 97074 Würzburg, Germany.
Notes The authors declare no competing financial interests.
Acknowledgments AG and JE thank for financial support by the Deutsche Forschungsgemeinschaft (DFG) through project A06 of the SFB 860. JE and TC are grateful to the European Research Council (ERC) for financial support via project “smMIET” (grant agreement no. 884488) under the European Union’s Horizon 2020 research and innovation program. JE is grateful for financial support by the Deutsche Forschungsgemeinschaft (DFG, German Research Foundation) under Germany’s Excellence Strategy - EXC 2067/1- 390729940.
References
- Yeagle 1985 Yeagle, P. L. Cholesterol and the cell membrane. Biochimica et Biophysica Acta (BBA)-Reviews on Biomembranes 1985, 822, 267–287
- Maxfield and Tabas 2005 Maxfield, F. R.; Tabas, I. Role of cholesterol and lipid organization in disease. Nature 2005, 438, 612–621
- Silvius 2003 Silvius, J. R. Role of cholesterol in lipid raft formation: lessons from lipid model systems. Biochimica et Biophysica Acta (BBA)-Biomembranes 2003, 1610, 174–183
- Hung et al. 2007 Hung, W.-C.; Lee, M.-T.; Chen, F.-Y.; Huang, H. W. The condensing effect of cholesterol in lipid bilayers. Biophysical Journal 2007, 92, 3960–3967
- de Meyer and Smit 2009 de Meyer, F.; Smit, B. Effect of cholesterol on the structure of a phospholipid bilayer. Proceedings of the National Academy of Sciences 2009, 106, 3654–3658
- Chakraborty et al. 2020 Chakraborty, S.; Doktorova, M.; Molugu, T. R.; Heberle, F. A.; Scott, H. L.; Dzikovski, B.; Nagao, M.; Stingaciu, L.-R.; Standaert, R. F.; Barrera, F. N., et al. How cholesterol stiffens unsaturated lipid membranes. Proceedings of the National Academy of Sciences 2020, 117, 21896–21905
- Chng et al. 2022 Chng, C.-P.; Hsia, K. J.; Huang, C. Modulation of lipid vesicle–membrane interactions by cholesterol. Soft Matter 2022,
- Wennberg et al. 2012 Wennberg, C. L.; Van Der Spoel, D.; Hub, J. S. Large influence of cholesterol on solute partitioning into lipid membranes. Journal of the American Chemical Society 2012, 134, 5351–5361
- Armstrong et al. 2012 Armstrong, C. L.; Barrett, M. A.; Hiess, A.; Salditt, T.; Katsaras, J.; Shi, A.-C.; Rheinstädter, M. C. Effect of cholesterol on the lateral nanoscale dynamics of fluid membranes. European Biophysics Journal 2012, 41, 901–913
- Sheng et al. 2012 Sheng, R.; Chen, Y.; Gee, H. Y.; Stec, E.; Melowic, H. R.; Blatner, N. R.; Tun, M. P.; Kim, Y.; Källberg, M.; Fujiwara, T. K., et al. Cholesterol modulates cell signaling and protein networking by specifically interacting with PDZ domain-containing scaffold proteins. Nature Communications 2012, 3, 1–9
- Kramar and Miklavčič 2022 Kramar, P.; Miklavčič, D. Effect of the cholesterol on electroporation of planar lipid bilayer. Bioelectrochemistry 2022, 144, 108004
- Salditt et al. 2019 Salditt, T.; Komorowski, K.; Frank, K. Characterization of Biological Membranes; De Gruyter, 2019; pp 43–86
- Gallová et al. 2004 Gallová, J.; Uhríková, D.; Islamov, A.; Kuklin, A.; Balgavy, P. Effect of cholesterol on the bilayer thickness in unilamellar extruded DLPC and DOPC liposomes: SANS contrast variation study. General Physiology and Biophysics 2004, 23, 113–128
- Berkowitz 2009 Berkowitz, M. L. Detailed molecular dynamics simulations of model biological membranes containing cholesterol. Biochimica et Biophysica Acta (BBA)-Biomembranes 2009, 1788, 86–96
- Díaz-Tejada et al. 2015 Díaz-Tejada, C.; Ariz-Extreme, I.; Awasthi, N.; Hub, J. S. Quantifying lateral inhomogeneity of cholesterol-containing membranes. The Journal of Physical Chemistry Letters 2015, 6, 4799–4803
- Eggeling et al. 2009 Eggeling, C.; Ringemann, C.; Medda, R.; Schwarzmann, G.; Sandhoff, K.; Polyakova, S.; Belov, V. N.; Hein, B.; Von Middendorff, C.; Schönle, A., et al. Direct observation of the nanoscale dynamics of membrane lipids in a living cell. Nature 2009, 457, 1159–1162
- Roy et al. 2008 Roy, R.; Hohng, S.; Ha, T. A practical guide to single-molecule FRET. Nature Methods 2008, 5, 507–516
- Ghosh et al. 2019 Ghosh, A.; Sharma, A.; Chizhik, A. I.; Isbaner, S.; Ruhlandt, D.; Tsukanov, R.; Gregor, I.; Karedla, N.; Enderlein, J. Graphene-based metal-induced energy transfer for sub-nanometre optical localization. Nature Photonics 2019, 13, 860–865
- Ghosh et al. 2021 Ghosh, A.; Chizhik, A. I.; Karedla, N.; Enderlein, J. Graphene-and metal-induced energy transfer for single-molecule imaging and live-cell nanoscopy with (sub)-nanometer axial resolution. Nature Protocols 2021, 1–21
- Karedla et al. 2014 Karedla, N.; Chizhik, A. I.; Gregor, I.; Chizhik, A. M.; Schulz, O.; Enderlein, J. Single-Molecule Metal-Induced Energy Transfer (smMIET): Resolving Nanometer Distances at the Single-Molecule Level. ChemPhysChem 2014, 15, 705–711
- Chizhik et al. 2014 Chizhik, A. I.; Rother, J.; Gregor, I.; Janshoff, A.; Enderlein, J. Metal-induced energy transfer for live cell nanoscopy. Nature Photonics 2014, 8, 124–127
- Raja et al. 2021 Raja, S. O.; Chizhik, A. I.; Schmidt, C. F.; Enderlein, J.; Ghosh, A. Mapping Activity-Dependent Quasi-stationary States of Mitochondrial Membranes with Graphene-Induced Energy Transfer Imaging. Nano Letters 2021, 21, 8244–8249
- Lindsey et al. 1979 Lindsey, H.; Petersen, N.; Chan, S. I. Physicochemical characterization of 1, 2-diphytanoyl-sn-glycero-3-phosphocholine in model membrane systems. Biochimica et Biophysica Acta (BBA)-Biomembranes 1979, 555, 147–167
- Veatch et al. 2006 Veatch, S. L.; Gawrisch, K.; Keller, S. L. Closed-loop miscibility gap and quantitative tie-lines in ternary membranes containing diphytanoyl PC. Biophysical Journal 2006, 90, 4428–4436
- Huang and Wu 1991 Huang, H. W.; Wu, Y. Lipid-alamethicin interactions influence alamethicin orientation. Biophysical Journal 1991, 60, 1079–1087
- Kučerka et al. 2011 Kučerka, N.; Nieh, M.-P.; Katsaras, J. Fluid phase lipid areas and bilayer thicknesses of commonly used phosphatidylcholines as a function of temperature. Biochimica et Biophysica Acta (BBA)-Biomembranes 2011, 1808, 2761–2771
- Tristram-Nagle et al. 2010 Tristram-Nagle, S.; Kim, D. J.; Akhunzada, N.; Kučerka, N.; Mathai, J. C.; Katsaras, J.; Zeidel, M.; Nagle, J. F. Structure and water permeability of fully hydrated diphytanoyl PC. Chemistry and Physics of Lipids 2010, 163, 630–637
- Lee et al. 2005 Lee, M.-T.; Hung, W.-C.; Chen, F.-Y.; Huang, H. W. Many-body effect of antimicrobial peptides: on the correlation between lipid’s spontaneous curvature and pore formation. Biophysical Journal 2005, 89, 4006–4016
- Wu et al. 1995 Wu, Y.; He, K.; Ludtke, S. J.; Huang, H. W. X-ray diffraction study of lipid bilayer membranes interacting with amphiphilic helical peptides: diphytanoyl phosphatidylcholine with alamethicin at low concentrations. Biophysical Journal 1995, 68, 2361–2369
- Alwarawrah et al. 2010 Alwarawrah, M.; Dai, J.; Huang, J. A molecular view of the cholesterol condensing effect in DOPC lipid bilayers. The Journal of Physical Chemistry B 2010, 114, 7516–7523
- Olsen et al. 2013 Olsen, B. N.; Bielska, A. A.; Lee, T.; Daily, M. D.; Covey, D. F.; Schlesinger, P. H.; Baker, N. A.; Ory, D. S. The structural basis of cholesterol accessibility in membranes. Biophysical Journal 2013, 105, 1838–1847
- Attwood et al. 2013 Attwood, S. J.; Choi, Y.; Leonenko, Z. Preparation of DOPC and DPPC supported planar lipid bilayers for atomic force microscopy and atomic force spectroscopy. International Journal of Molecular Sciences 2013, 14, 3514–3539
- Levine and Wilkins 1971 Levine, Y.; Wilkins, M. Structure of oriented lipid bilayers. Nature New Biology 1971, 230, 69–72
- Huang 2022 Huang, J. The fundamental interaction of cholesterol with lipid membranes: The umbrella model. Cholesterol 2022, 73–97
- Oh et al. 2021 Oh, Y.; Song, E. S.; Sung, B. J. The effects of the lipid type on the spatial arrangement and dynamics of cholesterol in binary component lipid membranes. The Journal of Chemical Physics 2021, 154, 135101
- Pan et al. 2008 Pan, J.; Mills, T. T.; Tristram-Nagle, S.; Nagle, J. F. Cholesterol perturbs lipid bilayers nonuniversally. Physical Review Letters 2008, 100, 198103
- Capponi et al. 2016 Capponi, S.; Freites, J. A.; Tobias, D. J.; White, S. H. Interleaflet mixing and coupling in liquid-disordered phospholipid bilayers. Biochimica et Biophysica Acta (BBA)-Biomembranes 2016, 1858, 354–362
- Marrink et al. 2008 Marrink, S. J.; de Vries, A. H.; Harroun, T. A.; Katsaras, J.; Wassall, S. R. Cholesterol shows preference for the interior of polyunsaturated lipid membranes. Journal of the American Chemical Society 2008, 130, 10–11