Rally and WebScience: A Platform and Toolkit for Browser-Based Research on Technology and Society Problems
Abstract.
Empirical technology and society research is in a methodological crisis. Problems increasingly involve closed platforms, targeted content, and context-specific behavior. Prevailing research methods, such as surveys, tasks, and web crawls, pose design and ecological validity limitations.
Deploying studies in participant browsers and devices is a promising direction. These vantage points can observe individualized experiences and implement UI interventions in real settings.
We survey scholarship that uses these methods, annotating 284 sampled papers. Our analysis demonstrates their potential, but also recurring implementation barriers and shortcomings.
We then present Rally and WebScience, a platform and toolkit for browser-based research. These systems lower implementation barriers and advance the science of measuring online behavior.
Finally, we evaluate Rally and WebScience against our design goals. We report results from a one-month pilot study on news engagement, analyzing 4,466,200 webpage visits from 1,817 participants. We also present observations from interviews with researchers using these systems.
1. Introduction
How can society understand the problems that arise from our interactions with online content and services? The challenges have never been more urgent: Harmful, toxic, and inauthentic content is rapidly and widely proliferating on the internet (Cinelli et al., 2020; Phadke and Mitra, 2020; Edelson et al., 2021), while content moderation responses can be inconsistent and inequitable (York, 2019). Personalized content and targeted advertisements distort individual beliefs and behaviors (Chaney et al., 2018) and permit potentially illegal discrimination (Ali et al., 2019; Tobin, 2019; Faife and Ng, 2021). Dark patterns manipulate individual decision making about privacy and purchasing (Mathur et al., 2021). Platform companies self-preference and unfairly impede competition (Jeffries, 2020). And internet connectivity itself is unequally distributed, reflecting and reinforcing social injustices (Vogels, 2021).
Research on technology and society problems like these is in a methodological crisis (Shapiro et al., 2021; Bak-Coleman et al., 2021; Lazer et al., 2021). The problems increasingly involve individual experiences, perceptions, and decisions both within the context of proprietary online services and across online services, targeted and personalized content, and black-box recommender and decision-making systems. Prevailing research methods impose significant research design constraints and ecological validity limitations. Online platforms have the capacity to enable rigorous study on diverse topics, but they rarely enable independent research—and when they do, they usually impose significant limitations on problem selection, methods, or results reporting.
Researchers, civil society groups, and policymakers have begun to respond. An interdisciplinary group of scholars recently proposed recognition of a new “crisis discipline” at the intersection of technology and society, where we currently “lack the scientific framework we would need to answer even the most basic questions” and novel empirical research methods are essential for making progress (Bak-Coleman et al., 2021). Civil society groups are exploring new models for research support (Shapiro et al., 2021). Legislators in the U.S. are considering proposals to mandate forms of research data access, and the EU’s new Digital Services Act includes analogous provisions (Persily, 2021; Engler, 2021).
Our goal in this work is to advance a promising and complementary response to the technology and society research methods crisis: deploying studies in participant web browsers and devices. The upside of browser- and device-based research is that it can reflect a person’s vantage point on real online experiences, enabling observation and intervention in a field setting. Prior work has relied on browser and device instrumentation to study technology and society problems, but the methods remain underutilized owing to recurring implementation barriers and shortcomings.
We begin in Section 2 by describing the promise of browser- and device-based studies in example research topic areas. We offer a high-level comparison of research methods for technology and society problems, highlighting the opportunities afforded by browser- and device-based methods.
Next, in Section 3, we contribute a survey of academic scholarship in applied sciences and social sciences that uses browser- and device-based methods. Because the relevant literature is vast and scattered across disciplines, we use stratified sampling to characterize prior work. We screen an initial sample of 3,341 papers that contain relevant terms down to a dataset of 284 papers that include at least one browser- or device-based study. We annotate each paper and then analyze the dataset, finding that browser- and device-based methods have been applied to a range of technology and society problem areas but face significant headwinds in implementation burden, instrumentation sophistication, and participant recruiting.
We then turn to system design and evaluation. Sections 4, 5, 6 and 7 contribute the Rally platform and the WebScience toolkit for conducting browser-based research. We set the design goals for these systems by distilling discrete challenges for browser-based research from the results of our literature review. Rally is a new platform for deploying browser-based studies, facilitating participant recruiting, data reporting, and data analysis. WebScience is a new toolkit for implementing browser-based studies, offering standardized browser instrumentation and a state-of-the-art model for understanding how people navigate and pay attention to web pages. Rally and WebScience were developed in a close collaboration between academic researchers and a web browser vendor, offering production-level scale and implementation quality. At the time of writing, Rally and WebScience are already in use at multiple academic institutions and an investigative newsroom.
Section 8 quantitatively and qualitatively evaluates Rally and WebScience against our design goals. We first present preliminary data from a pilot study on political and COVID-19 news engagement, which enrolled 2,709 participants over four months. This pilot study demonstrates the effectiveness of Rally at building a participant panel and of WebScience at precisely instrumenting online activity, but it also reveals limitations of panel composition. We next focus our analysis on a recent one-month subset of data, which includes 4,466,200 webpage visits by 1,817 participants. This analysis highlights the necessity of WebScience’s fine-grained measurement abilities. Finally, we qualitatively assess the systems by interviewing academic researchers and investigative journalists who are currently using them. 111All components of the evaluation were approved by the Princeton University Institutional Review Board and all participants consented.
Sections 9 and 10 discuss directions for future work and conclude.
2. Motivation
For decades, academic researchers across disciplines have applied standard quantitative and qualitative research methods to understand problems at the intersection of information technology and society. These methods will remain valuable, but they face increasing limitations and are no longer sufficient for studying pressing sociotechnical challenges.
We begin by discussing a set of societally urgent research topics that exemplify the need for new methods. We select topics where prior work has exhaustively attempted conventional methods but has been stymied by the limitations of those methods: harmful content networks, black-box recommender systems, and targeted advertising/personalization. A throughline in the topics we discuss is the involvement of closed platforms, which have declined to provide data that would facilitate academic scholarship.
Next, we provide a high-level overview of the methodological landscape for descriptive research on online experiences and for causal inference research about beliefs and behaviors related to online activity. We describe the strengths and limitations of conventional data collection methods. We then discuss methods for participant recruitment, which is a crosscutting challenge.
Our discussion highlights several desiderata for technology and society research methods: they should produce representative and real observations about online experiences, they should scale to new problems and populations, and they should allow research independence.
2.1. State of critical sociotechnical research areas and methodologies
Much of online life today is powered by proprietary services and products created by online platforms. As this trend increases, policymakers and regulators are faced with a dearth of empirical information upon which to base policy recommendations. We assert that there are several gaps in many areas of literature that result from similar methodological challenges. We review three examples of sociotechnical inquiry relevant to policymakers and regulators and highlight the common measurement problems that inhibit progress in these areas.
2.1.1. Harmful Content Networks
Harmful and abusive content abounds online, including misinformation and disinformation (Kumar and Shah, 2018), hate speech and harassment (Thomas et al., 2021), and violent content (Conway, 2017). Research has examined these categories of content at the scope of individual platforms (Mondal et al., 2017), specific communities (Ribeiro et al., 2020a), or topics or events of interest (Guess et al., 2020; Wilson and Starbird, 2020). However, much of the previous literature on the effects of harmful content on society faces critical validity challenges.
In offline environments, media effects research typically takes the form of a field intervention design, where researchers use either experimental or observational methods in naturalistic settings to understand the effects of content on subsequent beliefs or behaviors. For example, in order to understand the impact of a political messaging campaign on an electoral outcome, researchers may attempt an experimental design (e.g., expose people to content and then ask them about their likelihood to vote for a candidate) or an observational design (e.g., examine media consumption patterns in a region and then voting behaviors in the same region).
Translating these approaches to online environments requires access to data beyond the reach of most researchers today. The absence of accessible cross-platform data on “who is exposed to what content, on which platform, and at what time” means that critical questions presented by policy-makers and regulators cannot be answered with the state of most commonly available research methods. Consequently, lacking the capacity for field intervention studies, researchers struggle to measure the effects of harmful content on beliefs and behaviors. Additionally, because cross-platform data on content exposure remains inaccessible, researchers have not been able to measure incidence and engagement with harmful content at scale. Thus, it remains extremely challenging to evaluate the effectiveness of different policy proposals, such as content warnings or engagement limits, designed to mitigate the impact of harmful content.
2.1.2. Black-box Recommender Systems
Recommender systems (as well as other forms of decision-making systems) are typically based upon algorithmic models predicting engagement or consumption. The goal of a recommender system is usually to match an outcome (such as video viewing or a product purchase) with latent user traits, such as political preferences or other personal interests. This encourages the likelihood of user engagement, which underlies most business models of recommendation systems. Much of the content that users encounter online derives from recommender systems including social feeds (Solsman, 2018; Medvedev et al., 2019) and search results (Hannak et al., 2013).
Researchers have posited that recommender systems may have deleterious consequences for users, and thus present compounding problems for society. For example, recommender systems have been observed to homogenize user behavior and content (Chaney et al., 2018; Ciampaglia et al., 2018), exacerbate opinion polarization (Perra and Rocha, 2019), radicalize users (Ribeiro et al., 2020b), and spread misinformation (Fernández et al., 2021). However, research examining the systemic effect of recommender systems on aggregate social behaviors remains elusive. Recommendation systems are adaptive to user behavior, meaning that the more information informing the algorithm about user preferences, the more users receive different experiences. Though ensuring ecological validity of research performed outside of the naturalistic environment is often a challenge, the adaptive nature of recommendation systems emphasizes the necessity for large, representative samples of online user experiences. To date, few studies have been able to analyze large, representative samples of real user activity data (Cheng et al., 2016; Hosseinmardi et al., 2020).
2.1.3. Targeted Advertising/Personalization
Research has demonstrated many instances of manipulative, misinformative, and discriminatory online advertising practices (Ribeiro et al., 2019a; Waddell, [n.d.]; Speicher et al., 2018). Even after platforms added protections against discrimination, researchers discovered that ads for credit, housing, and employment could be targeted to users based on protected characteristics like race (Speicher et al., 2018). Measuring the incidence of discriminatory advertising is challenging, however, because researchers must collect user demographic data in addition to ad exposure data. Studies have had to estimate user demographics using proxy variables from auxiliary data (Ali et al., 2019) or in the case of Citizen Browser, leverage a panel of participants and custom measurement tools (Faife and Ng, 2021). Another challenge is that platform transparency reports are demonstrably incomplete (Edelson et al., 2019), but independently tracking ads requires large-scale platform-independent data collection.
2.2. Current methods and limitations for measuring user behavior
Researchers have applied a diverse range of empirical methods in pursuit of observing user experiences within and across online platforms and services. The portfolio of methodologies employed in studying user behavior online include simulations, web scraping, laboratory experiments, online surveys, browsing data (of which browsing history is only one form), and custom browser instrumentation. These methods are used when researchers are unable to gain access to sufficient data from online platforms themselves, or when the data provided by platforms does not meet the scientific needs of the research design.
Unfortunately, many of these methods only allow for partial examination of online user experiences, meaning that they address some but not all of the methodological challenges outlined in the previous section. For example, while some methods may allow for highly customized measurement of behavior, they may simultaneously lack the ability to collect data in-situ – in other words, high internal validity but low external validity. Other methods may allow for in-situ measurement, but fail to capture the surrounding context of user experience, which challenges the generalizability of resulting conclusions. Finally, many of the most promising methods also have extensive infrastructure development costs. While the resulting method may be possess high ecological, internal, and even external validity, the implementation and upkeep costs are far beyond the budgets of researchers. Thus, the scalability of these methods beyond a focused investigation remain undetermined.
2.2.1. Simulations
Researchers who seek to explicate the behavior of online services, but who lack access to the platforms or tools commonly applied in the field, will sometime create simulated versions of a platform or system in order to establish the dynamics of system parameters on resulting behavior. Simulation can be a valuable tool for experimenting with systems that are hard for researchers to directly access, such as recommender systems (Lucherini et al., 2021; Geschke et al., 2019). Thus, while simulation provides complete independence for researchers from the constraints of platform partnerships, these studies fail to meet the representativity or scalability needs of socio-technical research.
2.2.2. Web Scraping
Web scraping, typically taking the form of instrumenting a browser to visit websites and collect desired content either through manual or automated means, is a popular technique employed in online research.
Web crawls are highly configurable and capture web content in a common form, usually structured information parsed from web documents. This captures one aspect of online experience, the total sum of content possible to experience on the web. However, web crawls are not useful for studying personalized content, content behind login walls, or how users interact with content (Ribeiro et al., 2019b). Finally, while there are tools that help researchers create web scrapers, web scraping requires substantial investment in development and operational resources, especially if the data is intended to represent content over time (required for any form of time-series analysis of behavior). In other words, there is the first-time cost and the on-going cost of web scraping, both carried by the researcher.
2.2.3. Laboratory Experiments
Laboratory studies of online behavior and experiences can be conducted either in-person or through a remote platform. In addition to observation, researchers may also conduct interviews or pose survey questions to participants, allowing for measurement of subjective reports that serve as proxies for otherwise unobservable traits.
The high degree of researcher control allows for experimental designs with extremely high internal validity, as these studies allow the researcher to carefully isolate variables of interest or change the standard behavior of platforms to observe how users respond to specific stimuli (Kaiser et al., 2021). However, the artificiality of the environment can limit the ecological validity of findings (Nichols and Maner, 2008), which makes it difficult to extend the conclusions of laboratory studies to general populations.
Further, laboratory experiments do not lend themselves well to studying user actions in the context of typical online experiences, due to many limitations including (but not exclusively): the duration of observable tasks, the total number of participants, the complexity of the task, and the technical skills of the research team. Depending on the goals of a particular study, an experiment can range in start-up difficulty, from simply observing participants using existing systems in-person, to building new systems that allow for interventions, study participants remotely, or measure fine-grained aspects of behavior, such as by using eye-tracking hardware. For this and many other examples of costly technical limitations (e.g., researchers must be physically present with each participant), laboratory studies fail to meet the scalability criteria for the current needs of sociotechnical research.
2.2.4. Online Surveys
Online surveys address the scalability challenge of laboratory studies for a highly restricted subset of subjective reporting. Researchers can easily scale surveys to as large and diverse a population as they can recruit, which ensures high external validity as the resulting observations are assumed to generalize to the parent population (see Section 2.3). Similar to laboratory experiments, researchers retain substantial control over the survey design, which allows for the investigation of a broad range of topics only limited to the methodological constraint of a survey instrument. Many intervention designs are also possible as survey experiments, such as by presenting participants with hypothesized scenarios and soliciting a predicted behavior, or by exposing participants to differing information via an engagement task and then asking for endorsements of beliefs or opinions. As businesses, survey platforms service many clients beyond researchers, including other commercial customers, which ensures that their tooling and infrastructure are robust and resilient. Experiment development costs are thus typically contained within the level of questionnaires. However, survey methods are severely limited in other critical areas of ecological and internal validity. For example, while surveys may be embedded within the context of content engagement, the act of responding to a survey necessarily takes the subject out of context in order to respond. Surveys are also prone to other measurement errors, in that responses to questions may not be always accurately report past experiences and that respondents asked about behavioral intentions may instead give idealized answers (Araujo et al., 2017; Scharkow, 2016).
2.2.5. Platform Data
In some ways, the gold standard for addressing the class of questions that can be characterized as “who is exposed to what content and at what time” is the platform’s own instrumentation itself. Platform-provided data typically consists of a representative sample of user behavior drawn directly from their own user base. Typically, these datasets are produced through the same infrastructure and tooling used in day-to-day business. In that sense, platform-provided data reflects the highest fidelity of instrumentation regarding the activity of real users on platforms. Platforms sometimes make this data available to researchers, either through private agreements with individual research teams (Bakshy et al., 2015; Vosoughi et al., 2018), broadly shared datasets (Messing et al., 2020), or data access APIs (Morstatter et al., 2013).
However, platform data often does not meet the independence or generalizability criteria needed for sociotechnical research. One challenge is that businesses may not be inclined to collect or distribute data that scrutinizes their own practices (Roose, 2021). The data may also be proprietary, making replication studies difficult or impossible. In response to constraints on platform-provided data, some researchers have resorted to platform-specific datasets compiled by external organizations, such as the Pushshift archive of Reddit posts (Baumgartner et al., 2020). However, whether from platforms themselves or efforts by other research teams, data consisting of a single platform only provides insight into usage of the services offered by that platform. Additionally, often these datasets are created to serve a general set of interests rather than allow for specific, purposeful investigation. Most critically, while some organizations may be transparent about data collection and processing, platform data is often generated through opaque means, and organizations often do not provide researchers visibility into the collection process to identify issues or nuances with resulting datasets (Gaffney and Matias, 2018). Facebook, for example, launched the Social Science One initiative in 2018 to facilitate academic study of democracy and elections issues. The project was plagued by delays and skewed data with limited research value, and implementation errors eventually required reissuing the data (Timberg, 2021; de Vreese et al., 2019).
2.2.6. Browsing Data
Commercial browsing panels, such as YouGov and Comscore, provide researchers with data about browsing habits of participants in an ongoing research panel. Crowdsourcing data represents a grassroots counterpart to commercial panel providers, where researchers can construct similar data to these panels by asking recruited participants to upload their own browsing data (generally by having users upload a file containing their browser’s stored history), or access social media data by asking users to capture and upload posts from their newsfeeds (Wei et al., 2020; Owen, 2020; Bentley et al., 2019).
In both cases, this type of data shows actions taken by real users, provides data about surrounding actions (such as the website visited before and after a visit of interest), and requires minimal infrastructure development on the part of the researcher, since either the panel provider or the browser is completing the data collection. However, researchers are typically not able to design interventions, and are limited to the data collected by the provider, which may not include all the measures of interest. For example, commercial browsing data typically consists of timestamped URLs visited by the participant, without information about further user interaction with those sites.
2.2.7. Custom Browser Instrumentation
Some studies have instrumented participant’s browsers directly, typically using browser extensions (Edelson et al., 2019; Wang et al., 2015). This approach has several benefits: it collects data across platforms, allows for researcher-inserted interventions, and can measure not only what users see online but also how they interact with content and services. The naturalistic environment of browser-based studies is also a benefit, as it aids ecological validity. However, the cost of custom browser instrumentation is often extremely high, both in terms of development and operation. Researchers who maintain custom browser instrumentation for their research designs face considerable challenges to scalability. The NYU Online Political Ads Transparency Project created a browser extension and recruited participants to install it with the goal to collect targeting data and corresponding ads that participants were exposed to on Facebook (Online Political Transparency Project at New York University, 2020). The Markup’s Citizen Browser is a another related project. Although not a browser extension, participants install a standalone instrumented browser and log in to their Facebook accounts, enabling Citizen Browser to observe user’s experiences on Facebook through an automated collection design: periodically it will launch, navigate to Facebook, and collect data from participants’ feeds.
The work described in this paper allows for simplifying the creation of studies like these in two ways: first, the partnership with Mozilla enables researchers to more easily recruit a large pool of participants; second, WebScience provides reusable functionality that reduces extension development effort.
| Shows in-situ behavior | Allows for custom measurement | Allows for behavioral interventions | Shows surrounding context of user actions | Requires limited infrastructure development | |
| Lab experiments | |||||
| Online surveys | |||||
| Platform data | |||||
| Web scraping | |||||
| Browsing data | |||||
| Custom browser instrumentation |
: method can achieve goal
: method cannot achieve goal
: goal achievement depends on specifics of measurement
2.3. Current methods and limitations for recruiting participants
Once a method has been chosen for the measurement of user behavior, researchers face a second challenge – the method of recruiting participants into a study. Commonly, researchers have enlisted an array of commercial services that allow for researchers to engage with users in research marketplaces, such as commercial survey panels or crowdworker platforms. In this section, we go into more detail about these approaches, and review how each approach addresses the independence, representativity, and scalability criteria required for socio-technical research.
2.3.1. Commercial Panel Providers
Commercial panel providers such as YouGov, Comscore, Nielsen, and Similarweb internalize many of the recruiting costs associated with recruiting participants for task-based online research. These companies maintain a representative panel of people interested in participating in research studies. A smaller subset of panelists have pre-consented to sharing their browsing data with third parties for research purposes. To do so, panelists install browsing tracking software, which sends a pre-configured specification of data to the commercial panel providers. Commercial panel providers can be useful to researchers because of the ease of scaling and representativeness of the panel-driven approaches, at least for researchers who want to study populations covered by the commercial provider (Hosseinmardi et al., 2020; Guess, 2021).
However, commercial providers have substantial technical limitations that result in design constraints for socio-technical research. For example, researchers do not interact with the participants, which presents several challenges for verifying the data collection methods. Additionally, the lack of ability to directly interact with the participants in a study renders many intervention designs impossible.
2.3.2. Crowdworker Platforms
Amazon Mechanical Turk, Figure Eight, Microworkers, Clickworkers, and research-oriented platforms such as Prolific enable researchers to recruit large samples of paid research participants. Crowdworking platforms provide only rudimentary tools for collecting data (e.g., survey templates), in order to run more complex studies, researchers either ask users to collect and upload their own data (Fiesler et al., 2017) or ask users to install data collection tools (Farke et al., 2021).
These platforms provide scale relatively easily, since recruiting more participants is a matter of cost. Unlike when using commercial panel providers, researchers provide materials that the platform shows to each potential participant, allowing researchers a high degree of control over onboarding, e.g. the presentation of informed consent documents, the description of the scope of the study, and any other number of question that can be administered via survey. Many crowdworker platforms also allow researchers to filter participants by various demographics, allowing for user samples that meet specific representativity criteria.
However, researchers who want to recruit a sample along a demographic not represented in the options provided by the platform will have to subsequently address this in follow-on analysis. And if the desired population may not be present on the platform, this approach may also simply not be feasible.
2.3.3. Research Teams
Researchers have many conventional options for recruiting participants, including posting fliers, sending emails, posting on online forums, purchasing advertisements, stopping people in public places, or asking participants to refer friends. These methods allow researchers to recruit participants that match the population they aim to study and to control the onboarding and consent processes, but recruiting a large sample of such participants can be quite difficult. Often, researchers rely on an easy-to-reach population, which may produce results that are not generalizable to other populations (Peterson, 2001).
2.3.4. Platform Partnerships
When researchers partner with a platform to study its users, they gain access to an instantly-scaled and representative population: by definition, the entire population of a platform’s users are representative of themselves. However, these partnerships are often exclusive, and usually do not allow external researchers to control the onboarding process. Users may vary in their understanding of their role as research subjects.
| Scales easily | Representative of desired population | Researcher control over onboarding | |
| Commercial panel providers | |||
| Crowdworker platforms | |||
| Research teams | |||
| Platform partnership |
: method can achieve goal
: method cannot achieve goal
: goal achievement depends on specifics of measurement
3. Survey of Prior Work with Device-Based Research Methods
In order to better understand both how browser-based, and, more broadly, device-based research methods have been applied so far and the barriers to greater use of these methods, we conducted a literature survey across academic disciplines.
We constructed a set of query terms for device-based research (see Section A.1 for the complete list) and conducted Google Scholar searches for academic papers. Because the queries yielded a large volume of papers, we grouped the papers based on the number of citations/year they had received and took a sample of each stratum for our candidate set of papers. Table 3 lists the strata, number of papers, and sampling rates.
| Percentile range | Citations/year | Number of papers | Sampling rate |
| 95—100 | ¿=16.33 | 1147 | 100% |
| 80—95 | ¿=3.77, ¡ 16.33 | 3427 | 25% |
| 50—80 | ¿= 0.52, ¡3.77 | 6862 | 10% |
| 0—50 | ¡ 0.52 | 13024 | 5% |
We then manually filtered each paper in the candidate set, applying five criteria. First, we required that the paper involve data about interactions between participants and computing devices. Second, the paper had to include data from at least 10 individuals. Third, the data collection had to cover at least 30 days for at least one participant. Fourth, the participants had to use the device outside of a lab environment. Fifth, the data described in the paper could not be usage statistics of a researcher-created tool.
We used a few criteria to exclude papers: papers we were unable to access, papers that were not written in English, and search results that were actually books or unpublished dissertations, rather than academic papers.
At the conclusion of this process, our dataset included 284 papers. We then annotated each paper with the following attributes (For the complete codebook, see Section A.2): academic discipline, number of participants, duration of data collection, informed consent, IRB approval, data source, collection mechanism, recruitment mechanism, compensation, interventions, qualitative data, web attention, web navigation, and social media sharing.
When a paper included multiple distinct instances of qualifying data collection, we annotated them separately, yielding a final dataset of 290 studies.222The final annotated dataset is available at https://github.com/CHI4450/submission4450/blob/main/literature_survey_dataset.csv. Many of the papers in our dataset fell into one of two categories:
-
•
MOOC: Papers in this category used data from a MOOC (massive open online course) to predict or assist student success.
-
•
E-Commerce: Papers in this category used data from an online store to predict or increase sales or browsing.
Within each of these two categories, the papers tended to be similar along the attributes we were coding, and neither category was the primary focus of our literature review. Therefore, for these two categories of paper, we coded their publication venue, academic discipline, topic, number of participants, and duration of data collection, but no other attributes.
Finally, as we did not read an equal sample from each stratum, we extrapolated our results from the sample we read to the full population of papers as follows:
where is the extrapolated count of papers meeting condition , is the index of a stratum, is the number of strata, is the number of papers in the dataset in stratum , is the number of papers in the dataset in stratum meeting condition , is the number of papers in the original universe in stratum , and is the number of papers sampled from stratum .
For numeric coding attributes, we calculated weighted percentiles and weighted means using the same weight as above: .
| Description | Number of papers |
| Total papers resulting from search terms | 24584 |
| Sample of papers screened | 3341 (13.6% of total) |
| Papers containing qualifying studies | 284 (8.5% of sample) |
| Qualifying studies | 290 |
| Extrapolated count of qualifying studies in original total | 1276 |
| Studies in D not categorized as MOOC or e-commerce | 177 |
| Extrapolated count of non-MOOC or e-commerce studies in U | 751 |
Unless otherwise stated, results reported below are given on the extrapolated dataset resulting from this reweighting. Table 4 provides an overview of the number of studies at each step.
We offer the following observations from analyzing our literature review dataset.
| Topic | Number of studies | Description |
| Online sales and marketing | 363 (28.4%) | Studies about online sales |
| Education | 267 (20.9%) | Studies about learning and teaching |
| Health | 155 (12.1%) | Studies about individual and public health, both physical and mental |
| Behavior profiling | 144 (11.3%) | Studies on methods for sorting users into groups based on behavior, or predicting next actions |
| Security and privacy | 68 (5.3%) | Studies working to understand the state of security/privacy or evaluate new systems for improving security/privacy |
| Politics | 58 (4.5%) | Studies about how people engage in political behavior or news-reading online. |
| HCI | 57 (4.5%) | Studies on understanding the use of particular systems or tools |
| Network analysis | 42 (3.3%) | Studies on information flow in social networks |
| News consumption | 29 (2.3%) | Studies on patterns of non-political news consumption |
| Recommender systems | 25 (2.0%) | Studies evaluating systems that recommend products or media to users |
| Computer systems | 19 (1.5%) | Studies measuring or improving network speeds or operating system characteristics |
| Metadiscussion of collection | 17 (1.3%) | Studies building systems for collecting user data, or studies measuring consent and understanding of collection |
| Workplace | 15 (1.2%) | Studies evaluating patterns of how employees work |
| Financial | 11 (0.9%) | Studies using user data to predict loan repayment |
| Other | 6 (0.5%) |
First, device-based research methods are not exclusive to computer science. The two topics best represented in our dataset are online sales and marketing (28.4%), and education (20.9%). Studies in health (11.3%) and politics (4.5%) also make up a significant proportion. Table 5 describes the topics and their prevalence in the dataset.
Second, most device-based studies (80.5%) rely on a research data provider or a partnership. Just 17.5% of studies build custom instrumentation to collect their data. Figure 1 shows the methods used by studies in each topic. Unsurprisingly, papers in online sales and marketing often use e-commerce methods to collect data, and education studies often use MOOCs, which are both forms of partnership.
Third, researchers face a trade-off between using sophisticated instrumentation and benefiting from a larger participant sample and longer data collection. As seen in Figures 2 and 3, the median number of participants for studies with custom instrumentation was 157, because these studies typically involved researchers developing their own recruiting strategy and methods. Researchers who recruited participants independently reported using multiple methods to advertise, often including emails, fliers, and word-of-mouth. The median number of participants for studies with research data providers, meanwhile, was 2651, and 4462 for studies using a partnership, because researchers could generally take advantage of an existing user base. The difference in duration of data collection follows the same pattern, though less extreme: the median period of data collection for studies with custom instrumentation was 90 days, compared to 96 and 150, respectively for studies using research data providers or partnerships. Commercial panels can incentivize participants to remain in the sample, and, since many studies use their data, often run for many years at a time, with researchers able to collect extensive retroactive data. Ideally researchers would be able to benefit from both sophisticated, custom instrumentation and a larger, longer-lasting participant sample.
Fourth, papers with larger numbers of participants and longer data collection were less specific about the consent of their participants. This is illustrated in Figure 4. The studies that we coded as ”not stated” for consent were a diverse group: some very likely had received informed consent from their participants, but didn’t mention it, and others appeared not to have notified users of the use of their data. Many studies using a partnership to collect data (80.1% of which did not mention consent) clearly would have struggled to acquire consent, since their participants were often unaware that their data was being used.
Fifth, very few studies involved an experiment with user experience interventions (8.3% of the non-MOOC or e-commerce studies). Nearly all of these studies used custom instrumentation, as seen in Figure 5. Intervention study designs can be powerful for making progress on technology and society research problems, because they enable scholars to examine how individuals might respond to differently designed online services and experiences. Unfortunately, these methods appear to be out of reach except for teams with extensive technical backgrounds and resources.
Sixth, because of the limited data available, many browser-based research studies use highly imprecise proxies to measure important aspects of user behavior. Of the 317 studies that used any method to measure attention, 246 (77.6%) used simply the count of visits to different domains. 25 (7.9%) used dwell time, 19 (6.0%) used the interval between page loads, and 22 (7.0%) did not state their methodology. The remaining 5 (1.6%) used a mix of custom instrumentation and a measure supplied by the research data provider. Similarly, of the 102 papers that considered the navigation path between sites, 47 (46%) used the chronologically-previous page load, 22 (22.6%) relied on the HTTP referrer, and the other 33 (32.4%) used a mix of custom instrumentation, most of which were for a specific platform or system, rather than being general purpose.
Seventh, most papers do not describe their data in detail. We planned to evaluate the overcollection of a study: whether it minimized the data collected, or swept up unnecessary detail in its collection. However, almost no papers gave a sufficient description of the data for such an analysis. From the descriptions provided, studies very rarely intentionally limited the data they collected, usually preferring to use everything available.
4. An Overview of Rally and WebScience
We have demonstrated above that sociotechnical researchers are in need of new methods to study users that are sophisticated, customizable, scalable, and that protect participant privacy. We now present Rally and Webscience, new systems for browser-based research designed to meet this need, and discuss how the systems work together to enableaa study.
4.1. Rally Overview
Rally is a program run by Mozilla that allows researchers to use Firefox as a platform for studies. Researchers using Rally partner with Mozilla to recruit users of Firefox as research participants, giving researchers access to a large pool of potential participants. A participant in a Rally study installs a browser extensions into the browser they already use, allowing researchers to observe their everyday online activity and interactions with web services. See Section 5 for a full discussion of Rally.
4.2. WebScience Overview
Rally handles many aspects of a research study, including recruitment, participant onboarding, and data storage. One of the central challenges of browser-based research still remains, however: researchers need sophisticated, standardized, customizable instrumentation for carrying out a study. WebScience is an open-source SDK for creating a study, along with instrumentation for many important but difficult-to-measure aspects of user behavior. WebScience is easy to customize, even for research teams with less technical expertise, and easily extensible by research teams with more specialized needs. See Section 6 for a full discussion of WebScience.
4.3. Study Overview
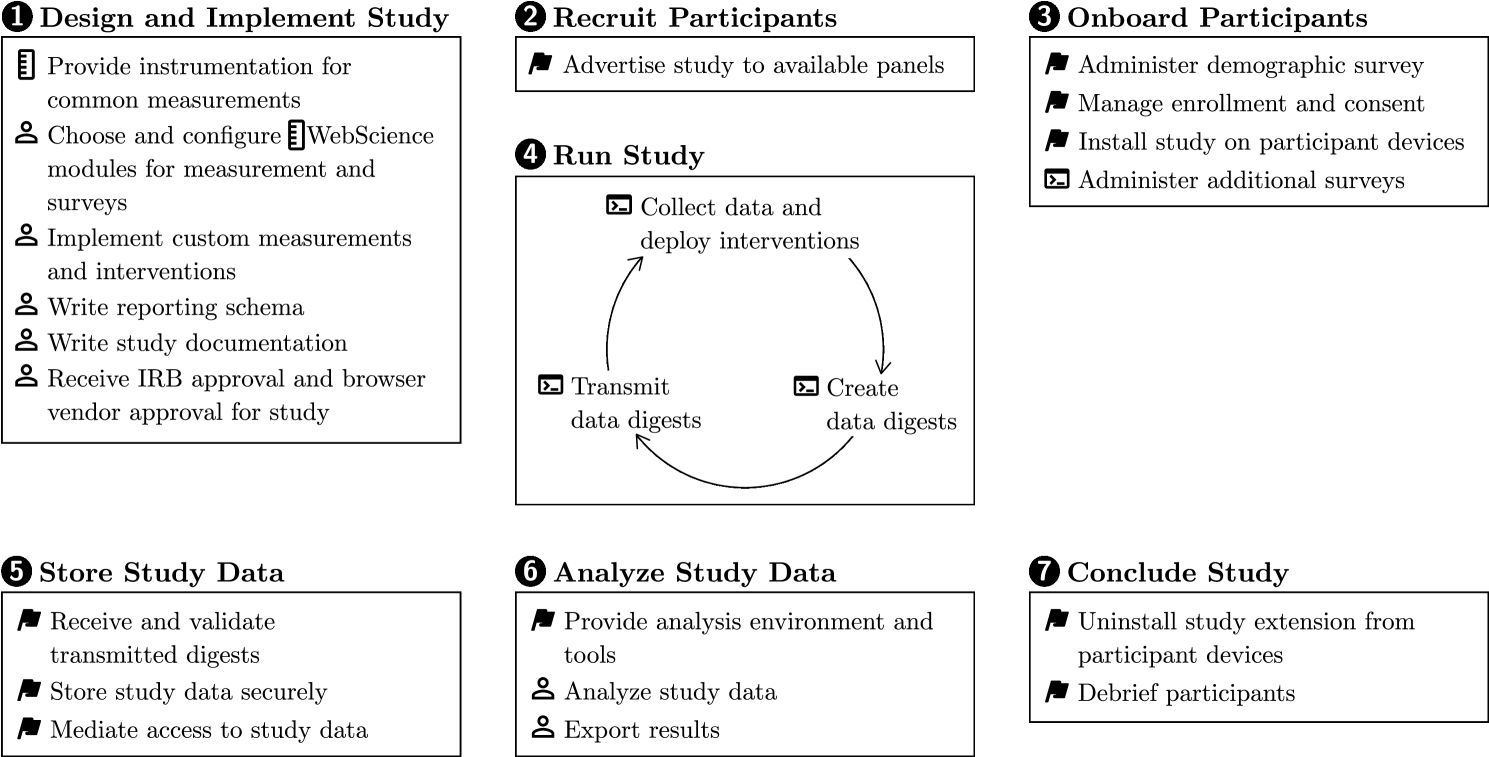
Figure 6 shows how a typical research team uses Rally and WebScience to conduct a study.
 ), study authors (
 ) design and implement the study (section 4.3.1). Rally (
 ) recruits and onboards participants (sections 4.3.2 and 4.3.3), then study code (
 ) installed on participant devices executes the study (section 4.3.4). Rally securely stores data (section 4.3.5), permits study authors to analyze the data (section 4.3.6), and concludes the study (section 4.3.7).
4.3.1. Design and Implement Study
Research teams that wish to run a Rally study first receive approval from their institution’s IRB and from a team at Mozilla that evaluates studies. Once approved, the researchers implement their study as a browser extension, likely utilizing WebScience. Mozilla conducts a code review on the study extension, and researchers submit IRB-approved consent forms and study explanations, as well as a schema describing the format of the data that the extension will report.
4.3.2. Recruit Participants
Mozilla advertises the study to users of Firefox, using in-browser messaging and other methods. Research teams may also conduct their own recruitment efforts.
4.3.3. Onboard Participants
Once a potential participant has indicated interest in enrolling, they first join Rally, and are asked to complete an optional demographic survey. Next, they can join a specific study. Rally conducts the informed consent process, using the consent forms supplied by the research team. It then installs the study extension on the participant’s browser. Research teams can configure the study extension to ask participants to complete a survey specific to their study, using Qualtrics or another survey platform.
4.3.4. Run Study
Studies run for a predetermined amount of time, ranging from a few weeks to more than a year. During this time, the study extension collects measurements as participants browse, potentially deploys interventions, and periodically packages collected data into digests, which it sends to the backend storage environment.
4.3.5. Store Study Data
Mozilla maintains a pipeline for incoming Rally digests, using its browser telemetry infrastructure. Digests are transmitted securely, then decrypted and validated against the study schema provided by the research team before being stored securely.
4.3.6. Analyze Study Data
Members of the research team can log in to the analysis environment to view reported data at any time. The data is stored on machines administered by Mozilla, and researchers cannot transfer it elsewhere. Instead, researchers run analyses in JupyterLab notebooks with access to the data.
4.3.7. Conclude Study
At the end of the predetermined study timeframe, Rally removes the study extension from participants’ browsers. If necessary, the research team can perform any debriefing (such as revealing deception) at this point.
5. Rally System Description
We now describe how Rally addresses the barriers to sociotechnical research we established in Sections 2 and 3.
5.1. Scale and Representativeness
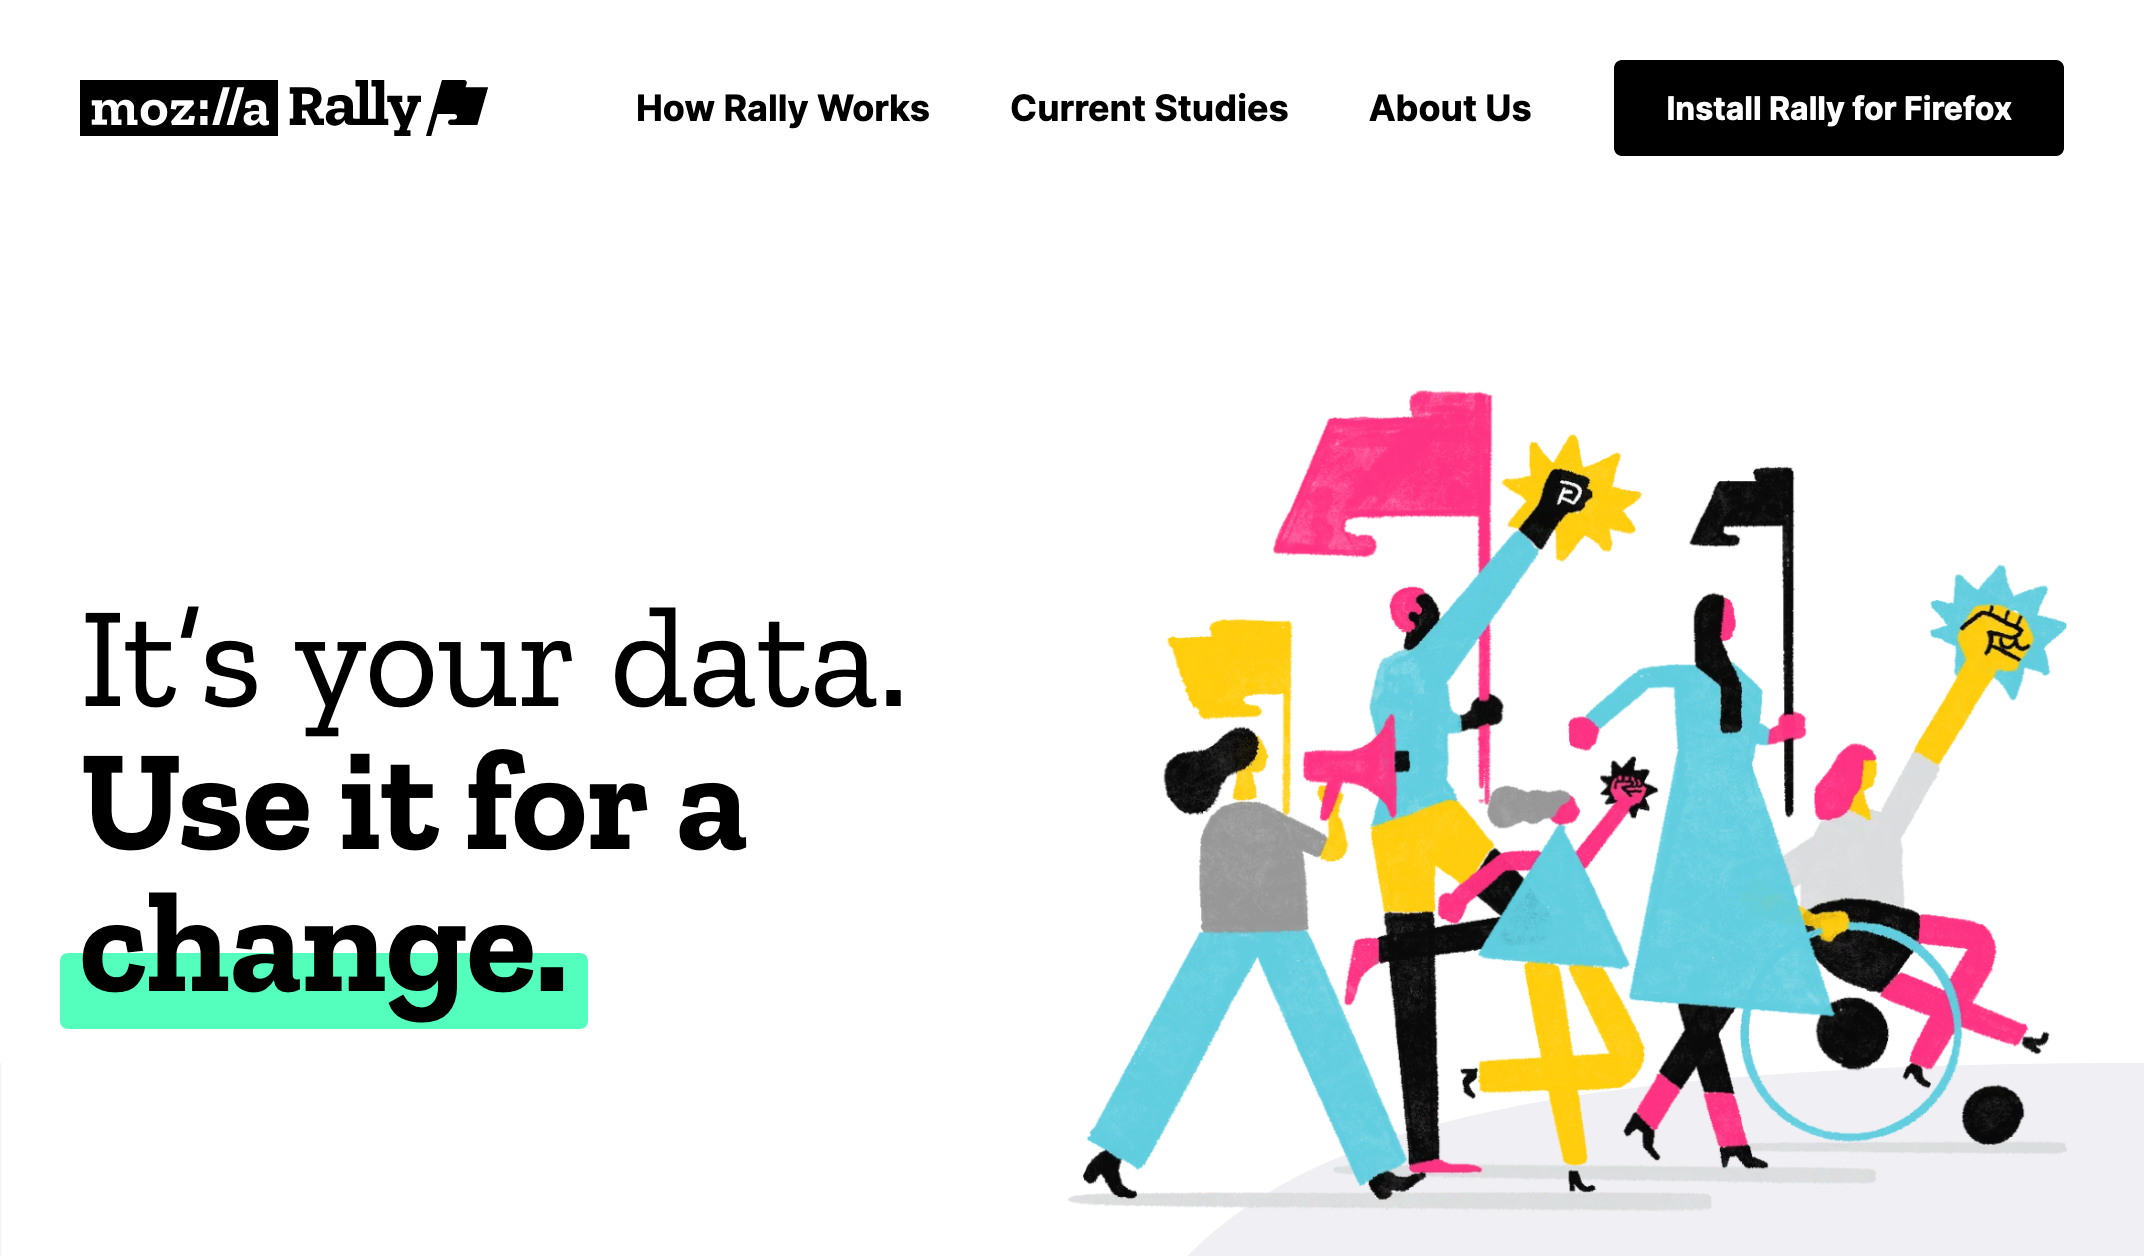
Our literature review showed that without a partnership or data provider, most studies can only recruit a few hundred participants. For Rally, Mozilla has accumulated a population of potential participants by recruiting in-browser and on social media. Approximately 6,500 users are currently signed up, and Mozilla plans to significantly expand recruitment efforts in the near future. Rally is public and any US-based 19-or-older user of Firefox can join the program (Mozilla Rally, 2020) (Figure 7(a)).
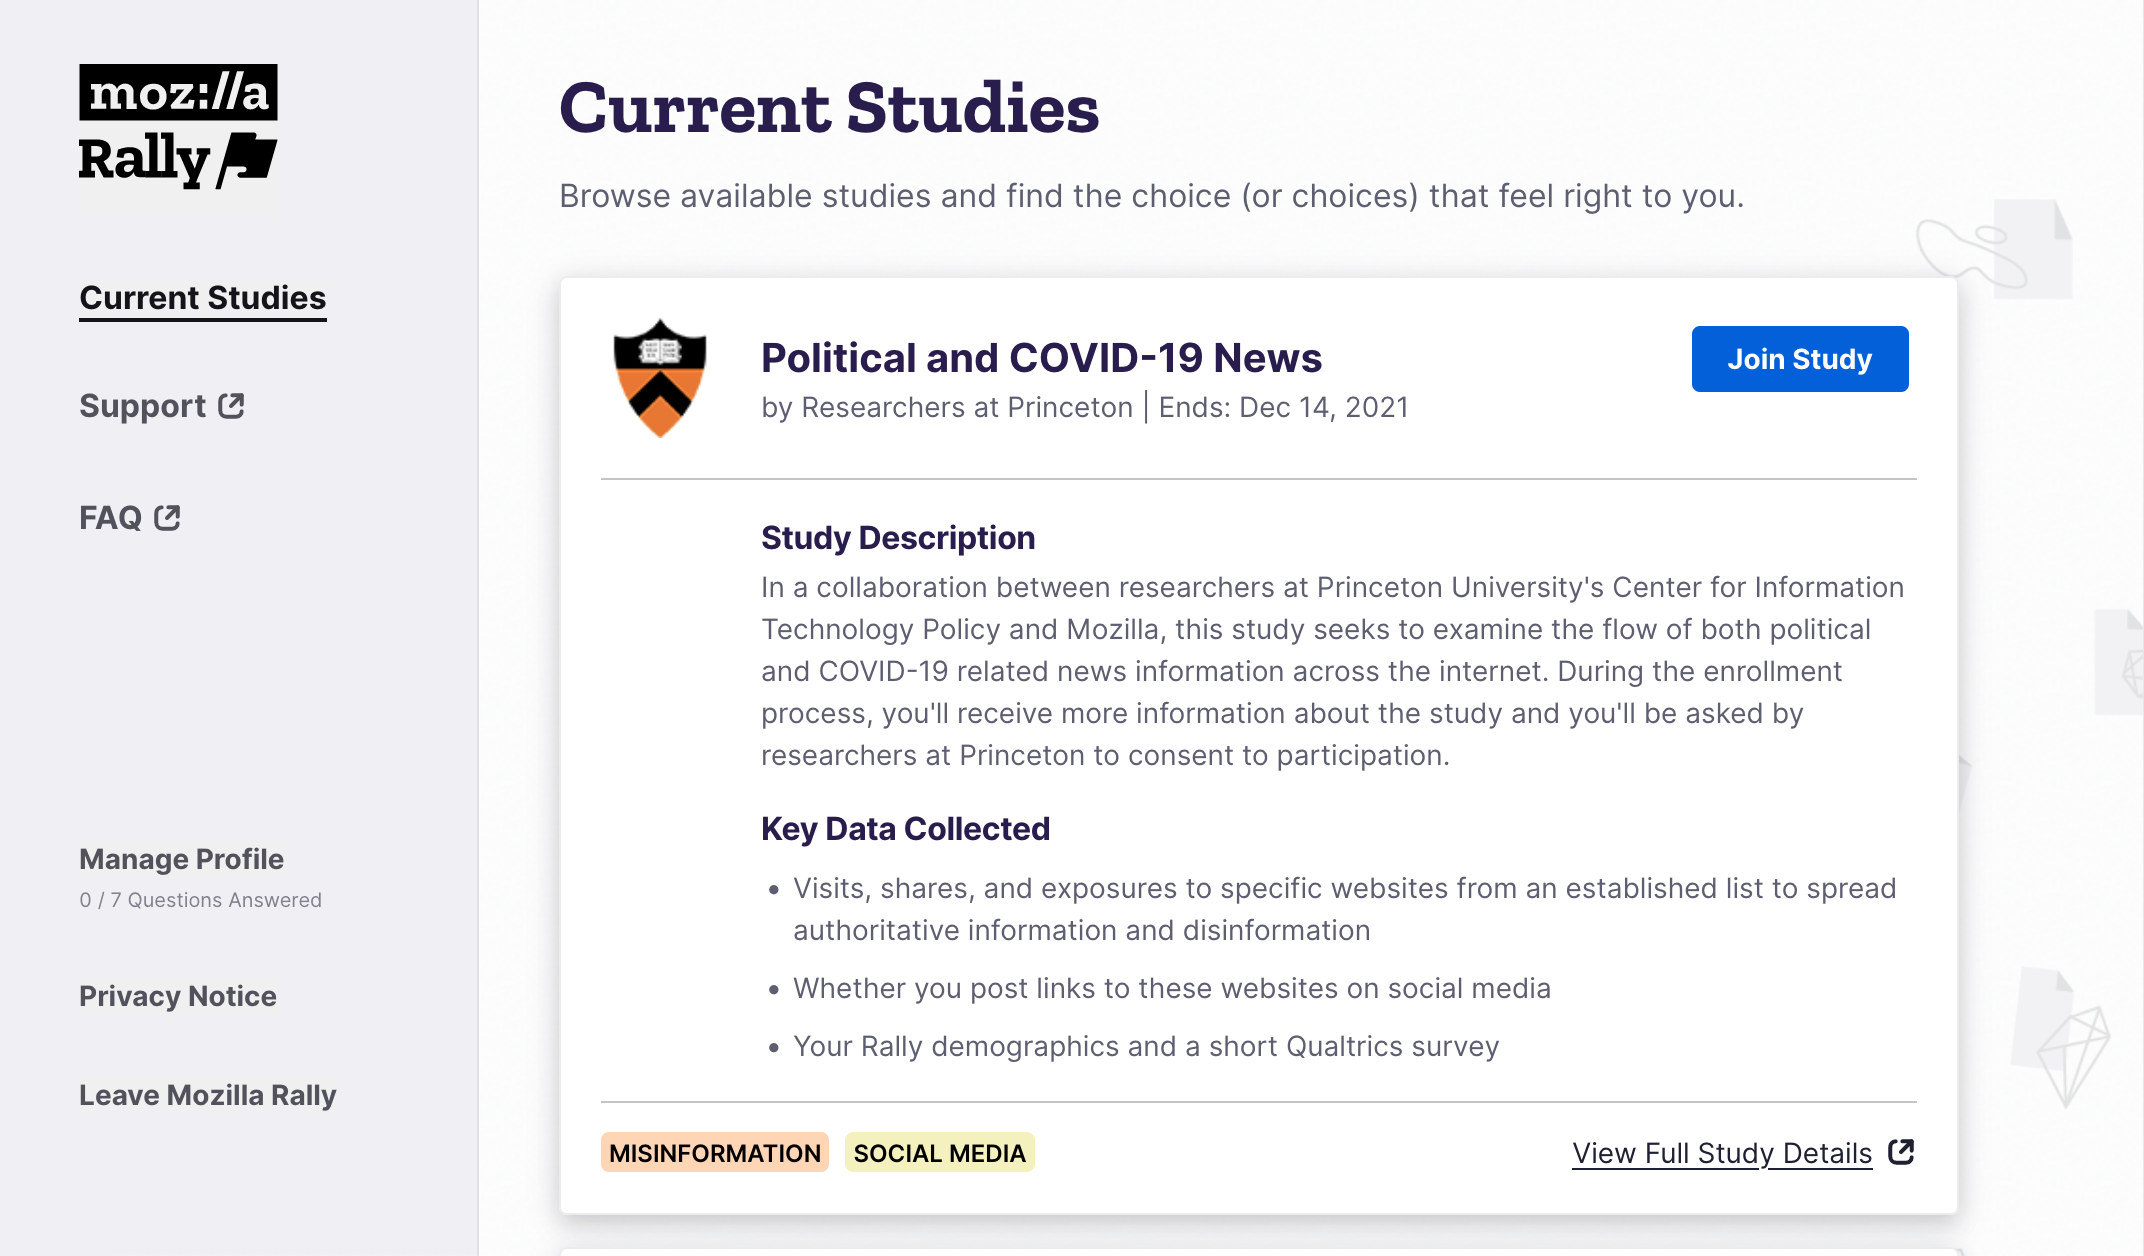
Of course, scale alone is not always enough for a useful sample. Researchers often need samples whose demographics match some larger population. Rally asks newly enrolled users to fill out a short demographic survey (Figure 7(b)), and researchers running Rally studies can use that data to understand the demographics of their participants, and if desired, rebalance their sample to achieve more representative results (see Section 9.1 for more).
5.2. Participant privacy
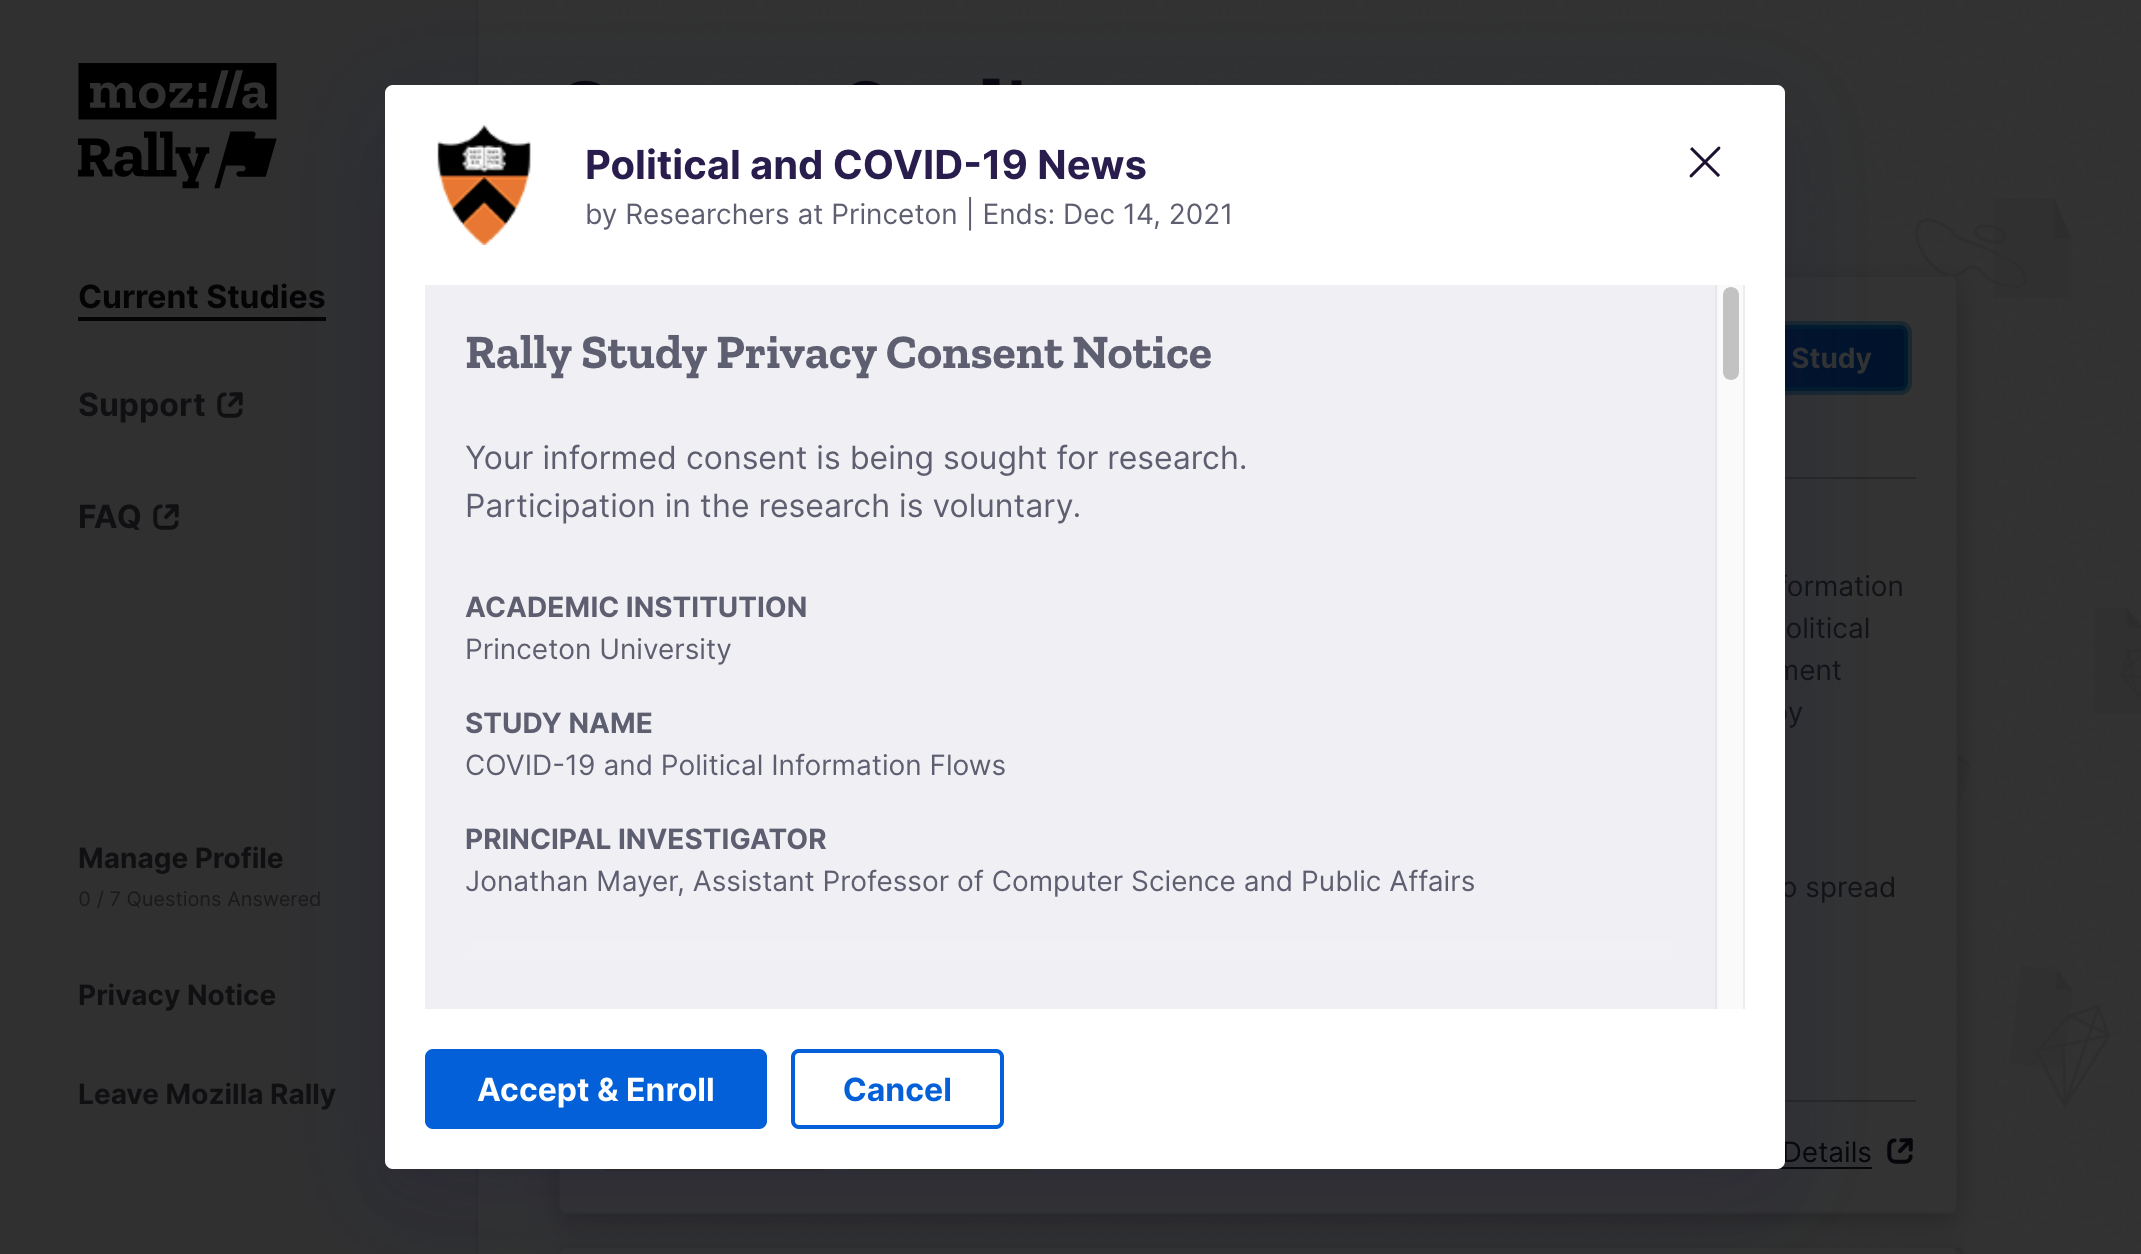
Rally both mitigates some privacy concerns of other methods and raises new privacy issues that it must address. First, as Rally is a fully opt-in system, with users affirmatively choosing to enroll first in Rally and then in each individual study they join (Figures 7(c) and 7(d)), it avoids the privacy concerns of platform partnerships or commercial panel providers: researchers control the language used and supply IRB-approved consent forms, so they can be confident that participants know they are research subjects and have given informed consent.
Given the sensitivity of the data that Rally studies can collect, researchers and Mozilla must take special care to communicate clearly with potential participants, to practice data minimization, to protect collected data in transit and in storage, and to balance the goals and risks of a study. Here, the involvement of a privacy-focused browser vendor helps research teams accomplish these tasks. Studies are subject to reviews of their goals, code, and of the specific fields of data collected. Each data point that research teams plan to collect must be labeled and its risk to users classified. The Rally data pipeline handles encrypting the data in transit and shuttling it into an access-controlled analysis environment, set up by Mozilla.
Privacy is addressed further in Sections 7 and 6.4.

5.3. Backend Infrastructure
The backend infrastructure for a browser extension-based research study must distribute the research extension to participants’ browsers, receive collected data from the extension, store it securely, and mediate researcher access. Building this infrastructure can be a barrier for independent teams.
Rally handles all of these tasks for researchers. Mozilla maintains the website that informs and enrolls participants, distributes the study extension to enrolled participants, and runs the servers that receive and store the data. The study extension reports data through Firefox’s telemetry pipeline, with Rally data encrypted such that only researchers have access.
6. WebScience
Although custom instrumentation would be useful for studying many sociotechnical problems, our survey identified that very few studies have created their own instrumentation, likely due to technical complexity. WebScience significantly reduces the technical burden of implementing measurement probes and includes instrumentation for aspects of user attention and navigation that are otherwise difficult to measure correctly across the breadth of the web. WebScience is available on GitHub. 333https://github.com/mozilla-rally/web-science It is open-source and permissively licensed.
6.1. WebScience implementation
WebScience follows the WebExtensions framework (a set of APIs for browser extensions, supported by all major desktop browsers) and can be customized for each research study that uses it (MDN Web Docs, 2021a). It can be imported into studies as a group of ES6 modules. Below, we provide brief background on WebExtensions, then describe WebSciencemodules.
6.1.1. WebExtensions Background
We leave a detailed explanation of WebExtensions to its online documentation, but the following terms will be useful in subsequent sections. Extensions have three main types of processing units: content scripts, which run in the environment of a particular webpage; background scripts, which run persistently in the extension’s own environment; and web workers, which run in separate threads and their own environment, and can be spun up and down as needed. Match patterns are regex-like strings that specify the URLs on which a content script will run.
6.2. Navigation and attention
Some of the most fundamental measurements associated with web browsing are which webpages participants visit, how they reach them, and the time they spend paying attention to them. While fundamental, these measurements are not as simple as they may appear. WebScience includes three modules that provide these measurements: page navigation, page transitions, and attention tracking.
6.2.1. Page Navigation
Most page navigation takes place when a user clicks a link or enters an address in the URL bar, causing a new page to load. Recording this type of page navigation is relatively straightforward, but not all websites follow this standard. Some websites, including popular ones like YouTube, use the History API to change the URL shown to users and manually change the DOM instead of performing traditional page loads. This means that a user experiences an apparent page navigation (the URL and page content change in response to a click), but browser instrumentation monitoring for page loads would not recognize the change as a new page.
WebScience handles this by monitoring for both types of page navigations, and simplifies them into a single API for studies to use.
In keeping with our goal of making WebScience easy to use, the code for a study to configure and run this module is short:
pageNavigation.onPageData.addListener(pageNavListener, { matchPatterns: [ "https://*.acm.org/*" ] });
The above line of code configures the module to call the study’s listener function (pageNavListener) for each page the user visits on acm.org or its subdomains. The module tracks the beginning and end of page visits (when the user navigates away, or closes the tab or browser) and notifies the study code at the completion of the visit. The notification includes the URL, the referrer, the starting and ending timestamps, a unique ID, and information about the user’s engagement with the page (see section 6.2.3).
Another issue addressed by this module is coordinating measurements across different collection points. Some information, such as specific page contents, is only available to content scripts. Other data, such as the content of network requests, is accessible in background scripts. Understanding the full context of a user action may require combining information from these environments and associating measurements with the correct page visit (race conditions around page or tab transitions add complexity to this task). Unfortunately, the browser does not provide a mechanism to reliably link measurements from the content script and background script environments. The Page Navigation module assigns unique IDs to each page visit, and makes those IDs available to other modules in both the content and background script environments. This allows study code to reliably correlate measurements from separate modules and collection points.
| WebScience | |||
| Conventional Measures | |||
6.2.2. Page Transitions
Understanding user browsing often requires knowing how participants arrived at a particular webpage. In the past, the referrer field set by browsers provided this, listing the URL the user visited before the current page. However, browsers have moved to allow sites to limit or omit this value, and more recently have limited it by default, citing legitimate privacy concerns (Lee and Kerschbaumer, 2021; MDN Web Docs, 2021b). Referrers are therefore no longer necessarily an accurate source for understanding navigation.
Researchers who collect browsing histories or page loads from users (as commercial panel providers often supply) have often taken the order of pages visited as a proxy for how a user travelled between pages. However, since users may have many tabs open and move between them, knowing that page A loaded before page B does not mean that the user clicked a link on A to get to B — instead, they may have been in separate and unrelated tabs.
WebScience directly monitors the source of page navigations and provides the WebScience-assigned ID of the page visit where the participant followed a link. This allows study code to consider page navigations as a directed acyclic graph (DAG), where nodes are page visits and edges connect a node to any page visits it generated.
As an example, consider the page visit to http://www.c.com/ in Figure 8. The participant navigated to http://www.c.com/ from a link on http://www.a.com/. A measurement that only considered page load times would incorrectly identify http://www.b.com/ as the page that linked the user to http://www.a.com/, because the page load of http://www.b.com/ directly preceded http://www.a.com/. The Page Transitions module would correctly report that http://www.a.com/ was the prior page for the http://www.c.com/ visit.
6.2.3. Attention Tracking
Another commonly needed measurement is user engagement with pages.
Previous methods of tracking attention often monitor dwell time: the length of time between navigating to and leaving a site. Since users can pause browsing and pick back up later, or can leave page open for a long time while working in another tab, dwell time can both under- and over-estimate user attention.
Studies that collect browser histories for research have used the timespan between page loads to estimate attention, positing that if a user loads site A at time and later loads site B at time , they were on site A for time. However, users may leave sites open in background tabs and return to them after navigating elsewhere, so this method may underestimate attention to pages.
WebScience measures attention by directly accumulating the time a user is actively visiting a page. We define the active page by checking whether a browser window is the selected window on the system, and if so, finding the selected tab within that window. For each page the participant visits, we accumulate the total time the page is the active page, pausing the clock when the mouse and keyboard input indicate that the user appears to have stepped away from the computer or otherwise disengaged.
The importance of actively measuring attention is visible in Figure 8. When the participant clicks tab 1 to switch back to that tab, WebScience pauses attention tracking for http://www.b.com/, which is open in tab 2. Conventional methods would treat the loading of http://www.b.com/ as the end of the user’s visit to http://www.a.com/ and record 30 seconds spent on http://www.a.com/. WebScience correctly computes the attention duration for http://www.a.com/ as 75 seconds. Conventional methods would include the additional 45 seconds spent on http://www.a.com/ the next time a page load occurs, so they would model the user as spending 62 seconds on http://www.b.com/ while WebScience correctly records 17 seconds.
6.3. Social Media Activity
Many Internet phenomena occur on social media platforms, but these companies can be particularly unwilling to share data with researchers, and their public APIs are often severely lacking (Edelson and McCoy, 2021; Perriam et al., 2020). Creating instrumentation to measure activity on these sites is quite difficult, as their code is usually obfuscated, and sometimes actively hostile to comprehension. Many protections appear to be intended to defeat ad-blockers, but also make instrumentation difficult. WebScience includes two modules that interface with social media sites and allow researchers to collect data easily. The Social Media Activity module provides a simple and powerful API for researchers to collect data about actions the user takes on social media sites. The module can watch for events from Facebook, where it tracks posts, shares, emoji reactions, and comments; Twitter, where it tracks tweets (including quote tweets), retweets, and favorites; and Reddit, where it tracks posts, comments, and votes. When a researcher configures Social Media Activity, they specify which platforms and events to track.
This module also provides functions for fetching more information about posts on social media platforms.
6.3.1. Social Media Link Sharing
To simplify the process of tracking link shares on social media, we provide the Social Media Link Sharing module. This module uses Social Media Activity to specifically track “link sharing” events: any time a user shares a link on social media, including making new posts that contain links as well as sharing existing posts that contain links. Studies configure the module with a set of match patterns for URLs of interest. The module tracks the total number of links shared as well as provides full information (including URL, timestamp, platform, sharing action, audience, and whether the post was original or a reshare) about shared links in the match pattern set.
A selection of additional modules are briefly described in section A.4
6.4. Reporting Data
Even once participants have understood the parameters of a study and consented to participate, researchers have a responsibility to collect the smallest amount of data possible to answer the research questions. Many collection mechanisms simply give researchers all of the potentially relevant (or even obviously irrelevant) data, because determining relevancy in an automated fashion is difficult.
We have designed WebScience to enable and encourage good data minimization.
Studies configure modules to collect their desired data, and then store the results of that measurement in the browser to be later transmitted to the analysis environment. Modules produce detailed information, but studies reduce the specificity of that data before transmission by completing analysis on the participant’s computer and by aggregating events.
While the exact analysis and aggregation steps are determined by individual studies, we include two examples here to illustrate how Rally allows researchers to collect useful data while minimizing risks.
6.4.1. Local Analysis
Since studies run directly on participants’ computers, they can complete some data analysis before transmitting the data, and send only the result of the analysis. As an example, one currently running study uses news articles read by the participant as input to an NLP classifier entirely in-browser, and then reports only the binary output of the classifier. Researchers receive the necessary information about the articles without ever collecting the URL, title, or content.
6.4.2. Aggregation
The other way that studies can reduce the specificity of the data they transmit is to aggregate individual data points into categories of related data points, and then transmit information about the categories.
The study collects raw events for a period of time, perhaps several days, then aggregates the events into categories and reports the categories and how many events fell into each category. By reducing the specificity of the data, we reduce the risk that actions can be traced back to individual users.
In keeping with our goal of making WebScience accessible to researchers across disciplines, we include a module that automates aggregating data. By providing a module with default settings that protect participants’ privacy, we make respecting privacy easier than over-collecting data.
7. Privacy
Rally has the potential to collect a great deal of information, possibly including sensitive personal information, from its participants. Rally does not collect names, email addresses, or other directly identifiable information from participants. However, previous research has shown that simply omitting identifiers from data is not sufficient to protect the identities of the subjects (Narayanan and Shmatikov, 2008). Therefore, Rally must take additional active steps to reduce the risks to study participants, as described below.
7.1. Opt-in
Rally is a fully opt-in program. The entry point for Rally is a webpage describing the program where users can choose to enroll. Each study that runs through Rally requires an additional opt-in step and participants can also leave any study, or the Rally program entirely, at any point.
7.2. Data Deletion
When a user leaves before the official end of the study, Mozilla deletes raw data from that user from the storage servers. Rally retains raw data for researchers for a maximum of two years after collection. Researchers may retain higher level aggregated data for analysis.
7.3. Informed Consent
Rally studies by academic researchers must receive IRB approval at the researcher’s institution and develop an informed consent document. Studies run by journalists or other non-academic researchers must also generate an informed consent document for participants. In both cases, the document describes the purpose of the study, the data collected, and how that data will be stored and accessed. This document is presented to participants before they can choose to join the study, and they must indicate agreement before being able to join. Participants can return to the informed consent document at any point during the study.
7.4. Data Minimization
WebScience is designed to encourage minimizing the amount and granularity of the data collected. All modules that collect data about websites must be configured by researchers, who supply a set of match patterns for which the module should collect data. This limits the collection to the set of sites that researchers care about for a particular study, rather than automatically recording data for all sites. Many other methods of data collection automatically collect all of the user’s traffic, picking up sensitive page visits that aren’t relevant to the study’s goals. Limiting collection to only the relevant data significantly reduces the risk to participants.
Further, rather than transmitting raw data, such as full URLs and timestamps, studies can aggregate data into broader categories, and send a description of the category and the number of raw events that fell into it. By ensuring that raw data never leaves participants’ computers, we reduce the risk that they can be identified by researchers or have personal information leaked. WebScience provides a module that automates aggregating data, which researchers can customize for each study’s needs.
7.5. Lack of Persistent Identifiers
Studies transmit data periodically to Mozilla’s servers, and researchers will often need to connect reports from the same user throughout time. To facilitate this need, participants are assigned a per-study identifier. However, this identifier is unique for each study, separate from any other systems in Firefox, and not available to other parts of the browser. This protects users from being identified.
7.6. Access Controls
Data is encrypted with a study-specific key before it is sent from the participant’s computer to Mozilla’s servers. It is only decrypted once it reaches the access-controlled analysis environment controlled by Mozilla and open only to researchers involved with the study. This restricts the audience at Mozilla that can view it, as well as prevents snooping while the data is in transit. Automated exfiltration detection prevents researchers or others from exporting large amounts of data.
7.7. Study Review
Finally, all studies are reviewed, first in concept and then in implementation, by Mozilla. This review ensures that studies collect reasonable data from users, that the informed consent document is correct and clear, and that the study’s implementation does not present security or usability risks. This review also considers research ethics: whether the proposed study is likely to produce improvements to our understanding of technology and society problems, while maintaining minimal privacy risks to participants.
8. Evaluation
Rally is actively deployed. Four research teams have launched studies, all using WebScience, and several more are in development. Based on this usage, we present three evaluations: a case study previewing an active Rally study (Section 8.1), a quantitative evaluation comparing WebScience measurements to prior methods (Section 8.2), and qualitative findings from semi-structured interviews of researchers, engineers, and investigative journalists who have used Rally and/or WebScience to launch studies (Section 8.3).
8.1. Study Preview: Pathways to Political and COVID-19 News
Researchers, policymakers, and civil society groups have voiced concerns for over a decade about the proliferation of misinformation online and the potentially dangerous consequences for politics, democracy, and society (Lewandowsky et al., 2017). Concerns in the U.S. have focused on misinformation about politics and health, especially during the COVID-19 pandemic, when dangerous false claims about vaccine safety, off-label treatments, and other issues circulated widely and hindered public health efforts (Cinelli et al., 2020).
Prior work has measured how much news and misinformation users engage with by using data collected from platform APIs (Grinberg et al., 2019; Allcott et al., 2019; Yang et al., 2021; Singh et al., 2020; Bovet and Makse, 2019), data scraped from platforms (Samory and Mitra, 2018), data received through platform partnerships (Guess et al., 2021; Bailey et al., 2021), data purchased from commercial panel providers (Altay et al., 2022; Guess et al., 2020), and self-reported data from surveys and interviews with users. As discussed in Section 2.2, these methods come with significant research design constraints and ecological validity limitations.In particular, most studies have focused on just one or two platforms, because researchers have lacked practical methods to study engagement across the wide array of services through which users might access news and misinformation, including social media, search, email, web portals, news aggregators, and publishers’ websites.
We designed a Rally study using WebScience to measure user engagement with political and health-related news and misinformation across the web. Our study addresses the questions:
-
RQ1
On what sites are desktop browser users being exposed to links to news and disinformation sites, and how frequent are these exposures compared to exposures to other sites?
-
RQ2
How often do desktop browser users visit news websites and misinformation websites, what types of pages do they visit, and how long do they pay attention to those pages?
-
RQ3
How often do desktop browser users share links to news and disinformation websites on social media when using desktop browsers, what types of pages do they share, and to what audiences?
-
RQ4
How are exposure, visits, and sharing of news and misinformation correlated?
-
RQ5
How do user demographics and political views correlate with news and misinformation engagement?
8.1.1. Study Design
Using WebScience, we created a browser extension that collects data whenever the user shares, visits, or sees a link to a news, health, or misinformation website. During six months of data collection between March 20, 2022 and September 14, 2022, 2,709 Rally users joined the study and reported data at least once. Below we briefly describe our methods and present sample data. Note that this study is an independent research project, so a full explanation of the motivation, goals, methods, and results is left to the project’s own paper.
Methods
Drawing from public datasets and prior work, we compiled lists of domains for each category of website we planned to track: news outlets, health information websites, websites known to spread misinformation, social media platforms, search engines, webmail services, web portals, fact checkers, and news aggregators. When a link to a tracked news, health, or misinformation website is exposed to a user, we collect the domain where the exposure occurred and the exposed domain. When a user visits a tracked news, health, or misinformation website, we collect the source and destination domains and measures of user attention to the page. We also run an in-browser classifier that derives features from the URL, page title, and page content to predict the type of the visited page: political news article, health-related article, an article about something other than politics or health, or a non-article. Each time a user shares a tracked news, health, or misinformation link on Facebook, Twitter, or Reddit, we collect the platform name, the domain shared, and information about how and to what audience the link was shared. We also store a flag indicating whether we observed the user visiting the link prior to sharing it. For untracked domains (those that do not appear on any of our lists), we collect aggregate counts of exposures, visits, and shares so that we can compute base rates. We never collect the domain name of an untracked website. For social media, search, webmail, web portals, fact checkers, and news aggregators, we collect the domain name only if it is the source of a visit or exposure to a news, health, or misinformation website.
8.1.2. Sample Study Data
Figure 9 presents preliminary data on how often participants were exposed to links to news, health, misinformation, and other types of domains. Note that this preliminary data comes from a small convenience sample, and as such has significant unmeasured bias. For the full-scale study, we plan to construct a larger, more representative population sample.
Figure 9 shows how many users were exposed to news, health, and misinformation domains, segmented by the type of domain where the exposure occurred. The data indicates that search domains exposed more users to news and misinformation links than did any other type of domain, including social media. It also shows that many users browsing news websites were exposed to misinformation links at least once.
Figure 9 presents an alternate view of the same data: the proportion of exposures to each type of domain, segmented by the type of domain where the exposure occurred. Exposures to domains other than news, health, and misinformation dominate in all segments. Misinformation domains are the only segment where misinformation exposures represent a noticeable proportion of link exposures (1.49%); in all other categories they are less than 0.5% and do not register visually on the bar chart. This contextualizes Figure 9: although in many segments users were likely to have at least one exposure to a misinformation domain, on average misinformation exposure was rare.
8.2. Comparison to Conventional Browser Measurements
Following our development of WebScience, we chose two user phenomena for which to compare our instrumentation in WebScience to commonly used methods: user attention to webpages, and the navigation path between websites.
We evaluated several methods of measuring attention and navigation by implementing each method in the study described above and reporting the measured value from each method for each page visit.
This section of the analysis is based on a sample of 1,817 users who submitted these measures from August 16, 2022 until September 14, 2022, covering a total of 4,466,200 unique page visits.
8.2.1. Attention Measures
We compared four methods of measuring user attention (see section 6.2 for more about these methods):
-
(1)
Our attention model in WebScience, which tracks the focused tab and window, as well as whether the user is active or idle.
-
(2)
A model using dwell time, the interval between a page loading and unloading.
-
(3)
A model using the interval between subsequent page loads.
-
(4)
A simplified attention model, which uses dwell time but accounts for intervals where the webpage is unfocused or not visible to the user.
Data format and pre-processing. Our study extension reported, for each page visit, the amount of attention time measured by each method in milliseconds.
When comparing two methods, we first discarded any page visits for which we did not receive a value from both methods.
For the measure based on load interval, we followed the convention in literature and capped measured attention at 30 minutes.
We then compared each method to WebScience by calculating the error () for each method () on each page visit (). Below, is the attention time measured by method on page .
Results. Table 6 shows the proportion of visits with error at least 1%, 10%, and 25%, for each method. Both dwell time and load interval, the most common methods in conventional browser-based research, differ from the WebScience method by at least 25% for more than one third of page visits.
| Proportion of visits where | |||
| Method () | |||
| Dwell time | 66.6% | 48.3% | 38.2% |
| Load interval | 63.7% | 46.2% | 36.7% |
| Simple attention | 60.7% | 34.5% | 21.1% |
Dwell time and load interval are both more accurate when the user’s browsing is linear: the user opens a page, browses for a time, then closes the page and opens another. In the days before browsers supported and encouraged multiple windows and many tabs, users did tend to browse linearly. However, the modern web browser is different.
We hypothesized that younger users would make heavier use of this feature, resulting in more error. We separated the page visits into categories based on the age group that the participant provided in Rally’s demographic survey. The amount of error was not consistent across groups, and decreased as the participant’s age increased, as seen in Figure 10. Further confirming that this effect is due to younger participants’ use of tabs is the flat error for the simple attention model. By accounting for the time that a page is invisible to the participant, it avoids being led astray by background tabs.
Additional comparisons of attention methods are available in section A.5.
Attention measurements based on dwell time and load interval have been useful historically, but their differential performance for different users points towards the growing need for more fine-grained measurements.
8.2.2. Logical Referrers
We compared four methods of measuring the logical referrer (i.e., the page on which the participant clicked a link to load a new page) of a page visit:
-
(1)
Our tracking method in WebScience, which considers multiple sources of information about how a page load occurred.
-
(2)
A method based on page load order, which takes the chronologically-previous page as the logical referrer of the next.
-
(3)
A method based on HTTP referrers, which uses the referrer listed in the header as the logical referrer of the page load.
-
(4)
A method based on browser history, which searches the built-in history to find a page’s logical referrer.
For more detail, see section 6.2.2.
Data format and pre-processing. The study extension collected the logical referrer reported by each method on each page visit. To avoid collecting the raw URLs that participants visited while preserving our ability to compare the methods, the extension standardized the URLs and then reported pairwise comparisons of equality.
Again, we followed the convention in literature and dropped the logical referrer reported by the load order method when the previous page had loaded more than 30 minutes prior.
Pages do not always have a logical referrer—for example, when the participant types a new URL, no page can be reasonably identified as cause of the new page load. Therefore, to compare each pair of methods, we divided the visits into categories based on whether neither, one, or both methods had measured a logical referrer. For visits where both methods reported a value, we used our pairwise comparisons of equality to measure how often the methods found the same value.
Results. Figure 11 reports the results of the methods.
The privacy improvements made to the HTTP referrer result in a clear disadvantage when it is used to measure logical referrers: the lack of path in the URL means it loses information when compared to methods without this limitation. Both the load interval and history methods report the same URL as the WebScience instrumentation most of the time: 63.3% of the time for load interval, and 49.8% for history.
8.3. Qualitative User Study
We conducted a user study of members of three other research teams that have used WebScience and Rally to launch browser-based studies. We designed our study with the following goals:
-
(1)
Understand why researchers chose Rally and WebScience for their studies over alternative tools and methods
-
(2)
Evaluate the usability of Rally and how researchers view its strengths and limitations as a platform for browser-based studies
-
(3)
Evaluate the usability and feature completeness of WebScience and its strengths and limitations as a library for implementing browser-based studies
8.3.1. Methods
We recruited five participants: two researchers, a data scientist, an engineer, and a journalist, all of whom had used Rally and WebScience to launch studies. We conducted 30-minute semi-structured interviews with each participant, asking questions about the participant’s professional background, their study, and their experience with and opinions of various aspects of Rally and WebScience.444See Section A.3 for the interview guide. In each interview, one researcher led discussion and a second researcher took notes. After all interviews were complete, two researchers independently open coded the notes from each interview using Taguette (Rampin and Rampin, 2021), then collaboratively reviewed and condensed codes, grouped codes into categories, and identified key themes within categories.
8.3.2. Key Findings
Studies
Participants’ Rally studies examined self-preferencing by tech platforms, drivers of news consumption, and the pervasiveness of user tracking online. All three studies relate to technology policy issues with significant ongoing debate and policy activity. One participant stated that their intention for their Rally study was ”grounding policy debate about this issue in evidence.”
Choosing Rally and WebScience
When asked why they chose Rally and WebScience over alternative methods, four participants cited the vantage point of the browser as a key benefit. One participant characterized this as allowing researchers to ”see what the user is seeing,” and another said Rally and WebScience allowed them to ”get people’s real-world data about how they use the internet.” They contrasted this vantage point with the limited perspectives of methods like network traffic interception, laboratory studies, and mathematical modeling.
Two participants identified the granularity of the data they were able to collect with WebScience as a benefit over the aggregate data that would be typically provided by commercial browsing panels. One participant had developed custom browser instrumentation for prior studies, and cited the rigor and high quality of WebScience’s instrumentation and the availability of research infrastructure and support as benefits over purpose-built tooling.
Proposing a Rally study
We asked participants to rate their satisfaction with the Rally study proposal process on a scale from 1 (extremely dissatisfied) to 5 (extremely satisfied). Two participants rated the proposal process a 5. Two other participants rated it a 3, citing the large number of stakeholders involved with studies and the long lead time before receiving approval as challenges. One of these participant also stated that the proposal process strengthened the project by requiring a detailed research design up front and ”making clear what data was necessary to collect.”
Building a population sample
Four participants noted limitations of their population samples. They observed that the samples were demographically homogeneous, nonrepresentative, and limited by only including desktop browser users. One participant said they had enrolled about 5,000 users despite hoping for 100,000, and that their recruitment campaigns were hindered by a ”cumbersome” signup process for users.
Two participants who noted limitations were nonetheless extremely satisfied with their sample. Their study was designed to ”surface leads” and find ”things we should look into more,” so a large, representative sample was not necessary. One of these participants said ”within a couple of weeks we had thousands of people” and that there was ”not much to worry about.”
Privacy and consent
All participants said they were extremely satisfied with how Rally handled participant privacy. Three participants cited [Mozilla’s] expertise and reputation for privacy; one said they were ”very happy with the level of thought [Mozilla] put in, because we would have to do it ourselves otherwise.” One participant noted that the data analysis environment was tightly controlled and ”careful of data flows.” They also said they were encouraged by Rally’s emphasis on client-side processing ”to prevent stuff being transmitted to the server, as data we interact with is quite sensitive.”
Two participants mentioned Rally’s thorough process for informing users about study details and receiving consent; one said ”it’s very important, when looking at this with real users, to have actual informed consent where people have agreed to this unequivocally.”
Rally infrastructure
When asked to rate their satisfaction with Rally’s reporting and analysis infrastructure on a scale from 1 (extremely dissatisfied) to 5 (extremely satisfied), two participants rated it a 5, one rated it a 4, and one rated it a 3. The less satisfied participants noted that the analysis environment was difficult for non-technical team members to use and that using Jupyter Notebook was ”frustrating” at times because it was ”not meant for be-all, end-all access to data.” One participant suggested adding additional analysis tools to the environment, such as graphical dashboards for generating queries.
Using WebScience
Two participants had firsthand experience using WebScience to develop their studies, and both were extremely satisfied with the library, rating it a 5. Both participants appreciated the reusable instrumentation; one said ”timing and navigation measurements were straight out of the WebScience box and they worked really well.” The participants found the library easy to use, even though they had never developed a browser extension before. When encountering development challenges, the participants said they used the library’s documentation, examined the code directly to understand the APIs, and received prompt support when reaching out to WebScience developers with questions. One participant said the study template was a valuable resource because they ”got it up and running to watch data flow live and use that as a development environment.” Both participants also extended the library with custom measurements, which were ”more complicated and time consuming.”
9. Future Work
We expect for the Rally program to grow beyond the academic research and journalism groups currently running studies, with more partnered researchers and many more studies.
9.1. Scale and Representativeness
To be of use to researchers across disciplines, Rally will need to provide large samples that are representative of the populations researchers desire to study.
9.1.1. Representativeness
It is unlikely that the fully self-selected group of participants who join Rally will be representative of the target population across all demographic factors. Some studies may not require a demographically-representative sample of participants. For those that do, there are a few options. First, studies can use data from the demographic survey collected by Mozilla, or an additional study-specific survey, to perform iterative proportional fitting, resulting in data that is fitted to the target population (Lomax and Norman, 2016).
Second, studies are not limited to recruiting users exclusively from the Rally userbase. Especially for studies that aim to research particular groups, researchers can recruit users with other methods, such as mailing lists or fliers.
Finally, as Rally grows, Mozilla may recruit a nationally-representative panel of users who are paid to participate in studies. Studies could choose to pull from this pool of participants.
9.1.2. Scale
As noted above, Mozilla is exploring recruiting a paid panel of users to participate in Rally. In addition, Mozilla is continuing to experiment with forms of in-browser promotion for Rally.
10. Conclusion
Browser-based crowdsourced research allows researchers to collect data from real users, acting in their real-world environments, interacting with the platforms that shape society. We have developed Rally and WebScience, a platform and toolkit that simplify and expand access to creating and running crowdsourced browser-based research studies. Together, they drastically reduce the barriers to studying problems at the interaction of technology and society.
References
- (1)
- Ali et al. (2019) Muhammad Ali, Piotr Sapiezynski, Miranda Bogen, Aleksandra Korolova, Alan Mislove, and Aaron Rieke. 2019. Discrimination through Optimization: How Facebook’s Ad Delivery Can Lead to Biased Outcomes. Proc. ACM Hum.-Comput. Interact. 3, CSCW, Article 199 (Nov. 2019), 30 pages. https://doi.org/10.1145/3359301
- Allcott et al. (2019) Hunt Allcott, Matthew Gentzkow, and Chuan Yu. 2019. Trends in the diffusion of misinformation on social media. Research & Politics 6, 2 (2019), 2053168019848554. https://doi.org/10.1177/2053168019848554
- Altay et al. (2022) Sacha Altay, Rasmus Kleis Nielsen, and Richard Fletcher. 2022. Quantifying the “infodemic”: People turned to trustworthy news outlets during the 2020 coronavirus pandemic. Journal of Quantitative Description: Digital Media 2 (2022).
- Araujo et al. (2017) Theo Araujo, Anke Wonneberger, Peter Neijens, and Claes de Vreese. 2017. How Much Time Do You Spend Online? Understanding and Improving the Accuracy of Self-Reported Measures of Internet Use. Communication Methods and Measures 11, 3 (2017), 173–190. https://doi.org/10.1080/19312458.2017.1317337
- Bailey et al. (2021) Aydan Bailey, Theo Gregersen, and Franziska Roesner. 2021. Interactions with Potential Mis/Disinformation URLs Among US Users on Facebook, 2017-2019. In Proceedings of the ACM SIGCOMM 2021 Workshop on Free and Open Communications on the Internet. 16–26.
- Bak-Coleman et al. (2021) Joseph B. Bak-Coleman, Mark Alfano, Wolfram Barfuss, Carl T. Bergstrom, Miguel A. Centeno, Iain D. Couzin, Jonathan F. Donges, Mirta Galesic, Andrew S. Gersick, Jennifer Jacquet, Albert B. Kao, Rachel E. Moran, Pawel Romanczuk, Daniel I. Rubenstein, Kaia J. Tombak, Jay J. Van Bavel, and Elke U. Weber. 2021. Stewardship of global collective behavior. Proceedings of the National Academy of Sciences 118, 27 (2021). https://doi.org/10.1073/pnas.2025764118
- Bakshy et al. (2015) Eytan Bakshy, Solomon Messing, and Lada A. Adamic. 2015. Exposure to ideologically diverse news and opinion on Facebook. Science 348, 6239 (2015), 1130–1132. https://doi.org/10.1126/science.aaa1160
- Baumgartner et al. (2020) Jason Baumgartner, Savvas Zannettou, Brian Keegan, Megan Squire, and J. Blackburn. 2020. The Pushshift Reddit Dataset. In ICWSM.
- Bentley et al. (2019) Frank Bentley, Katie Quehl, Jordan Wirfs-Brock, and Melissa Bica. 2019. Understanding Online News Behaviors. In Proceedings of the 2019 CHI Conference on Human Factors in Computing Systems (Glasgow, Scotland Uk) (CHI ’19). Association for Computing Machinery, New York, NY, USA, 1–11. https://doi.org/10.1145/3290605.3300820
- Bovet and Makse (2019) Alexandre Bovet and Hernán A Makse. 2019. Influence of fake news in Twitter during the 2016 US presidential election. Nature communications 10, 1 (2019), 1–14.
- Chaney et al. (2018) Allison J. B. Chaney, Brandon M. Stewart, and Barbara E. Engelhardt. 2018. How Algorithmic Confounding in Recommendation Systems Increases Homogeneity and Decreases Utility. In Proceedings of the 12th ACM Conference on Recommender Systems (Vancouver, British Columbia, Canada) (RecSys ’18). Association for Computing Machinery, New York, NY, USA, 224–232. https://doi.org/10.1145/3240323.3240370
- Cheng et al. (2016) Heng-Tze Cheng, Levent Koc, Jeremiah Harmsen, Tal Shaked, Tushar Chandra, Hrishi Aradhye, Glen Anderson, Greg Corrado, Wei Chai, Mustafa Ispir, Rohan Anil, Zakaria Haque, Lichan Hong, Vihan Jain, Xiaobing Liu, and Hemal Shah. 2016. Wide and Deep Learning for Recommender Systems. In Proceedings of the 1st Workshop on Deep Learning for Recommender Systems (Boston, MA, USA) (DLRS 2016). Association for Computing Machinery, New York, NY, USA, 7–10. https://doi.org/10.1145/2988450.2988454
- Ciampaglia et al. (2018) Giovanni Luca Ciampaglia, Azadeh Nematzadeh, Filippo Menczer, and Alessandro Flammini. 2018. How algorithmic popularity bias hinders or promotes quality. Scientific reports 8, 1 (2018), 1–7.
- Cinelli et al. (2020) Matteo Cinelli, Walter Quattrociocchi, Alessandro Galeazzi, Carlo Michele Valensise, Emanuele Brugnoli, Ana Lucia Schmidt, Paola Zola, Fabiana Zollo, and Antonio Scala. 2020. The COVID-19 social media infodemic. Scientific Reports 10, 1 (Oct. 2020). https://doi.org/10.1038/s41598-020-73510-5
- Conway (2017) Maura Conway. 2017. Determining the Role of the Internet in Violent Extremism and Terrorism: Six Suggestions for Progressing Research. Studies in Conflict & Terrorism 40, 1 (Jan. 2017), 77–98. https://doi.org/10.1080/1057610X.2016.1157408 Publisher: Routledge.
- de Vreese et al. (2019) Claes de Vreese, Marco Bastos, Frank Esser, Fabio Giglietto, Sophie Lecleher, Barbara Pfetsch, Cornelius Puschmann, Rebekah Tromble, Gary King, and Nathaniel Persily. 2019. Public statement from the Co-Chairs and European Advisory Committee of Social Science One. (2019). https://socialscience.one/blog/public-statement-european-advisory-committee-social-science-one
- Edelson and McCoy (2021) Laura Edelson and Damon McCoy. 2021. Opinion | We Research Misinformation on Facebook. It Just Disabled Our Accounts. The New York Times (Aug. 2021). https://www.nytimes.com/2021/08/10/opinion/facebook-misinformation.html
- Edelson et al. (2021) Laura Edelson, Minh-Kha Nguyen, Ian Goldstein, Oana Goga, Damon McCoy, and Tobias Lauinger. 2021. Understanding Engagement with U.S. (Mis)Information News Sources on Facebook. In Proceedings of the 21st ACM Internet Measurement Conference (Virtual Event) (IMC ’21). Association for Computing Machinery, New York, NY, USA, 444–463. https://doi.org/10.1145/3487552.3487859
- Edelson et al. (2019) Laura Edelson, Shikhar Sakhuja, Ratan Dey, and Damon McCoy. 2019. An Analysis of United States Online Political Advertising Transparency. (Feb. 2019). https://arxiv.org/abs/1902.04385v1
- Engler (2021) Alex Engler. 2021. Platform data access is alynchpin of the EU’s Digital Services Act. Brookings (2021). https://www.brookings.edu/blog/techtank/2021/01/15/platform-data-access-is-a-lynchpin-of-the-eus-digital-services-act/
- Faife and Ng (2021) Corin Faife and Alfred Ng. 2021. Credit Card Ads Were Targeted by Age, Violating Facebook’s Anti-Discrimination Policy – The Markup. https://themarkup.org/citizen-browser/2021/04/29/credit-card-ads-were-targeted-by-age-violating-facebooks-anti-discrimination-policy
- Farke et al. (2021) Florian M Farke, David G Balash, Maximilian Golla, Markus Dürmuth, and Adam J Aviv. 2021. Are Privacy Dashboards Good for End Users? Evaluating User Perceptions and Reactions to Google’s My Activity. In 30th USENIX Security Symposium (USENIX Security 21). 483–500.
- Fernández et al. (2021) Miriam Fernández, Alejandro Bellogín, and Iván Cantador. 2021. Analysing the Effect of Recommendation Algorithms on the Amplification of Misinformation. arXiv:2103.14748 [cs] (March 2021). http://arxiv.org/abs/2103.14748 arXiv: 2103.14748.
- Fiesler et al. (2017) Casey Fiesler, Michaelanne Dye, Jessica L. Feuston, Chaya Hiruncharoenvate, C.J. Hutto, Shannon Morrison, Parisa Khanipour Roshan, Umashanthi Pavalanathan, Amy S. Bruckman, Munmun De Choudhury, and Eric Gilbert. 2017. What (or Who) Is Public? Privacy Settings and Social Media Content Sharing. In Proceedings of the 2017 ACM Conference on Computer Supported Cooperative Work and Social Computing (CSCW ’17). Association for Computing Machinery, New York, NY, USA, 567–580. https://doi.org/10.1145/2998181.2998223
- Gaffney and Matias (2018) Devin Gaffney and J. Nathan Matias. 2018. Caveat emptor, computational social science: Large-scale missing data in a widely-published Reddit corpus. In PLoS ONE. https://journals.plos.org/plosone/article?id=10.1371/journal.pone.0200162
- Geschke et al. (2019) Daniel Geschke, Jan Lorenz, and Peter Holtz. 2019. The triple-filter bubble: Using agent-based modelling to test a meta-theoretical framework for the emergence of filter bubbles and echo chambers. British Journal of Social Psychology 58, 1 (2019), 129–149. https://doi.org/10.1111/bjso.12286 arXiv:https://bpspsychub.onlinelibrary.wiley.com/doi/pdf/10.1111/bjso.12286
- Grinberg et al. (2019) Nir Grinberg, Kenneth Joseph, Lisa Friedland, Briony Swire-Thompson, and David Lazer. 2019. Fake news on Twitter during the 2016 U.S. presidential election. Science 363, 6425 (2019), 374–378. https://doi.org/10.1126/science.aau2706 arXiv:https://www.science.org/doi/pdf/10.1126/science.aau2706
- Guess et al. (2021) Andy Guess, Kevin Aslett, Joshua Tucker, Richard Bonneau, and Jonathan Nagler. 2021. Cracking open the news feed: Exploring what us Facebook users see and share with large-scale platform data. Journal of Quantitative Description: Digital Media 1 (2021).
- Guess (2021) Andrew M. Guess. 2021. (Almost) Everything in Moderation: New Evidence on Americans’ Online Media Diets. (2021).
- Guess et al. (2020) Andrew M. Guess, Brendan Nyhan, and Jason Reifler. 2020. Exposure to untrustworthy websites in the 2016 US election. Nature Human Behaviour 4, 5 (May 2020), 472–480. https://doi.org/10.1038/s41562-020-0833-x
- Hannak et al. (2013) Aniko Hannak, Piotr Sapiezynski, Arash Molavi Kakhki, Balachander Krishnamurthy, David Lazer, Alan Mislove, and Christo Wilson. 2013. Measuring personalization of web search. In Proceedings of the 22nd international conference on World Wide Web - WWW ’13. ACM Press, Rio de Janeiro, Brazil, 527–538. https://doi.org/10.1145/2488388.2488435
- Hosseinmardi et al. (2020) Homa Hosseinmardi, Amir Ghasemian, Aaron Clauset, David M. Rothschild, Markus Mobius, and Duncan J. Watts. 2020. Evaluating the scale, growth, and origins of right-wing echo chambers on YouTube. arXiv:2011.12843 [cs] (Nov. 2020). http://arxiv.org/abs/2011.12843
- Jeffries (2020) Adrianne Jeffries. 2020. How to Stop Google Self-Preferencing? Europe May Not Be the Model – The Markup. https://themarkup.org/google-the-giant/2020/10/15/big-tech-antitrust-google-nondiscrimination-enforcement
- Kaiser et al. (2021) Ben Kaiser, Jerry Wei, Eli Lucherini, Kevin Lee, J. Nathan Matias, and Jonathan Mayer. 2021. Adapting Security Warnings to Counter Online Disinformation. In 30th USENIX Security Symposium (USENIX Security 21). USENIX Association, 1163–1180. https://www.usenix.org/conference/usenixsecurity21/presentation/kaiser
- Kumar and Shah (2018) Srijan Kumar and Neil Shah. 2018. False Information on Web and Social Media: A Survey. arXiv:1804.08559 [cs] (April 2018). http://arxiv.org/abs/1804.08559
- Lazer et al. (2021) David Lazer, Eszter Hargittai, Deen Freelon, Sandra Gonzalez-Bailon, Kevin Munger, Katherine Ognyanova, and Jason Radford. 2021. Meaningful measures of human society in the twenty-first century. Nature 595, 7866 (2021), 189–196.
- Lee and Kerschbaumer (2021) Dimi Lee and Christoph Kerschbaumer. 2021. Firefox 87 trims HTTP Referrers by default to protect user privacy. (2021). https://blog.mozilla.org/security/2021/03/22/firefox-87-trims-http-referrers-by-default-to-protect-user-privacy/.
- Lewandowsky et al. (2017) Stephan Lewandowsky, Ullrich K.H. Ecker, and John Cook. 2017. Beyond Misinformation: Understanding and Coping with the “Post-Truth” Era. Journal of Applied Research in Memory and Cognition 6, 4 (2017), 353–369. https://doi.org/10.1016/j.jarmac.2017.07.008
- Lomax and Norman (2016) Nik Lomax and Paul Norman. 2016. Estimating Population Attribute Values in a Table: “Get Me Started in” Iterative Proportional Fitting. The Professional Geographer 68, 3 (2016), 451–461. https://doi.org/10.1080/00330124.2015.1099449
- Lucherini et al. (2021) Eli Lucherini, Matthew Sun, Amy A. Winecoff, and Arvind Narayanan. 2021. T-RECS: A Simulation Tool to Study the Societal Impact of Recommender Systems. CoRR abs/2107.08959 (2021). arXiv:2107.08959 https://arxiv.org/abs/2107.08959
- Mathur et al. (2021) Arunesh Mathur, Jonathan Mayer, and Mihir Kshirsagar. 2021. What Makes a Dark Pattern… Dark? Design Attributes, Normative Considerations, and Measurement Methods. Association for Computing Machinery, New York, NY, USA. https://doi.org/10.1145/3411764.3445610
- MDN Web Docs (2021a) MDN Web Docs 2021a. Browser Extensions. https://developer.mozilla.org/en-US/docs/Mozilla/Add-ons/WebExtensions.
- MDN Web Docs (2021b) MDN Web Docs 2021b. Referrer-Policy. https://developer.mozilla.org/en-US/docs/Web/HTTP/Headers/Referrer-Policy.
- Medvedev et al. (2019) Ivan Medvedev, Haotian Wu, and Taylor Gordon. 2019. Powered by AI: Instagram’s Explore recommender system. https://ai.facebook.com/blog/powered-by-ai-instagrams-explore-recommender-system/
- Messing et al. (2020) Solomon Messing, Christina DeGregorio, Bennett Hillenbrand, Gary King, Saurav Mahanti, Zagreb Mukerjee, Chaya Nayak, Nate Persily, Bogdan State, and Arjun Wilkins. 2020. Facebook Privacy-Protected Full URLs Data Set. https://doi.org/10.7910/DVN/TDOAPG
- Mondal et al. (2017) Mainack Mondal, Leandro Araújo Silva, and Fabrício Benevenuto. 2017. A Measurement Study of Hate Speech in Social Media. In Proceedings of the 28th ACM Conference on Hypertext and Social Media (HT ’17). Association for Computing Machinery, New York, NY, USA, 85–94. https://doi.org/10.1145/3078714.3078723
- Morstatter et al. (2013) Fred Morstatter, Jürgen Pfeffer, Huan Liu, and Kathleen M Carley. 2013. Is the Sample Good Enough? Comparing Data from Twitter’s Streaming API with Twitter’s Firehose. In International AAAI Conference on Weblogs and Social Media (ICWSM). https://ojs.aaai.org/index.php/ICWSM/article/download/14401/14250/17919
- Mozilla Rally (2020) Mozilla Rally 2020. About Firefox Pioneer. https://rally.mozilla.org/how-rally-works/faqs/.
- Narayanan and Shmatikov (2008) A. Narayanan and V. Shmatikov. 2008. Robust De-anonymization of Large Sparse Datasets. In 2008 IEEE Symposium on Security and Privacy (sp 2008). 111–125. https://doi.org/10.1109/SP.2008.33
- Nichols and Maner (2008) Austin Lee Nichols and Jon K. Maner. 2008. The Good-Subject Effect: Investigating Participant Demand Characteristics. The Journal of General Psychology 135, 2 (2008), 151–166. https://doi.org/10.3200/GENP.135.2.151-166 PMID: 18507315.
- Online Political Transparency Project at New York University (2020) Online Political Transparency Project at New York University. 2020. AdObserver.
- Owen (2020) Laura Hazard Owen. 2020. How much political news do people see on Facebook? I went inside 173 people’s feeds to find out. https://www.niemanlab.org/2020/11/how-much-political-news-do-people-see-on-facebook-i-went-inside-173-peoples-feeds-to-find-out/
- Perra and Rocha (2019) Nicola Perra and Luis E. C. Rocha. 2019. Modelling opinion dynamics in the age of algorithmic personalisation. Scientific Reports 9, 1 (May 2019), 7261. https://doi.org/10.1038/s41598-019-43830-2
- Perriam et al. (2020) Jessamy Perriam, Andreas Birkbak, and Andy Freeman. 2020. Digital methods in a post-API environment. International Journal of Social Research Methodology 23, 3 (2020), 277–290. https://doi.org/10.1080/13645579.2019.1682840
- Persily (2021) Nathan Persily. 2021. Facebook hides data showing it harms users. Outside scholars need access. The Washington Post (2021). https://www.washingtonpost.com/outlook/2021/10/05/facebook-research-data-haugen-congress-regulation/
- Peterson (2001) Robert A. Peterson. 2001. On the Use of College Students in Social Science Research: Insights from a Second-Order Meta-analysis. Journal of Consumer Research 28, 3 (12 2001), 450–461. https://doi.org/10.1086/323732
- Phadke and Mitra (2020) Shruti Phadke and Tanushree Mitra. 2020. Many Faced Hate: A Cross Platform Study of Content Framing and Information Sharing by Online Hate Groups. In Proceedings of the 2020 CHI Conference on Human Factors in Computing Systems. Association for Computing Machinery, New York, NY, USA, 1–13. https://doi.org/10.1145/3313831.3376456
- Rampin and Rampin (2021) Rémi Rampin and Vicky Rampin. 2021. Taguette: open-source qualitative data analysis. Journal of Open Source Software 6, 68 (2021), 3522.
- Ribeiro et al. (2019a) Filipe N. Ribeiro, Koustuv Saha, Mahmoudreza Babaei, Lucas Henrique, Johnnatan Messias, Fabricio Benevenuto, Oana Goga, Krishna P. Gummadi, and Elissa M. Redmiles. 2019a. On Microtargeting Socially Divisive Ads: A Case Study of Russia-Linked Ad Campaigns on Facebook. In Proceedings of the Conference on Fairness, Accountability, and Transparency (FAT* ’19). Association for Computing Machinery, New York, NY, USA, 140–149. https://doi.org/10.1145/3287560.3287580
- Ribeiro et al. (2020a) Manoel Horta Ribeiro, Jeremy Blackburn, Barry Bradlyn, Emiliano De Cristofaro, Gianluca Stringhini, Summer Long, Stephanie Greenberg, and Savvas Zannettou. 2020a. The Evolution of the Manosphere Across the Web. (Jan. 2020). https://arxiv.org/abs/2001.07600v5
- Ribeiro et al. (2020b) Manoel Horta Ribeiro, Raphael Ottoni, Robert West, Virgílio A. F. Almeida, and Wagner Meira. 2020b. Auditing radicalization pathways on YouTube. In Proceedings of the 2020 Conference on Fairness, Accountability, and Transparency (FAT* ’20). Association for Computing Machinery, New York, NY, USA, 131–141. https://doi.org/10.1145/3351095.3372879
- Ribeiro et al. (2019b) Manoel Horta Ribeiro, Savvas Zannettou, Emiliano De Cristofaro, Gianluca Stringhini, and Jeremy Blackburn. 2019b. Comments on “Algorithmic Extremism: Examining YouTube’s Rabbit Hole of Radicalization”. (2019). https://idrama.science/posts/2019/12/youtube-radicalization-study/.
- Roose (2021) Kevin Roose. 2021. Inside Facebook’s Data Wars. (2021). https://www.nytimes.com/2021/07/14/technology/facebook-data.html.
- Samory and Mitra (2018) Mattia Samory and Tanushree Mitra. 2018. Conspiracies online: User discussions in a conspiracy community following dramatic events. In Proceedings of the International AAAI Conference on Web and Social Media, Vol. 12.
- Scharkow (2016) Michael Scharkow. 2016. The Accuracy of Self-Reported Internet Use—A Validation Study Using Client Log Data. Communication Methods and Measures 10, 1 (2016), 13–27. https://doi.org/10.1080/19312458.2015.1118446
- Shapiro et al. (2021) Elizabeth Hansen Shapiro, Michael Sugarman, Fernando Bermejo, and Ethan Zuckerman. 2021. . Technical Report. https://www.netgainpartnership.org/resources/2021/2/25/new-approaches-to-platform-data-research
- Singh et al. (2020) Lisa Singh, Leticia Bode, Ceren Budak, Kornraphop Kawintiranon, Colton Padden, and Emily Vraga. 2020. Understanding high-and low-quality URL Sharing on COVID-19 Twitter streams. Journal of computational social science 3, 2 (2020), 343–366.
- Solsman (2018) Joan E. Solsman. 2018. Ever get caught in an unexpected hourlong YouTube binge? Thank YouTube AI for that. https://www.cnet.com/news/youtube-ces-2018-neal-mohan/
- Speicher et al. (2018) Till Speicher, Muhammad Ali, Giridhari Venkatadri, Filipe Nunes Ribeiro, George Arvanitakis, Fabrício Benevenuto, Krishna P. Gummadi, Patrick Loiseau, and Alan Mislove. 2018. Potential for Discrimination in Online Targeted Advertising. In Proceedings of the 1st Conference on Fairness, Accountability and Transparency (Proceedings of Machine Learning Research, Vol. 81), Sorelle A. Friedler and Christo Wilson (Eds.). PMLR, 5–19. https://proceedings.mlr.press/v81/speicher18a.html
- Thomas et al. (2021) Kurt Thomas, Devdatta Akhawe, Michael Bailey, Dan Boneh, Elie Bursztein, Sunny Consolvo, Nicola Dell, Zakir Durumeric, Patrick Gage Kelley, Deepak Kumar, Damon McCoy, Sarah Meiklejohn, Thomas Ristenpart, and Gianluca Stringhini (Eds.). 2021. SoK: Hate, Harassment, and the Changing Landscape of Online Abuse.
- Timberg (2021) Craig Timberg. 2021. Facebook made big mistake in data it provided to researchers, undermining academic work. (2021). https://www.washingtonpost.com/technology/2021/09/10/facebook-error-data-social-scientists/
- Tobin (2019) Ariana Tobin. 2019. HUD Sues Facebook Over Housing Discrimination and Says the Company’s Algorithms Have Made the Problem Worse. https://www.propublica.org/article/hud-sues-facebook-housing-discrimination-advertising-algorithms?token=MZ4huG2khovdFzdzgBUWYctqeKrXQgA5
- Vogels (2021) Emily A. Vogels. 2021. Some digital divides persist between rural, urban and suburban America. https://www.pewresearch.org/fact-tank/2021/08/19/some-digital-divides-persist-between-rural-urban-and-suburban-america/
- Vosoughi et al. (2018) Soroush Vosoughi, Deb Roy, and Sinan Aral. 2018. The spread of true and false news online. Science 359, 6380 (March 2018), 1146–1151. https://doi.org/10.1126/science.aap9559
- Waddell ([n.d.]) Kaveh Waddell. [n.d.]. Facebook Approved Ads With Coronavirus Misinformation. https://www.consumerreports.org/social-media/facebook-approved-ads-with-coronavirus-misinformation/
- Wang et al. (2015) Yiran Wang, Melissa Niiya, Gloria Mark, Stephanie M. Reich, and Mark Warschauer. 2015. Coming of Age (Digitally): An Ecological View of Social Media Use among College Students. In Proceedings of the 18th ACM Conference on Computer Supported Cooperative Work & Social Computing (CSCW ’15). Association for Computing Machinery, New York, NY, USA, 571–582. https://doi.org/10.1145/2675133.2675271
- Wei et al. (2020) Miranda Wei, Madison Stamos, Sophie Veys, Nathan Reitinger, Justin Goodman, Margot Herman, Dorota Filipczuk, Ben Weinshel, Michelle L. Mazurek, and Blase Ur. 2020. What Twitter Knows: Characterizing Ad Targeting Practices, User Perceptions, and Ad Explanations Through Users’ Own Twitter Data. In 29th USENIX Security Symposium (USENIX Security 20). USENIX Association, 145–162. https://www.usenix.org/conference/usenixsecurity20/presentation/wei
- Wilson and Starbird (2020) Tom Wilson and Kate Starbird. 2020. Cross-Platform Disinformation Campaigns: Lessons Learned and Next Steps. Harvard Kennedy School Misinformation Review 1, 1 (Jan. 2020). https://doi.org/10.37016/mr-2020-002
- Yang et al. (2021) Kai-Cheng Yang, Francesco Pierri, Pik-Mai Hui, David Axelrod, Christopher Torres-Lugo, John Bryden, and Filippo Menczer. 2021. The COVID-19 Infodemic: Twitter versus Facebook. Big Data & Society 8, 1 (2021), 20539517211013861. https://doi.org/10.1177/20539517211013861 arXiv:https://doi.org/10.1177/20539517211013861
- York (2019) Jillian C. York. 2019. How American Corporations Are Policing Online Speech Worldwide. https://gizmodo.com/how-american-corporations-are-policing-online-speech-wo-1836010637
Appendix A Appendix
A.1. Literature Survey Search Terms
Below, we provide the search terms used for the literature survey, and the number of papers resulting from each. Each cell of the table is the number of papers resulting from concatenating the search term of the row with the term heading the column. For example, in table 7, the top left cell indicates that the search query
”computer use data” ”behavior”
resulted in 252 papers. We combined the results from each query and then de-duplicated them, resulting in the count reported in table 4.
| use data” ”behavior” | interaction data” ”behavior” | usage data” ”behavior” | use” ”participant” OR ”participants” ”in-situ data” | usage” ”participant” OR ”participants” ”in-situ data” | interaction” ”participant” OR ”participants” ”in-situ data” | * use data” ”behavior” | * use * data” ”behavior” | use * data” ”behavior” | * interaction data” ”behavior” | * interaction * data” ”behavior” | interaction * data” ”behavior” | * usage data” ”behavior” | * usage * data” ”behavior” | usage * data” ”behavior” | |
| ”computer | 252 | 508 | 198 | 41 | 18 | 378 | 56 | 125 | 388 | 36 | 32 | 554 | 67 | 10 | 112 |
| ”browser | 1 | 50 | 17 | 2 | 7 | 0 | 3 | 9 | 4 | 5 | 2 | 0 | 8 | 0 | 4 |
| ”phone | 185 | 30 | 682 | 66 | 55 | 12 | 11 | 27 | 129 | 2 | 1 | 4 | 30 | 10 | 112 |
| ”smartphone | 120 | 30 | 419 | 41 | 55 | 4 | 19 | 24 | 64 | 6 | 1 | 4 | 40 | 9 | 140 |
| ”desktop | 0 | 1 | 1 | 4 | 0 | 2 | 4 | 4 | 6 | 2 | 0 | 0 | 2 | 1 | 3 |
| ”laptop | 5 | 0 | 10 | 2 | 1 | 0 | 1 | 6 | 5 | 0 | 0 | 0 | 3 | 0 | 3 |
| extension” ”behavior” | add-on” ”behavior” | addon” ”behavior” | * extension” ”behavior” | * add-on” ”behavior” | * addon” ”behavior” | plugin” ”behavior” | plug-in” ”behavior” | * plugin” ”behavior” | * plug-in” ”behavior” | |
| ”chrome | 2580 | 61 | 4 | 665 | 16 | 5 | 248 | 110 | 111 | 43 |
| ”firefox | 1480 | 701 | 898 | 381 | 140 | 34 | 479 | 362 | 127 | 78 |
| ”safari | 24 | 5 | 0 | 7 | 2 | 0 | 6 | 7 | 4 | 7 |
| data” ”behavior” | ” ”participant” OR ”participants” ”in-situ data” | * data” ”behavior” | |
| ”browsing | 3650 | 301 | 2750 |
| ”clickstream | 7560 | 13 | 400 |
| chrome” ”behavior” | firefox” ”behavior” | safari” ”behavior” | * chrome” ”behavior” | * firefox” ”behavior” | * safari” ”behavior” | |
| ”extension | 59 | 40 | 4 | 366 | 449 | 19 |
| ”add-on | 1 | 10 | 1 | 43 | 211 | 3 |
| ”addon | 1 | 3 | 0 | 9 | 29 | 1 |
| ”plugin | 13 | 25 | 1 | 80 | 191 | 8 |
| ”plug-in | 4 | 5 | 1 | 44 | 180 | 10 |
A.2. Literature Survey Codebook
| Name of attribute | Description |
| Title (*) | The title of the paper. |
| Authors (*) | The authors of the paper. |
| Year (*) | The publication year of the paper. |
| Citations (*) | The number of citations of the paper, at the time of our searches in February and March 2022. |
| Duplicate | Indicates second studies from a single paper. |
| Venue | The publication venue of the paper. |
| Discipline | The academic discipline of the publication venue, or the apparent discipline of the authors, for papers at multidisciplinary venues. |
| Participants | The total number of participants in the study. We used the largest number of participants from whom the researchers reported possessing data, even if some were excluded from the full analysis. |
| Duration | The largest number of days that the researchers reported collecting data from participants. |
| MOOC | Whether the paper used data from a MOOC (massive open online course), and used the data to predict or assist student success. |
| E-Commerce | Whether the paper used data from an online store, and used the data to predict or promote sales or browsing behavior. |
| Devices | The devices from which the researchers had data. Options were: Smartphone, cell phone, desktop/laptop, tablet, mixed server data (data retrieved from a computer serving different clients), and not stated. |
| Researcher-provided | Whether the researchers provided participants with the devices from which they collected data. We set this field when the researchers provided any participants with a device, even if other participants brought their own devices. |
| Explicit consent | Whether the paper explicitly says that researchers received informed consent from participants. Options were: not stated (the paper did not explicitly mention consent), consent obtained (the paper says consent was obtained), consent explained (consent was obtained, and the paper describes the process of obtaining consent), and consent not obtained. |
| IRB approval | Whether the paper mentions receiving approval from an institutional review board or undergoing similar ethical review. Options were: not stated, IRB approved, IRB exempt (the researchers mention that the project was considered exempt from their institution’s review process). |
| Data source | The way the researchers obtained the data. Options were: custom (the authors of the paper wrote the instrumentation), research data provider (the researchers used a company or tool that collected data for research), and partnership (the researchers partnered with (or were employed by) the organization under study, and received data from that company, organization, or platform). |
| Collection mechanism | Regardless of the above (who collected the data), the tool or method that measured the data. Options were: extension (a browser extension, add-on, plug-in, or toolbar), user upload (participants manually uploaded a file containing data), manual (researchers accessed devices and manually retrieved the data), VPN (researchers installed a VPN on the participant’s device and collected data from the VPN server), mobile app (an app installed on a smartphone), desktop program (a program installed on a computer), and business data (data collected through the normal business operation of an organization under study). |
| Recruitment mechanism | The method of enrolling participants. Options were: traditional (researchers posted fliers, went to community hubs, recruited students, sent emails to listservs, and so on), advertising (researchers purchased ads on websites), crowdworkers (researchers recruited participants from MTurk or similar platforms), business operation (participants were customers or users of the platform under study), and panel recruitment (participants were members of a research panel). |
| Compensation | Whether participants received anything of value from participating, including money, devices, and access to services. Options were: yes, no, and not stated. |
| Interventions | Whether the researchers intentionally intervened with the interaction between the user and device, not including the act of measuring itself. |
| Qualitative | Whether the researchers had survey or interview data from the same participants whose interaction data they used. |
| Web attention | Whether the researchers measured the amount of attention participants paid to different webpages, and the method used if so. Options were: NA (the researchers did not measure attention), count visits (the researchers used the number of visits to infer attention), dwell time, time to next page load, and precise instrumentation (the researchers used a browser-based method that tracked participant actions). |
| Web navigation | Whether the researchers measured the path between webpages, and the method used if so. Options were: NA, referrer (researchers used the HTTP referrer, last loaded page (researchers used the chronologically-previous page as the logical referrer), and precise instrumentation (researchers used a browser-based method that tracked user actions). |
| Web exposure | Whether the researchers measured content within webpages viewed by the participant. |
| Social media sharing | Whether the researchers measured the participant’s sharing of content on social media platforms. |
A.3. Qualitative User Study Interview Guide
Research background
-
(1)
What best describes your professional training? Is it as a researcher, an engineer, a data scientist, a journalist, or something else?
-
(a)
How many years of experience do you have in that role?
-
(b)
What types of projects have you worked on in that time?
-
(i)
If research – what fields and what types of methods?
-
(i)
-
(a)
-
(2)
How much experience do you have:
-
(a)
Conducting user studies, including measurements, surveys, and interviews?
-
(b)
Writing software?
-
(i)
Writing JavaScript code?
-
(ii)
Writing browser extensions?
-
(A)
Using the WebExtensions API?
-
(A)
-
(i)
-
(c)
Conducting browser-based studies?
-
(i)
Conducting other device-based studies?
-
(i)
-
(d)
Using commercial panel providers like YouGov, Nielsen, or Comscore?
-
(e)
Collecting experimental data?
-
(a)
Study information
-
(3)
What is your Rally / WebScience study about?
-
(4)
What are the key contributions of your study?
-
(a)
What benefits does the study have for society?
-
(b)
What makes your study novel?
-
(a)
-
(5)
Why are browser-based methods needed to study your research problem?
-
(a)
What alternatives have you considered? What are the tradeoffs?
-
(a)
-
(6)
What was your role in the study? How many collaborators did you work with, and what were their roles?
Experience with Rally
-
(7)
On a scale of 1 to 5, where 1 is extremely dissatisfied and 5 is extremely satisfied: how do you feel about the process of proposing your Rally study and getting approval?
-
(a)
How was the process different from how you would typically design a study?
-
(b)
Did you see any benefits to the Rally study approval process? Were there any ways in which it helped you with your study design?
-
(c)
Were there any pain points? Were any requirements or process steps confusing or difficult to follow?
-
(d)
Do you have any suggestions for how the Rally study proposal process could be improved?
-
(a)
-
(8)
On a scale of 1 to 5, where 1 is extremely dissatisfied and 5 is extremely satisfied: how do you feel about the processes for recruiting and onboarding participants through Rally?
-
(a)
What recruitment methods did you use?
-
(i)
Enrolling existing Rally users in the study?
-
(ii)
Paid external advertising, like Facebook ads?
-
(iii)
Advertising to your own social networks?
-
(iv)
Other methods?
-
(i)
-
(b)
On a scale of 1 to 5, how satisfied are you with the size and makeup of your population sample?
-
(i)
Why?
-
(ii)
How does it differ from samples you have previously recruited by other means?
-
(iii)
Were there any costs to you?
-
(i)
-
(c)
On a scale of 1 to 5, how satisfied are you with the Rally processes for informing participants about studies and requesting consent?
-
(i)
Were there significant differences from other processes you have used to inform and request consent?
-
(ii)
Did you feel that participants were sufficiently informed about the study and able to give informed, uncoerced consent?
-
(iii)
Did you, your team, or the Rally team identify any other ethical issues around recruiting and onboarding participants for your study?
-
(i)
-
(d)
Do you have any suggestions for how Rally processes for recruitment, consent, and other onboarding steps could be improved?
-
(a)
-
(9)
On a scale of 1 to 5, how satisfied are you with how Rally handles participant privacy?
-
(a)
What steps related to privacy did you take while designing and implementing your study?
-
(i)
Data minimization?
-
(ii)
Configuring your analysis environment?
-
(i)
-
(b)
Were any steps related to privacy difficult or onerous to implement?
-
(c)
Compared to other studies you have run, was it easier or harder to handle privacy on your Rally study?
-
(d)
Do you think your Rally participants have better or worse protections than participants in other studies you have run?
-
(a)
-
(10)
On a scale of 1 to 5, how satisfied are you with the technical infrastructure Rally provides for deploying your study, reporting data, and analyzing data?
-
(a)
Did you encounter any limitations or challenges working with Rally infrastructure?
-
(b)
Do you have any suggestions for how to improve Rally infrastructure?
-
(a)
-
(11)
Do you see it as generally positive, negative, or neither that Rally is run by Mozilla?
-
(a)
Are there any specific benefits you see or concerns you have with Rally being run by Mozilla?
-
(a)
Experience with WebScience
-
(12)
How much did you use WebScience in your study?
-
(13)
Why did you choose to use WebScience for your study?
-
(a)
What do you see as the biggest benefits WebScience provides compared to alternative options for developing browser-based studies?
-
(b)
The biggest drawbacks?
-
(a)
-
(14)
How long did it take to develop your study extension?
-
(a)
Did you use the study template, or create your study extension from scratch?
-
(a)
-
(15)
Was WebScience generally easy to use?
-
(a)
Were the WebScience APIs easy to understand and use?
-
(b)
Was WebScience sufficiently configurable for your purposes?
-
(c)
Were there any pain points you encountered using WebScience?
-
(d)
Was WebScience documentation helpful for understanding how to use the library?
-
(e)
Did you use any other support resources, such as the research support Slack channel in the Rally workspace, or reaching out to other colleagues?
-
(f)
Are there any support resources you would like to see made available?
-
(a)
-
(16)
Do you see it as generally positive, negative, or neither that WebScience is an open-source project?
-
(a)
Are there any specific benefits you see or concerns you have with WebScience being an open-source project?
-
(a)
-
(17)
What do you think are the most important features or measurement capabilities that WebScience should add?
Concluding questions
-
(12)
What do you think are the biggest benefits to using Rally / WebScience over alternative methods of creating browser-based studies?
-
(a)
What are the biggest drawbacks?
-
(a)
-
(13)
If you run another browser-based study in the future, would you use Rally / WebScience again?
-
(14)
Would you recommend Rally / WebScience to other researchers in your field?
-
(15)
What advice would you give a researcher in your field who is considering using Rally / WebScience to launch a browser-based study?
A.4. Additional WebScience Modules
Below, we briefly describe other modules that handle common tasks and measurements.
A.4.1. User Survey
Researchers often need to combine behavioral data with self-reported information. The user survey modules allows researchers to prompt participants to fill out a survey on an external platform.
A.4.2. Link Resolution
Shortening services, such as Bitly and Tinyurl, mean that two URLs that are not the same may ultimately lead to the same page. The link resolution module accepts a URL from another module and unrolls nested shorteners and redirects to obtain the final page that a URL points to.
A.4.3. Link Exposure
Researchers studying exposure need to know which links a participant saw while browsing (but didn’t necessarily visit). The link exposure modules provides lists of links that were in the viewport at sufficient size and for sufficient time that the participant likely noticed them. Researchers configure the module with a list of desired domains on which to measure, as well as about which exposed links to notify.
A.4.4. Scheduling
Studies need to run maintenance or reporting tasks at regular intervals. Some heavyweight tasks (e.g. aggregating raw events into reportable data) may be CPU-intensive, and therefore should run when the participant is not actively using the system. The scheduling module provides a service to monitor user activity and run code at approximately regular intervals, preferring periods of low user activity.
A.4.5. Clock
Studies that use timestamps to record the order of user events need monotonically increasing timestamps. The system clock can be changed by the user, or by the system adjusting for skew. Studies that use the system clock without accounting for the possibility of adjustments may collect corrupted data. In addition, browser implementations of the W3C recommended clock are not yet correct and stable. The clock module provides a monotonically increasing clock that syncs with the system clock at browser startup, and then ignores shifts in that clock.
A.5. Additional Attention Measurement Charts
Figures 12, 13 and 14 show the percent difference () each method had, compared to WebScience.
In all three cases, the distribution is centered around the zero mark: many page visits result in the same attention measure under all four measures. However, all three distributions are long-tailed, indicating that the methods sometimes report attention values that are far from our WebScience-based ground truth.