On the observability and identification of Population III galaxies with JWST
Abstract
We utilise theoretical models of Population III stellar+nebular spectra to investigate the prospects of observing and accurately identifying Population III galaxies with JWST using both deep imaging and spectroscopy. We investigate a series of different colour cuts, finding that a combination of NIRCam and MIRI photometry through the F444WF560W, F560WF770W colours offers the most robust identifier of potential Pop III candidates. We calculate that NIRCam will have to reach – AB mag depths (1–20 h), and MIRI F560W must reach – AB mag depths (10–100 h) to achieve continuum detections of Pop III galaxies at . We also discuss the prospects of identifying Pop III candidates through slitless and NIRSpec spectroscopic surveys that target Ly, H and/or He ii . We find small differences in the H rest-frame equivalent width (EW) between Pop III and non-Pop III galaxies, rendering this diagnostic likely impractical. We find that the detection of high EW He ii emission will serve as the definitive Pop III identifier, requiring (ultra-)deep integrations (10–250 h) with NIRSpec/G140M for Pop III galaxies at . With moderate (–) lensing and/or moderately massive (–) Pop III galaxies, such line detections can be achieved in medium-sized JWST GO programs. However, MIRI F770W detections of Pop III galaxies will require substantial gravitational lensing () and/or fortuitous imaging of exceptionally massive () Pop III galaxies. Thus, NIRCam medium-band imaging surveys that can search for high EW He ii emitters in photometry may perhaps be a viable alternative for finding Pop III candidates.
keywords:
galaxies: formation – galaxies: evolution – galaxies: abundances – galaxies: high-redshift – stars: Population III1 Introduction
The recently launched and now fully operational James Webb Space Telescope (JWST) is set to usher in a golden era of astronomy, being the central catalyst for a great new age of discovery. Indeed, our perception of the Universe will forever change, as we begin to see it with a clarity and depth that greatly surpasses anything that has come before. Among its many grand discoveries set to come, perhaps the greatest of all is the possibility of observing the light from the very first stars in the Universe (e.g. Bromm & Larson, 2004; Bromm & Yoshida, 2011). These chemically pristine, so-called ‘Population III’ stars, formed out of the primordial hydrogen and helium (and trace amounts of lithium), and were the first embers to ignite, producers of the starlight that ended the cosmic dark ages (e.g. Miralda-Escudé, 2003) and paved the way for cosmic dawn (e.g. Laporte et al., 2021). In studying these first stars, the foundation upon which all of cosmic history stands, we will gain unprecedented insights into both primordial star formation (e.g. Johnson, 2013), as well as the characteristics of the ‘Population III galaxies’ within which the first stars reside (e.g. Bromm & Yoshida, 2011). Indeed, by analysing Pop III galaxies, we will be witnesses to the synthesis of the very first non-primordial elements and the subsequent chemical enrichment of the Universe (e.g. Ferrara et al., 2000; Madau et al., 2001; Bromm et al., 2003).
Forming in so-called ‘atomic cooling haloes’, where hydrogen gas is sufficiently hot to collisionally ionise, and thus cool through recombination, Pop III galaxies are expected, from virial arguments, to have halo masses of (see e.g. Johnson et al., 2008; Bromm & Yoshida, 2011). Accounting for the cosmic baryon fraction and approximate estimates for the efficiency with which primordial baryonic gas is converted into stars, these first galaxies are believed to have a typical stellar mass of (Bromm & Yoshida, 2011). Thus the combination of their low stellar masses, together with their great cosmological distances from us, makes such Pop III galaxies exceptionally faint, and therefore beyond the detection capabilities of the telescopes that came before JWST.
JWST, with its exceptional sensitivity and resolution, is thus the ideal facility with which to search for these elusive Pop III galaxies (e.g. Gardner et al., 2006; Bromm & Yoshida, 2011; Katz et al., 2022a; Nakajima & Maiolino, 2022). Its extensive suite of scientific instruments and diverse observing modes, spanning imaging to both slit and slitless spectroscopy, will all play an essential role in identifying Pop III candidates and further characterising their properties. The signatures of Pop III stars are encoded within their rest-UV-optical-NIR light. JWST, spanning the NIR-to-MIR wavelengths to which these fingerprints of primordial star formation are redshifted to, therefore has the capabilities to capture the full wealth of information stored within this ancient starlight.
The photometric and spectroscopic signatures of Pop III stars and galaxies has been extensively studied. For example, Schaerer (2002) presented realistic models for massive Pop III stars, including nebular continuum emission, finding that nebular line and continuum emission strongly affects the broad band photometric properties of Pop III objects. Indeed, strong (i.e. high EW) emission in the He ii recombination line was found (e.g. Schaerer, 2002, 2003; Raiter et al., 2010) to be a clear signature of chemically-pristine Pop III stars, reflecting their exceptional capability in generating hard ionising photons capable of doubly ionising helium. This in turn is due to the likely very massive nature of Pop III stars (, see e.g. Bromm et al., 1999; Tan & McKee, 2004), being the net result of inefficient cooling and subsequent star formation in metal-free, primordial gas.
Later works, such as Zackrisson et al. (2011), built upon these earlier models to generate forecasts for the prospects of JWST at observing and identifying Pop III galaxies. They concluded that ultra-deep exposures would be needed to detect Pop III galaxies at , with colour–colour selections combining JWST/NIRCam and JWST/MIRI photometry enabling a clean selection of Pop III galaxies at –. Indeed, fortuitous gravitational lensing of Pop III galaxies will greatly relax the otherwise demanding integration times needed (Zackrisson et al., 2012). At the same time, wide-field surveys with e.g. Euclid and the Roman Space Telescope will likely play a crucial role in our photometric search for Pop III galaxies (Vikaeus et al., 2022).
Follow-up spectroscopy, aiming to target bright emission lines such as H and He ii , will be essential to verify the pristine nature of potential Pop III candidates. The application of spectroscopic diagnostics, such as the He ii /H line ratio, will enable us to distinguish between different types of chemically pristine and extremely metal-poor systems (Nakajima & Maiolino, 2022). In this regard, JWST, but also the next-generation of extremely large telescopes, will play a pivotal role in definitively identifying true Pop III galaxies (Grisdale et al., 2021; Nakajima & Maiolino, 2022).
The aim of this paper is to build on previous works, by providing a comprehensive overview of the capabilities of JWST in observing and identifying Pop III galaxies. We wish to consider in detail the role of all four of JWST’s scientific instruments, across all of their observing modes, from imaging to slitless and slit spectroscopy. Indeed, we intend this work to encompass all aspects of the observational Pop III search, from the initial identification of Pop III candidates using colour- and/or emission-line selections, to the removal of interlopers and stronger Pop III constraints derived from follow-up JWST spectroscopy. We present a series of photometric and spectroscopic diagnostics that have been designed to be as viable as possible, targeting photometric and spectral features that can be detected in relatively short integration times (compared to alternatives). Simultaneously, we aim for these diagnostics to still be effective and practical, offering valuable constraints once observational errors on e.g. colours or line fluxes, model uncertainties and potentially unknown source parameters (like the ionisation parameter ) are taken into account.
This paper is structured as follows. In Section 2, we discuss the models for Pop III (and non-Pop III) spectra that will be used in our analysis. In Section 3, we discuss the prospects of observing and identifying Pop III galaxies with JWST. We discuss their expected apparent magnitudes and line fluxes, as well as the integration times needed to achieve a detection with imaging and slitless spectroscopy, as well as the visibility timescales for Pop III galaxies. We introduce and discuss several colour selections for identifying Pop III candidates, as well as the prospects of identifying Pop III candidates from slitless spectroscopic emission-line surveys with JWST. We undertake a similar analysis of Pop III galaxies in Appendix B. In Section 4 we discuss the additional Pop III constraints that can be derived from follow-up spectroscopy on Pop III candidates, as well as the integration times needed to achieve line detections with NIRSpec. Finally, in Section 5 we summarise our main findings and conclude.
We assume a nominal stellar mass of in our analysis, rather than the typical Pop III stellar mass of expected from virial arguments. This nominal stellar mass was chosen as it likely reflects the least massive Pop III galaxies that will be detectable within feasible integration times with JWST. We adopt a Planck Collaboration (2020) cosmology.
2 Population III models
We make use of both the Zackrisson et al. (2011) and Nakajima & Maiolino (2022) models for Pop III (as well as non-Pop III) spectra in our analysis. This approach was adopted for two reasons. Firstly, to investigate the robustness of our colour selections and spectroscopic diagnostics at identifying and confirming Pop III candidates. Secondly, to draw upon the synergy between these two different but complementary models. With the Zackrisson et al. (2011) models we will determine the expected apparent magnitudes and line fluxes for Pop III sources, as well as investigate the time-dependence of these quantities. With the Nakajima & Maiolino (2022) models we explore the dependence of our emission line diagnostics on the ionisation parameter and push our analysis of non-Pop III galaxies down to even lower (but still non-pristine) metallicities. We refer the reader to the respective papers for the full details on these models. In this section we briefly outline the features of these models that are most relevant for our analysis.
The Zackrisson et al. (2011) models provide rest UV-to-FIR spectra for both Pop III and non-Pop III populations. Most importantly, the spectra contain both stellar and nebular emission, with the pure stellar templates provided as inputs to the CLOUDY (Ferland et al., 1998) photoionisation code (following the procedure in Zackrisson et al., 2001), which in turn computes the associated nebular continuum and line emission. Models with ISM covering fractions of are provided. We use the spectra in our analysis, though we refer to the results when relevant.
For the Pop III galaxies, three different IMFs are available: Pop III.1, Pop III.2 and Pop III with a Kroupa IMF. Roughly speaking, the characteristic mass of stars formed in the Pop III.1, Pop III.2 and Pop III Kroupa IMFs are , and , respectively. In the case of Pop III.1, the Schaerer (2002) stellar SSP with a power-law IMF of slope across the mass range 50–500 is used. For Pop III.2 galaxies, the Raiter et al. (2010) model is adopted, which has a log-normal IMF with characteristic mass and dispersion , with wings extending from 1 to 500 . For the Pop III Kroupa galaxies (which we include for completeness, and as a reference against the non-Pop III models which also have a Kroupa IMF) the Kroupa (2001) IMF is adopted. Zackrisson et al. (2011) model spectra for non-Pop III (i.e. Pop II and Pop I) galaxies are also analysed. These assume the Kroupa (2001) IMF and are provided at .
The Nakajima & Maiolino (2022) models also provide rest UV-to-FIR spectra for both Pop III and non-Pop III populations, including both the stellar and nebular (generated using CLOUDY, Ferland et al., 1998; Ferland et al., 2013) emission.
For their Pop III galaxies, three metal-free stellar populations from Schaerer (2003) and Raiter et al. (2010) are used. A Salpeter (1955) IMF is adopted, with three different mass ranges considered: 1–100 , 1–500 and 50–500 . Three gas-phase metallicities are also available: . The non-zero metallicities are considered to explore the scenario of Pop III galaxies forming from pockets of pristine gas surviving in slightly enriched environments. We use the Nakajima & Maiolino (2022) Pop III spectra with electron density cm-3, across the ionisation parameter range .
Metal-poor Pop II models are also provided, spanning the metallicities , and across the ionisation parameter range . BPASS SEDs with a Kroupa (2001) IMF with two possible upper mass limits are used, namely 100 and 300 . Metal-enriched Pop I models are available at the following metallicities: , and at the following ionisation parameter values: .
Model spectra for active galactic nuclei (AGN) and direct collapse black holes (DCBH) are also used, though these are not central to our analysis. We only comment that while both AGN and DCBH can have bright He ii emission (similar to Pop III galaxies), they have very distinct red colours and so would not be confused with Pop III systems, see Fig. 14 but also Inayoshi et al. (2022).
We use the Inoue et al. (2014) prescription for IGM attenuation in our analysis. This essentially removes all the flux blueward of the central wavelength of Ly. Though we note that this prescription does not result in any attenuation/scattering redward of the Ly peak. When discussing our colour selections in Section 3.2, the Inoue et al. (2014) IGM attenuation has been applied to the spectrum. However, when discussing spectroscopic diagnostics involving the Ly line, as well as expected Ly fluxes, we instead use the intrinsic (i.e. unattenuated) Ly line.
Finally, we assume the Calzetti et al. (2000) dust attenuation law in this work. Although we do not explicitly apply this attenuation law to any of the model spectra, we do show the imprint that dust reddening would have on galaxy colours within the colour–colour plane.
3 The observability and identification of Pop III candidates
In this section we discuss the prospects of observing and identifying Pop III candidates with JWST. Our analysis will focus on Pop III candidates at . We mirror this analysis for candidates in Appendix B. In Section 3.1 we introduce the identifying, distinct features of a Pop III spectrum and the expected observability windows after a starburst. In Section 3.2, we discuss our colour–colour selections, outlining the principles behind these selections, the redshift windows of applicability and potential high- and Galactic contaminants. Finally, in Section 3.3, we discuss the feasibility of identifying Pop III candidates in JWST slitless spectroscopic emission-line surveys.
3.1 Pop III spectrum and photometry
We show an example of the spectrum of a Pop III galaxy at , together with its associated JWST NIRCam + MIRI photometry in Fig. 1. Here we adopt the Pop III.1 model from Zackrisson et al. (2011), which corresponds to the most top-heavy Pop III IMF in their models. We show the expected spectrum immediately after ( Myr) an instantaneous starburst. The JWST filters shown in Fig. 1 will be considered throughout our analysis in this paper. This set of NIRCam and MIRI filters has been chosen for two reasons. Firstly, because these filters are likely to be the standard filter set used by JWST, having been widely adopted in Cycle 1 observations. Secondly, because we found that these filters proved to capture the most salient spectral features needed for Pop III identification.
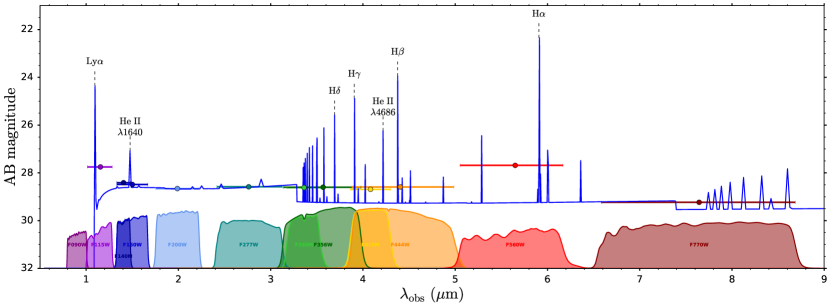
In the following section we briefly outline the key spectral features that distinguish Pop III galaxies from non-Pop III galaxies. This overview therefore forms the basis behind our subsequent colour– and emission-line–selections in Sections 3.2 and 3.3, as well as our recommendations for spectroscopic follow-up observations in Section 4.
| IMF | F090W | F115W | F140M | F150W | F200W | F277W | F335M | F356W | F410M | F444W | F560W | F770W | ||
|---|---|---|---|---|---|---|---|---|---|---|---|---|---|---|
| Pop III.1 | 38.15 | 27.75 | 28.41 | 28.49 | 28.66 | 28.58 | 28.62 | 28.60 | 28.69 | 28.59 | 27.69 | 29.23 | 2.2 | 2.8 |
| () | N/A | 0.13 | 1.01 | 0.34 | 0.29 | 0.59 | 1.54 | 0.57 | 2.34 | 1.25 | 12.53 | 660.97 | ||
| Pop III.2 | 39.24 | 28.90 | 29.60 | 29.65 | 29.79 | 29.73 | 29.75 | 29.74 | 29.88 | 29.76 | 28.84 | 30.41 | 4.0 | 4.0 |
| () | N/A | 1.06 | 9.03 | 2.92 | 2.57 | 4.80 | 12.56 | 4.72 | 21.32 | 10.98 | 106.19 | 5704.01 | ||
| Pop III Kroupa | 41.13 | 30.86 | 31.55 | 31.58 | 31.72 | 31.68 | 31.71 | 31.71 | 31.87 | 31.75 | 30.84 | 32.40 | 4.0 | 5.6 |
| () | N/A | 39.09 | 327.87 | 103.95 | 89.87 | 177.34 | 455.91 | 174.44 | 818.12 | 421.43 | 4150.45 | 227080.67 |
3.1.1 Distinguishing Pop III spectral features
Owing to their metal-free nature, as well as their potentially more top-heavy IMF, Pop III stars (and galaxies) are expected to produce more ionising photons per unit stellar mass than non-Pop III stars (e.g. Schaerer, 2002, 2003; Raiter et al., 2010; Zackrisson et al., 2011). Hence we expect the recombination lines of hydrogen and helium to have a greater luminosity per unit stellar mass for Pop III galaxies. Furthermore, the ionising radiation produced will also be harder than for non-Pop III stars (e.g. Schaerer, 2002, 2003), Hence, we also expect the recombination lines of doubly-ionised helium (He ii) to have much greater luminosity per unit stellar mass for Pop III galaxies.
The great source of (hard) ionising photons therefore heats more ISM to a greater temperature than for non-Pop III stars, resulting in a much brighter nebular continuum contribution to the total (stellar+nebular) Pop III spectrum (e.g. Zackrisson et al., 2001; Schaerer, 2002; Zackrisson et al., 2011). Although the brightest stars in a Pop III population are bluer than their non-Pop III counterparts, the greater contribution from the relatively cooler and redder nebular continuum results in the total Pop III spectrum being redder than for non-Pop III stars, which manifests itself in e.g. a less negative 1500 Å UV slope (e.g. Raiter et al., 2010; Zackrisson et al., 2011; Dunlop, 2013).
Given their higher ionising photon production rate (and hence recombination rate), one might expect the Balmer and Paschen jumps to be larger (in terms of an AB magnitude difference blueward and redward of the jump) for Pop III galaxies. However, we found that these jumps are in fact weaker for Pop III galaxies. Given the higher ISM temperatures (e.g. Schaerer, 2003), the recombining electrons in Pop III systems have a greater spread of energies, with a smaller fraction of particles therefore recombining with energy . Since it is precisely the recombination rate of the particles that drive the jump strength, the Balmer and Paschen jumps are weaker for Pop III galaxies.
Finally, since Pop III galaxies are by definition metal-free, their spectra do not contain any metal emission- or absorption-lines. Indeed, some of these metal emission-lines, such as the [O iii] and [S iii] doublets are relatively bright, and therefore have very high equivalent widths. As we shall see in Section 3.2, the absence of such bright lines in the Pop III spectrum can therefore lead to distinct colours which can be used to select Pop III candidates from photometry (see also Inoue, 2011; Zackrisson et al., 2011).
3.1.2 The observability of Pop III galaxies
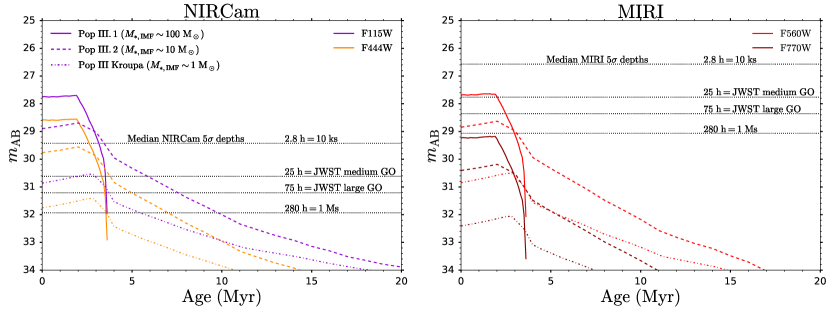
In Table 1 we show the expected AB magnitudes for Pop III galaxies at with immediately after ( Myr) an instantaneous starburst. We also show the expected integration times (in hours) needed to achieve a detection within the various NIRCam + MIRI bands. Furthermore, in Fig. 2, we show how the apparent magnitudes of Pop III galaxies vary with time elapsed after an instantaneous starburst, showing both the bandpass-averaged flux densities in the F115W (purple) and F444W (orange) NIRCam filters (left panel), as well as the bandpass-averaged flux densities in the F560W (red) and F770W (dark red) MIRI filters (right). These are compared against the expected, median depths achieved (horizontal dotted lines) with NIRCam (left) and MIRI (right) in integration times of 2.8 h = 10 ks, 25 h = JWST medium GO program, 75 h = JWST large GO program and 280 h = 1 Ms.
Firstly, regarding detection with NIRCam, we see that Pop III galaxies with the more top-heavy III.1 and III.2 IMFs should be readily detectable at in medium-to-deep NIRCam surveys. On the other hand, Pop III galaxies with a Kroupa IMF will require extremely deep integrations ( 100 h) to detect.
Secondly, detections with MIRI imaging will prove to be challenging. Detections in the F560W band will require long integrations (10–100 h), even for the Pop III.1 and Pop III.2 IMFs. detections in F560W for the Pop III Kroupa IMF, and in the F770W band for all three IMFs will likely be unachievable, given the exceptionally long integration times required ( h).
However, the tabulated magnitudes and associated integration times assume an unlensed Pop III galaxy at the nominal stellar mass of . If there is a flux boost for the Pop III galaxy, either because of a magnification factor from gravitational lensing, or because the galaxy is a multiple of the nominal stellar mass then the required integration times will decrease. Assuming background-limited observations, the signal-to-noise S/N scales as , where is the continuum flux density in the appropriate JWST imaging band. Hence with the flux boost the new continuum level is , and the required integration times become . Thus with a flux boost factor , a detection of F770W for Pop III.1 and Pop III.2 starts to become a real possibility, as the integration times needed get pushed down to h and h, respectively. Thus deep MIRI imaging on gravitationally lensed fields (with ) and/or fortuitous imaging of massive Pop III galaxies (with ) will be necessary to get valuable flux constraints from the F770W filter.
In Table 1 we also show the timescales over which the average magnitude for Pop III galaxies in the listed JWST bands drops by 0.25 and 1.0 mag (following an instantaneous starburst), as an indication of the visibility window over which Pop III galaxies can be detected. Depending on the Pop III IMF, we see that the magnitudes remain roughly stable () for 2.2–4.0 Myr, with their brightness having faded more strongly () after 2.8–5.6 Myr. As we shall see in the next section on Pop III colour selection, Pop III galaxies maintain unique colours in the colour–colour plane over much longer timescales than the aforementioned visibility windows. Hence the limiting factor determining the timescale over which Pop III galaxies can be identified is their visibility window ( Myr), rather than the time window over which they exhibit unique colours (10–25 Myr).
3.2 Pop III galaxy colour selection
In this section we introduce colour selections that can be applied to identify Pop III candidates based off of their unique positions within colour–colour planes. In Section 3.2.1 we discuss what we believe to be the optimal Pop III colour selection, which is based off of both NIRCam and MIRI photometry. In Section 3.2.2, we discuss an alternative NIRCam+MIRI colour selection that can be more readily applied. In Sections 3.2.3 and 3.2.4 we discuss colour selections that only require NIRCam photometry. Finally, in Section 3.2.5, we briefly examine how effective measurements of the continuum slope, as inferred from photometry, will be at identifying Pop III candidates.
3.2.1 [O iii]H, H[S iii] colour selection
Colour selection
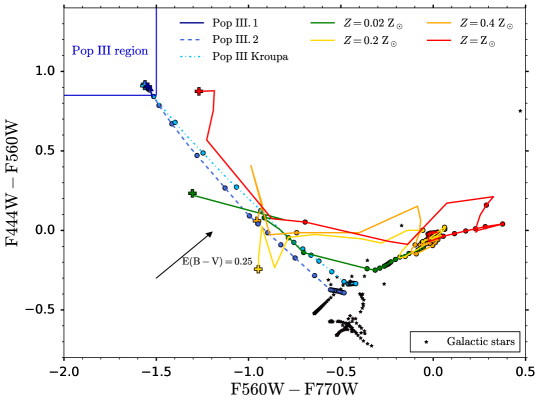
We show the F444WF560W, F560WF770W colour–colour plane in Fig. 3. We note that this colour selection was also advocated for in Zackrisson et al. (2011). Pop III galaxies are shown in blue, with the Pop III.1, Pop III.2 and Pop III Kroupa IMFs given by the dark blue solid, blue dashed and light blue dash-dotted curves, respectively. The non-Pop III galaxies are shown in non-blue colours, with the metallicities, given by the green, yellow, orange and red points, respectively. The plus symbols represent the galaxy colours immediately after an instantaneous starburst, while the circles show the colours after subsequent 5 Myr intervals. We see that the Pop III galaxies occupy a unique region within the colour–colour plane immediately after the instantaneous starburst. Indeed, these unique colours are maintained for 10–25 Myr (thus much longer than the Myr visibility windows following an instantaneous starburst discussed in Section 3.1.2). Furthermore, the non-Pop III galaxies do not overlap within this region, even long after the initial starburst. The basis behind this colour selection is as follows.
At , the H line falls in the MIRI F560W filter. As briefly outlined in Section 3.1.1, Pop III galaxies have higher Balmer recombination line luminosities per unit stellar mass. However, what is also the case is that the total (stellar+nebular) continuum is also higher per unit stellar mass. The net result, which will be discussed more in Section 4, is that the H equivalent width is only marginally higher ( dex) for Pop III galaxies. This therefore results in only a marginally higher ( mag) “magnitude excess” in the F560W filter (akin to the more familiar IRAC excess), compared to for non-Pop III galaxies.
Additionally, at , the [S iii] doublets are redshifted into the MIRI F770W band. Although these lines are not very bright in terms of absolute brightness, they are bright relative to the rest-frame NIR continuum, having equivalent widths comparable to the more well-known [O iii] doublets in the rest-frame optical. Therefore the [S iii] doublets have a comparable effect on broadband photometry to the [O iii] doublets, generating a substantial magnitude excess in the F770W filter. Pop III galaxies, with their marginally higher H EWs in F560W and lack of [S iii] in F770W, thus have bluer F560WF770W colours compared to non-Pop III galaxies.
Finally, at , the [O iii] doublet is redshifted into the NIRCam F444W band. This doublet drives a substantial magnitude excess in the F444W filter for non-Pop III galaxies. As a result, Pop III galaxies, with their lack of [O iii] in F444W, and their marginally higher H EWs in F560W thus have redder F444WF560W colours compared to non-Pop III galaxies.
Contamination
It is therefore the presence (or absence) of bright emission lines that is driving our colour selection in Fig. 3. The reason why both and galaxies have the most similar colours to Pop III is because their [O iii] and [S iii] emission lines have low EW. In the former case this is because of the lack of metals, while in the latter it is due to the lack of ionisation and/or heating of the ISM. Thus, whilst Pop III galaxies occupy a unique region within this colour–colour plane, they can start to become confused with and galaxies once observational errors on the measured colours are taken into account. Indeed, with only a detection in each filter comprising the colour pair, the colour uncertainty is , and there can be some contamination of the Pop III region within the colour–colour plane. This contamination is largely eliminated with detections within each filter, but given the challenge of detecting Pop III galaxies with MIRI (see Section 3.1.2), this seems impractical to achieve.
Our colour selections in this work, with the exception of F444WF560W, have been chosen such that Pop III galaxies exhibit bluer colours than non-Pop III galaxies. This approach has been adopted for two reasons.
Firstly, it ensures that non-Pop III galaxies, which can be reddened by dust, become even further separated from Pop III galaxies in the colour–colour plane. The shift in colour–colour caused by such reddening is shown by the reddening vector in each of our colour–colour diagrams.
Secondly, it ensures that the typical red contaminants that one encounters in high- searches, such as Galactic brown dwarfs, Balmer break galaxies and dusty galaxies are not a concern. Instead, one must instead worry about potentially blue contaminants. At the long wavelengths typically probed by our colour selections, we capture the light redward of the blackbody peak in all but the coolest Galactic stars. Hence these stars appear blue in e.g. the F444WF560W and F560WF770W colours. As can be seen from Fig. 3, there is no risk of confusing Pop III galaxies with Galactic stars, which are shown by the small brown star symbols and correspond to theoretical SEDs for very low-mass stars and brown dwarfs from Chabrier et al. (2000), as well as simple blackbody spectra spanning the temperature range (K) .
The other potential contaminants would be blue, lower- galaxies. In order to replicate the very blue F560WF770W colours seen, these systems would have to have high EW emission lines that lie beyond H in the rest-frame. We found that the Paschen recombination lines (in the Zackrisson et al. 2011 models) simply do not have sufficient EW to achieve this, hence low- contaminants are not a concern for this colour–colour selection. Indeed, assuming an otherwise flat SED, the magnitude excess driven by emission lines in e.g. the F560W filter (yielding a blue F560WF770W colour) is related to the total rest-frame equivalent width of all the emission lines that sit in the F560W filter, via , where is the bandpass width of the filter. Hence a given observed blue F560WF770W colour demands an increasingly higher rest-frame EW for contaminants at lower redshifts, which makes such low- contaminants (such as Pa emitters, which would require the rest-frame EW of H emitters) unlikely in this case.
Regarding potential contaminants at even higher redshift, the only possibility would be galaxies with bright [O iii] emission in the F560W filter. However, as can be seen in Appendix B, although such galaxies can mimic the red F444WF560W colours seen in Pop III galaxies, they have relatively flat F560WF770W colours (due to strong H emission in the F770W filter) compared to the blue colours seen in Pop III galaxies. Hence there is no risk of confusing Pop III galaxies with [O iii] emitters in the F444WF560W, F560WF770W colour–colour plane.
Redshift range of applicability
We now comment on the redshift range over which these colour selections can be applied. In principle, this redshift range is set by the redshift interval over which the emission lines that drive the colour selection fall within the intended filters. In practice however, the usable redshift range is narrower, as other (bright) emission lines get redshifted into and out of the adopted filters. This causes the locus of points occupied by Pop III and non-Pop III galaxies to drift in the colour–colour plane, causing overlap between Pop III and non-Pop III, and thus potential contamination.
We therefore find that the F444WF560W, F560WF770W colour selection can safely be applied over the redshift range . Beyond this redshift range galaxies begin to occupy the Pop III region within the colour–colour plane. However, if such high metallicity galaxies are not deemed a concern at , as one might not expect to find such enriched galaxies at these high redshifts (see e.g. Maiolino et al., 2008), then our colour selection can be applied over the broader redshift range . A reliable assessment of the photometric redshift of Pop III candidates from their Ly breaks will therefore likely be important to rule out potential high- non-Pop III contaminants.
Pop III region
The solid blue lines in Fig. 3 denote our boundaries for what we define to be the “Pop III region” of the F444WF560W, F560WF770W colour–colour plane. This is the range of colours that are uniquely exhibited by Pop III galaxies within the redshift range of applicability for this colour selection. When defining the extent of the Pop III region, we only consider the colours displayed by Pop III galaxies up to 5 Myr after the initial starburst, as beyond this timescale Pop III galaxies (and their associated colours) are likely too faint to be observed with JWST (see Section 3.1.2). This is why the Pop III region does not encompass the full range of Pop III tracks in the F444WF560W, F560WF770W colour–colour plane. In defining the Pop III region, we have aimed to be as restrictive as possible, by keeping the Pop III region as small as possible. Our priority is to minimise the risk of contamination, which comes at the cost of completeness, as we will likely miss some real Pop III galaxies in the JWST data (as these get scattered out of the Pop III region by observational error or model uncertainties). We leave the boundaries of the Pop III region open-ended if we deem there to be little risk of contamination on the open side.
The boundaries of the Pop III region in the F444WF560W, F560WF770W colour–colour plane are given by:
| (1) | ||||
If contamination by galaxies is not deemed a concern, these boundaries can be extended to:
| (2) | ||||
We wish to stress that the identification of potential Pop III candidates through an application of the Pop III region criterion should be done with caution. Within the redshift range of applicability, the only galaxies (within the Zackrisson et al. 2011 models) that can exhibit colours within the Pop III region of the colour–colour plane are Pop III galaxies (by definition, and ignoring observational error). However, as discussed earlier, it is possible for non-Pop III galaxies outside of this redshift range (and Galactic stars) to have colours that lie within the Pop III region. Whenever applicable, we discuss these potential contaminants in the text and provide recommendations on how to distinguish them from actual Pop III galaxies. Additionally, the Pop III regions defined in this work were established by only considering the (limited) set of metallicities and galaxy properties probed by the Zackrisson et al. (2011) models. Hence it is possible that the Pop III regions we have defined suffer from more contamination than what is explored here. Additionally, owing to model uncertainties, different Pop III (and non-Pop III) models likely predict different locations for the Pop III region in the colour–colour plane.
Caveats
Finally, we comment on the robustness of these colour selections. In Appendix A we show the same colour–colour plane but applied to the Nakajima & Maiolino (2022) models. Qualitatively, we obtain similar results to what was obtained using the Zackrisson et al. (2011) models. There are minor quantitative differences regarding the positions of Pop III galaxies in the colour–colour plane, owing to differences in the spectral shapes and the EWs of the relevant emission lines between the Zackrisson et al. (2011) and Nakajima & Maiolino (2022) models. As the Nakajima & Maiolino (2022) models extend below , we find that our adopted colour selections likely also pick up galaxies (even in the absence of any observational error). However, as we will discuss in Section 4, deep follow-up spectroscopy will enable us to definitively distinguish between Pop III and very metal-poor galaxies.
We note that our colour selections assume a covering fraction . Since these colour selections are primarily driven by the presence (or absence) of bright emission lines in the adopted filters, the resulting colours are sensitive to the strength of the emission lines and thus the covering fraction. For example, if we instead assume a covering fraction , then the emission line fluxes and equivalent widths will be smaller, resulting in a shift of the Pop III and non-Pop III regions in the colour–colour plane. Since the offset between Pop III and non-Pop III galaxies is due to their difference in emission line strength, this will also result in a reduced separation between Pop III and non-Pop III galaxies in the colour–colour plane. Therefore, while our colour selections are in principle effective at identifying Pop III candidates with , they may miss Pop III galaxies with lower covering fractions, as these could potentially overlap with the non-Pop III regions in our colour–colour planes.
3.2.2 [O iii], [O iii]H colour selection
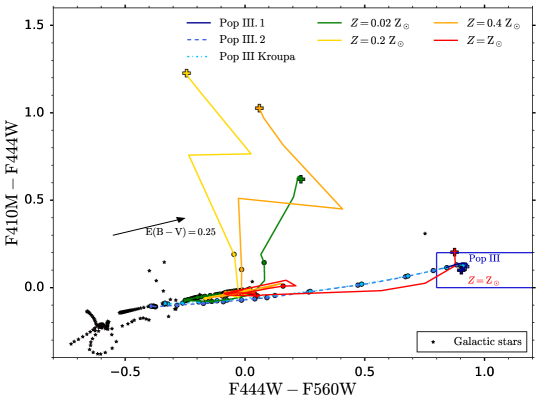
Due to the weaker sensitivity of the MIRI F770W filter, together with the lack of bright H/He emission lines in this filter at (as H instead sits in the MIRI F560W filter at ) and lower continuum level, it will likely be very challenging to actually detect Pop III galaxies in the MIRI F770W filter (see Table 1 and Fig. 2). Thus, we introduce an alternative colour selection in Fig. 4, that is still rather robust (barring any contamination from galaxies), but much more practical to apply in practice. We substitute the MIRI F770W filter for the much more sensitive NIRCam F410M filter (though the F356W filter can also be used). Thus this colour selection does not require as considerable of a flux boost from gravitational lensing or elevated Pop III masses to be applied. Here we use the F410MF444W, F444WF560W filter pairs for our colour–colour selection. The basis behind this Pop III colour selection is as follows.
As outlined earlier, [O iii] sits in the F444W filter at . The F410M filter is chosen because it contains no bright metal emission lines and just measures the continuum level. Hence at this redshift the F410MF444W colour is sensitive to the equivalent width of [O iii]. This colour is therefore red for non-Pop III galaxies and relatively flat for Pop III galaxies as there is no oxygen. As before, H sits in the F560W filter, with the F444WF560W colour being relatively red for Pop III galaxies.
We note that the F356W filter could be adopted instead of F410M. The benefit of selecting the wide-band filter is that it is more sensitive and can be used over a wider redshift interval. Indeed, [O iii] sits in the F410M filter at , which drives blue (rather than red) F410MF444W colours for non-Pop III galaxies in that redshift range. Accounting for the effects of dust reddening and observational error on the measured colours, as well as uncertainties on the measured photometric redshifts, such galaxies could be confused with Pop III galaxies, which is why the F410M filter can only be used over a narrower redshift interval. The drawback of using the alternative F356W filter is that it also contains the [O ii] lines at , which therefore diminishes the impact of [O iii] in driving redder colours in non-Pop III galaxies, thus reducing the separation between Pop III and non-Pop III galaxies in the colour–colour plane.
The F410MF444W, F444WF560W colour selection can be applied over the redshift interval . Owing to their similar F410MF444W and F444WF560W colours to Pop III galaxies, contamination from galaxies may be a concern over this entire redshift range. The alternative F356WF444W, F444WF560W colour selection can be applied over the wider redshift range (but still suffers contamination by galaxies).
Furthermore, [O iii] emitters at are also likely contaminants, due to their strong [O iii] emission in the F560W filter, together with their relatively flat F410MF444W colours, thus mimicking the colours of Pop III galaxies. Given that these [O iii] emitters are at higher redshift, they should in principle (barring any strong Ly emission, see the next section) exhibit a stronger Ly break in the F115W filter, being partial or even full F115W dropouts (F115WF150W ), as opposed to the Pop III galaxies which should only exhibit minor IGM attenuation (F115WF150W ) in the F115W filter.
The boundaries of the Pop III, region in the F410MF444W, F444WF560W colour–colour plane are given by:
| (3) | |||
The boundaries of the Pop III, region in the alternate F356WF444W, F444WF560W colour–colour plane are instead:
| (4) | |||
3.2.3 [O iii], Ly colour selection
Colour selection
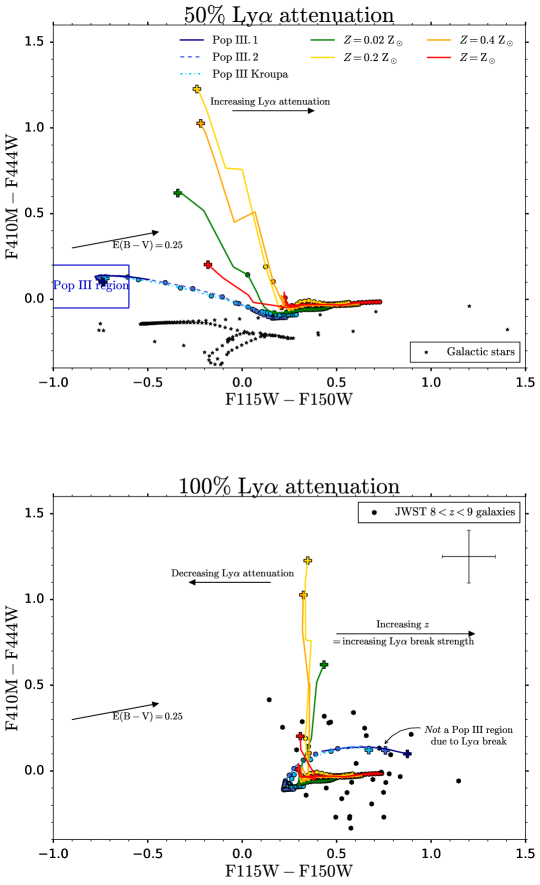
Given NIRCam’s greater sensitivity and imaging footprint (9.7 arcmin2 vs 2.35 arcmin2) compared to MIRI, we now discuss alternative colour selections that only require NIRCam photometry. We show our F410MF444W, F115WF150W colour selection in Fig. 5. The basis behind this colour selection is as follows.
At , the Ly line falls within the F115W filter. Unlike the Balmer recombination lines, and which we shall discuss more extensively in Section 4, the equivalent width of Ly is substantially higher for Pop III galaxies compared to non-Pop III. Hence the magnitude excess in the F115W filter caused by Ly is much greater for Pop III galaxies. The F150W filter is chosen to measure the neighbouring continuum level, with the F115WF150W colour thus being sensitive to the EW of Ly. Hence Pop III galaxies will have bluer F115WF150W colours than non-Pop III galaxies as they have a larger Ly EW.
This colour selection can be applied across the redshift range . The alternative F356WF444W, F115WF150W colour selection can be applied over the wider redshift range .
The boundaries of the Pop III region in the F410MF444W, F115WF150W colour–colour plane are given by:
| (5) | |||
The boundaries of the Pop III region in the alternative F356WF444W, F115WF150W colour–colour plane are instead:
| (6) | |||
Contamination
Galactic stars are not likely potential contaminants. Any stars that have comparable F410MF444W, F115WF444W colours to Pop III galaxies (such as those in the lower left region of Fig. 5) should be able to be identified as such from an inspection of their full SED. Additionally, starburst galaxies at with bright H emission in the F115W filter can mimic the colours of Pop III galaxies. However, continuum detections in F090W and bluer, non-JWST filters should enable one to distinguish between galaxies (which are non-detected in those bands) and these low-redshift interlopers.
Ly attenuation
It should be noted that the colours shown in Fig. 5 were obtained by applying the Inoue et al. (2014) prescription for IGM attenuation to the Zackrisson et al. (2011) spectra. This IGM attenuation essentially removes all flux blueward of the central wavelength of Ly. However, it does not account for any scattering/attenuation of the flux redward of the Ly peak, which can substantially diminish the total line flux that will actually be seen in observations. Indeed, Castellano et al. (2022) showed that galaxies in the epoch of reionisation first need to carve out an ionising bubble of radius 1 Mpc before Ly is able to effectively escape. Given the Pop III visibility window (following an instantaneous starburst) of Myr, this is insufficient time for ionising photons to traverse such a distance, let alone completely ionise the gas enclosed in this volume. Hence the true Ly flux observed will likely be substantially less than what was adopted to generate the F115WF150W colours in Fig. 5. Hence in practice this colour selection may not be effective at identifying Pop III galaxies, as we will no longer be sensitive to the intrinsic Ly EW.
We do note, however, that in most models, Pop III galaxies form because minihalos (–, which are otherwise capable of H2 cooling) get strongly irradiated by the Lyman–Werner radiation from nearby, metal-enriched galaxies (e.g. Stiavelli & Trenti, 2010) or quasars (e.g. Johnson & Aykutalp, 2019), which prevents any star formation within these systems until they reach the H i cooling mass (–). Thus, these nearby galaxies/quasars may have contributed to the growth of an ionising bubble that would allow Ly to escape from Pop III galaxies. In this case, the Ly flux should not be as heavily attenuated, suggesting that our aforementioned colour selection should in principle still be effective at identifying such Pop III galaxies.
We show the effect of increasing the Ly attenuation to 100% (up from 50%) in the bottom panel of Fig. 5. The F115WF150W colours clearly become more red due to the lack of Ly emission in the F115W filter. We stress that the relatively red F115WF150W colours for Pop III galaxies with 100% Ly attenuation (compared to non-Pop III) should not be used as a Pop III indicator. The reason for this is that at , the F115WF150W colour is sensitive to the strength of the Ly break, and thus becomes increasingly more red with increasing redshift (up to ) as the Ly break occupies progressively more of the F115W filter. Hence the red colours of Pop III galaxies with 100% Ly attenuation can overlap with those of non-Pop III galaxies at slightly higher redshift (than the galaxies shown in Fig. 5). Hence the F115WF150W colour cannot be used to distinguish between Pop III and non-Pop III galaxies in the case of substantial Ly attenuation.
Comparison against early JWST galaxies
We examine whether any potential Pop III candidates are present in the early JWST data, by showing the colours for galaxy candidates observed with JWST in Fig. 5. These galaxy candidates were imaged as part of the CEERS ERS program, and are taken from the June 2022 pointings 1, 2, 3, and 6. Briefly, the NIRCam data was reduced following the procedure in Adams et al. (2022) and Ferreira et al. (2022), sources were identified using SExtractor (Bertin & Arnouts, 1996) and photometric redshifts were derived using LePhare (Arnouts et al., 1999; Ilbert et al., 2006). Colours were measured from our calibrated photometry using the post-launch zero points, e.g., Adams et al. (2022).
The galaxy candidates shown in Fig. 5 were selected by requiring a detection in the filters comprising the colour selection, non-detections (i.e. ) in the HST F606W and F814W bands (using HST data from the public CANDELS-EGS catalogs of Stefanon et al., 2017), as well as a best-fit photometric redshift .
We see that the F115WF150W colours of these galaxy candidates are consistent with strong attenuation of Ly, and thus the F410MF444W, F115WF150W colour selection cannot be used to easily distinguish between Pop III and non-Pop III galaxies. Hence it is not possible to establish whether any Pop III candidates are present in the data. However these galaxies do generally fall in the region of where we find galaxies with normal stellar populations. This example shows how difficult it can be to use purely photometry to find Pop III galaxies, and likely several avenues will need to be investigated to verify any given system as Pop III.
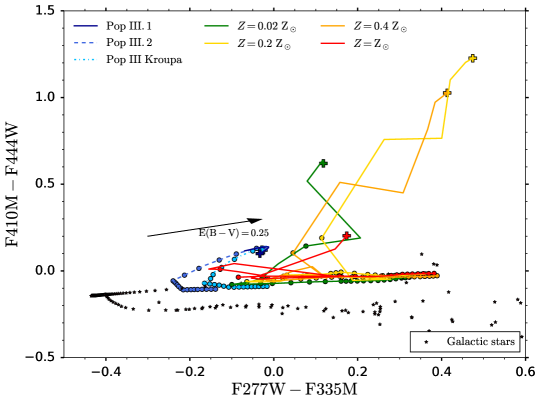
3.2.4 [O iii], [O ii] colour selection
In order to highlight the prospects (or lack thereof) of identifying Pop III candidates through colour selections that target weaker (i.e. lower EW) metal emission lines, we show our final colour–colour selection in Fig. 6. Here the F410MF444W, F277WF335M colour pairs have been adopted. At the [O ii] doublet sits in the F335M filter, while the F277W filter contains no bright metal lines and just measures the continuum level. Hence the F277WF335M colour is sensitive to the [O ii] EW and will be red for non-Pop III galaxies and relatively flat for Pop III galaxies. Here the less-used F335M filter was adopted, rather than the standardly used F356W, because the medium-band F335M filter will be more sensitive to the (rather weak) [O ii] doublet.
This colour selection has two main drawbacks. Firstly, it is only applicable over the narrow redshift range . Secondly, the flat Pop III colours in both filter pairs means that this region of the colour–colour plane can readily be contaminated by other sources. At late times after the initial starburst, both the [O ii] and [O iii] lines will have faded and non-Pop III galaxies will have rather flat colours. Additionally, other sources at a diverse range of redshifts are likely to also have similar flat colours in these filter pairs.
Owing to the limitations with this colour selection, we therefore do not define a Pop III region to identify potential Pop III candidates in this colour–colour plane.
3.2.5 Continuum slope selection
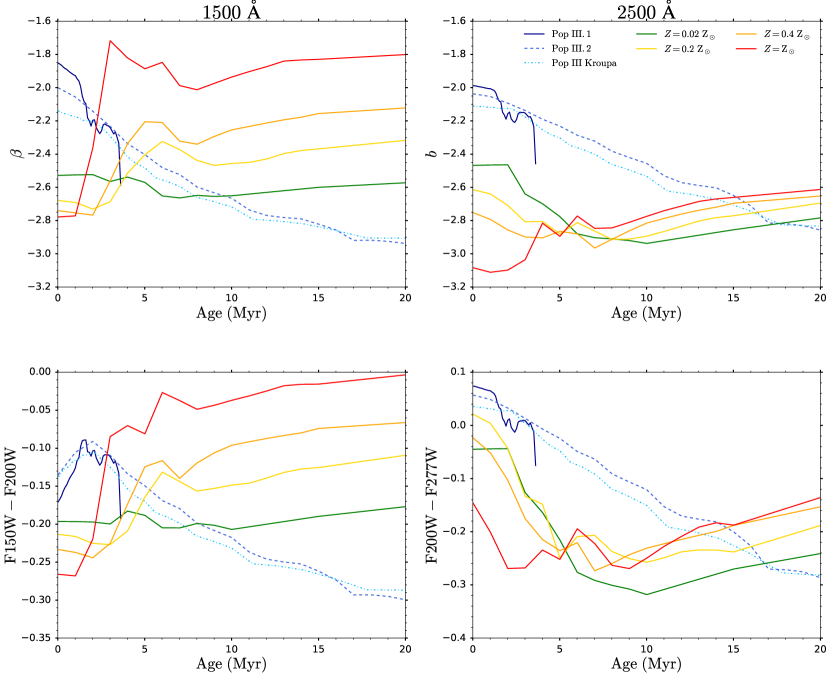
In this selection we briefly examine how effective measurements of the continuum slope, as inferred from photometry, will be at identifying Pop III candidates. We show the well-known UV power law index, i.e. the 1500 Å UV slope in the top-left panel of Fig. 7. Given JWST’s extensive coverage and sensitivity in the near- and mid-infrared, we will now be capable of probing the continuum slope at longer wavelengths than was possible before. Hence in the top-right panel we now introduce the new 2500 Å slope , with this wavelength range being selected for two reasons. Firstly, because it is relatively sensitive to Pop III stars. Secondly, because this region of the rest-frame spectrum is mostly devoid of high EW emission lines (with the possible exception of Mg ii at 2800 Å), which would otherwise distort the inferred spectral slope.
As has already been pointed out in e.g. Raiter et al. (2010), Zackrisson et al. (2011) and Dunlop (2013), the UV slope (and the 2500 Å slope ) are in fact higher, i.e. the spectrum is more red, for Pop III galaxies. Despite the fact that the most luminous Pop III stars will be hotter and therefore bluer than their non-Pop III counterparts, the very bright but relatively red nebular continuum emission, which is very notable in Pop III spectra, is ultimately what drives the redder UV and 2500 Å slopes in Pop III galaxies.
In the bottom panels we show the likely inferences that can be made on the 1500 Å and 2500 Å slopes from measurements with NIRCam photometry. At , the 1500 Å and 2500 Å rest-frame wavelengths get redshifted to 1.35 µm and 2.25 µm, respectively. Thus we adopt the nearest accessible NIRCam filters available (avoiding F115W as it sits on Ly), namely the F150WF200W and F200WF277W filter pairs. The expected colours in these NIRCam filters can roughly be estimated by assuming the continuum follows a power law: . Here is the power law index, and are the effective wavelengths in the blue and red filters defining the colour , with being the power law normalisation constant. In practice, if we wish to separate Pop III galaxies from non-Pop III, we are interested in the colour difference .
As can be seen from Fig. 7, in practice these colour shifts are rather small (immediately after a starburst), being only – mag. This is in part due to the He ii line, which falls in the F150W filter, thus driving bluer-than-otherwise Pop III F150WF200W colours. Furthermore, the Mg ii 2800 Å doublet, which falls in the F277W filter, drives redder-than-otherwise non-Pop III F200WF277W colours. Given the marginally redder Pop III colours, this small signal will likely be erased by even a minor amount of dust reddening. Additionally, assuming detections in the NIRCam filters, the colour uncertainty , which likely renders this Pop III colour diagnostic impractical.
3.2.6 He ii medium-band selection
| Filter | Redshift range | IMF | Apparent magnitude (AB mag) | exposure time (h) | Magnitude excess |
|---|---|---|---|---|---|
| Pop III.1 | 28.27 | 0.78 | 0.30 | ||
| F140M | Pop III.2 | 29.49 | 7.37 | 0.15 | |
| Pop III Kroupa | 31.44 | 267.73 | 0.09 | ||
| Pop III.1 | 28.54 | 1.63 | 0.30 | ||
| F162M | Pop III.2 | 29.75 | 15.13 | 0.15 | |
| Pop III Kroupa | 31.71 | 559.37 | 0.09 | ||
| Pop III.1 | 28.74 | 1.33 | 0.23 | ||
| F182M | Pop III.2 | 29.94 | 12.13 | 0.12 | |
| Pop III Kroupa | 31.89 | 440.25 | 0.07 | ||
| Pop III.1 | 28.95 | 1.69 | 0.32 | ||
| F210M | Pop III.2 | 30.17 | 15.98 | 0.16 | |
| Pop III Kroupa | 32.13 | 591.15 | 0.09 |
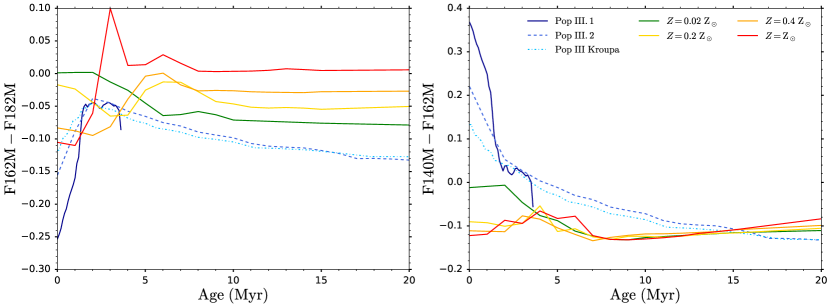
As discussed in the literature (e.g. Schaerer, 2002, 2003; Raiter et al., 2010), and in more detail in Section 4.3, high EW He ii emission likely serves as the definitive Pop III indicator. Thus, in this section we highlight the prospects of identifying Pop III candidates at through NIRCam medium-band imaging campaigns that target the He ii emission from Pop III galaxies. Although the EW of He ii is relatively high for Pop III galaxies, it is still small in an absolute sense, typically ranging from roughly 10–100 Å across different Pop III models and IMFs. Hence the added emission line sensitivity from medium-band imaging (over a wide-band) will likely be crucial for identifying such emission lines through photometry, if possible. The expected magnitude excess driven by He ii emission in the F162M filter (which we discuss below) is 0.30 mag for Pop III.1 galaxies (which have rest-frame He ii EW of 50 Å), and 0.48 mag for the highest EW He ii Pop III galaxies in the Nakajima & Maiolino (2022) models (with rest-frame EW of 80 Å).
At (rather than our usual ), He ii sits in the NIRCam F162M filter. As before, we seek neighbouring filters that probe the continuum level around He ii , with the resulting colour thus being sensitive to the EW of the He ii line, and thus in principle enabling one to distinguish between Pop III and non-Pop III galaxies. To find a way to identify these galaxies we consider filters both redward and blueward of F162M, with Pop III galaxies having relatively blue and red colours in the corresponding F162M filter pairs, respectively. Owing to the intrinsically bluer UV slopes for non-Pop III galaxies (as discussed in the previous section), the filter used redward of F162M must be close in wavelength to F162M, otherwise Pop III and non-Pop III galaxies will exhibit similarly blue colours. We thus adopt the NIRCam F182M filter, rather than the F200W filter. Additionally, owing to the small wavelength gap between He ii and Ly, it is in fact rather challenging to select a filter blueward of F162M that does not include Ly (otherwise complicating the interpretation of the colour) and also does not cover He ii (otherwise weakening the Pop III colour signature). We thus adopt the NIRCam F140M filter (rather than the F115W or F150W filters).
We show the F162MF182M and F140MF162M colours of galaxies in the left and right panels of Fig. 8, respectively. As mentioned above, although the He ii emission for Pop III galaxies drives a magnitude excess in the F162M filter, Pop III and non-Pop III galaxies have comparably blue F162MF182M colours, due to the intrinsically bluer UV slopes of non-Pop III galaxies. In contrast, these bluer non-Pop III slopes help to increase the separation in F140MF162M colour between Pop III and non-Pop III galaxies, with this colour therefore being a potentially viable Pop III indicator for galaxies at .
However, the redder F140MF162M colours exhibited by Pop III galaxies can in principle be replicated by non-Pop III galaxies with a moderate amount of dust reddening. Indeed, although the F140M and F162M filters probe (at ) the rather narrowly separated rest-frame wavelengths of 1400 Å and 1620 Å, respectively, most dust attenuation laws rise sharply with decreasing wavelength in this wavelength regime. Hence the amount of dust reddening, i.e. colour excess , needed to shift mag ÅÅ the non-Pop III galaxy F140MF162M colours onto the Pop III is , assuming the Calzetti et al. (2000) dust attenuation law.
Still, such dust-reddened non-Pop III galaxies should in principle be able to be distinguished from Pop III galaxies, from an inspection of their full SED, which should be relatively red. In the same vein, other potential contaminants such as C iv emitters (i.e. AGN or metal-poor galaxies, see e.g. Stark et al., 2015) at comparable redshifts, can in principle also be removed (as these should have bright [O iii] emission). Indeed, by considering the entire SED (such as through SED fitting, which we will investigate in a future work), the inclusion of the F140M filter (or F182M filter) likely is not necessary to probe the He ii EW (at ), as the presence (or absence) of a magnitude excess in the F162M filter should be able to be inferred from a comparison against the photometry in the other JWST bands.
Thus, owing to the enhanced sensitivity and footprint of NIRCam relative to MIRI, medium-band NIRCam imaging surveys that search for high EW He ii emitters may provide a viable alternative for identifying Pop III candidates to the deep F560W and F770W imaging campaigns with MIRI. However, it is likely that only Pop III galaxies with the most top-heavy IMFs (such as Pop III.1), imaged immediately after the starburst (Myr) can be identified in this way.
In Table 2, we show the various NIRCam medium-bands that can be used to target He ii emitters at different redshifts, together with the expected apparent magnitudes, exposure times needed for 5 detections, and the likely magnitude excess in the medium-band, for the Zackrisson et al. (2011) Pop III models considered in this work. We note that the NIRCam F140M, F162M, F182M and F210M bands can be used to target He ii (and thus Pop III, AGN or DCBH candidates, but also galaxies containing Wolf–Rayet stars and X-ray binaries, see e.g. Katz et al., 2022a) at 7.5, 9, 10 and 12, respectively. The exposure times required to reach depth in the aforementioned filters are relatively short (compared to the MIRI requirements), at h and h for the Pop III.1 and Pop III.2 IMFs, respectively. However, deeper imaging (going beyond depth, i.e. ) will likely be required for the small photometric He ii signature we are searching for (– mag) to be convincing.
3.3 Slitless emission-line-selection
In this subsection we discuss the prospects for identifying Pop III candidates from blind emission-line surveys carried out through slitless spectroscopy with NIRISS ( (µm) ) and NIRCam ( (µm) ). We focus on the brightest lines that yield the greatest constraints on the potential Pop III nature of the galaxy. These lines are H, Ly and He ii 1640. The expected line fluxes for Pop III galaxies with detected immediately after an instantaneous starburst are shown in Table 3. We also include the expected integration times needed to achieve a line detection. We discuss the properties of these individual lines below and how well we can use these as a tracer of Pop III galaxies.
| IMF | H flux (cgs) | H 5 exposure time (h) | Ly flux (cgs) | Ly 5 exposure time (h) | He ii 1640 flux (cgs) | He ii 1640 5 exposure time (h) |
| Pop III.1 | 33.09 | 0.05 | 31.64 | |||
| Pop III.2 | 275.23 | 0.44 | 955.46 | |||
| Pop III Kroupa | 11473.49 | 16.76 | 95545.72 |
3.3.1 H detection
At , the H line is redshifted to µm, placing it within the F444W band for slitless spectroscopic observations with NIRCam. As can be seen from Table 3, the integration times needed for a detection are demanding (33.09 h, 275.33 h), even for the Pop III.1 and Pop III.2 IMFs. Of course, the integration times can be reduced substantially with moderate lensing and/or a mass boost above the assumed nominal stellar mass.
As will be discussed more extensively in Section 4, the merits to detecting H for Pop III identification are twofold. Firstly, a measurement of the H equivalent width can place constraints on the potential Pop III nature of the source, though in practice this will require a line detection at much more than just significance. Secondly, a non-detection of the neighbouring bright [O iii] line (which will also lie within the F444W band), can be used to place constraints on the upper limit of the metallicity of the galaxy (see also Nakajima & Maiolino, 2022).
3.3.2 Ly detection
At , the Ly line is redshifted to µm, placing it within the F115W band for slitless spectroscopic observations with NIRISS. The Ly line fluxes in Table 3 correspond to the intrinsic line fluxes, i.e. assuming no IGM attenuation. In this case the integration times needed are exceptionally short, owing to the great intrinsic brightness of this line for Pop III galaxies. In reality, Ly will be heavily attenuated and scattered by the IGM. Thus this line will actually be much fainter in observations, and may therefore be an unreliable Pop III indicator.
3.3.3 He ii detection
At , the He ii 1640 line is redshifted to µm, placing it within the F150W band for slitless spectroscopic observations with NIRISS. For Pop III.1, the He ii 1640 flux is comparable to that of H. Furthermore, NIRISS F150W and NIRCam F444W are also comparable in sensitivity. Hence the integration time of 31.64 h is similar to that of H (33.09 h). However, with Pop III.2 and Pop III Kroupa, the He ii line begins to drop off with respect to H and the integration times become much longer, at h and h, respectively. Thus a He ii 1640 line detection with NIRISS will only be possible for Pop III.2 sources that are much more massive than the nominal stellar mass () and/or have been strongly gravitationally lensed ().
As has been discussed in the literature (see e.g. Schaerer, 2002, 2003; Raiter et al., 2010; Grisdale et al., 2021; Nakajima & Maiolino, 2022) and will also be discussed more thoroughly in Section 4, the main merit for detecting He ii is that it is a clear Pop III signature. Although AGN and/or DCBH can also produce bright He ii emission (see e.g. Nakajima & Maiolino, 2022), these can be readily ruled out from photometry due to their much redder colours (see e.g. Inayoshi et al., 2022, or Fig. 14). Furthermore, a measurement of the He ii equivalent width can also distinguish between different Pop III IMFs, and thus is able to firmly separate Pop III.1, Pop III.2 and Pop III Kroupa galaxies.
4 Pop III constraints from follow-up spectroscopy
Having identified potential Pop III candidates either from colour selection, emission-line selection and/or SED fitting (not covered in this work), deep follow-up spectroscopy will be essential to place tighter constraints on the Pop III nature of these sources. In this section we outline the NIRSpec spectroscopic observations that could be undertaken, as well as the spectroscopic diagnostics that need to be applied to achieve this. Our emphasis will be on emission line equivalent widths, emission line mass-to-light ratios and line ratios. We will focus on the brightest lines that will be accessible by NIRSpec that are most sensitive to Pop III star formation. As discussed earlier, at these lines are H, Ly and He ii .
We show the expected emission line fluxes for Pop III galaxies with immediately after an instantaneous starburst in Table 4. We also show the expected integration times needed to achieve a detection of these lines, assuming that the NIRSpec gratings (which are the most sensitive gratings for emission line detection) have been used. For H, Ly and He ii , this corresponds to the G395M, G140M and G140M gratings, respectively.
| IMF | H flux (cgs) | H 5 exposure time (h) | Ly flux (cgs) | Ly 5 exposure time (h) | He ii 1640 flux (cgs) | He ii 1640 5 exposure time (h) |
| Pop III.1 | 1.29 | 0.0058 | 8.32 | |||
| Pop III.2 | 10.71 | 0.0525 | 251.50 | |||
| Pop III Kroupa | 446.57 | 2.00 | 25150.42 |
4.1 H diagnostics
4.1.1 H equivalent width
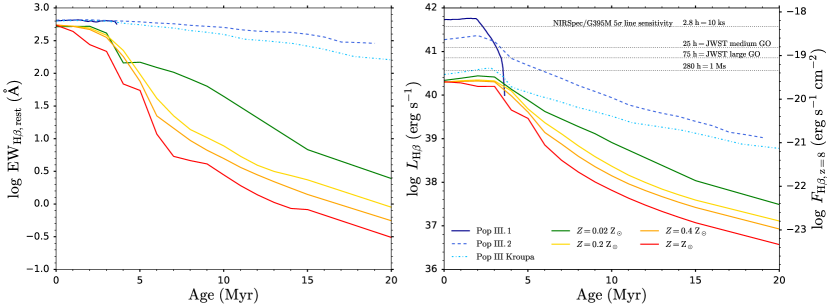
In Fig. 9 we show how the H rest-frame equivalent widths (left panel) and the H line luminosity (right) vary with time after an instantaneous starburst. We again assume a nominal stellar mass of . Hence the H line luminosity in the right panel is essentially a mass-to-light ratio, representing how much line luminosity is expected per formed. As pointed out earlier in this paper, Pop III galaxies have much greater H line luminosities per unit stellar mass formed. However, their continuum normalisation per unit stellar mass formed (not shown) is also substantially higher. As a result, their H equivalent widths are only marginally higher ( dex) than for non-Pop III galaxies.
In principle, a measurement of the H equivalent width can therefore be used to distinguish between Pop III and non-Pop III galaxies. With a H detection, the uncertainty on the measured flux will be 20%. However, the separation between Pop III and non-Pop III is dex %. Hence in practice, barring any model uncertainties, a much deeper integration (e.g. the integration time) with H detected at will likely be required to more definitively identify a source as likely being a Pop III galaxy. Given the relatively short exposure times needed to detect H at with NIRSpec/G395M, at h and h for Pop III.1 and Pop III.2 galaxies, respectively, such deep integrations would certainly be possible to achieve even within a small-to-medium JWST GO observing program.
However, there are other complications with using the measured H equivalent width as a Pop III indicator. Firstly, the exact EW associated with Pop III will likely be model dependent, with different models likely predicting different H line luminosities and continuum levels. Indeed, in the Nakajima & Maiolino (2022) models (not shown) the expected H EWs for Pop III galaxies are –, whereas for non-Pop III the range is , thus overlapping with the predicted Pop III EWs in the Zackrisson et al. (2011) models ().
Secondly, the H EW also depends on the covering fraction of the ISM gas (see e.g. Zackrisson et al., 2013). The lower the covering fraction, the lower the H line luminosity but also the lower the nebular continuum. Hence in principle one would also need to carefully take into account the (or ) dependence of the H EW (for more details see Zackrisson et al., 2013) before conclusive inferences on the Pop III nature of the source can be made.
It should be noted that the EWs shown in Fig. 9 correspond to a single stellar population all formed after an instantaneous starburst. For non-Pop III galaxies, there may be an underlying older stellar population, in addition to the newly formed starburst. Provided that this older stellar population provides a non-negligible flux density to the continuum, the observed EWs for non-Pop III galaxies will actually be lower than those shown in Fig. 9.
Furthermore, determining the H EW requires both the H line flux and the continuum level to be measured. As Pop III galaxies are typically very faint (see Fig. 1 and Table 1), detecting their continuum through e.g. NIRSpec/PRISM spectroscopy will be a challenging endeavour (requiring 28.5–30.5 AB mag depth, barring any flux boost from gravitational lensing or elevated Pop III stellar masses). Therefore, the continuum flux density of Pop III galaxies will likely have to be estimated from broadband photometry. However, the difficulty with this is that the bandpass-averaged flux densities measured via photometry can be strongly boosted (by e.g. dex mag) above the continuum level by the high EW emission lines in Pop III galaxies (as shown in Fig. 1). This makes estimating the true continuum level around H particularly difficult as it itself has a high EW and it is also bracketed by a series of bright emission lines at shorter (e.g., H) and longer wavelengths (e.g. H). In principle, this flux boost effect can be corrected for by taking into account the measured H flux (and all other high EW lines that sit within the filter of interest), as the observed bandpass-averaged flux density , where is the true continuum level, is the total flux of all the emission lines that sit within the filter, and is the bandpass width of the filter. Thus, the potential difficulty in accurately estimating the continuum flux density (and the measurement error on the H flux), together with the small difference in H EW between Pop III and non-Pop III (and systematics and secondary dependences therein), likely renders the H EW impractical as a diagnostic for actually distinguishing between Pop III and non-Pop III galaxies.
4.1.2 H luminosity
As can be seen from Fig. 9, the H luminosity starts to drop off substantially 3 Myr after an instantaneous starburst. Thus the visibility window over which the H emission from Pop III galaxies can likely be detected with JWST (3 Myr) is comparable to the timescale over which these galaxies can be detected in broadband photometry (2.8–5.6 Myr, see Table 1). Note that the H luminosities (and fluxes) shown in Fig. 9 are for galaxies at a fixed stellar mass , and hence can be taken as an indication of the H luminosity per unit stellar mass ().
Now, given the large separation in H luminosity per unit stellar mass between Pop III and non-Pop III (1 dex), as well as the various Pop III IMFs (0.5 dex between Pop III.1 and Pop III.2), an accurate measurement of the line luminosity per unit stellar mass would enable one to readily confirm the Pop III nature of a source. Whilst the determination of the line luminosity is relatively straightforward, the difficulty lies with establishing the stellar mass. Indeed, the continuum flux density per unit stellar mass is vastly different for Pop III and non-Pop III galaxies (not shown), i.e. Pop III galaxies have much lower mass-to-light ratios. This can be inferred from considering the fact that the H line luminosities are much greater for Pop III, while their H EWs are almost the same as non-Pop III. As a result, an accurate determination of the stellar mass therefore requires an accurate assessment of the mass-to-light ratio. However, accurately knowing the mass-to-light ratio is akin to knowing whether the source is Pop III or not (as the M/L ratio is much lower for Pop III). Thus, in order to determine whether a source is Pop III from its line luminosity per unit stellar mass, we would have to already know if it was Pop III or not, making this diagnostic unusable in practice.
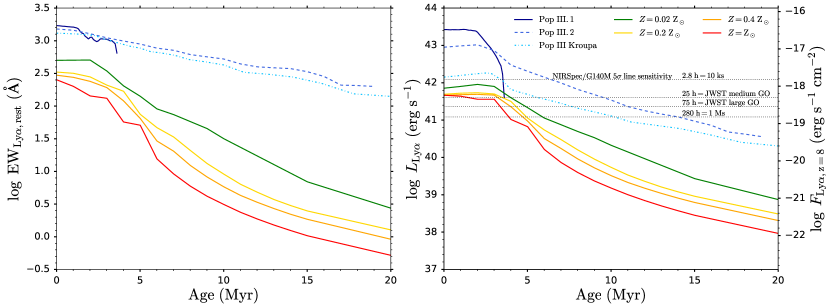
4.2 Ly diagnostics
We show the intrinsic Ly rest-frame equivalent widths and line luminosities in Fig. 10. As alluded to earlier, unlike the Balmer recombination lines, the Ly EW is much larger for Pop III galaxies relative to non-Pop III. Thus a measurement of the intrinsic Ly EW would not only enable one to readily separate Pop III from non-Pop III, but in principle it would also enable one to distinguish between different Pop III IMFs.
However, in practice, the Ly line will likely be heavily attenuated and scattered by the IGM. Hence the observed Ly line luminosities and EWs will likely be substantially lower than those shown in Fig. 10, which would erode this otherwise strong Pop III signature.
4.3 He ii diagnostics
4.3.1 He ii equivalent width
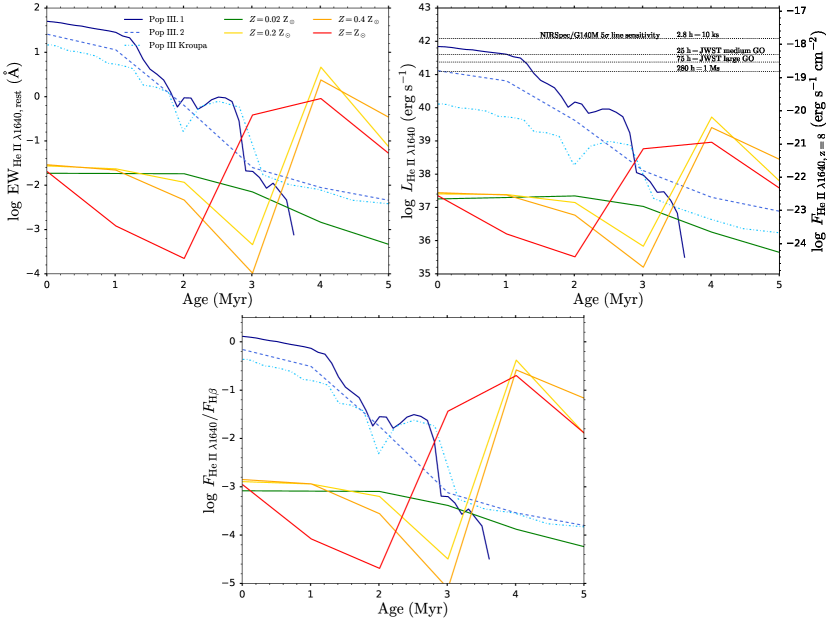
We show the He ii rest-frame equivalent width, line luminosity and flux ratio with H in Fig. 11. We see that bright He ii emission is a clear spectroscopic signature for Pop III galaxies (as has been previously suggested in e.g. Schaerer, 2002, 2003; Raiter et al., 2010; Grisdale et al., 2021; Nakajima & Maiolino, 2022), as they have substantially higher EWs than non-Pop III. Hence a measurement of the EW will establish the Pop III nature of a source. Furthermore, the various Pop III IMFs also yield distinctly different He ii EWs (with a dex spread).
Using the Nakajima & Maiolino (2022) Pop III models (not shown here but see their Fig. 6), we have investigated the dependence of the He ii EW on ionisation parameter , finding only a very weakly decreasing trend (with dex) with increasing (from to ). Thus the EW ranges spanned by each IMF is distinct, even within the range of possible values. However, the He ii EWs do depend somewhat on the covering fraction , with dex between . We note that while the dependence of the He ii EW on ionisation parameter is relatively weak in the Nakajima & Maiolino (2022) models (over the range , it is much stronger ( dex) in the models of Raiter et al. (2010) (over the range with cm-3). However, most of this ionisation parameter dependence stems from the evolution between , with only weak trends in the range , similar to the Nakajima & Maiolino (2022) models.
Furthermore, we note that while models generally predict Pop III galaxies to have characteristically high He ii EWs (compared to non-Pop III galaxies), with the EW tending to increase as the IMF becomes increasingly top-heavy, there is some variation in the actual EW predicted by the different models, which could render a determination of the Pop III IMF difficult. In the Zackrisson models shown in Fig. 11, the predicted Pop III He ii rest-frame EWs are in the range 16–50 Å, while for the Nakajima & Maiolino (2022) models the range is instead 25–80 Å, with Raiter et al. (2010) and Inoue (2011) predicting 20–90 Å and 15 Å, respectively. Despite the aforementioned secondary dependences and systematics, a measurement of the He ii EW should help to place valuable constraints on the Pop III IMF.
Now, determining the He ii EW also requires the continuum level to be estimated (which is likely more viable via broadband photometry, rather than spectroscopy, as 28.5–29.5 AB mag depth is required). In contrast to H, the EW of He ii is relatively small and the spectrum around Å is relatively devoid of bright emission lines (with the exception of Ly, see Fig. 1). Hence the true continuum level around He ii can be relatively well estimated from broadband photometry (using e.g. the F150W or F200W filters at ). However, given the narrow width of the NIRSpec slits (0.2 arcsec), the physical scale associated with the He ii emission (probed with NIRSpec) may be different to the physical scale associated with the broadband continuum emission (probed by NIRCam). Thus it may in principle be difficult to accurately determine the He ii EW from a combination of NIRSpec and NIRCam data. While this potential issue should not matter for distinguishing between Pop III and non-Pop III galaxies (due to their very large separation in He ii EW), it may complicate the determination of the Pop III IMF. Nevertheless, provided that Pop III galaxies are very compact/point-sources (which seems reasonable to assume), then the He ii EW and thus the Pop III IMF should be able to be determined relatively accurately.
4.3.2 He ii H ratio
We also show the He ii / H ratio in Fig. 11, where there is a dex spread between the different Pop III IMFs. The benefits for considering this ratio in Pop III searches are twofold.
Firstly, in the case of both a He ii and H detection, the line ratio can be computed. This ratio is less sensitive to the ionisation parameter than the He ii EW, with dex from to . The dependence on is similar, with dex between . Thus a measurement of the He ii /H ratio would therefore in principle enable tighter constraints on the Pop III IMF.
Secondly, although the He ii line is comparable in brightness to H for the Pop III.1 and Pop III.2 IMFs (see Table 4), it sits in the G140M NIRSpec grating at . This grating is roughly less sensitive than the G395M grating which covers H. Hence the integration times needed to detect He ii at are roughly – longer than those needed to detect H at . Indeed the integration times needed to detect He ii at will require deep to ultra-deep integrations, with 8.32 h to 251.50 h needed for Pop III.1 and Pop III.2, respectively. Thus, in many cases, only H will be detected with JWST. Nevertheless, a He ii non-detection can still be used to place valuable upper limits on the Pop III IMF, as from the non-detection one can begin to rule out the more top heavy IMFs. Of course, if the source is reasonably magnified (–), or is some small multiple of the nominal stellar mass, then even for the Pop III.2 IMF a line detection can be made within a medium JWST GO program (25–75 hours).
4.3.3 He ii luminosity
We note that the He ii luminosity for Pop III galaxies begins decreasing immediately after an instantaneous starburst, with an even steeper decline after – Myr. Thus the visibility window over which the He ii emission from Pop III galaxies can be detected with JWST (– Myr) is even shorter than the visibility windows for H and Ly detections ( Myr) and detections in broadband photometry (2.8–5.6 Myr). Thus, even if a true Pop III galaxy has been identified as a Pop III candidate from photometry, there is no guarantee that its Pop III nature can be definitively established from deep follow-up spectroscopy. As if the galaxy is observed too late after the initial starburst, its He ii emission will likely be too faint to detect, with the inferred He ii EW therefore being too low for the galaxy to be classified as Pop III.
4.4 He ii
The He ii recombination line is also accessible with NIRSpec. In principle this line could also be used as a spectroscopic Pop III indicator. Indeed, He ii sits in the more sensitive G395M grating, together with H. However the He ii line is roughly an order of magnitude fainter than He ii (in the Zackrisson et al. 2011 Pop III models, but see also Osterbrock & Ferland 2006). Hence a line detection would take approximately longer than for He ii and roughly longer than for H, thereby making it impractical to use this line as a Pop III indicator.
4.5 Metallicity constraints from [O iii] non-detections
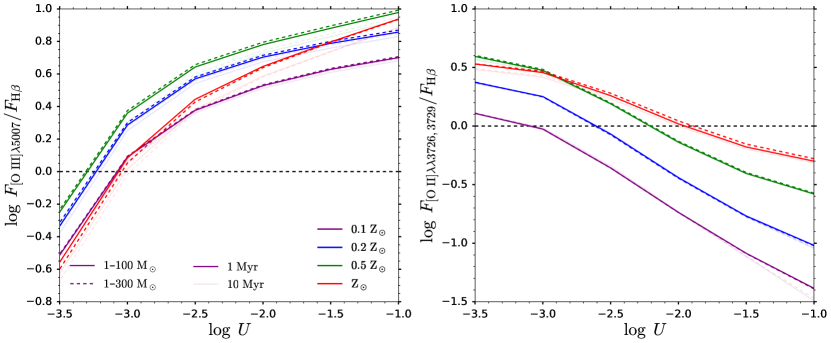
At the [O iii] line is also redshifted into the G395M grating, similar to H. Conveniently, the [O ii] doublet also falls within the G395M grating at these redshifts. At intermediate-to-high metallicities and ionisation parameters, the [O iii] line is brighter than H. Hence a H detection (at e.g. ), together with a [O iii] non-detection, can place valuable upper limits on the metallicity of a galaxy.
In Fig. 12 we show the [O iii] /H line ratio (left panel) and the [O ii]/H line ratio (right panel) for the Nakajima & Maiolino (2022) models. We have chosen to use the Nakajima & Maiolino (2022) models for this analysis because they enable one to explore the dependence of the line ratios on ionisation parameter , and also because they extend down to lower metallicities. We find that at most metallicity and ionisation parameter combinations the [O iii] line is brighter than H. Hence in this regime the [O iii] line should be detected if H has been detected. It is only at low ionisation parameter that [O iii] begins to become fainter than H, and we may expect a [O iii] non-detection. However, it is precisely at these low ionisation parameters that the [O ii] line becomes brighter than H. Hence there is a sort of “see-saw effect”, where one of [O iii] or [O ii] is always brighter than H (assuming no dust attenuation dimming the [O ii] doublet) across the range of possible ionisation parameters. Hence if both [O iii] and [O ii] are not detected, but H is detected, then the metallicity of the galaxy is likely below .
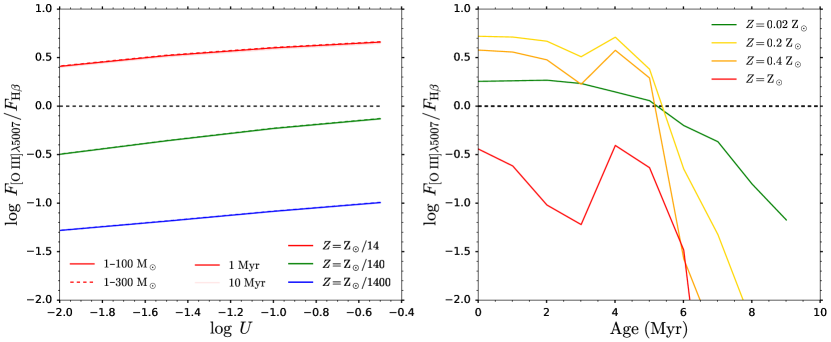
Pushing to even lower metallicities, we now turn to Fig. 13. We show the [O iii] /H ratios for the Nakajima & Maiolino (2022) and Zackrisson et al. (2011) models in the left and right panels, respectively. We see that for the Zackrisson et al. (2011) models (which adopt a spherical geometry for the H ii region and therefore a radially varying ionisation parameter for each metallicity), the [O iii] line is brighter than H even at , provided that we see the galaxy within Myr after the starburst. We note that it is unlikely for non-Pop III galaxies to be mistakenly identified as Pop III candidates Myr after a starburst, as demonstrated by our colour selections in Section 3.2, hence the weaker [O iii] emission in this regime is likely not a concern. If the radially-varying ionisation parameters in the Zackrisson et al. (2011) models are representative of the ionisation parameters we expect to find in galaxies at , then a H detection, together with an [O iii] non-detection, implies that the metallicity is likely below .
Now if we consider the Nakajima & Maiolino (2022) models in the left panel, we find that the [O iii] line begins to dip below H in brightness at . Indeed, at , we find that the logarithm of the [O iii] /H ratio is . Therefore if H is detected at in this scenario, a longer integration time would be needed to detect [O iii] (at 5). In other words, once H is detected, a longer integration time is needed to establish that the metallicity is .
If such a deep integration in the G395M grating is considered, it is likely better placed to instead opt for an equally deep integration in the G140M grating instead. As discussed in Section 4.3, and shown in Table 4, one requires a roughly – longer integration to detect He ii compared to H. A He ii line detection would yield much more conclusive constraints on both the Pop III nature of a source and the Pop III IMF, than can possibly be inferred from upper limits on the metallicity from non-detections of [O iii] .
4.6 H vs. H at
Our discussion of Balmer recombination lines has thus far centred around H for it lies within the NIRSpec spectral range at . In contrast, the intrinsically brighter H line is redshifted into the MIRI/MRS spectral range at this redshift. Although H is roughly brighter than H (barring any dust, which seems reasonable to ignore for pristine Pop III galaxies, see e.g. Zackrisson et al., 2011), MIRI is roughly less sensitive (at the H wavelength) than NIRSpec (at the H wavelength). Hence the integration time needed for a detection of H at will be roughly longer than that needed for H. Furthermore, while there are additional merits to observing H due to added metallicity constraints from [O iii] non-detections (a line that is typically brighter than H), non-detections of the neighbouring [N ii] and [S ii] doublets around H yield no such constraints as these lines are typically fainter than H (see e.g. Baldwin et al., 1981; Kewley et al., 2001; Steidel et al., 2014; Shapley et al., 2015; Curti et al., 2022).
4.7 Metal line (non-)detections with ALMA
In the epoch of reionisation, [O iii] 88 µm is likely the brightest emission line in the rest-frame FIR, usually being brighter than [C ii] 158 µm (see e.g. Laporte et al., 2019; Harikane et al., 2020; Katz et al., 2022b). Here we briefly discuss the merits for following-up potential Pop III candidates with ALMA to rule out metal line emission and hence place constraints on the metallicity. Depending on the ISM temperature, the [O iii] line is between – more luminous than [O iii] 88 µm (see e.g. Moriwaki et al., 2018; Yang & Lidz, 2020). Furthermore, NIRSpec/G395M is roughly more sensitive than ALMA at emission line detection. Hence the integration times needed to detect [O iii] 88 µm with ALMA are – longer than what is needed to detect [O iii] with JWST. Thus NIRSpec is currently the optimal instrument for spectroscopic follow-up of potential Pop III candidates.
4.8 Spectroscopic follow-up with 25+ m telescopes
The next generation of 25+ m class, extremely large telescopes will likely play a complementary, synergistic role with JWST. Indeed, with their wider mirror diameters, they will have both a vastly larger light collecting area, as well as significantly less light smearing (by diffraction, provided that adaptive optics is used). This makes such telescopes ideal for deep follow-up spectroscopic observations of potential Pop III candidates identified by JWST. Indeed, provided that the emission line of interest does not sit on top of a skyline, these 25+ m telescopes will be substantially more sensitive at emission line detection than JWST.
At , the He ii line is redshifted into the H-band of TMT/IRMS, the planned infrared multi-object spectrograph for the Thirty Meter Telescope. Assuming a point source (which seems reasonable for a Pop III galaxy), the expected emission-line sensitivity in the H-band is erg s-1 cm-2 at within a 1 h integration (Skidmore, 2015). This is thus roughly an order of magnitude more sensitive than NIRSpec/G140M, which has a sensitivity of erg s-1 cm-2. Thus the integration times needed to achieve a line detection of He ii with 25+ m telescopes will essentially be shorter than the integration times needed with JWST. Thus such telescopes should readily be able to spectroscopically follow-up potential Pop III candidates (identified through JWST NIRCam+MIRI photometry and/or slitless spectroscopy) and confirm their Pop III nature through a detection of the He ii line (for more details, see Grisdale et al., 2021), requiring only 0.08 h and 2.52 h of integration for the Pop III.1 and Pop III.2 IMFs.
Ultimately to find Pop III galaxies we will need to use a combination of photometry to find good candidates and then spectroscopy to follow them up and ensure that no metal lines are present. However, with the large number of distant galaxies that JWST is finding, and will continue to find, a photometric method for selecting candidates, such as what we present here, is necessary to remove systems that have properties that are not consistent with being Pop III galaxies.
5 Summary and conclusions
In this paper we investigate the prospects for observing and identifying Pop III galaxies with JWST. We based our analysis on two different, but complementary Pop III models: Zackrisson et al. (2011) and Nakajima & Maiolino (2022). The basis for this approach was twofold. Firstly, to establish the robustness of our colour selections and spectroscopic diagnostics in identifying and confirming Pop III candidates. Secondly, to draw upon the synergy between these two different models. With the Zackrisson et al. (2011) models we are able to determine the expected apparent magnitudes of Pop III sources in various NIRCam and MIRI filters, as well as the expected line fluxes of the brightest, most sensitive tracers of Pop III stars. On the other hand, with the Nakajima & Maiolino (2022) models we explore the dependence of emission line diagnostics on the ionisation parameter and push our analysis of non-Pop III galaxies down to even lower (but still non-pristine) metallicities. In the main body of the paper we concentrated on galaxies, as at these redshifts the H and [O iii] lines are still accessible with NIRCam and NIRSpec. In the appendix, we undertook a similar analysis for Pop III galaxies. Our main findings at are summarised below.
Assuming a Pop III galaxy at the nominal stellar mass of , we find that deep NIRCam imaging (– AB mag, – h) and deep-to-ultra-deep MIRI F560W imaging (– AB mag, – h) will be needed to achieve a detection, even for the more top-heavy Pop III.1 and Pop III.2 IMFs. Indeed, detections in the MIRI F770W band and beyond will likely be very challenging, with the flux boost from either strong gravitational lensing () and/or fortuitous imaging of exceptionally massive () Pop III galaxies being essential. Hence deep imaging of lensing clusters and/or deep-and-wide imaging of many fields will likely be needed to find such bright Pop III sources.
We discuss a number of colour–colour selections to identify Pop III galaxy candidates, outlining the physical basis behind the colour selection, the redshift window of applicability and potential Galactic and low- contaminants. The main physical driver behind our Pop III colour selections are the (marginally) higher Balmer EWs for Pop III galaxies, together with their lack of (high EW) metal lines, which each contribute a significant “magnitude excess” in their respective filters.
We find that a combination of NIRCam and MIRI photometry yields the most reliable Pop III colour selection, advocating for the use of the F444WF560W, F560WF770W colour–colour selection at . Assuming flux density detections, there will likely be some contamination of the Pop III region of the colour–colour plane by both metal-poor () and metal-rich () galaxies. These systems have comparable H EWs (in F560W) to Pop III, while also having relatively low EW [O iii] (in F444W) and [S iii] (in F770W) emission lines. This colour selection can be applied at . However, if galaxies are not considered as a contaminant concern at these redshifts, then the colour selection can be applied over the wider redshift interval. Even with perfect photometry (i.e. zero observational errors) however, there will still be contamination by extremely metal-poor galaxies (). However, with deep follow-up spectroscopy, one will be able to readily distinguish between Pop III galaxies and these non-pristine contaminants.
Given that detections in the MIRI F770W filter will be challenging, we also discuss an alternative NIRCam+MIRI colour selection that substitutes the MIRI F770W filter for the much more sensitive NIRCam F410M (or F356W) filter. This colour selection therefore does not require as substantial of a flux boost from gravitational lensing and/or elevated Pop III stellar masses to be applied, but does suffer from contamination by galaxies.
We also introduce two other colour–colour selections, which only require NIRCam photometry, thus needing even shorter integration times to actually apply. These are the [O iii] vs. Ly selection (i.e. F410MF444W, F115WF150W), and the [O iii] vs. [O ii] selection (i.e. F410MF444W, F277WF335M). However, these colour selections have their own caveats which likely limit their practical use.
Additionally, we consider the prospects for identifying potential Pop III candidates with slitless spectroscopic emission-line surveys with JWST. We focused on three bright, sensitive tracers of Pop III stars: H, Ly and He ii . Ly is intrinsically very bright and so in principle would be readily available with NIRISS, requiring only h integrations. However, owing to IGM attenuation/scattering the observed Ly flux will be substantially reduced, thereby likely making this line impractical to search for in slitless observations. Instead, H and He ii seem more promising, though would still require deep-to-ultra-deep observations, at 30–300 h and 30–1000 h, respectively. Hence the flux boost from moderate-to-high lensing () and or from observing moderately massive Pop III galaxies () will likely again be essential.
Finally, we focus on the additional Pop III constraints that can be derived from follow-up spectroscopy on potential Pop III candidates with NIRSpec. We find that with the NIRSpec/G395M grating, detections of H can readily be achieved (1–10 h) for the Pop III.1 and Pop III.2 IMFs. In principle, a measurement of the H rest-frame EW can be used to distinguish between Pop III and non-Pop III galaxies. However the difference in EW immediately after a starburst is in fact very small, being only dex. Furthermore, owing to slight differences in the H EWs predicted by different models, as well as a secondary dependence on covering fraction , it may be difficult in practice to make definitive inferences on the Pop III nature of a galaxy from a measurement of the H EW.
Echoing earlier works (see e.g. Schaerer, 2002, 2003; Raiter et al., 2010; Grisdale et al., 2021; Nakajima & Maiolino, 2022), we find that the He ii emission line serves as the optimal Pop III indicator. Indeed, a measurement of the He ii line enables one to both definitively identify Pop III galaxies, as well as place constraints on the Pop III IMF. If both He ii and H are detected then there are merits to computing their line ratio, as this is less sensitive to the (perhaps unknown) ionisation parameter . Deep-to-ultra-deep integrations (10–250 h) with NIRSpec/G140M will be needed to detect He ii at at . With moderate (–) lensing and/or moderately massive (–) Pop III galaxies, such line detections can be achieved in medium-sized JWST GO programs.
Given the characteristically high He ii EWs for Pop III galaxies (relative to non-Pop III), we investigate the prospects for identifying Pop III candidates from NIRCam imaging surveys that target this line. As Pop III galaxies still have a relatively low (in an absolute sense) He ii EW (10–100 Å, rest-frame), we find that medium-band imaging will be essential, as even then the photometric signal we are looking for is rather small ( 0.30 mag, 0.15 mag for the Pop III.1 and Pop III.2 IMFs, respectively). Therefore, owing to NIRCam’s greater sensitivity and imaging footprint compared to MIRI, NIRCam medium-band imaging campaigns that search for high EW He ii emitters may perhaps be a viable alternative to the demandingly deep imaging required with MIRI F560W and F770W.
Since [O iii] and H are both simultaneously observable with NIRSpec/G395M at , we looked into the metallicity constraints that can be placed from a H detection and [O iii] non-detection. We find that this likely implies a metallicity . Lowering the upper limit on the metallicity down to would require an integration time that is longer than needed to detect H at .
Thus, observing and identifying Pop III galaxies with certainty will be a challenging task for JWST, likely requiring very deep imaging and spectroscopy to achieve the required S/N for robust detections. All of JWST’s key scientific instruments, namely NIRCam, MIRI, NIRISS and NIRSpec, will likely play a crucial role in our search for the first stars. Indeed in this ambitious quest we likely will need to leverage on the flux boost from gravitational lensing and hope for fortuitous imaging of moderate-to-high mass Pop III galaxies. However, it is with the future synergy between space and ground, drawing on the enhanced sensitivity of the next-generation of extremely large telescopes, that we will be able to readily detect the bright He ii signature of Pop III galaxies.
Acknowledgements
JT thanks Rebecca Bowler, Andrew Bunker, Mark Dickinson, Jeyhan Kartaltepe, Harley Katz and Laura Pentericci for useful discussions which helped improve the quality of this manuscript. JT, CC and NA acknowledge support by the ERC Advanced Investigator Grant EPOCHS (788113) from the European Research Council (ERC) (PI Conselice). RM acknowledges support from the ERC Advanced Grant 695671 ‘QUENCH’. RM acknowledges support by the Science and Technology Facilities Council (STFC). EZ acknowledges funding from the Swedish National Space Board. LF acknowledges financial support from Coordenação de Aperfeiçoamento de Pessoal de Nível Superior - Brazil (CAPES) in the form of a PhD studentship.
This work is based on observations made with the NASA/ESA Hubble Space Telescope (HST) and NASA/ESA/CSA James Webb Space Telescope (JWST) obtained from the Mikulski Archive for Space Telescopes (MAST) at the Space Telescope Science Institute (STScI), which is operated by the Association of Universities for Research in Astronomy, Inc., under NASA contract NAS 5-03127 for JWST, and NAS 5–26555 for HST. These observations are associated with JWST program 1345.
Data Availability
The Zackrisson et al. (2011) models used in this article are available at: https://www.astro.uu.se/ ez/yggdrasil/yggdrasil.html. The Nakajima & Maiolino (2022) models used in this article will be shared on reasonable request to Kimihiko Nakajima. Any remaining data underlying the analysis in this article will be shared on reasonable request to the first author.
References
- Adams et al. (2022) Adams N. J., et al., 2022, arXiv e-prints, p. arXiv:2207.11217
- Arnouts et al. (1999) Arnouts S., Cristiani S., Moscardini L., Matarrese S., Lucchin F., Fontana A., Giallongo E., 1999, Mon. Not. R. Astron. Soc., 310, 540
- Astropy Collaboration (2013) Astropy Collaboration 2013, Astron. Astrophys., 558, 33
- Baldwin et al. (1981) Baldwin J. A., Phillips M. M., Terlevich R., 1981, Publ. Astron. Soc. Pacific, 93, 5
- Bertin & Arnouts (1996) Bertin E., Arnouts S., 1996, Astron. Astrophys. Suppl., 117, 393
- Bromm & Larson (2004) Bromm V., Larson R. B., 2004, Annu. Rev. Astron. Astrophys., 42, 79
- Bromm & Yoshida (2011) Bromm V., Yoshida N., 2011, Annu. Rev. Astron. Astrophys., 49, 373
- Bromm et al. (1999) Bromm V., Coppi P. S., Larson R. B., 1999, Astrophys. J., 527, L5
- Bromm et al. (2003) Bromm V., Yoshida N., Hernquist L., 2003, Astrophys. J., 596, L135
- Calzetti et al. (2000) Calzetti D., Armus L., Bohlin R., Kinney A., Koornneef J., Storchi-Bergmann T., 2000, Astrophys. J., 533, 682
- Castellano et al. (2022) Castellano M., et al., 2022, Astron. Astrophys., 115, 1
- Chabrier et al. (2000) Chabrier G., Baraffe I., Allard F., Hauschildt P., 2000, Astrophys. J., 542, 464
- Curti et al. (2022) Curti M., et al., 2022, Mon. Not. R. Astron. Soc., 512, 4136
- Dunlop (2013) Dunlop J. S., 2013, Observing the First Galaxies, 1 edn. Springer Berlin, Heidelberg (arXiv:1205.1543), doi:10.1007/978-3-642-32362-1_5
- Ferland et al. (1998) Ferland G. J., Korista K. T., Verner D. A., Ferguson J. W., Kingdon J. B., Verner E. M., 1998, Publ. Astron. Soc. Pacific, 110, 761
- Ferland et al. (2013) Ferland G. J., et al., 2013, Rev. Mex. Astron. y Astrofis., 49, 137
- Ferrara et al. (2000) Ferrara A., Pettini M., Shchekinov Y., 2000, Mon. Not. R. Astron. Soc., 319, 539
- Ferreira et al. (2022) Ferreira L., et al., 2022, Astrophys. J. Lett., 938, L2
- Gardner et al. (2006) Gardner J. P., et al., 2006, Space Sci. Rev., 123, 485
- Grisdale et al. (2021) Grisdale K., Thatte N., Devriendt J., Pereira-Santaella M., Slyz A., Kimm T., Dubois Y., Yi S. K., 2021, Mon. Not. R. Astron. Soc., 501, 5517
- Harikane et al. (2020) Harikane Y., et al., 2020, Astrophys. J., 896, 93
- Ilbert et al. (2006) Ilbert O., et al., 2006, Astron. Astrophys., 457, 841
- Inayoshi et al. (2022) Inayoshi K., Onoue M., Sugahara Y., Inoue A. K., Ho L. C., 2022, Astrophys. J. Lett., 931, L25
- Inoue (2011) Inoue A. K., 2011, Mon. Not. R. Astron. Soc., 415, 2920
- Inoue et al. (2014) Inoue A. K., Shimizu I., Iwata I., Tanaka M., 2014, Mon. Not. R. Astron. Soc., 442, 1805
- Johnson (2013) Johnson J. L., 2013, in , Form. First Galaxies Theory Simulations. Springer, Berlin, Heidelberg, pp 177–222 (arXiv:1105.5701), doi:10.1007/978-3-642-32362-1_4
- Johnson & Aykutalp (2019) Johnson J. L., Aykutalp A., 2019, Astrophys. J., 879, 18
- Johnson et al. (2008) Johnson J. L., Greif T. H., Bromm V., 2008, Mon. Not. R. Astron. Soc., 388, 26
- Katz et al. (2022a) Katz H., Kimm T., Ellis R. S., Devriendt J., Slyz A., 2022a, arXiv e-prints, p. arXiv:2207.04751
- Katz et al. (2022b) Katz H., et al., 2022b, Mon. Not. R. Astron. Soc., 510, 5603
- Kewley et al. (2001) Kewley L. J., Dopita M. A., Sutherland R. S., Heisler C. A., Trevena J., 2001, Astrophys. J., 556, 121
- Kroupa (2001) Kroupa P., 2001, Mon. Not. R. Astron. Soc., 322, 231
- Laporte et al. (2019) Laporte N., et al., 2019, Mon. Not. R. Astron. Soc. Lett., 487, L81
- Laporte et al. (2021) Laporte N., Meyer R. A., Ellis R. S., Robertson B. E., Chisholm J., Roberts-Borsani G. W., 2021, Mon. Not. R. Astron. Soc., 505, 3336
- Madau et al. (2001) Madau P., Ferrara A., Rees M. J., 2001, Astrophys. J., 555, 92
- Maiolino et al. (2008) Maiolino R., et al., 2008, Astron. Astrophys., 488, 463
- Miralda-Escudé (2003) Miralda-Escudé J., 2003, Science (80-. )., 300, 1904
- Moriwaki et al. (2018) Moriwaki K., et al., 2018, Mon. Not. R. Astron. Soc. Lett., 481, L84
- Nakajima & Maiolino (2022) Nakajima K., Maiolino R., 2022, Mon. Not. R. Astron. Soc., 513, 5134
- Osterbrock & Ferland (2006) Osterbrock D. E., Ferland G. J., 2006, Astrophysics of gaseous nebulae and active galactic nuclei
- Planck Collaboration (2020) Planck Collaboration 2020, Astron. Astrophys., 641
- Price-Whelan et al. (2018) Price-Whelan A. M., et al., 2018, Astron. J., 156, 123
- Raiter et al. (2010) Raiter A., Schaerer D., Fosbury R. A., 2010, Astron. Astrophys., 523, 1
- Salpeter (1955) Salpeter E. E., 1955, Astrophys. J., 121, 161
- Schaerer (2002) Schaerer D., 2002, Astron. Astrophys., 382, 28
- Schaerer (2003) Schaerer D., 2003, Astron. Astrophys., 397, 527
- Shapley et al. (2015) Shapley A. E., et al., 2015, Astrophys. J., 801, 88
- Skidmore (2015) Skidmore W., 2015, Res. Astron. Astrophys., 15, 1945
- Stark et al. (2015) Stark D. P., et al., 2015, MNRAS, 454, 1393
- Stefanon et al. (2017) Stefanon M., et al., 2017, Astrophys. J. Suppl. Ser., 229, 32
- Steidel et al. (2014) Steidel C. C., et al., 2014, Astrophys. J., 795
- Stiavelli & Trenti (2010) Stiavelli M., Trenti M., 2010, Astrophys. J. Lett., 716, 190
- Tan & McKee (2004) Tan J. C., McKee C. F., 2004, Astrophys. J., 603, 383
- Vikaeus et al. (2022) Vikaeus A., Zackrisson E., Schaerer D., Visbal E., Fransson E., Malhotra S., Rhoads J., Sahlén M., 2022, Mon. Not. R. Astron. Soc., 512, 3030
- Yang & Lidz (2020) Yang S., Lidz A., 2020, Mon. Not. R. Astron. Soc., 499, 3417
- Zackrisson et al. (2001) Zackrisson E., Bergvall N., Olofsson K., Siebert A., 2001, Astron. Astrophys., 375, 814
- Zackrisson et al. (2011) Zackrisson E., Rydberg C. E., Schaerer D., Stlin G., Tuli M., 2011, Astrophys. J., 740, 13
- Zackrisson et al. (2012) Zackrisson E., et al., 2012, Mon. Not. R. Astron. Soc., 427, 2212
- Zackrisson et al. (2013) Zackrisson E., Inoue A. K., Jensen H., 2013, Astrophys. J., 777
Appendix A [O iii]H, H[S iii] colour selection with Nakajima models
In Fig. 14 we again show the F444WF560W, F560WF770W colour–colour selection for Pop III galaxies, but now using the Nakajima & Maiolino (2022) models. Pop III galaxies are shown in various shades of blue, with the purple, dark blue and lighter blue symbols corresponding to , respectively. The metal-poor Pop II galaxies are shown in various shades of green, with the cyan, green and dark green symbols corresponding to , respectively. Metal-rich Pop I galaxies are shown in yellow, and AGN and DCBH are shown in orange and red, respectively. For the Pop III and Pop II models, the triangles, squares, pentagons and hexagons correspond to ionisation parameters , respectively. Larger symbols represent a higher upper mass limit for the IMF. The unfaded and faded symbols correspond to the galaxy colours 1 Myr and 10 Myr after the starburst, respectively. Unlike the Pop III and Pop II models, we do not further separate the Pop I or AGN/DCBH models in terms of metallicity, ionisation parameter, IMF or age.
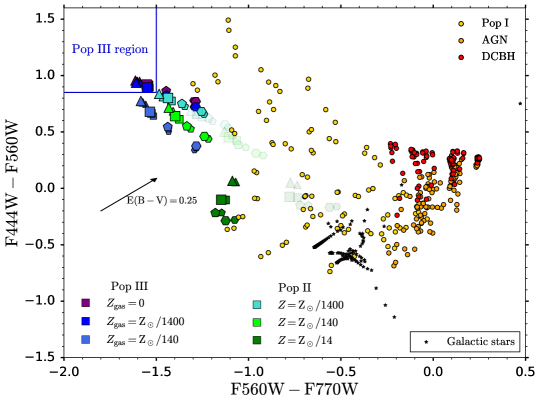
As was seen with the Zackrisson et al. (2011) models, Pop III galaxies have distinct colours within this colour–colour plane. The colours for Pop III galaxies with are very similar to those in the Zackrisson et al. (2011) models. Owing to the wider range of ionisation parameters available in the Nakajima & Maiolino (2022) models, together with the fact that models for Pop III stars with both pristine and very metal poor gas are available, the locus of points occupied by Pop III galaxies in this colour–colour plane immediately after the starburst is larger. Furthermore, as the Nakajima & Maiolino (2022) models also provide spectra for non-pristine Pop II galaxies with very low metallicities, we see that these extremely metal-poor galaxies with occupy similar regions of the colour–colour plane to the chemically pristine Pop III galaxies. With the Zackrisson et al. (2011) models we found that Pop III galaxies and galaxies still occupied distinct regions of the colour–colour plane. Hence extremely metal-poor galaxies () will likely be picked up, in addition to true Pop III galaxies, in such colour–colour selections. However, with follow-up spectroscopy, one can still readily distinguish between Pop III galaxies and these non-pristine contaminants, through measurements of the He ii rest-frame EW and line ratio with H.
Appendix B Observing and identifying Pop III galaxies
In the main body of the paper we focused on the observability and identification of Pop III galaxies at , because this is a relatively high redshift window where [O iii] and H are still accessible by NIRCam and NIRSpec. Indeed, [O iii] gets redshifted out of the NIRCam and NIRSpec ranges at & , respectively. H is redshifted out of the NIRCam and NIRSpec coverage at & . In this section we instead consider the prospects for observing and identifying Pop III galaxies at . The colour selections that we will introduce are analogous to the colour selections discussed in the main body of this paper, but now use redder filters as the high EW emission lines underpinning the colour selection are redshifted to longer wavelengths.
B.1 The observability of Pop III galaxies
In Tables 5, 6 and 7 we show the expected apparent magnitudes and line fluxes for Pop III galaxies at the nominal stellar mass , as well as the integration times needed to achieve detections.
For the expected apparent magnitudes in Table 5, we see that detections NIRCam will still be possible in relatively short exposure times (1–30 h). However, in this case the H and [O iii] lines have been redshifted into the MIRI F560W band, which is substantially less sensitive than NIRCam F444W. Furthermore, the [S III] doublet, which formed the basis for our most robust colour–colour selection, has now been redshifted into the MIRI F1000W band, which is again much less sensitive than MIRI F770W. Obtaining detections in the MIRI F560W and F770W bands will likely require moderate () gravitational lensing and/or imaging of a moderately massive ( ) Pop III galaxy. detections in the F1000W filter are only possible with an extreme flux boost () from lensing/larger stellar mass.
| IMF | F090W | F115W | F150W | F182M | F200W | F277W | F335M | F356W | F410M | F444W | F560W | F770W | F1000W |
|---|---|---|---|---|---|---|---|---|---|---|---|---|---|
| Pop III.1 | 38.63 | 37.45 | 27.94 | 28.74 | 28.83 | 28.99 | 28.93 | 28.89 | 28.95 | 28.98 | 29.07 | 28.34 | 29.61 |
| N/A | N/A | 0.12 | 1.33 | 0.45 | 1.23 | 2.72 | 0.99 | 3.84 | 2.56 | 159.26 | 125.94 | 3335.75 | |
| Pop III.2 | 39.78 | 38.62 | 29.08 | 29.94 | 30.00 | 30.12 | 30.07 | 30.03 | 30.09 | 30.12 | 30.25 | 29.50 | 30.79 |
| N/A | N/A | 1.04 | 12.13 | 3.85 | 10.02 | 22.23 | 8.05 | 30.82 | 21.32 | 1399.9 | 1067.04 | 29321.99 | |
| Pop III Kroupa | 41.73 | 40.62 | 31.04 | 31.89 | 31.94 | 32.07 | 32.03 | 31.99 | 32.05 | 32.09 | 32.24 | 31.49 | 32.80 |
| N/A | N/A | 37.74 | 440.25 | 137.29 | 357.12 | 822.01 | 247.54 | 1139.77 | 788.37 | 54713.63 | 41704.24 | 1167329.44 |
In terms of slitless spectroscopy, H and [O iii] will no longer be accessible, as these lines get redshifted out of the NIRCam F444W filter at and , respectively. Ly and He ii now fall in the NIRISS F150W and F200W filters, respectively.
| IMF | Ly flux (cgs) | Ly 5 exposure time (h) | He ii 1640 flux (cgs) | He ii 1640 5 exposure time (h) |
|---|---|---|---|---|
| Pop III.1 | 0.06 | 66.53 | ||
| Pop III.2 | 0.55 | 1918.84 | ||
| Pop III Kroupa | 21.89 | 191833.68 |
For follow-up spectroscopy with NIRSpec, H is only accessible up to , though we still include this line in Table 7, assuming a source at . Of particular note is that the He ii line now sits within the spectral range of the NIRSpec/G235M grating. This grating is in fact more sensitive than the G140M grating that was used at . Thus, despite the greater cosmological distance, the integration times needed to detect He ii at are actually shorter than those at : 6 vs 8 h for Pop III.1, and 166 vs. 252 h for Pop III.2. Indeed, at , the integration times needed to detect He ii (with NIRSpec/G235M), H (with NIRSpec/G395M) and H (with MIRI/MRS) are all comparable. Given the only moderately larger H and H rest-frame EWs for Pop III galaxies, the optimal line to target for deep follow-up spectroscopy would undoubtedly be He ii with NIRSpec/G235M.
| IMF | H flux (cgs) | H 5 exposure time (h) | Ly flux (cgs) | Ly 5 exposure time (h) | He ii 1640 flux (cgs) | He ii 1640 5 exposure time (h) |
| Pop III.1 | 3.71 | 0.02 | 5.75 | |||
| Pop III.2 | 30.90 | 0.14 | 165.96 | |||
| Pop III Kroupa | 1174.61 | 5.76 | 16596.02 |
B.2 Pop III galaxy colour selection
B.2.1 [O iii]H, H[S iii] colour selection
We show the [O iii]H, H[S iii] colour selection in Fig. 15, which uses the F560WF770W, F770WF1000W filter pairs. The colour selection can be applied over the redshift range , at which point contamination by galaxies begins. If such contamination is not a concern, this colour selection can be applied over the wider redshift range .
The boundaries of the Pop III region in the F560WF770W, F770WF1000W colour–colour plane are given by:
| (7) | ||||
If contamination by galaxies is not deemed a concern, these boundaries can be extended to:
| (8) | ||||
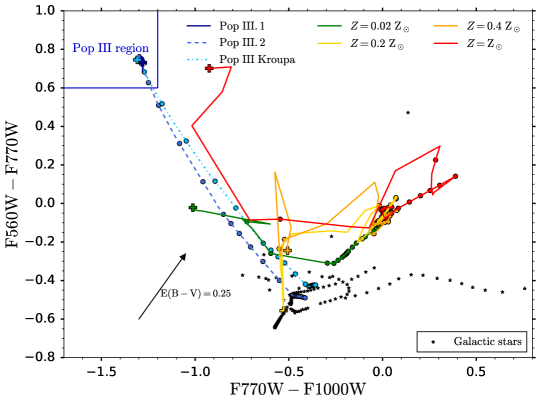
B.2.2 [O iii], [O iii]H colour selection
Given the great challenge in actually detecting Pop III galaxies in the MIRI F1000W filter, we introduce a substitute colour selection in Fig. 16 that is still rather robust, but is much more practical to apply in practice. Here we use the F444WF560W, F560WF770W filter pairs for our colour–colour selection. The basis behind this Pop III colour selection is the same as Fig. 4 but now applied at , namely a lack of [O iii] emission in the F560W filter, together with moderately higher EW H emission in the F770W filter. Thus the F444WF560W colour is relatively flat for Pop III galaxies, and the F560WF770W colour is relatively red. This group of filters leverages on the deep F560W and F770W imaging that will need to be taken to identify Pop III candidates, as well as the much greater NIRCam F444W sensitivity (relative to MIRI F1000W).
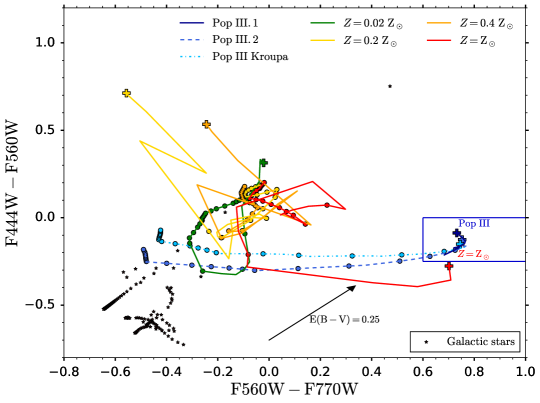
This colour selection can be applied over the redshift interval . Owing to the fact that Pop III galaxies and galaxies have similar F444WF560W and F560WF770W colours, contamination may be a concern over this entire redshift range. The boundaries of the Pop III, region in the F444WF560W, F560WF770W colour–colour plane are given by:
| (9) | |||
B.2.3 [O iii], Ly colour selection
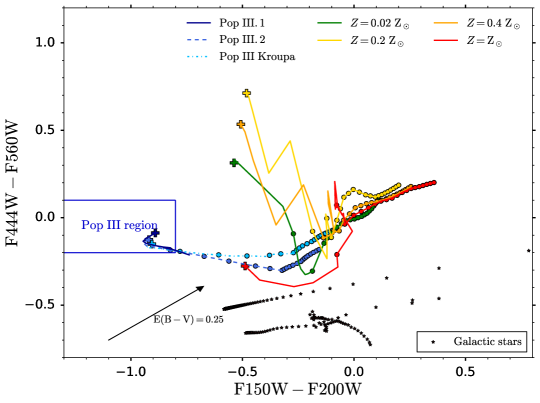
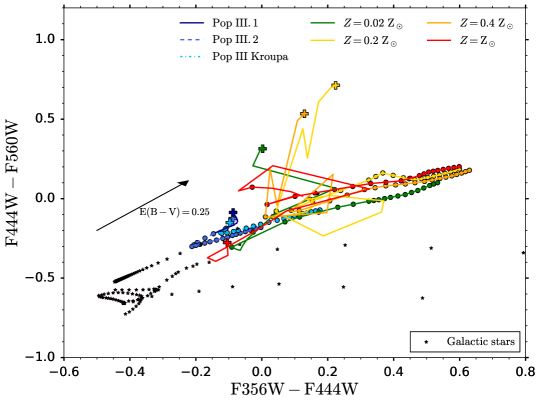
We show the [O iii], Ly colour selection in Fig. 17, which uses the F444WF560W, F150WF200W filter pairs. This colour selection can be applied over the redshift range . Starburst galaxies at with bright H emission in the F150W filter can mimic the colours of Pop III galaxies and hence are potential contaminants. However, continuum detections in F090W and F115W, as well as bluer, non-JWST filters should enable one to distinguish between galaxies and these low-redshift interlopers.
The boundaries of the Pop III region in the F444WF560W, F150WF2000W colour–colour plane are given by:
| (10) | |||
B.2.4 [O iii], [O ii] colour selection
We show the [O iii], [O ii] colour selection in Fig. 18, which uses the F444WF560W, F356W444W filter pairs. This colour selection can only be applied over the narrow redshift range . If contamination from galaxies is not a concern, the colour selection can be applied over the wider redshift range . Owing to the limitations with this colour selection, we do not define a Pop III region to identify potential Pop III candidates in this colour–colour plane.