RegCLR: A Self-Supervised Framework for
Tabular Representation Learning in the Wild
Abstract
Recent advances in self-supervised learning (SSL) using large models to learn visual representations from natural images are rapidly closing the gap between the results produced by fully supervised learning and those produced by SSL on downstream vision tasks. Inspired by this advancement and primarily motivated by the emergence of tabular and structured document image applications, we investigate which self-supervised pretraining objectives, architectures, and fine-tuning strategies are most effective. To address these questions, we introduce RegCLR, a new self-supervised framework that combines contrastive and regularized methods and is compatible with the standard Vision Transformer [7] architecture. Then, RegCLR is instantiated by integrating masked autoencoders [12] as a representative example of a contrastive method and enhanced Barlow Twins as a representative example of a regularized method with configurable input image augmentations in both branches. Several real-world table recognition scenarios (e.g., extracting tables from document images), ranging from standard Word and Latex documents to even more challenging electronic health records (EHR) computer screen images, have been shown to benefit greatly from the representations learned from this new framework, with detection average-precision (AP) improving relatively by 4.8% for Table, 11.8% for Column, and 11.1% for GUI objects over a previous fully supervised baseline on real-world EHR screen images.
1 Introduction
Many self-supervised learning (SSL) methods for learning visual representation without supervision (or labels) have been proposed in recent years [28, 19, 9, 6, 10, 27, 12]. Indeed, the potentially practical benefits of avoiding the high cost of human annotations and moving away from human-defined and language-dependent label categories strongly motivate this direction. In particular, the most common framework is to use abundant unlabeled images to pretrain rich visual representations and then transfer them to supervised downstream tasks with much fewer annotated ones.
Tables are the most prevalent means of representing and communicating structured data in a wide range of document images, such as financial statements, scientific papers, and electronic medical health documents. Despite the explosive growth of the number of these document images [24], most SSL approaches have so far been proposed in the context of the natural image domain, with little attention paid to tabular and structured document image domains. Even the most advanced systems (e.g., Prasad et al. [22], Agarwal et al. [1]) are largely dependent on object detection models that have been trained on human-labeled natural images.
Table objects are a compact representation that humans can easily understand. However, this is not true for machines since, unlike classic object detection classes, they might have widely disparate sizes, types, styles, and aspect ratios. In other words, table structure varies greatly between document domains (e.g., Word vs GUI screen), and a large variety of table styles are feasible even within the same document format (e.g., borderless vs bordered).
More importantly, object detection models trained for natural images (e.g., Faster R-CNN or YOLO) retrained for table can work well locally while ignoring the overall style of tables that is important to the table [4]. In that regard, very few works have started exploring SSL approaches to the problem of tabular rich document image domains. DiT [16], for example, directly employs BERT-style BEiT [3] to pretrain in a self-supervised manner on IIT-CDIP dataset [15] of 42 million document images and then fine-tune on a couple of classification and detection tasks.
However, to the best of our knowledge, there are several open research problems in developing SSL methods, particularly for tabular and structured document image domains, that require further study. Finding simple but effective self-supervised pretraining objectives, architectures, and fine-tuning strategies are examples of this. Keeping those questions in mind, our paper makes two main contributions:
-
•
First, we introduce RegCLR, a new self-supervised framework that combines contrastive-based masked image modeling (MIM)111We follow Yan LeCun’s broader classification of contrastive methods introduced in [14], which includes recent standard approaches (e.g., SimCLR [6]), MIM family (e.g., MAE [12]), and even Generative Adversarial Networks. and regularized methods and is Vision Transformer (ViT) compatible. It is then instantiated by coupling masked autoencoders (MAE) and enhanced Barlow Twins (eBT) with configurable image augmentations; in principle, the MAE loss is augmented with the eBT loss as a regularization (prior) term. In fact, this simple SSL training loss objective is highly effective in reducing the capacity of learned/trained latent representation, especially in the balanced direction of MAE and eBT loss. MAE loss chooses to ignore irrelevant details, while eBT loss pushes relevant details to latent vectors (i.e., minimizing the ignored details), which is highly important for tabular representation learning.
-
•
Second, we pretrain RegCLR on two distinct domains of document image datasets with rich tabular structures, the publicly accessible TableBank [17] and more challenging internal EHRBank, and then validate the higher sample efficiency of the learned tabular representations in finetuning with TableBank and the superior detection performance with EHRBank in various practical downstream settings. A recent MIMDet [8] framework is used to extract multiscale features from the pretrained ViT encoder and decoder to use as a detection backbone without the need for architecture redesign or changes. By leveraging MIMDet, RegCLR outperforms the latest and purely supervised convolutional neural network (CNN) baseline by large margins.
2 RegCLR Description
2.1 Information Theoretic Formulation
Problem Motivation and Notations In order to build a new unified SSL framework that incorporates the best of both worlds of MIM-based contrastive and regularized self-supervised approaches, we adopt an information-theoretic perspective to pose the problem. The main question is well expressed in the following quote from Yan Lecun’s recent positional paper [14, p. 23].
[[14]] —It is important to note that contrastive and regularized methods are not incompatible with each other, and can be used simultaneously on the same model. How would regularized methods apply to the standard architectures?—
To begin with, let be the input image, be the augmented or varied views of the image, and be the corresponding hidden/latent representation. Our goal is to learn the best representation that retains as much information about the input image as possible given a reasonable representation constraint. The information bottleneck (IB) framework [23] can be a good constraint to use in this case. To use the IB principle, denote be the number of samples, be the feature dimension, and be the projected features.
The role of the IB constraint is to compress into while preserving the information about , and similarly into while keeping the information about . To put it another way, the constraint seeks to compress and as much as possible, while also making and as informative about each other as possible. For simplicity, we assume that and are two jointly multivariate Gaussian variables with zero means and covariance matrices of that are full rank. Note that denotes the determinant of , are the eigenvalues of , is the Frobenius norm, and is the differential entropy.
Training Loss Design From an information theoretic perspective, the problem can be written as an optimization problem in particular as:
| (1) |
Equivalently, if we omit for brevity, the target function to minimize can be expressed as:
| (2) |
this equality follows from the fact that is a constant when the input distribution is fixed and . It has previously been shown [26] that minimizing the expected reconstruction error equates to maximizing a lower bound on the first loss term in (2). This holds true even when is a function of a corrupted input (e.g., masked out image). Therefore, for example, the mean squared error (MSE) between the augmented image and the reconstructed version denoted as can be used as the equivalent loss function of .
We can further express the remaining three loss terms in (2) as222Recall that the entropy of an dimensional Gaussian variable is .
| (3) |
where . Then, can be upper bounded to be computationally convenient to use as follows:
| (4) |
Combining (4) with (3), we obtain the further simplified version of as
| (5) |
Since and are zero means, the cross-covariance matrix becomes the cross-correlation matrix assuming normalization without loss of generality. Similarly, auto-covariance matrices and become the auto-correlation matrices and , respectively. Because there is a trivial solution of zero matrices when minimizing (5), we can circumvent this trivial solution by urging the diagonal terms to be and all the off-diagonal terms to be zero. Hence, the resulting objective denoted as is given by
| (6) |
where , , and are hyper-parameters controlling diagonal and off-diagonal terms of each matrix. We use = 0.5, = 1.0, = 0.00255 and = 0.0051 to balance between auto-correlation and cross-correlation terms during training. After introducing and , the overall training loss is now straightforward to compose as:
| (7) |
| Train | Val | Test | |
| TableBank Word | 73,383 | 2,735 | 2,281 |
| TableBank Latex | 187,199 | 7,265 | 5,719 |
| EHRBank Table | 1,917 | 411 | 209 |
| EHRBank Column | 1,194 | 255 | 208 |
| EHRBank GUI | 157 | 38 | 157 |
| EHRBank Screenshot (unlabeled) | 28,121 |
2.2 RegCLR Framework
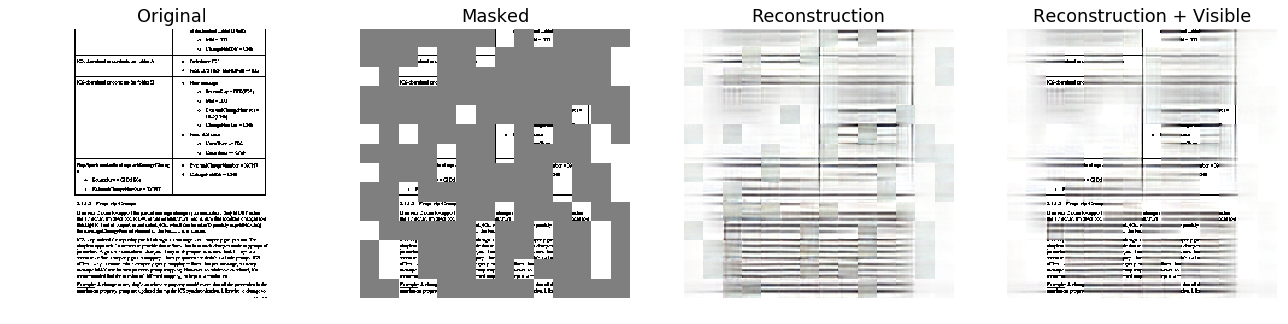
Self-Supervised Pretraining One possible instantiation is to use the new objective, in (7), for self-supervised pretraining, and build the model with two branches, MAE and eBT, as shown in Figure 1. For the MAE branch, we choose to apply weak augmentation to the input image and then randomly mask out the selected patches. Only unmasked patches are fed into the ViT encoder, and subsequently the masked patches are reconstructed by the Vit decoder using the MSE calculated over the masked patches as the loss function per the original MAE design (see Figure 3 for an example of image visualization).
Secondly, the eBT branch operates on the cross embedding of the input image’s two strongly augmented versions and . In contrast to the previous instantiation of the IB principle presented in BT loss Zbontar et al. [27], which computes only the cross-correlation matrix, computes a cross-correlation matrix as well as two auto-correlation matrices bringing these three matrices close to the identity ones. We believe that this is a more natural and fundamental improvement over BT loss because augmented images typically carry a significant amount of input image information, implying that the conditional independence assumption of the BT loss [27, Figure 6] that leads to minimizing while maximizing is suboptimal.
Detection via ViT Backbone For detection, as illustrated in Figure 2, we combine a ViT encoder and decoder pretrained in a self-supervised manner with MIMDet [8] to serve as the detection backbone and leverage Cascade Mask R-CNN [5], which is the common architecture in supervised state-of-the-art systems (e.g., Prasad et al. [22], Agarwal et al. [1]). Compared to previous representative approaches of adapting vanilla ViT for object detection (e.g. Li et al. [18]), MIMDet replaces the pretrained patchify stem (PatchStem) with a compact convolutional stem (ConvStem) without further upsampling or redesigns, resulting in a ConvNet-ViT hybrid multi scale feature extractor that requires far fewer epochs in the fine-tuning procedure.
3 Experiments
3.1 Datasets
TableBank Dataset TableBank is a publicly available image-based table dataset for Word and Latex documents on the Internet. It contains 417K high-quality tables labeled with weak supervision split across Word and Latex sets. Note that the Word document set contains English, Chinese, Japanese, Arabic, and other languages, whereas the Latex document set is primarily in English. Details of the data split can be found in Table 1 and one can refer to the top row of Figure 5 for image samples with annotated bounding boxes.
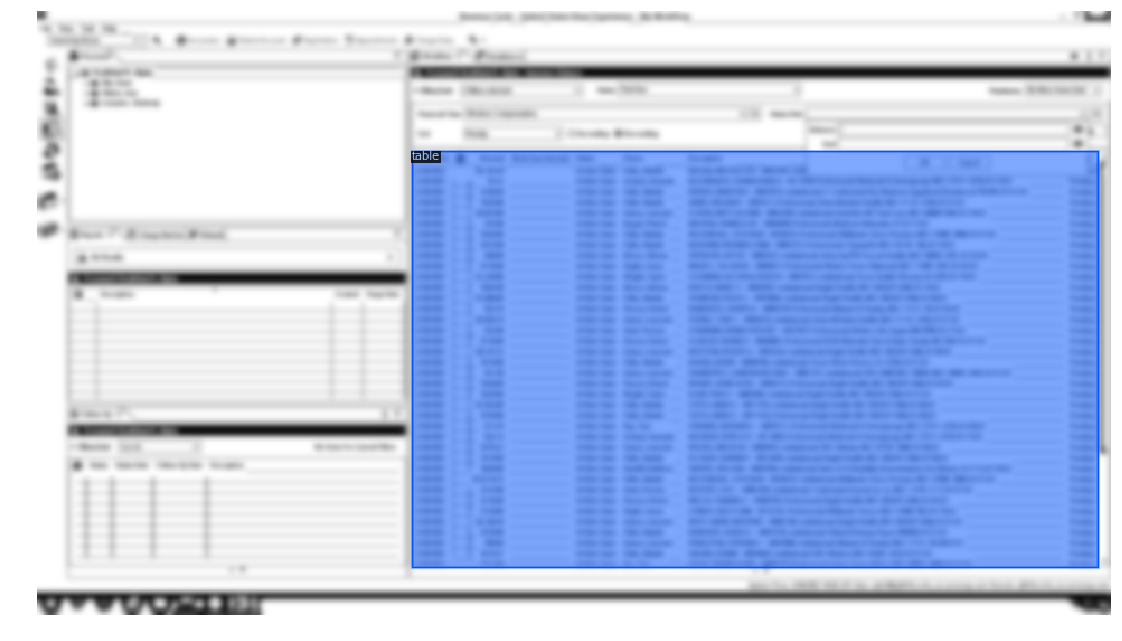
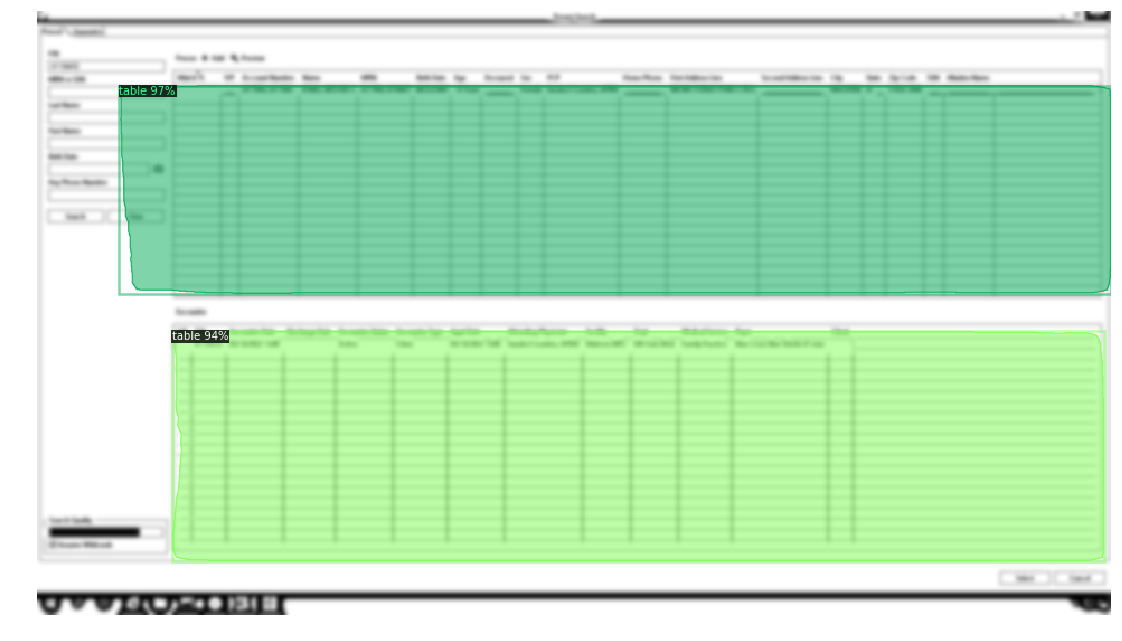
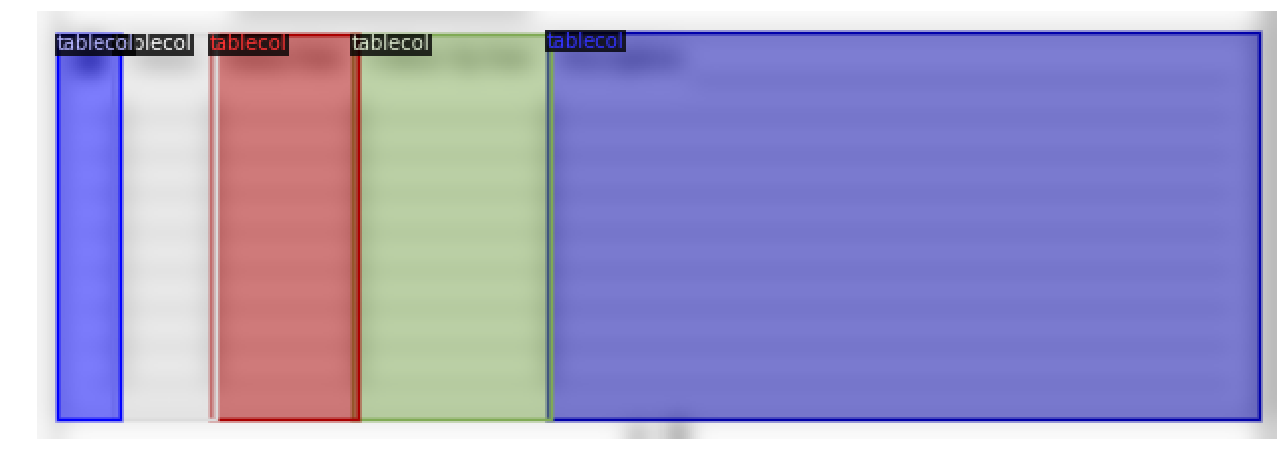
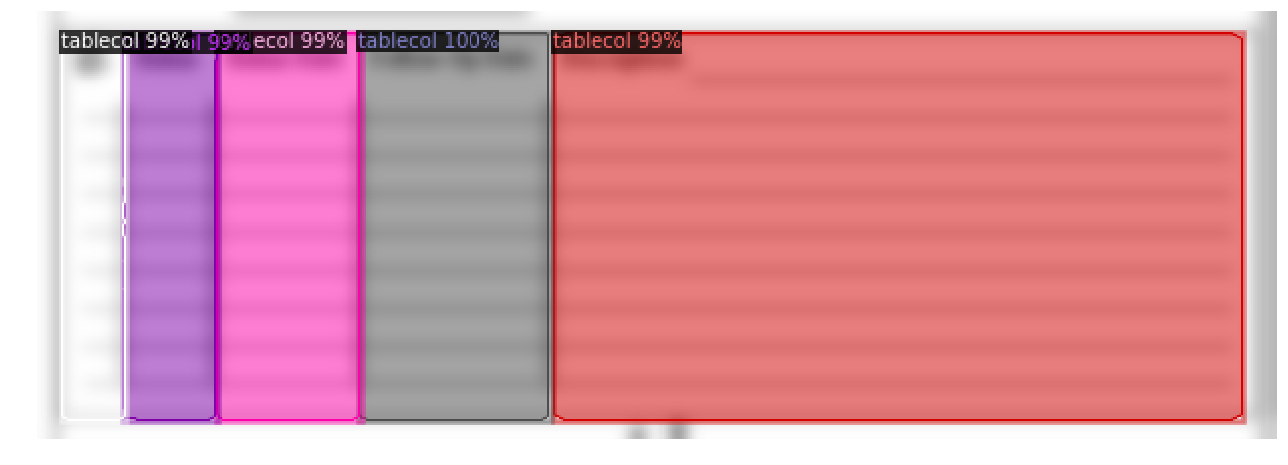
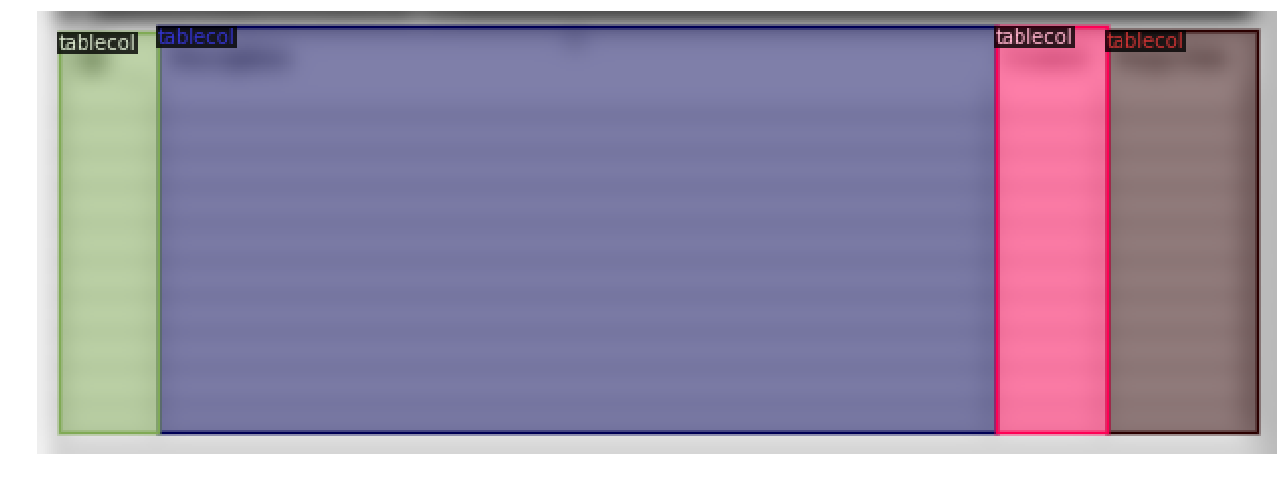
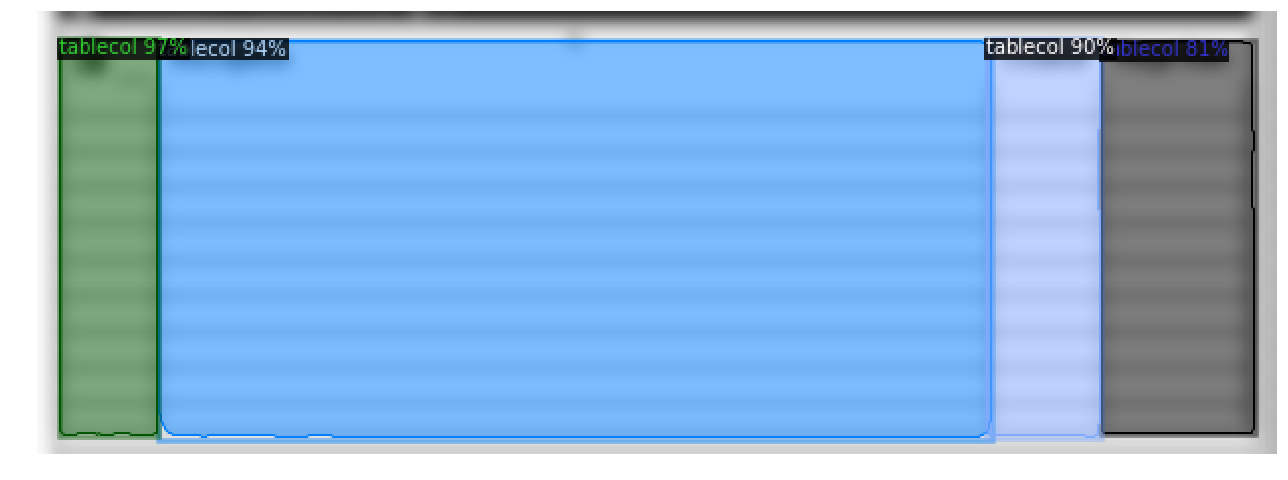
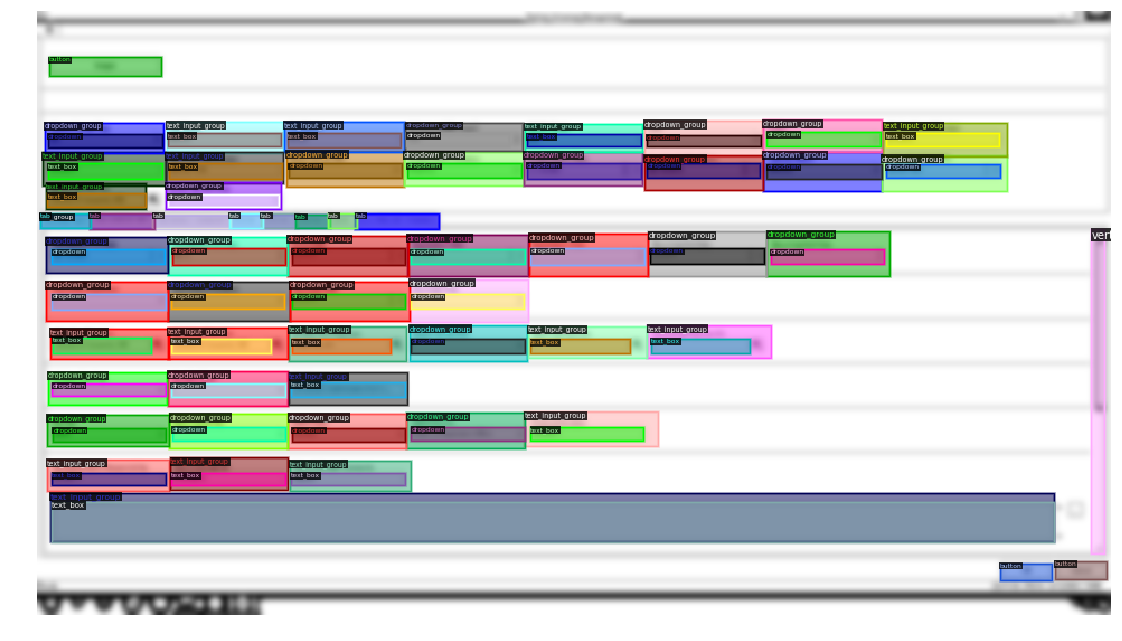
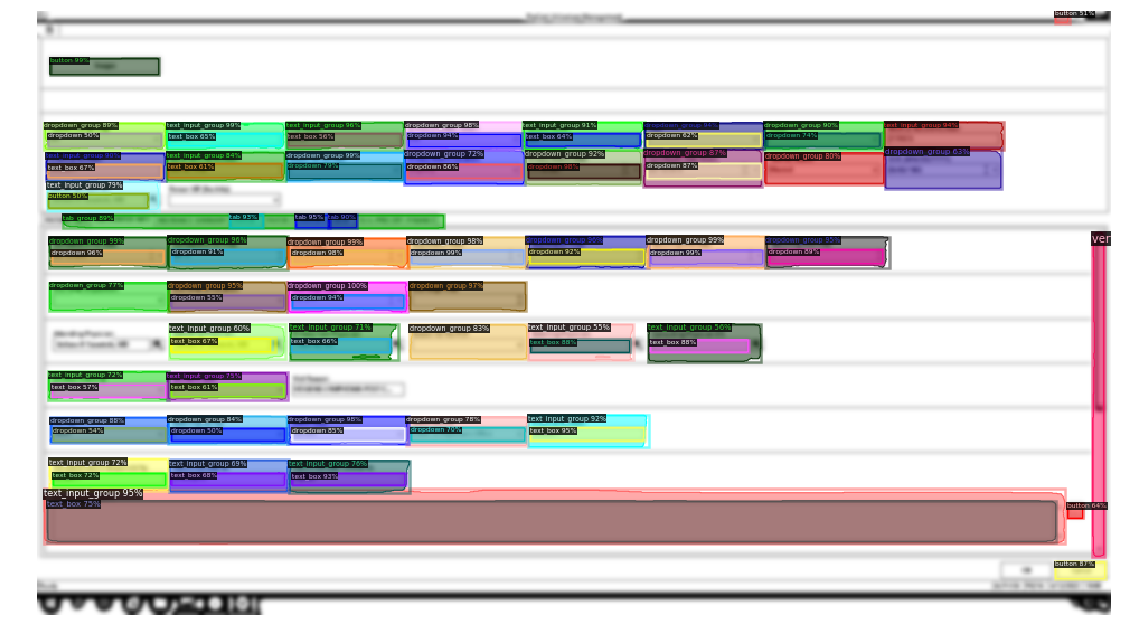
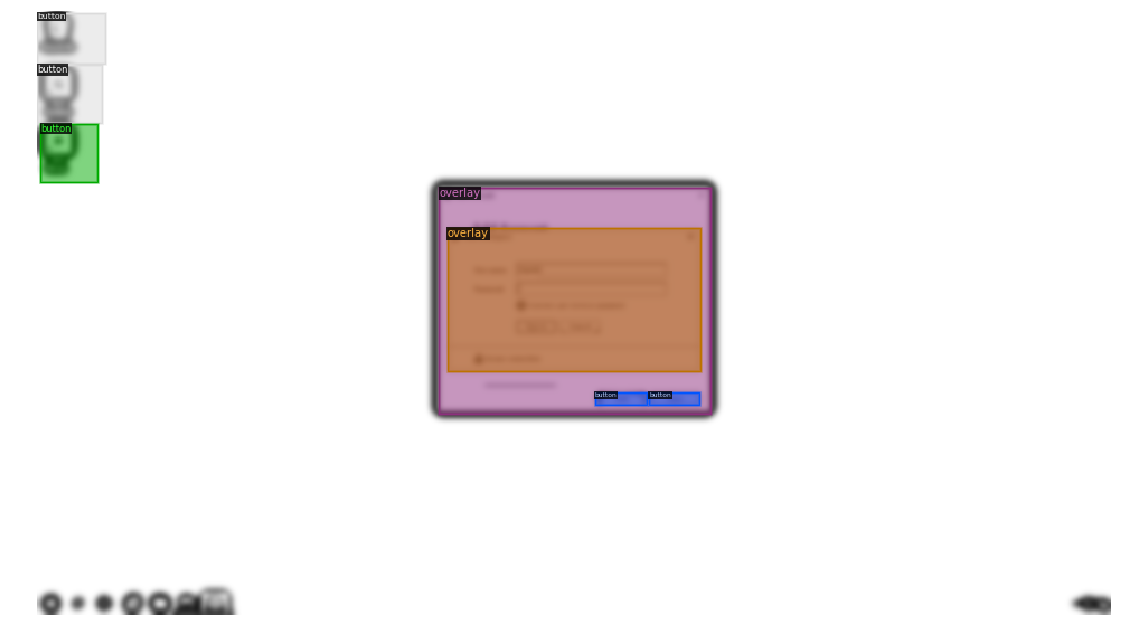
EHRBank Dataset Beyond the TableBank dataset, we systematically curated an internal dataset of screen images from real-world EHR systems, which consists of screenshots collected by bots as they navigate the EHR systems of ten US health systems from various EHR providers.333The collection and use of this EHRBank dataset required HIPPA compliance training. These screens were then carefully selected to include essential template screens and labeled by an internal team of labelers, including tables, table columns, and other GUI elements444Appendix A contains brief descriptions of all twelve classes of GUI elements labeled.. Details of the dataset’s composition can be found in Table 1. For the Column dataset, we further cropped these images to just tables, removing examples that were occluded from overlays. Visual examples of these datasets with human-annotated bounding boxes can be found in the first column of Figure 6.
In addition to the aforementioned supervised dataset with labeled objects, we also collected a unlabeled Screenshot dataset from the worklogger system of a single US health system, which records videos of hospital staff interacting with the EHR system. We randomly sampled screen recordings from the database, then the randomly sampled frames from the randomly sampled videos. The frames were then split into two because most staff members had a dual monitor set up, and these frames were labeled by the same internal team of labelers, and frames without tables or columns or corrupted due to the splitting process were removed. This dataset contains 28,121 PNG images with a resolution of 1920x1080, which represent 10.8% of the volume of the TableBank Train set.
3.2 Settings
Pretraining For TableBank experiments, we pretrain RegCLR on the combined train set of 260,582 document images from the Word and Latex sets. For EHRBank experiments, we have an unsupervised screenshot set of 28,121 images to be used for pretraining. For both experiments, we used adaptive binarization, random resize cropping, and random horizontal flipping as a weak augmentation to train the MAE branch. For a strong augmentation to train the eBT arm, we further add smudge transformation and dilation, which are introduced in [22]. The input images are resized to 224 by 224 in size, and the pretraining phase takes 500 epochs to complete with a batch size of 80.
| Word | Latex | |||
|---|---|---|---|---|
| AP | AP75 | AP | AP75 | |
| ResNet (supervised baseline) | 95.42 | 95.78 | 97.32 | 98.62 |
| MAE (self-supervised baseline) | 95.94 | 96.16 | 97.63 | 98.70 |
| RegCLR (our method) | 96.03 | 96.22 | 97.68 | 98.75 |
Our encoder and decoder model uses the ViT base backbone of a 12-layer Transformer with 12 self-attention heads. Our implementation of pretraining is built on the repo provided in MAE [12], and the projector is implemented as a 2 layer multilayer perceptron with 1024 dimensional output. Overall, pretraining on TableBank uses 4 Nvidia A100 GPUs for 20 hours, and pretraining on EHRBank uses 4 Nvidia V100 GPUs for 40 hours.
Fine-tuning For both experiments, we use MIMDet method to adapt pretrained ViT weights to detection. For all experiments except table detection in EHRBank dataset, the input is resized so that the shortest side is between 480 and 800 pixels and the longest side is no more than 1333 pixels. For the table detection in EHRBank dataset, the input is resized so that it has the shortest side between 307 and 512 pixels and the longest side no more than 853 pixels. We use adaptive binarization as preprocessing for input images, and our implementation for fine-tuning is based on the repo provided in MIMDet [8], with a 50% sampling ratio for both training and inference.
Baselines We carefully chose an MAE as a representative self-supervised pretraining baseline and ResNet with the ResNet-152 backbone as a fully supervised baseline. For a fair comparison, both baselines, like RegCLR, use the Cascade Mask R-CNN architecture. All methods for TableBank datasets are trained for 125,000 iterations with a batch size of 12. All methods for table detection in the EHRBank datasets are trained for 10,000 iterations with a batch size of 16 in the experiments. For other tasks in the EHRBank datasets, we train for 20,000 iterations with a batch size of 4.
| Table | Column | ||||
| Pretrain on | Method | AP | AP75 | AP | AP75 |
| N/A | ResNet | 40.53 | 44.46 | 61.43 | 67.07 |
| EHRBank Screenshot | RegCLR | 42.46 | 45.32 | 68.68 | 75.17 |
| MAE | 36.78 | 39.05 | 64.67 | 71.09 | |
| TableBank (cross-domain) | RegCLR | 40.96 | 43.47 | 67.77 | 75.06 |
| MAE | 43.99 | 48.77 | 69.83 | 77.29 | |
| ResNet | MAE | RegCLR | |
|---|---|---|---|
| AP | 43.37 | 45.69 | 48.17 |
| AP75 | 48.25 | 50.80 | 54.10 |
| ResNet | MAE | RegCLR | |
|---|---|---|---|
| Button | 38.42 | 33.02 | 33.13 |
| Dropdown | 48.02 | 44.33 | 43.14 |
| Dropdown_group | 43.25 | 41.71 | 43.33 |
| Horizontal_scrollbar | 25.12 | 36.88 | 38.78 |
| Overlay | 52.92 | 65.58 | 62.12 |
| Tab | 37.62 | 34.13 | 36.46 |
| Tab_group | 29.94 | 30.35 | 32.77 |
| Table | 62.72 | 66.10 | 72.64 |
| Table_column | 46.31 | 50.44 | 54.74 |
| Text_box | 55.03 | 54.56 | 58.06 |
| Text_input_group | 42.82 | 41.38 | 44.87 |
| Vertical_scrollbar | 37.28 | 47.32 | 52.00 |
3.3 Results
TableBank Dataset The prediction results of the TableBank table detection are shown in Table 2 in AP (mAP @ IOU [0.50:0.95]) and AP75 (mAP @ IOU 0.75) with the results of two baselines. We can see that our method RegCLR outperforms the other self-supervised and fully supervised baselines. The visualization of the table detection predictions by RegCLR can be found in the second row of Figure 5. We conduct further evaluations to better understand our method, RegCLR, especially how it performs when the number of labeled data decreases, particularly in low labeled data regimes.
To do so, we evaluate the test set when fine-tuning on the subsets of 1k, 2k, 5k, 10k, and 20k. Note that all methods are trained for 10,000 iterations with a batch size of 12 for this experiment. As shown in Figure 4, RegCLR outperforms the baselines soon after fine-tuning on a subset of 2-3% labeled train set, AP scores improve quickly even with considerably fewer labeled images (i.e., less than 10%) provided than the unlabeled set, and the gain decreases as more labeled data are added.
EHRBank Dataset We then evaluate RegCLR on internal EHRBank dataset which has higher values in our production scenario. As shown in Table 3, when pretrained on unlabeled EHRBank, our method outperforms the baselines in both Table and Column detection, increasing relative AP scores by 4.8% and 11.8% respectively over the supervised baseline, as seen by comparing the first and second rows. Furthermore, even though pretrained with only around 10% of the TableBbank volume, RegCLR quickly approaches the best cross-domain transfer performance from TableBank to EHRBank, as shown in the last row.
Additionally, it is worth noting that MAE performs worse than even ResNet on Table when pretrained on EHRBank (by comparing the first and third rows). It does, however, transfer better than RegCLR in scenarios involving cross-domain transfer from public TableBank to private EHRBank (by comparing the last two rows). In the future, we intend to investigate how quickly detection performance improves as the unlabeled data volume scales, as well as how effectively pretrained weights transfer across domains in the context of tabular rich images, so that they can be applicable to other document format datasets (e.g., Word to GUI and vice versa).
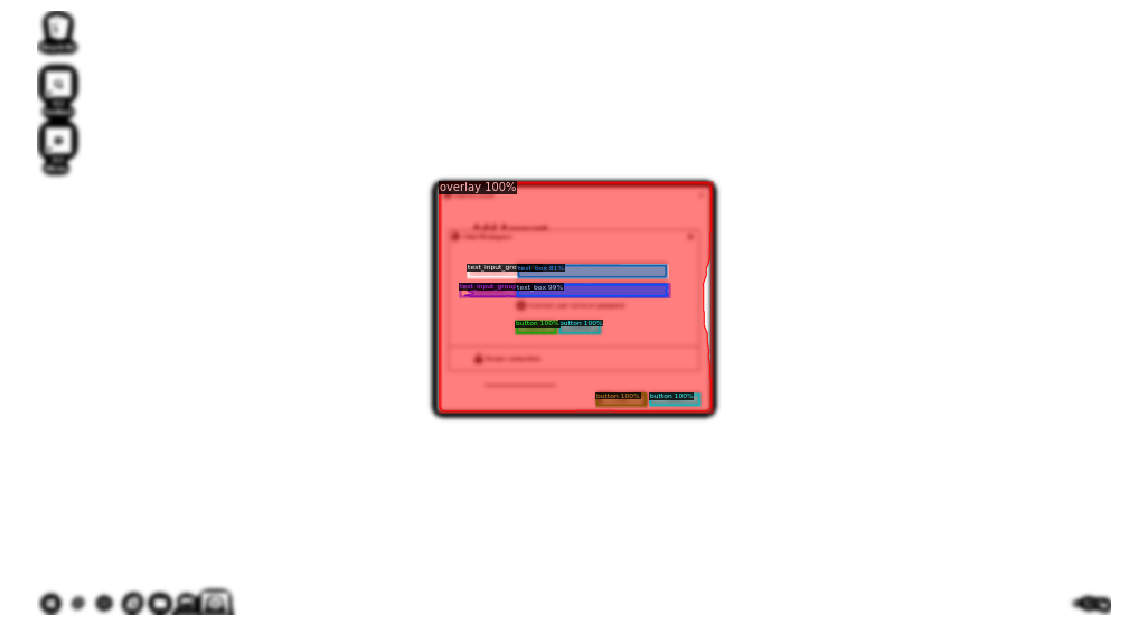
Table 4 presents the results in GUI elements detection, in which our method pretrained on EHRBank Screenshot again produces the highest overall detection scores compared to the baselines. This demonstrates that RegCLR can provide performance improvement even in more complicated scenarios with a larger number of classes and possible occlusions between different GUI elements. The performance variation across different GUI categories is also presented in the right table of Table 4. Visualization of the predictions in the EHRBank can be found in Figure 6.
4 Related Work
SSL Methods for Natural Images Learning good visual representation in a self-supervised manner has been a rising paradigm in computer vision over the past few years. More recently, a few families of approaches have emerged. i) Contrastive learning is trained to extract meaningful features by mapping different images to distant points and the same image under various image augmentations to close points in the feature space. As an example, SimCLR [6] defines the feature distance by cosine similarity and utilizes InfoNCE proposed by [20] as a loss function. ii) Self-distillation serves as another powerful approach that achieves effective representation learning while alleviating the need for large contrastive batch sizes that are often required for contrastive methods. BYOL [10] simply minimizes the similarity loss between the encoder and its momentum target version to achieve this. iii) Feature regularization methods, alternatively, optimize over the auxiliary regularizing loss to directly learn features with desired properties. In this family, Barlow Twins [27] minimizes off-diagonal terms in the covariance matrix between two augmentations to obtain low redundancy representations.
Transformer Architecture for SSL Methods In addition to the advancement of the SSL algorithm, the Transformer [25] architecture also presents itself as a powerful general architecture in computer vision. It brings advantages over CNN, which has dominated the field as a de facto network structure since the emergence of deep learning. Using the ViT architecture, MAE [12], in particular, generalizes masked language modeling (MLM) popular in natural language processing to MIM in computer vision. MAE feeds unmasked patches to the transformer and predicts masked patches as a pretext task. Despite its simplicity, MAE shows strong performance on various computer vision tasks, and specifically, MAE has been found to produce features that better support the downstream object detection task [18] that was the inspiration for our study.
SSL Methods for Document Images Beyond natural images, self-supervised pre-training with transformers is actively used in vision-based document AI tasks. In particular, DiT [16], which uses BEiT [3], demonstrates MIM’s potential to extract high-quality visual representations from document images. LayoutLMv3 [13] further extends pretraining to a multimodal setup with unified text and image masking, including MLM for texts, MIM for images, and a novel word-patch alignment that predicts whether the corresponding image patch for any given word is masked. In the direction of multimodal pretraining for document images, VLCDoC [2] proposes using contrastive loss to align text and vision cues, producing strong performance when both text and image are available. In the context of the images of medical-health documents that we are interested in, DEXTER [21] fine-tunes the TableBank from pretrained MS COCO weights, while no SSL method is employed.
5 Conclusion
In this paper, we present RegCLR, a novel self-supervised framework for learning tabular representation and downstream detections, which had received little attention than natural image domain. Our brand-new framework combines contrastive and regularized self-supervised methods and has been pretrained on both public and private domain tabular rich images. We demonstrate that RegCLR outperforms previous self-supervised pretraining and fully supervised baselines by a large margin in various real-world contexts, with high sample efficiency for fine-tuning. It is left to future study how quickly the quality of the representation learned by our method improves as the volume of unlabeled images scales, which is a common and practical scenario in production. We believe that this study is an important step towards semantic comprehension of real-world document images, and it will be interesting to see how this vision-based framework can be expanded to include textual content without manual data annotation.
Acknowledgments and Disclosure of Funding
The authors express their gratitude to everyone who contributed to the EHRBank dataset, especially Aaron Loh, Fernando Silveira, Samuel Masling, Ihsaan Patel, and the internal labeling teams. Angela Kilby and Jiaming Zeng’s suggestions to improve the manuscripts are also sincerely acknowledged.
References
- Agarwal et al. [2021] M. Agarwal, A. Mondal, and C. V. Jawahar. Cdec-net: Composite deformable cascade network for table detection in document images. In 2020 25th International Conference on Pattern Recognition (ICPR), 2021.
- Bakkali et al. [2022] S. Bakkali, Z. Ming, M. Coustaty, M. Rusiñol, and O. R. Terrades. Vlcdoc: Vision-language contrastive pre-training model for cross-modal document classification. arXiv preprint arXiv:2205.12029, 2022.
- Bao et al. [2021] H. Bao, L. Dong, and F. Wei. Beit: Bert pre-training of image transformers. arXiv preprint arXiv:2106.08254, 2021.
- Burdick et al. [2020] D. Burdick, A. V. Evfimievski, Y. Katsis, M. Danilevsky, and N. Wang. Ibm’s tutorial on table extraction and understanding for scientific and enterprise applications, 2020. URL https://researcher.watson.ibm.com/researcher/view_group.php?id=10211.
- Cai and Vasconcelos [2019] Z. Cai and N. Vasconcelos. Cascade r-cnn: High quality object detection and instance segmentation. IEEE Transactions on Pattern Analysis and Machine Intelligence, page 1–1, 2019. ISSN 1939-3539. doi: 10.1109/tpami.2019.2956516. URL http://dx.doi.org/10.1109/tpami.2019.2956516.
- Chen et al. [2020] T. Chen, S. Kornblith, M. Norouzi, and G. Hinton. A simple framework for contrastive learning of visual representations. In International conference on machine learning, pages 1597–1607. PMLR, 2020.
- Dosovitskiy et al. [2021] A. Dosovitskiy, L. Beyer, A. Kolesnikov, D. Weissenborn, X. Zhai, T. Unterthiner, M. Dehghani, M. Minderer, G. Heigold, S. Gelly, J. Uszkoreit, and N. Houlsby. An image is worth 16x16 words: Transformers for image recognition at scale. In 9th International Conference on Learning Representations (ICLR 2021), 2021.
- Fang et al. [2022] Y. Fang, S. Yang, S. Wang, Y. Ge, Y. Shan, and X. Wang. Unleashing vanilla vision transformer with masked image modeling for object detection. arXiv preprint arXiv:2204.02964, 2022.
- Gidaris et al. [2018] S. Gidaris, P. Singh, and N. Komodakis. Unsupervised representation learning by predicting image rotations. arXiv preprint arXiv:1803.07728, 2018.
- Grill et al. [2020] J.-B. Grill, F. Strub, F. Altché, C. Tallec, P. Richemond, E. Buchatskaya, C. Doersch, B. Avila Pires, Z. Guo, M. Gheshlaghi Azar, et al. Bootstrap your own latent-a new approach to self-supervised learning. Advances in neural information processing systems, 33:21271–21284, 2020.
- He et al. [2016] K. He, X. Zhang, S. Ren, and J. Sun. Deep residual learning for image recognition. In Proceedings of the IEEE conference on computer vision and pattern recognition, pages 770–778, 2016.
- He et al. [2022] K. He, X. Chen, S. Xie, Y. Li, P. Dollár, and R. Girshick. Masked autoencoders are scalable vision learners. In Proceedings of Computer Vision and Pattern Recognition (CVPR 2022). IEEE, 2022.
- Huang et al. [2022] Y. Huang, T. Lv, L. Cui, Y. Lu, and F. Wei. Layoutlmv3: Pre-training for document ai with unified text and image masking. arXiv preprint arXiv:2204.08387, 2022.
- LeCun [2022] Y. LeCun. A path towards autonomous machine intelligence. OpenReview preprint, 2022.
- Lewis et al. [2006] D. Lewis, G. Agam, S. Argamon, O. Frieder, D. Grossman, and J. Heard. Building a test collection for complex document information processing. In Proceedings of the 29th annual international ACM SIGIR conference on Research and development in information retrieval, pages 665–666, 2006.
- Li et al. [2022] J. Li, Y. Xu, T. Lv, L. Cui, C. Zhang, and F. Wei. Dit: Self-supervised pre-training for document image transformer. arXiv preprint arXiv:2203.02378, 2022.
- Li et al. [2019] M. Li, L. Cui, S. Huang, F. Wei, M. Zhou, and Z. Li. Tablebank: A benchmark dataset for table detection and recognition. arXiv preprint arXiv:1903.01949, 2019.
- Li et al. [2021] Y. Li, S. Xie, X. Chen, P. Dollar, K. He, and R. Girshick. Benchmarking detection transfer learning with vision transformers. arXiv preprint arXiv:2111.11429, 2021.
- Noroozi and Favaro [2016] M. Noroozi and P. Favaro. Unsupervised learning of visual representations by solving jigsaw puzzles. In European conference on computer vision, pages 69–84. Springer, 2016.
- Oord et al. [2018] A. v. d. Oord, Y. Li, and O. Vinyals. Representation learning with contrastive predictive coding. arXiv preprint arXiv:1807.03748, 2018.
- PR et al. [2022] N. PR, H. Krishnamoorthy, K. Srivatsan, A. Goyal, and S. Santhiappan. Dexter: An end-to-end system to extract table contents from electronic medical health documents. arXiv preprint arXiv:2207.06823, 2022.
- Prasad et al. [2020] D. Prasad, A. Gadpal, K. Kapadni, M. Visave, and K. Sultanpure. Cascadetabnet: An approach for end to end table detection and structure recognition from image-based documents. In CVPR 2020 Workshop on Text and Documents in the Deep Learning Era, 2020.
- Slonim et al. [2006] N. Slonim, N. Friedman, and N. Tishby. Multivariate Information Bottleneck. Neural Computation, 18(8):1739–1789, 08 2006.
- Vashisth et al. [2022] S. Vashisth, A. Mullen, S. Emmott, and A. Lozada. Gartner market guide for intelligent document processing solutions, 2022.
- Vaswani et al. [2017] A. Vaswani, N. Shazeer, N. Parmar, J. Uszkoreit, L. Jones, A. N. Gomez, Ł. Kaiser, and I. Polosukhin. Attention is all you need. Advances in neural information processing systems, 30, 2017.
- Vincent et al. [2008] P. Vincent, H. Larochelle, Y. Bengio, and P.-A. Manzagol. Extracting and composing robust features with denoising autoencoders. Technical Report, 2008.
- Zbontar et al. [2021] J. Zbontar, L. Jing, I. Misra, Y. LeCun, and S. Deny. Barlow twins: Self-supervised learning via redundancy reduction. In International Conference on Machine Learning, pages 12310–12320. PMLR, 2021.
- Zhang et al. [2016] R. Zhang, P. Isola, and A. A. Efros. Colorful image colorization. In European conference on computer vision, pages 649–666. Springer, 2016.
Appendix A Appendix
EHRBank GUI Dataset: We collect and label GUI screenshots with twelve classes: button, dropdown, drowdown group, overlay, tab, tab group, table, table column, text box, text input group, horizontal scrollbar and vertical scrollbar.
-
•
Button: Small, usually rectangle shape, clickable elements in the screen with or without text.
-
•
Overlay: A separate piece of user interface that appears to be the front layer (e.g., a popup window).
-
•
Dropdown and dropdown group: A clickable rectangle shape UI element or a group of such UI elements that can be clicked to expand to multiple choice selection interface.
-
•
Tab and tab group: A clickable rectangle shape UI element or a group of such UI elements that can switch between different pages.
-
•
Table and table column: Tabular element and column of such tabular element.
-
•
Text box and text input group: Box that can type in text and group of such elements.
-
•
Horizontal scrollbar and vertical: scrollbar: Horizontal and vertical draggable UI element that can move the displaying window accordingly.