What’s Different between Visual Question Answering
for Machine “Understanding” Versus for Accessibility?
Abstract
In visual question answering (VQA), a machine must answer a question given an associated image. Recently, accessibility researchers have explored whether VQA can be deployed in a real-world setting where users with visual impairments learn about their environment by capturing their visual surroundings and asking questions. However, most of the existing benchmarking datasets for VQA focus on machine “understanding” and it remains unclear how progress on those datasets corresponds to improvements in this real-world use case. We aim to answer this question by evaluating discrepancies between machine “understanding” datasets (VQA-v2) and accessibility datasets (VizWiz) by evaluating a variety of VQA models. Based on our findings, we discuss opportunities and challenges in VQA for accessibility and suggest directions for future work.
What’s Different between Visual Question Answering
for Machine “Understanding” Versus for Accessibility?
Yang Trista Cao††thanks: ⋆ Equal contribution University of Maryland ycao95@umd.edu Kyle Seelman11footnotemark: 1 University of Maryland kseelman@umd.edu
Kyungjun Lee11footnotemark: 1 University of Maryland kyungjun@umd.edu Hal Daumé III University of Maryland Microsoft Research me@hal3.name
1 Introduction
Much research has focused on evaluating and pushing the boundary of machine “understanding” – can machines achieve high scores on tasks thought to require human-like comprehension, including image tagging and captioning (e.g., Lin et al., 2014), and various forms of reasoning (e.g., Wang et al., 2018; Sap et al., 2020). In recent years, with the advancement of deep learning, we saw great improvements in machines’ capabilities in accomplishing these tasks, raising the possibility for deployment. However, adapting machine systems in real-life is non-trivial as real-life situations and users can be significantly different from synthetic and crowdsourced dataset examples (Shneiderman, 2020). In this paper we use the visual question answering (VQA) task as an example to call more attention to shifting from development on machine “understanding” to building machines that can make positive impacts to the society and people.
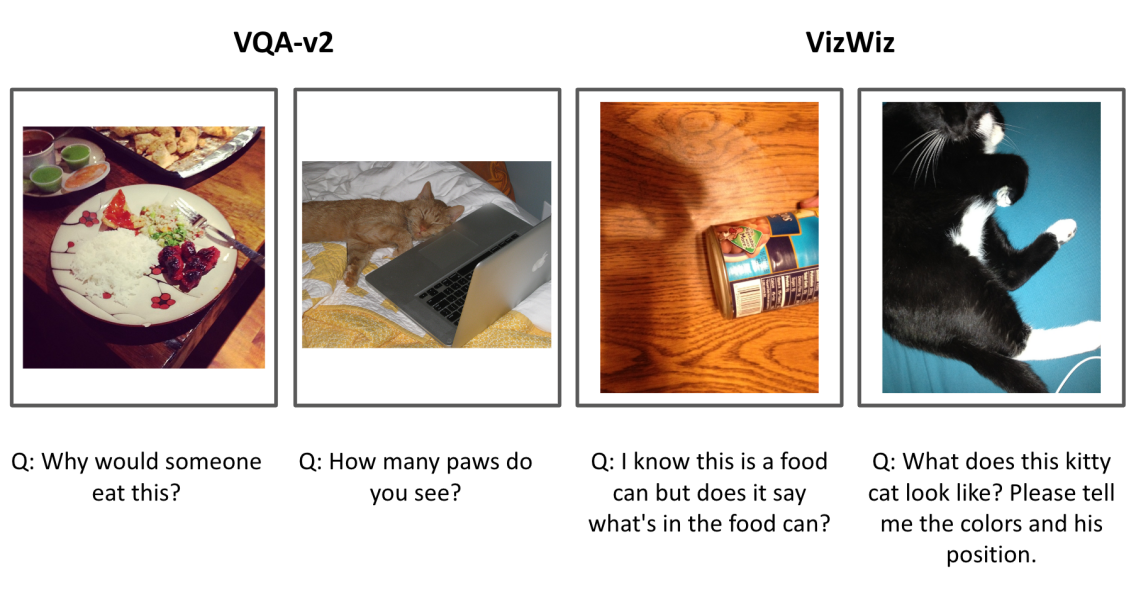
Visual question answering (VQA) is a task that requires a model to answer natural language questions based on images. This idea dates back to at least to the 1960s in the form of answering questions about pictorial inputs (Coles, 1968; Theune et al., 2007, i.a.), and builds on “intelligence” tests like the total Turing test (Harnad, 1990). Over the past few years, the task was re-popularized with new modeling techniques and datasets (e.g. Malinowski and Fritz, 2014; Marino et al., 2019). However, besides the purpose of testing a models’ multi-modal “understanding,” VQA systems could be potentially beneficial for visually impaired people in answering their questions about the visual world in real-time. For simplicity, we call the former view machine understanding VQA (henceforth omitting the scare quotes) and the latter accessibility VQA. The majority of research in VQA (§ 2) focuses on the machine understanding view. As a result, it is not clear whether VQA model architectures developed and evaluated on machine understanding datasets can be easily adapted to the accessibility setting, as the distribution of images, questions, and answers might be—and, as shown in Figure 1, are—quite different.
In this work, we aim to investigate the gap between the machine understanding VQA and the accessibility VQA by uncovering the challenges of adapting machine understanding VQA model architectures on an accessibility VQA dataset. Here, we focus on English VQA systems and datasets; for machine understanding VQA, we use the VQA-v2 dataset Agrawal et al. (2017), while for accessibility VQA, we use the VizWiz dataset Gurari et al. (2018) (§ 3.1). Through performance assessments of seven machine understanding VQA model architectures that span 2017–2021 (§ 3.3), we find that model architecture advancements on machine understanding VQA also improve the performance on the accessibility task, but that the gap of the model performance between the two is still significant and is increasing (§ 4.1). This increasing gap in accuracy indicates that adapting model architectures that were developed for machine understanding to assist visually impaired people is challenging, and that model development in this area may indicate architectural overfitting.
We then further investigate what types of questions in the accessibility dataset remain hard for the state-of-the-art (SOTA) VQA model architecture (§ 4.2). We adopt the data challenge taxonomies from Bhattacharya et al. (2019) and Zeng et al. (2020) to perform both quantitative and qualitative error analysis based on these challenge classes. We find some particularly challenging classes within the accessibility dataset for the VQA models as a direction for future work to improve on. Additionally, we observe that many of the questions on which state-of-the-art models perform poorly are not due to the model not learning, but rather due to a need for higher quality annotations and evaluation metrics.
2 Related Work
To the best of our knowledge, this is the first work that attempts to quantify and understand the gap in performance VQA models have between the VQA-v2 dataset collected by sighted people and the VizWiz dataset that contains images and questions from people with visual impairments and answers from sighted people. Brady et al. (2013) conduct a thorough study on the types of questions people with visual impairments would like answered, and provide a taxonomy for the types of questions asked and the features of such questions. This work was a significant step in understanding the need in people with visual impairments for VQA systems. In combination with our own work, this gives a more complete picture of what kinds of questions not only contribute to better model performance, but actually help individuals with visual impairments. Additionally, Zeng et al. (2020) seek to understand the task of answering questions about images from people with visual impairments (i.e., VizWiz) and those from sighted people (i.e., VQA-v2). The authors identified the common vision skills needed for both scenarios and quantified the difficulty of these skills for both humans and computers on both datasets.
Gurari et al. (2018), who published a very first visual question answering (VQA) dataset, “VizWiz” containing images and questions from people with visual impairments, pointed out the artificial setting of other VQA datasets that include questions that are artificially created by sighted people. The VizWiz challenge is based on real-world data and directs researchers working on VQA problems toward real-world VQA problems. This dataset was built on data collected with a crowdsourcing app, where users with visual impairments share an image and a question with a sighted crowdworker who answers the question for them Bigham et al. (2010). Other existing datasets, such as VQA Antol et al. (2015), DAQUAR Malinowski and Fritz (2014), and OK-VQA Marino et al. (2019), are different in that their questions were not provided by those who took images. Instead, the images were first extracted from web searches, and then questions were later provided by sighted crowdworkers who viewed and imagined questions to ask about those images. Here, we see that people with visual impairments can benefit the most from VQA technology but most of the existing VQA datasets do not involve people with visual impairments.
Some prior work has investigated VQA datasets further, focusing on assessing diversity in answers to visual questions. For instance, Yang et al. (2018) looked at answers to visual questions created by blind people and sighted people and worked on anticipating the distribution of such answers. Predicting the distribution of answers asked, they helped crowdworkers create as many unique answers as possible for answer diversity. Bhattacharya et al. (2019) tackle the same issue by looking at images of VQA. They proposed a taxonomy of nine reasons that cause differences in answers and developed a model predicting potential reasons that can lead to differences in answers. However, little work explores discrepancies between questions from actual users of VQA applications (i.e., users with visual impairments) and contributors who helped develop data for VQA applications.
Our work aims to understand this gap by assessing the discrepancies between the dataset containing artificially created data and the dataset containing real-world application data present across different VQA models. More specifically, we assess the performance of VQA models that were proposed in different times and delve into the old model and the state-of-the-art model with individual datapoints to identify patterns where the models perform poorly for the accessibility dataset.
3 Experiment Setup
To evaluate how existing VQA models’ performance on machine understanding dataset align with performances on the accessibility dataset, we select two VQA datasets and seven VQA models. One of the datasets, VQA-v2, was proposed for machine understanding, whereas the other dataset, VizWiz, was collected to improve accessibility for visually-impaired people. The seven VQA models, selected from the VQA-v2 leaderboard111https://paperswithcode.com/sota/visual-question-answering-on-vqa-v2-test-dev, include MFB Yu et al. (2017), MFH Yu et al. (2018), BAN Kim et al. (2018), BUTD Anderson et al. (2018), MCAN Yu et al. (2019), Pythia Jiang et al. (2018), and ALBEF Li et al. (2021). We assess all seven models on both of the datasets to investigate and understand the model progress across the machine understanding and accessibility datasets222Code is available at https://github.com/kyleseelman/vqa_accessibility.
3.1 Datasets
As a representative of machine understanding VQA, we take the VQA-v2 dataset Agrawal et al. (2017), which includes around 204,000 images from the COCO dataset Lin et al. (2014) with around one million questions. The images are collected through Flickr by amateur photographers. Thus the images are from sighted people rather than visually-impaired people. In addition, questions in VQA-v2 are collected in a post-hoc manner — given a image, sighted crowdworkers are asked to create potential questions that could be asked for the image. Finally, given the image-question pairs, a new set of annotators are asked to answer the questions based on the image information. For each image-question pair, ten annotations are collected as ground-truth.
As a representative of accessibility VQA, we take the VizWiz dataset Gurari et al. (2018), which includes around 32,000 images and question pairs from people with visual impairments. This dataset was built on data collected with a crowdsourcing-based app Bigham et al. (2010) where users with visual impairments ask questions by uploading an image with a recording of the spoken question. The VizWiz dataset uses the image-question pairs from the data collected through the app and asks crowdworkers to annotate answers. Similarly, ten ground-truth answers are provided for each image-question pair. Note that in VizWiz each image-question pair is provided simultaneously by the same person, which is different from how the VQA-v2 dataset was curated.
Our evaluation also uses a smaller subset of VQA-v2’s training set, which we call VQA-v2-sm, limited in size to match that of VizWiz’s training set. This dataset is created to evaluate the effects of dataset size in VQA models’ performance.
3.2 Evaluation Metric
We evaluate the seven models on the VQA-v2 and the VizWiz datasets with the standard “accuracy” evaluation metric for VQA. Since different annotators may provide different but valid answers, the metric does not penalize for the predicted answer not matching all the ground truth answers. For each question, given the ten ground-truth from human annotators, we compute the model answer accuracy as in Eq missing 1. If the model accurately predicts an answer that matches at least three ground-truth answers, it receives a maximal score of . Otherwise, the accuracy score is the number of ground-truth answers matched, divided by three:
| (1) |
3.3 Models
All of the following models approach the problem as a classification task by aggregating possible answers from the training and validation dataset as the answer space.
- MFB & MFH:
-
The multi-modal factorized bilinear & multi-modal factorized high-order pooling models (Yu et al., 2017, 2018) are built upon the multi-modal factorized bilinear pooling that combines image features and text features as well as a co-attention module that jointly learns to generate attention maps from these multi-modal features. The MFB model is a simplified version of the MFH model.
- BUTD:
-
The bottom-up and top-down attention model Anderson et al. (2018) goes beyond top-down attention mechanism and proposes the addition of a bottom-ups attention that finds image regions, each with an associated feature vector, thus, creating a bottom-up and top-down approach that can calculate at the level of objects and other salient image regions.
- BAN:
-
The bilinear attention network model Kim et al. (2018) utilizes bilinear attention distributions to represent given vision-language information seamlessly. BAN considers bilinear interactions among two groups of input channels, while low-rank bilinear pooling extracts the joint representations for each pair of channels.
- Pythia:
-
Pythia is an extension of the BUTD model, utilizing both data augmentation and ensembling to significantly improve VQA performance Jiang et al. (2018).
- MCAN:
-
The modular co-attention network model Yu et al. (2019) follows the co-attention approach of the previously mentioned models, but cascades modular co-attention layers at depth, to create an effective deep co-attention model where each MCA layer models the self-attention of questions and images.
- ALBEF:
-
The align before fusing model Li et al. (2021) builds upon existing methods that employ a transformer-based multimodal encoder to jointly model visual tokens and word tokens, by aligning the image and text representations and fusing them through cross-model attention.
For all the models, the answer space of the VQA-v2 dataset is , while the answer space of the VizWiz dataset is , which is provided by Pythia Jiang et al. (2018).
Implementation details.
We use three different code bases for our evaluation: OpenVQA333https://github.com/MILVLG/openvqa, Pythia444https://github.com/allenai/pythia, and ALBEF555https://github.com/salesforce/ALBEF.. On the OpenVQA platform, four VQA models—MFB, BAN, BUTD, and MCAN—are already implemented. Pythia supports both of the VQA-v2 and Vizwiz datasets, but OpenVQA and ALBEF only support the VQA-v2 dataset. Thus, we implement the support of the VizWiz dataset on OpenVQA (i.e., for MFB, BAN, BUTD, and MCAN) and ALBEF. Their default hyperparameters are used to train models on VQA-v2 and VizWiz, respectively. For OpenVQA and ALBEF on which we implement the VizWiz support, the default hyperparameters for VQA-v2 are used to train models on VizWiz as well. We fix the default accuracy metric implemented in OpenVQA, which is silently incompatible with the VizWiz data format, consistently underscoring predictions.
4 Findings and Discussion
Our objective in this section is to investigate challenges of the VQA task on two different datasets. We assess the performance progress of VQA models and delve into errors. Then, we discuss research directions that future work could take.
4.1 Model Performance Progress
First, we examine whether the progress of VQA model architectures on the machine understanding dataset (VQA-v2) also apply to the accessibility dataset (VizWiz). For VizWiz, we report testing results on both trained from scratch with VizWiz (VizWiz) and trained on VQA-v2 and finetuned with VizWiz (VizWiz-ft). As mentioned in Section 3.1, we randomly sampled the same number of datapoints from the train set of VQA-v2 as that in VizWiz to form VQA-v2-sm to understand the effect of dataset size in the VQA performance.
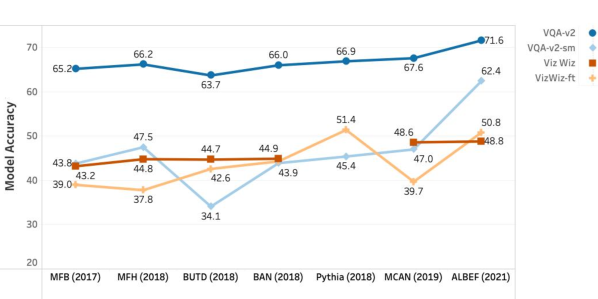
The results are shown in Figure 2.666We do not include results of Pythia trained from scratch on VizWiz because their code expected to train VizWiz from a VQAv2.0 checkpoint, not from scratch. Overall, we observe that along with the advancement of model structures based on the VQA-v2 dataset, the model accuracy also improves on the VizWiz dataset. We observe that, from 2018 through 2021, performance on VQA-v2 improved relatively (from to accuracy), resulting in a similar improvement of ( to ) on VizWiz without fine-tuning and 30% ( to ) on VizWiz with fine-tuning. The models fine-tuned from VQA-2 to VizWiz (i.e., VizWiz-ft) have similar performance with models trained on VizWiz from scratch. Gurari et al. (2018) also reported a similar pattern but pointed out the gap between model performance and human performance. These results show that improvements on VQA-v2 have translated into improvements on VizWiz, whereas the performance gap between the two datasets are still significant.
However, when controlling for dataset size, we see an relative improvement of ( to ) on VQA-v2-sm, where the training data is capped at the size of VizWiz, a substantially larger improvement than the seen on VizWiz (the result on VizWiz with fine-tuning is not comparable here, because it is fine-tuned from the full VQA-v2 dataset). This appears to demonstrate an “overfitting” effect, as both VQA-v2-sm and VizWiz start at almost exactly the same accuracy ( and ) but performance on VQA-v2-sm improves significantly more than on VizWiz.
4.2 Error Analysis
We perform both quantitative and qualitative error analysis to better understand which types of data will be useful to improve accessibility VQA for future dataset collection and model improvement. In this section we discuss the overall patterns found for models evaluated on VizWiz and what type of questions specifically, these model fail on.
4.2.1 VQA Challenge Datasets
In our first set of experiments, we aim to understand more precisely what that models have improved on between 2017 and 2021 that has led to an overall accuracy improvement on VizWiz-ft from (MFB) to (ALBEF). To do this, we make use of two meta-data annotations of a subset of the VizWiz validation dataset ( data examples): one labels each example with the vision skills required to answer that question Zeng et al. (2020), the second labels each with aspects of the image-question combination that are challenging Bhattacharya et al. (2019). Both of these papers investigate the challenges for annotators; here, we use these annotations to evaluate models. Table 1 shows the taxonomies of VizWiz validation examples that are labeled with the challenge class according to majority vote over five annotations.
| Label | Definition | |
| Vision | ObjRec | object recognition |
| TextRec | text recognition | |
| ColRec | color recognition | |
| Count | counting | |
| Image-Question | GranA | answers at different granularities |
| AmbQ | ambiguous qs w/ valid answer | |
| SynonA | different wordings of same answer | |
| MissA | answer not present given image | |
| LoQual | low quality image | |
| InvalQ | invalid question | |
| HardQ | hard question requiring expertise | |
| SubjQ | subjective question | |
| InadA | inadequate answers |
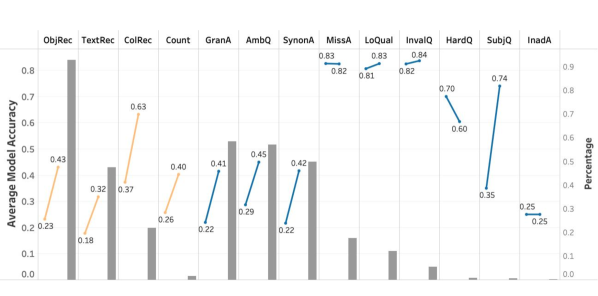
Given this taxonomy, we assess the performance progress between MFB and ALBEF in the VizWiz-ft setting across each VQA challenge class. The results are reported in Figure 3. Compared to MFB, ALBEF improves on every class of challenges except HardQ—hard questions that may require domain expertise, special skills, or too much effort to answer—though HardQ is also one of the rarest categories. (It is somewhat surprising the high performance of the models on these “hard” questions.) We observe that among the vision skill challenge classes, the models struggle the most on recognizing texts. Among the image-question challenges, models have low accuracy on almost all the challenge classes related to the answers — ground-truth answers with different granularities, wordings, and inadequate answers. This indicates a potential problem in evaluating models on the VizWiz dataset, which is further explored in our qualitative analysis in § 4.2.2. For the questions, models struggle the most with handling ambiguous or subjective questions, which we will discuss more in the next section. Overall, the results point out the challenges that models have most difficulty on, which we hope can bring insights for future work to improve accessibility VQA systems.
4.2.2 Where the Models Fail

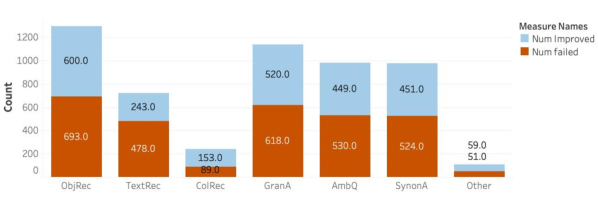
To further understand the data examples that the models fine-tuned on VizWiz perform poorly on, we manually investigate the validation examples on which models achieve accuracy: matching none of the ten human-provided answers. We measure how many data examples that have accuracy on MFB got improved by the ALBEF model for each challenge class, shown in Figure 4.
Model improvement is greatest on color recognition () and least on text recognition (). Meanwhile, object recognition, text recognition, color recognition, and ambiguous questions are the challenge classes which a current state-of-the-art model has the most difficulty. When taking a closer look at the individual examples that ALBEF has accuracy on, it turns out the issue is often with the evaluation measure and not with the ALBEF model itself. The most frequent issues are:
Answerable Questions Marked Unanswerable.
The biggest difference (and what we deem an improvement) between ALBEF and MFB has to do with “unanswerable” questions. of the questions in the validation data are deemed “unanswerable” by at least three annotators—making “unanswerable” a prediction that would achieve perfect accuracy. For 56% of the questions that were not of type “unanswerable”, MFB still answered “unanswerable”, while ALBEF did this only 30% of the time. This skew helps MFB on the evaluation metric, but ALBEF’s answers for many of these questions are at least as good—and therefore useful to a user—as saying “unanswerable.” For example, the number question type, MFB only answered with a number of the time, whereas ALBEF answered with a number of the time and, in those cases, the answers are often very close to the correct answer (see Figure 5).
Overly Generic Ground Truth.
It is often the case that ALBEF provides a correct answer that is simply more specific than that provided by the ground truth annotation. For example, a common question in VizWiz is “What is this?”. When comparing ALBEF and MFB models, by accuracy alone, ALBEF outperforms MFB in of such cases, and MFB outperforms ALBEF in . However, in the majority of these examples, ALBEF gives a correct, but more detailed response than the ground truth, thus earning it accuracy (for example see Figure 5). So while, based on the annotation, ALBEF is wrong, the model is actually correctly answering the question and performs worse than the MFB model only 2.6% of the time. Furthermore, we found that both MFB and ALBEF models are both challenged by yes/no question types, but that these questions were often subjective or ambiguous.
Annotator Disagreement.
Questions such as “Is this cat cute?” or “Are these bad for me?” arguably make for poor questions when evaluating model performance: highly subjective yes/no questions often have annotations where at least three annotators state “yes”, and at least three state “no”. Therefore, per the evaluation metric, either answer achieves an accuracy of . For example, for the question “Do these socks match?” ALBEF had an accuracy score of for an answer of no and MFB had an accuracy score of for an answer of yes, even though either is arguably correct.
5 Limitations
This work aims to understand the degree to which progress on machine “understanding” VQA has, and has the ability to, improve performance on the task of accessibility VQA. Our findings should be interpreted with several limitations in mind. First, while we analyzed many models across several years of VQA research, our analysis is limited to two datasets. Moreover, as discussed in § 4.2.2, the “ground truth” in these datasets, especially when combined with the standard evaluation metric, is not always reliable. Second, our analysis is limited to English, and may not generalize directly to other languages. Finally, blind and low-vision users are not a monolithic group, and the photos taken and questions asked in the VizWiz dataset are representative only of those who used the mobile app, likely a small, unrepresentative subset of the population.
6 Conclusion and Future Directions
In this paper, we have shown that, overall, performance improvements on machine “understanding” VQA have translated into performance improvements on the real-world task of accessibility VQA. However, we have also shown evidence that there may be a significant overfitting effect, where significant model improvements on machine “understanding” VQA translate only into modest improvements in accessibility VQA. This suggests that if the research community continues to only hill-climb on challenge datasets like VQA-v2, we run the risk of ceasing to make any process on a pressing human-centered application of this technology, and, in the worst case, could degrade performance.
We have also shown that along with the overall model improvement, the accessibility VQA system have improved on almost all of the challenge classes though some challenges remain difficult. In general, we observe the models struggle most on questions that require text recognition skill as well as ambiguous questions. Future work thus may wish to pay more attention on these questions in both data collection and model design.
Finally, we have seen that we are likely reaching the limit of the usefulness of the standard VQA accuracy metric, and that more research is needed to develop automated evaluation protocols that are robust and accurately capture performance improvements. On top of this, VQA systems are reaching impressive levels of performance, suggesting that human evaluation of their performance in ecologically valid settings is becoming increasingly possible. As ecological validity would require conducting such an evaluation with blind or low-vision users, research is needed to ensure that such evaluation paradigms are conducted ethically and minimize potential harms to system users.
Acknowledgments
This material is based upon work partially supported by the National Science Foundation under Grant No. 2131508. The authors are also grateful to all the reviewers who have provided helpful suggestions to improve this work, and to Hernisa Kacorri and Jordan Boyd-Graber who have provided pointers and suggestions.
References
- Agrawal et al. (2017) Aishwarya Agrawal, Jiasen Lu, Stanislaw Antol, Margaret Mitchell, C. Lawrence Zitnick, Devi Parikh, and Dhruv Batra. 2017. Vqa: Visual question answering. Int. J. Comput. Vision, 123(1):4–31.
- Anderson et al. (2018) Peter Anderson, Xiaodong He, Chris Buehler, Damien Teney, Mark Johnson, Stephen Gould, and Lei Zhang. 2018. Bottom-up and top-down attention for image captioning and visual question answering. In Proceedings of the IEEE conference on computer vision and pattern recognition, pages 6077–6086.
- Antol et al. (2015) Stanislaw Antol, Aishwarya Agrawal, Jiasen Lu, Margaret Mitchell, Dhruv Batra, C. Lawrence Zitnick, and Devi Parikh. 2015. VQA: visual question answering. CoRR, abs/1505.00468.
- Bhattacharya et al. (2019) Nilavra Bhattacharya, Qing Li, and Danna Gurari. 2019. Why does a visual question have different answers? In Proceedings of the IEEE/CVF International Conference on Computer Vision, pages 4271–4280.
- Bigham et al. (2010) Jeffrey P Bigham, Chandrika Jayant, Hanjie Ji, Greg Little, Andrew Miller, Robert C Miller, Robin Miller, Aubrey Tatarowicz, Brandyn White, Samual White, et al. 2010. Vizwiz: nearly real-time answers to visual questions. In Proceedings of the 23nd annual ACM symposium on User interface software and technology, pages 333–342.
- Brady et al. (2013) Erin Brady, Meredith Ringel Morris, Yu Zhong, Samuel White, and Jeffrey P. Bigham. 2013. Visual challenges in the everyday lives of blind people. In Proceedings of the SIGCHI Conference on Human Factors in Computing Systems, CHI ’13, page 2117–2126, New York, NY, USA. Association for Computing Machinery.
- Coles (1968) L Stephen Coles. 1968. An on-line question-answering systems with natural language and pictorial input. In Proceedings of the 1968 23rd ACM national conference, pages 157–167.
- Gurari et al. (2018) Danna Gurari, Qing Li, Abigale Stangl, Anhong Guo, Chi Lin, Kristen Grauman, Jiebo Luo, and Jeffrey P. Bigham. 2018. Vizwiz grand challenge: Answering visual questions from blind people. 2018 IEEE/CVF Conference on Computer Vision and Pattern Recognition, pages 3608–3617.
- Harnad (1990) Stevan Harnad. 1990. The symbol grounding problem. Physica D: Nonlinear Phenomena, 42(1-3):335–346.
- Jiang et al. (2018) Yu Jiang, Vivek Natarajan, Xinlei Chen, Marcus Rohrbach, Dhruv Batra, and Devi Parikh. 2018. Pythia v0. 1: the winning entry to the vqa challenge 2018. arXiv preprint arXiv:1807.09956.
- Kim et al. (2018) Jin-Hwa Kim, Jaehyun Jun, and Byoung-Tak Zhang. 2018. Bilinear attention networks. Advances in Neural Information Processing Systems, 31.
- Li et al. (2021) Junnan Li, Ramprasaath R. Selvaraju, Akhilesh Deepak Gotmare, Shafiq Joty, Caiming Xiong, and Steven Hoi. 2021. Align before fuse: Vision and language representation learning with momentum distillation. In NeurIPS.
- Lin et al. (2014) Tsung-Yi Lin, Michael Maire, Serge Belongie, James Hays, Pietro Perona, Deva Ramanan, Piotr Dollár, and C Lawrence Zitnick. 2014. Microsoft coco: Common objects in context. In European conference on computer vision, pages 740–755. Springer.
- Malinowski and Fritz (2014) Mateusz Malinowski and Mario Fritz. 2014. A multi-world approach to question answering about real-world scenes based on uncertain input. Advances in neural information processing systems, 27:1682–1690.
- Marino et al. (2019) Kenneth Marino, Mohammad Rastegari, Ali Farhadi, and Roozbeh Mottaghi. 2019. Ok-vqa: A visual question answering benchmark requiring external knowledge. In Conference on Computer Vision and Pattern Recognition (CVPR).
- Sap et al. (2020) Maarten Sap, Vered Shwartz, Antoine Bosselut, Yejin Choi, and Dan Roth. 2020. Commonsense reasoning for natural language processing. In Proceedings of the 58th Annual Meeting of the Association for Computational Linguistics: Tutorial Abstracts, pages 27–33, Online. Association for Computational Linguistics.
- Shneiderman (2020) Ben Shneiderman. 2020. Design lessons from ai’s two grand goals: Human emulation and useful applications. IEEE Transactions on Technology and Society, 1(2):73–82.
- Theune et al. (2007) Mariet Theune, Boris van Schooten, Rieks op den Akker, WAUTER Bosma, DENNIS Hofs, Anton Nijholt, EMIEL Krahmer, Charlotte van Hooijdonk, and Erwin Marsi. 2007. Questions, pictures, answers: Introducing pictures in question-answering systems. ACTAS-1 of X Symposio Internacional de Comunicacion Social, Santiago de Cuba, pages 450–463.
- Wang et al. (2018) Alex Wang, Amanpreet Singh, Julian Michael, Felix Hill, Omer Levy, and Samuel Bowman. 2018. GLUE: A multi-task benchmark and analysis platform for natural language understanding. In Proceedings of the 2018 EMNLP Workshop BlackboxNLP: Analyzing and Interpreting Neural Networks for NLP, pages 353–355, Brussels, Belgium. Association for Computational Linguistics.
- Yang et al. (2018) Chun-Ju Yang, Kristen Grauman, and Danna Gurari. 2018. Visual question answer diversity. In Sixth AAAI Conference on Human Computation and Crowdsourcing.
- Yu et al. (2019) Zhou Yu, Jun Yu, Yuhao Cui, Dacheng Tao, and Qi Tian. 2019. Deep modular co-attention networks for visual question answering. In Proceedings of the IEEE/CVF conference on computer vision and pattern recognition, pages 6281–6290.
- Yu et al. (2017) Zhou Yu, Jun Yu, Jianping Fan, and Dacheng Tao. 2017. Multi-modal factorized bilinear pooling with co-attention learning for visual question answering. In Proceedings of the IEEE international conference on computer vision, pages 1821–1830.
- Yu et al. (2018) Zhou Yu, Jun Yu, Chenchao Xiang, Jianping Fan, and Dacheng Tao. 2018. Beyond bilinear: Generalized multimodal factorized high-order pooling for visual question answering. IEEE transactions on neural networks and learning systems, 29(12):5947–5959.
- Zeng et al. (2020) Xiaoyu Zeng, Yanan Wang, Tai-Yin Chiu, Nilavra Bhattacharya, and Danna Gurari. 2020. Vision skills needed to answer visual questions. Proceedings of the ACM on Human-Computer Interaction, 4(CSCW2):1–31.