A resolution to the mystery of an etalon that is optically expanding and contracting at the same time
††journal: preprint††articletype: Research ArticleA white light illuminated etalon is a valuable resource for spectrograph calibration in radial velocity exoplanet detection, and other astronomical applications. These etalons benefit from low drift (/day) and well-characterized stability of their mode structure. However, measurements of several etalon systems across bandwidths greater than nm indicate that the modes exhibit complex, wavelength-dependent drift. Surprisingly, modes in different regions of the spectrum were found to drift in different directions, implying that the optical length of the etalon is getting both longer and shorter at the same time. In this paper, we provide a solution to this puzzling observation. With Fresnel analysis and the transfer matrix method, we model the reflective phase of the multi-layer dielectric mirrors in the etalon used as a calibrator for the Habitable Zone Planet Finder (HPF). We use this phase to calculate the etalon mode positions and are able to reproduce the observed oscillatory chromatic drift of the etalon’s mode spectrum across 800-1300 nm. Despite the complexity of the mirror structure, our modeling indicates that the gradual relaxation of the outermost layers of the etalon mirrors is the dominant source of the observed behavior. We also model the effect of temperature, incident angle alignment variations, and manufacturing tolerances, and show that they are likely not causes of the chromatic mode frequency shifts. Our work highlights techniques that can be employed in the design of broad bandwidth mirrors for future etalons to make them more useful for the highest precision astronomical spectroscopy.
1 Introduction
The search for exoplanets in habitable zones around nearby stars is driven by profound questions about the uniqueness of Earth and our solar system, and the conditions under which life could exist elsewhere in our Galaxy. Despite its importance, detection of such a terrestrial exoplanet has been hindered by the required degree of measurement precision. One method of detection is the radial velocity (RV) method, which detects exoplanets via the periodic Doppler shift of the stellar spectrum caused by the gravitational pull of the planet on the star. RV detection of an Earth analog requires broadband measurements with a fractional precision approaching (corresponding to a wavelength precision of m or smaller)[1]. This requires incredibly precise spectrograph calibration. Conventional sources for calibration include atomic emission lamps and gas absorption cells, both of which have intrinsic limitations making them incapable of achieving this precision level, especially in the near-infrared[2]. Laser frequency combs (LFCs) are mode-locked lasers with spectral outputs of discrete, absolutely known, evenly spaced emission lines and have recently gained traction as an alternative spectrograph calibration source[3, 4, 5]. In recent years, LFCs have achieved fractional precision at [6], and, as a calibration source in RV systems, they have achieved experimental fractional precision well below the benchmark[7, 8]. However, implementation of this technique is both costly and highly complex, and is therefore currently limited to the best, most precise instruments on large telescopes. This motivates the use of an alternative calibrator.
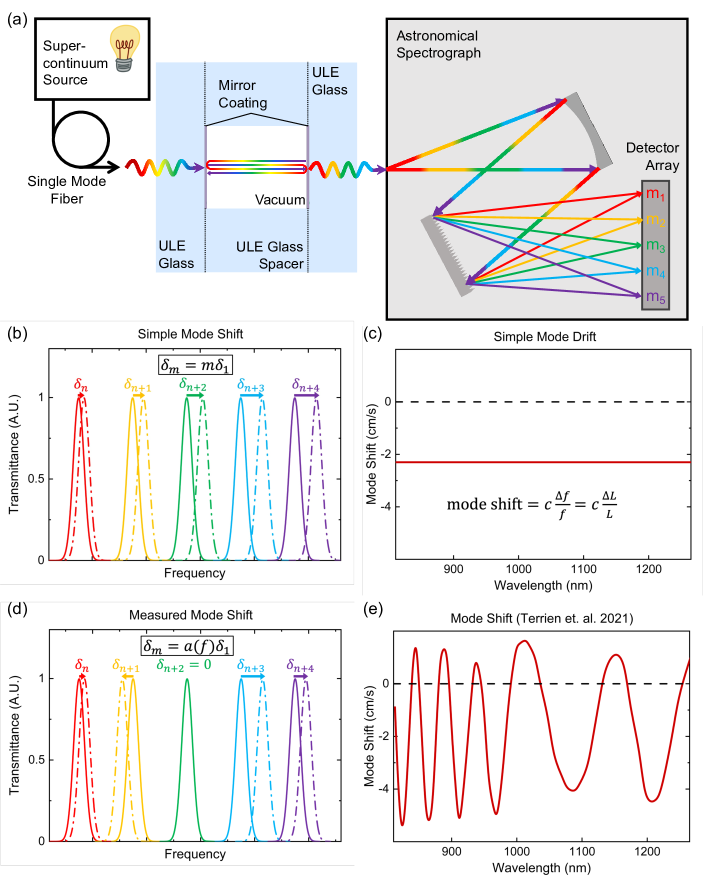
One such alternative is a white light-illuminated Fabry-Perot (FP) etalon, which is an optical cavity formed by two parallel mirrors (sometimes referred to as an astroetalon when optimized for use in an astronomical spectrograph). A basic schematic showing an etalon-astronomical spectrograph system is illustrated in Figure 1a. For the HPF system, laser driven supercontinuum is coupled into and out of the etalon with single-mode fiber optics before entering the multi-mode fiber input of the spectrograph (see references [10, 9] for more details). The interference of light in this cavity means that only discrete resonant wavelength modes whose round trip phase shift is equal to an integer multiple of are transmitted, producing a well-defined, comb-like spectral output like the one shown in Figure 1b and d. When used in precision clock and spectroscopy experiments, FP etalons are capable of achieving stabilities well below . The requirements are different for astronomical spectroscopy, but etalons are particularly attractive due to their relative simplicity and cost-efficiency when compared to LFCs[9]. However, whereas LFCs are self-referenced, meaning that they provide an absolute frequency standard, etalons are not. Their spectra are tied to the mechanical properties of the cavity and will therefore drift over time.
A proposed method of circumventing this limitation is to continuously reference one mode of an etalon to an absolute frequency standard like an atomic transition, and then extrapolate the behavior of that single mode to the behavior of the etalon’s entire spectrum[11]. Such a method relies on the assumption that the behavior of a single etalon mode is predictably connected to the behavior of all others. This assumption is motivated by measurements indicating that an etalon’s modes predominantly shift over time due to the gradual relaxation of the ultra-low expansion glass spacer used to set the cavity length[12]. A cavity length change results in a mode shift like the one shown in Figure 1b, which is easily illustrated via analogy to a stretched rubber band: the spacing between the modes (which can be pictured as marks on a rubber band) change by a constant amount, meaning that each sequential mode experiences an increasingly larger wavelength shift. If we describe this shift in units of Doppler velocity, which is proportional to the fractional frequency change (), each mode shifts by a constant amount (Figure 1c). This simple mode drift would be easy to extract from the behavior of a single mode, and it would therefore be reasonably straightforward to account for this effect in calibration.
However, measurements made at several etalon systems around the world indicate that etalon mode drift is significantly and unexpectedly more complex[10, 9, 13]. One of the most comprehensive measurements of the long-term stability of the modes of an etalon were made against an LFC on the Habitable-zone Planet Finder (HPF) spectrograph installed at the Hobby-Eberly Telescope in Texas. This study measured the average daily drift rate of over 5,000 modes of the broadband etalon spectrum, which spans a 500 nm wavelength range from roughly 800 to 1300 nm[9]. The results of this study are illustrated in a simple way in Figure 1e, and a sketch of this data in units of Doppler velocity is shown in Figure 1e. These results indicate that the HPF etalon modes exhibit an oscillatory wavelength-dependent drift that varies in sign across the wavelength spectrum, implying a cavity that is effectively increasing and decreasing in length at different wavelength regions. Qualitatively similar behavior has also been found for the Espresso[13] and NEID (unpublished) spectrographs’ etalon systems. This poses a clear problem for high-precision RV spectrograph calibration, as such etalon mode drifts are undetectable and thus unaccounted for unless the entire spectrum is continuously compared to an absolute frequency reference.
Previous work has speculated that the wavelength-dependent behavior may stem from the mirror coatings[10, 9], due to the fact that they are a complicated system composed of alternating dielectric layers. In this paper we model possible physical drift mechanisms tied to the mirror coatings in the HPF etalon system, including incident angle change, polarization variation, temperature changes, and manufacturing tolerances. Through this modeling, we ultimately determine that the gradual expansion of the outer layers of the mirror coating cause a mode shift showing good agreement with the measured HPF drift. Such an analysis will be important in understanding etalon drift behavior, improving calibration, and, ultimately, designing more precise etalons in the future.
2 Methods
2.1 Mode shift
The mode spectrum of a Fabry-Pérot etalon is determined by the resonance condition, which maintains that modes occur at wavelengths where the round trip phase shift of the light in the cavity is equal to an integer multiple of , corresponding to completely constructive interference. Mathematically, for an etalon in vacuum, this condition can be written as
| (1) |
where is the cavity length, is the incident wavelength, is the reflective mirror phase shift (assumed the same for both mirrors of the etalon), and is an integer. Rearranging this expression and putting it in terms of the frequency yields
| (2) |
We modeled the mode shift due to various physical perturbations in the cavity by determining their effect on and, subsequently, the mode spectrum (details on the method of calculation of are discussed in Section 2.2). We first used a numerical solver to determine a base mode spectrum from Eq. 1. We then recalculated the mode spectrum using the slightly perturbed in order to determine the difference between the new and original mode locations across the wavelength spectrum of interest in units of Doppler velocity, .
2.2 Transfer matrix method
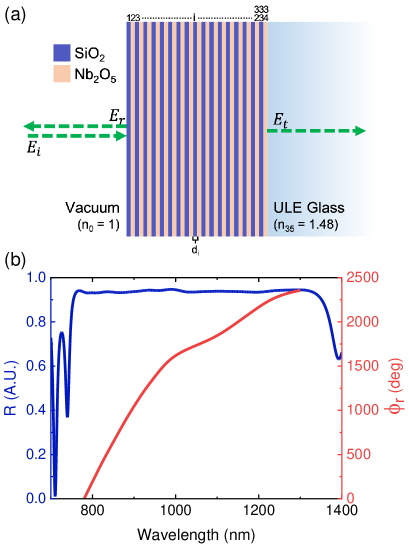
We determined the mirror phase term, , via the optical transfer matrix method (TMM)[14, 15] for the 36-layer mirror system, which comprises a semi-infinite vacuum incident layer, the 34-layer mirror structure, and a semi-infinite ULE glass transmission layer (). This configuration is illustrated in further detail in Figure 2a.
We begin by assuming that the electric fields in the incident and transmitted media can be related by a matrix M, such that
| (3) |
M can be calculated as the net product of a series of boundary () and propagation () matrices for each defined boundary and finite layer of the system, where the boundary matrices are related to the reflection and transmission at that interface and the propagation matrices describe the phase shift picked up by the light as it propagates across the corresponding layer. For an layer system, then, is given by
| (4) |
Mathematically, these matrices can be written as
| (5) |
where and denote the Fresnel reflection and transmission coefficients at the boundary between layer and , respectively, for either or polarized light, and
| (6) |
where is the phase shift in a single layer of refractive index and thickness ,
| (7) |
with representing the incident wavelength and representing the angle at which the light is transmitted into the layer.
From Eq. 3, we can define the complex reflection coefficient for the system, , as
| (8) |
The mirror phase shift can then be extracted from this quantity via the relationship
| (9) |
We then unwrapped the phase calculated from Eq. 9 across the wavelength spectrum and interpolated it so that it is a continuous function of wavelength for use in Eq. 1 to calculate the mode spectrum. We have verified this method of calculation against several commercial software packages, including TFCalc and The Essential Macleod, for both normal and off-normal incidence and for both types of polarization. Figure 2b shows the modeled reflectivity and phase of the mirror structure, and these results are consistent with the reported design values from the manufacturer.
3 Results
3.1 Layer by layer models
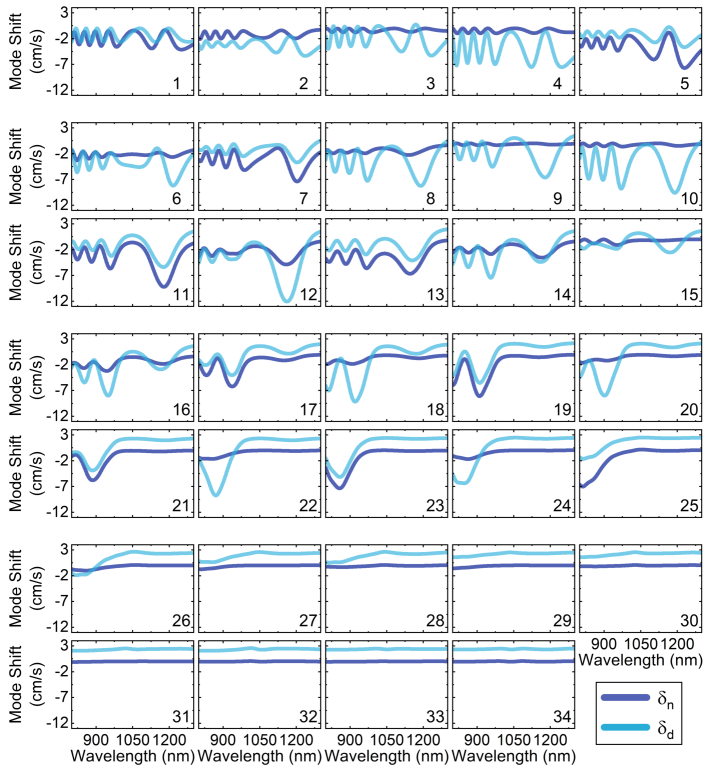
Due to the complexity of the 34 layer mirror structure, we have found it illustrative to look at the contributions of individual layers to the mode shifts of the etalon. This is shown in Figure 3, where the numbering begins with the layer closest to vacuum. These changes scale linearly with both thickness and refractive index changes, so it is useful to study their basic shapes and orders of magnitude to determine their relative effect on the overall mode shift. From this analysis, we can identify four general, qualitative categories of interest: layers 1-5, layers 6-15, layers 16-25, and layers 26-34. Changes to the first five layers of the mirror are similar in their frequency of oscillation and have a relatively consistent amplitude across the wavelength spectrum. These qualitative features exhibit closest agreement with the measured behavior of the HPF etalon. Changes to the next ten layers of the mirror illustrate a gradual decrease in the number of oscillations across the spectrum, as well as the introduction of greater amplitude variation. These two features mark a transition away from the measured mode behavior. Changes made to the following ten layers exhibit little, if any, oscillations over the wavelength range of interest, and therefore show even fewer qualitative similarities to the measured behavior. It is important to note that the magnitude of the effect of these changes, while decreasing, are non-negligible; therefore, because these changes are qualitatively inconsistent with the observed behavior, it is unlikely that they contribute in any significant way. Changes made to the final nine layers of the system similarly exhibit little oscillatory behavior and negligible magnitude of effect relative to the other layers. (The effect of a thickness change does appear to have a non-negligible vertical offset; however, this is misleading, as the offset is caused by the effective decrease of the cavity length due to the total expansion of the mirrors into vacuum.)
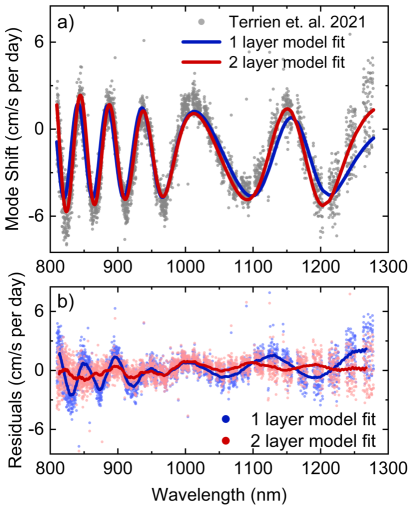
The data of Fig. 3 highlights the qualitative similarities arising from changes to the first five layers of the mirror system. A more rigorous analysis is presented in Figure 4, which shows fits for changes to just the first layer and the first two layers. These results are calculated as a linear combination of the effect of changes to individual layer thicknesses or refractive indices (i.e., the functions shown in Figure3). This means that there are two fit parameters for each layer in a given model: the first for the refractive index and the second for the thickness change of each layer. In addition, we include a fit parameter to account for the bulk offset due to gradual spacer relaxation. In both the first layer and first two layer fits, the magnitude and direction of the bulk shift is consistent with physical expectations [12]. Further, although fit independently, the relative changes to the refractive index and layer thickness are consistent (within a factor of two) with simple models coupling refractive index to changes in density [16]. Fits including more than two layers do not yield reasonable parameters when constrained to physically relevant orders of magnitude and relative sign. For example, a three layer fit models a non-zero refractive index change in the third layer with 0 change to the same layer thickness.
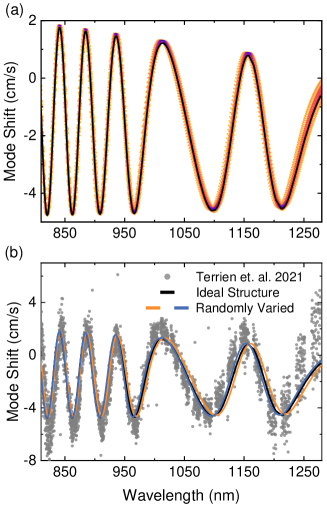
The failure of the multi-layer fits may be due to differences between the layer thicknesses input into the model and those that were actually manufactured. The single layer fit Figure 4, upon inspection, seems to be slightly wavelength shifted from the measured data. Manufacturing tolerances are expected on the deposited layer thickness, and we have found that randomly perturbing the entire structure shifts the relative wavelength position of the single layer models. This effect is illustrated in Figure 5 where fits to the single layer were performed after randomly perturbing each layer with a standard deviation of nm. For this reason, while it is reasonable to conclude that changes in the first few mirror layers are the likely cause of the measured behavior of the HPF etalon, fully determining the exact mechanism and drift rates would require further study of the physical properties of the mirror. Specifically, we anticipate that it will be important to have more accurate information on the refractive index and deposited thickness of the each layer.
3.2 Other tests
3.2.1 Polarization and incident angle
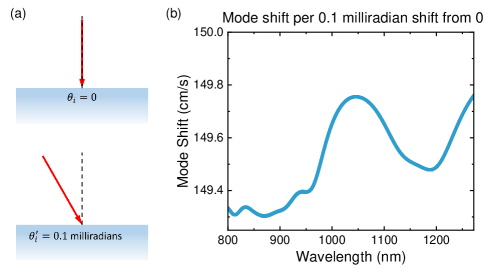
The HPF etalon is aligned so that light in the cavity propagates normal to the mirror surfaces. However, it is not unreasonable to assume that there may be some variation in the alignment over time, particularly were that misalignment in the range of 0.1 milliradians off normal[10]. The effect of such a change in alignment is shown in Figure 6. In this figure, it is clear to see that the dominant effect is a vertical offset in the mode shift due to the effective change in the length of the cavity due to the longer propagation distance ( rather than simply ). Any variation across the wavelength spectrum is several orders of magnitude smaller than this vertical offset, meaning that the observed behavior in the HPF etalon is likely not driven solely by an incident angle drift.
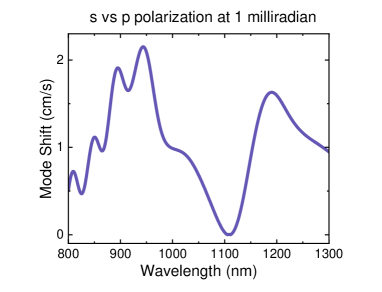
At normal incidence, the Fresnel coefficients for a single boundary converge and there is therefore no difference between the phase shift of s- and p- polarized light. However, even at very small incident angles, the resonant wavelengths for the two polarization components begin to diverge. It may be that the fraction of light in the cavity that breaks down to either polarization varies in time, so we seek to quantify the angle at which such an effect would become significant. Figure 7 illustrates the difference between the mode locations of the two polarization components at 1 milliradian incidence, which is at most cm/s. In order for variations in polarization over time to have effects on the order of magnitude of the measured behavior of the HPF etalon, we would require there to be a misalignment of at least 1 milliradian, but more likely even larger. This degree of angular misalignment is inconsistent with the estimated degree of misalignment in the HPF system, making polarization fluctuation an unlikely factor in the HPF measurements. Aside from the issues raised here, it is also notable that neither an incident angle nor polarization change exhibit close qualitative agreement with the HPF measurements, which further undermines their likelihood as factors leading to the measured mode drift. Additionally, the HPF measurements indicate an average drift per day, and it is unlikely that random fluctuations in polarization or angle misalignment would contribute to the mode shift over time in such a regular, consistent fashion.
3.2.2 Temperature gradients
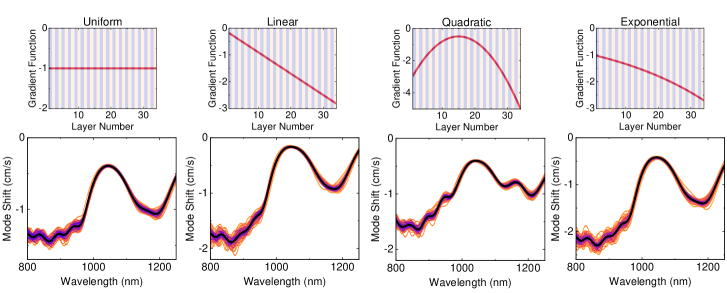
The HPF etalon is held in vacuum at C with a temperature precision approaching mK. SiO2 and Nb2O5 are not particularly temperature sensitive: SiO2 has a CTE of K-1 and thermal refractive index of C-1[17, 18], and Nb2O5 has a CTE of K-1 and thermal refractive index of C-1[19]. The results of a 1 mK temperature change across the entire mirror structure is shown in black in the first plot of Figure 8 and yields a mode shift on the order of magnitude of the measured mode behavior, although the shape does not show many qualitative similarities with the chromatic variation of the measured drift. Applying other simple temperature gradients across the mirrors (Figure 8) yields relatively similar results. The quadratic gradient exhibits the greatest qualitative agreement with measurements, but this is most likely due to the way in which the applied quadratic function heightens the influence of changes to the first few layers, which show most qualitative agreement with the measurements, and the last few layers, which have a relatively negligible order of magnitude, while suppressing the middle layers, which have a significant relative effect on the overall mode behavior but lack many qualitative features of the measured data. The colorful data in Figure 8 illustrate the effect of manufacturing tolerances on the same temperature effect. LightMachinery, Inc. has estimated that each layer has a Gaussian uncertainty in thickness centered on nm with nm. Generating randomly varied structures with this metric yields the results shown in color: overall, these tolerances tend to amplify the oscillations in the lower half of the wavelength region, though not in a significant enough way to explain the measured behavior.
4 Discussion and future work
In summary, we have modeled the effects of a number of feasible mirror-coating related causes of chromatic mode drift in the HPF etalon, including incident angle variation, polarization fluctuation, temperature gradients, and manufacturing tolerances. We are able to exclude the majority of these simple changes as the mechanism responsible for the HPF mode drift. We also have approached the modeling via a layer-by-layer analysis of the effect of perturbations to each of the layers in the mirror coating stack. Via this approach, we find that changes in the first few layers of the mirror system cause mode shifts that demonstrate excellent agreement with the observed HPF etalon behavior. These results indicate that the most likely mechanism responsible for the wavelength-dependent mode shift is a gradual expansion of the first one or two mirror coating layers over time with subsequent refractive index decrease. One reasonable explanation for this behavior comes from the fact that the first mirror coating layer in this design is compressive (more so than the later layers in the system). Over time, this layer can gradually relax, and while the second layer of the coating offers some resistance to this process, the vacuum does not. This relaxation would produce refractive index and thickness changes that are consistent with the relative magnitude and sign of the parameters fit by the models discussed in Section 3.1.
These modeling results are by nature specific to the HPF etalon, and further analysis of other etalon systems will be necessary to determine the dominant effects of the coatings in each. However, they do give clear evidence for etalon mirror coatings as the mechanism behind wavelength-dependent mode drift. As such, our work lays the foundation for additional modeling, mirror design and fabrication with the goal of identifying more stable mirror coatings for future generation etalons. For example, in the design of such etalon mirrors, it is most typical that only the bandwidth and reflectivity are optimized. With the addition of our insights and modeling, it should now be possible to impose additional constraints in the coating design. In this largely unexplored high-dimensional design space, we expect there to emerge opportunities that minimize the impact of coating structure, aging, and manufacturing tolerances to provide more stable and predictable behavior of the etalon modes.
5 Acknowledgements
The authors are grateful for financial support from NIST and from NSF grants AAG 2108512, ATI 2009889, 2009982 and ATI 1310875, 1310885. The Hobby-Eberly Telescope (HET) is a joint project of the University of Texas at Austin, the Pennsylvania State University, Ludwig-Maximilians-Universität München, and Georg-August-Universität Göttingen. The HET is named in honor of its principal benefactors, William P. Hobby and Robert E. Eberly. The Hobby-Eberly Telescope (HET) is a joint project of the University of Texas at Austin, the Pennsylvania State University, Ludwig-Maximilians-Universität München, and Georg-August-Universität Göttingen. The HET is named in honor of its principal benefactors, William P. Hobby and Robert E. Eberly.
References
- [1] D. A. Fischer, G. Anglada-Escude, P. Arriagada, R. V. Baluev, J. L. Bean, F. Bouchy, L. A. Buchhave, T. Carroll, A. Chakraborty, J. R. Crepp, R. I. Dawson, S. A. Diddams, X. Dumusque, J. D. Eastman, M. Endl, P. Figueira, E. B. Ford, D. Foreman-Mackey, P. Fournier, G. Fűrész, B. S. Gaudi, P. C. Gregory, F. Grundahl, A. P. Hatzes, G. Hébrard, E. Herrero, D. W. Hogg, A. W. Howard, J. A. Johnson, P. Jorden, C. A. Jurgenson, D. W. Latham, G. Laughlin, T. J. Loredo, C. Lovis, S. Mahadevan, T. M. McCracken, F. Pepe, M. Perez, D. F. Phillips, P. P. Plavchan, L. Prato, A. Quirrenbach, A. Reiners, P. Robertson, N. C. Santos, D. Sawyer, D. Segransan, A. Sozzetti, T. Steinmetz, A. Szentgyorgyi, S. Udry, J. A. Valenti, S. X. Wang, R. A. Wittenmyer, and J. T. Wright, “State of the field: Extreme precision radial velocities,” \JournalTitlePublications of the Astronomical Society of the Pacific 128, 066001 (2016).
- [2] S. Mahadevan, L. Ramsey, C. Bender, R. Terrien, J. T. Wright, S. Halverson, F. Hearty, M. Nelson, A. Burton, S. Redman, S. Osterman, S. Diddams, J. Kasting, M. Endl, and R. Deshpande, “The Habitable-zone Planet Finder: a stabilized fiber-fed NIR spectrograph for the Hobby-Eberly Telescope,” in Ground-based and Airborne Instrumentation for Astronomy IV, vol. 8446 I. S. McLean, S. K. Ramsay, and H. Takami, eds., International Society for Optics and Photonics (SPIE, 2012), pp. 624 – 637.
- [3] S. A. Diddams, “The evolving optical frequency comb,” \JournalTitleJ. Opt. Soc. Am. B 27, B51–B62 (2010).
- [4] M. T. Murphy, T. Udem, R. Holzwarth, A. Sizmann, L. Pasquini, C. Araujo-Hauck, H. Dekker, S. D’Odorico, M. Fischer, T. W. Hänsch, and A. Manescau, “High-precision wavelength calibration of astronomical spectrographs with laser frequency combs,” \JournalTitleMonthly Notices of the Royal Astronomical Society 380, 839–847 (2007).
- [5] R. A. McCracken, J. M. Charsley, and D. T. Reid, “A decade of astrocombs: recent advances in frequency combs for astronomy [invited],” \JournalTitleOpt. Express 25, 15058–15078 (2017).
- [6] S. A. Diddams, K. Vahala, and T. Udem, “Optical frequency combs: Coherently uniting the electromagnetic spectrum,” \JournalTitleScience 369, eaay3676 (2020).
- [7] A. J. Metcalf, T. Anderson, C. F. Bender, S. Blakeslee, W. Brand, D. R. Carlson, W. D. Cochran, S. A. Diddams, M. Endl, C. Fredrick, S. Halverson, D. D. Hickstein, F. Hearty, J. Jennings, S. Kanodia, K. F. Kaplan, E. Levi, E. Lubar, S. Mahadevan, A. Monson, J. P. Ninan, C. Nitroy, S. Osterman, S. B. Papp, F. Quinlan, L. Ramsey, P. Robertson, A. Roy, C. Schwab, S. Sigurdsson, K. Srinivasan, G. Stefansson, D. A. Sterner, R. Terrien, A. Wolszczan, J. T. Wright, and G. Ycas, “Stellar spectroscopy in the near-infrared with a laser frequency comb,” \JournalTitleOptica 6, 233–239 (2019).
- [8] R. A. Probst, D. Milaković, B. Toledo-Padrón, G. L. Curto, G. Avila, A. Brucalassi, B. L. C. Martins, I. de Castro Leão, M. Esposito, J. I. G. Hernández, F. Grupp, T. W. Hänsch, H. Kellermann, F. Kerber, O. Mandel, A. Manescau, E. Pozna, R. Rebolo, J. R. de Medeiros, T. Steinmetz, A. S. Mascareño, T. Udem, J. Urrutia, Y. Wu, L. Pasquini, and R. Holzwarth, “A crucial test for astronomical spectrograph calibration with frequency combs,” \JournalTitleNature Astronomy 4, 603–608 (2020).
- [9] R. C. Terrien, J. P. Ninan, S. A. Diddams, S. Mahadevan, S. Halverson, C. Bender, C. Fredrick, F. Hearty, J. Jennings, A. J. Metcalf, A. Monson, A. Roy, C. Schwab, and G. Stefánsson, “Broadband stability of the Habitable Zone Planet Finder Fabry-Pérot etalon calibration system: Evidence for chromatic variation,” \JournalTitleThe Astronomical Journal 161, 252 (2021).
- [10] J. Jennings, R. Terrien, C. Fredrick, M. Grisham, M. Notcutt, S. Halverson, S. Mahadevan, and S. A. Diddams, “Frequency stability of the mode spectrum of broad bandwidth Fabry-Pérot interferometers,” \JournalTitleOSA Continuum 3, 1177–1193 (2020).
- [11] C. Schwab, J. Stürmer, Y. V. Gurevich, T. Führer, S. K. Lamoreaux, T. Walther, and A. Quirrenbach, “Stabilizing a Fabry-Pérot etalon peak to 3 cm s for spectrograph calibration,” \JournalTitlePublications of the Astronomical Society of the Pacific 127, 880–889 (2015).
- [12] J. W. Berthold, S. F. Jacobs, and M. A. Norton, “Dimensional stability of fused silica, invar, and several ultra-low thermal expansion materials,” \JournalTitleMetrologia 13, 9–16 (1977).
- [13] T. M. Schmidt, B. Chazelas, C. Lovis, X. Dumusque, F. Bouchy, F. Pepe, P. Figueira, and D. Sosnowska, “Chromatic drift of the Espresso Fabry-Pérot etalon,” (2022).
- [14] J. P. Landry, “Optical oblique-incidence reflectivity difference microscopy: Application to label-free detection of reactions in biomolecular microarrays,” Ph.D. thesis, University of California, Davis (2008).
- [15] M. K. Kreider, A. Q. Rehan, R. M. Kent, A. T. Bezerra, and M. Rebello Sousa Dias, “Al-au thin films for thermally stable and highly sensitive plasmonic sensors,” \JournalTitleThe Journal of Physical Chemistry C 126, 5628–5639 (2022).
- [16] D. Burnett, “The relation between refractive index and density,” \JournalTitleMathematical Proceedings of the Cambridge Philosophical Society 23, 907–911 (1927).
- [17] I. H. Malitson, “Interspecimen comparison of the refractive index of fused silica,” \JournalTitleJ. Opt. Soc. Am. 55, 1205–1209 (1965).
- [18] T. Amotchkina, M. Trubetskov, and V. Pervak, “Experimental and numerical study of the nonlinear response of optical multilayers,” \JournalTitleOpt. Express 25, 12675–12688 (2017).
- [19] T.-C. Chen, C.-J. Chu, C.-H. Ho, C.-C. Wu, and C.-C. Lee, “Determination of stress-optical and thermal-optical coefficients of Nb2O5 thin film material,” \JournalTitleJournal of Applied Physics 101, 043513 (2007).