Broadband X-ray Spectral Analysis of the Dual AGN System Mrk 739
Abstract
We present the result of a broadband (0.5–70 keV) X-ray spectral analysis of the late-merger galaxy Mrk 739, which contains a dual active galactic nucleus (AGN), Mrk 739E and Mrk 739W, with a separation of 3.4 kpc. The spectra obtained with NuSTAR, Chandra, XMM-Newton and Swift/BAT are simultaneously analyzed by separating the contributions from the two AGNs and extended emission with the Chandra data. To evaluate the reflection components from the AGN tori, we consider two models, a phenomenological one (pexrav and zgauss) and a more physically motivated one (XCLUMPY; Tanimoto et al. 2019). On the basis of the results with XCLUMPY, we find that the AGNs in Mrk 739E and Mrk 739W have intrinsic 2–10 keV luminosities of and absorbed by hydrogen column densities of and , respectively. The torus covering fraction of the material with in Mrk 739E, at a 90% confidence limit, is found to be smaller than those found for late-merger ultra/luminous infrared galaxies, (mean and standard deviation; Yamada et al. 2021). Considering the small star formation rate of Mrk 739E, we suggest that the gas-to-mass ratio of the host galaxy is an important parameter to determine the circumnuclear environment of an AGN in late merger.
1 Introduction
Past research since late 1990s has revealed that the masses of supermassive black holes (SMBHs) in galactic centers and those of galactic bulges are tightly correlated (e.g., Magorrian et al. 1998; Ferrarese & Merritt 2000; Kormendy & Ho 2013). These results imply that SMBHs and host galaxies have “coevolved” by regulating their respective growths. Galaxy mergers are thought to be one of the key paths to explain this coevolution, because they can facilitate both intense star formation in the nuclei and efficient mass accretion onto the SMBHs (e.g., Hopkins et al. 2008). Physical processes in the nuclear regions of merging galaxies are however poorly understood. Hence, investigating the circumnuclear environments of active galactic nuclei (AGNs) in galaxy mergers is crucial to elucidate the origin of the SMBH-galaxy coevolution.
Broadband X-ray observations are a powerful tool to study the structure of AGNs because X-rays are tracers of all material including gas and dust with various physical conditions. A key component to understand the AGN feeding mechanism is the so-called “torus” (e.g., Urry & Padovani 1995; Ramos Almeida & Ricci 2017), which is considered as the fuel reservoir of the SMBH. The spectral signatures of the X-ray radiation absorbed and/or reprocessed by the torus can provide constraints on its covering fraction and column density (e.g., Kawamuro et al. 2016; Tanimoto et al. 2020; Toba et al. 2020; Uematsu et al. 2021; Tanimoto et al. 2022).
Recently, Yamada et al. (2021) have conducted a systematic X-ray study of AGNs in 57 local ultra/luminous infrared galaxy (U/LIRG) systems111Those with infrared (8–1000 m) luminosities of and of – are called ULIRGs and LIRGs, respectively (Sanders & Mirabel, 1996)., most of which are identified to be merging galaxies. They find that the AGNs in merging U/LIRG systems become more deeply “buried” (i.e., covered by matter with a large solid angle) with merging stage, confirming the implication by Ricci et al. (2017a, 2021) based on the absorption column-density distribution of local mergers (see also Imanishi et al. 2006, 2008; Yamada et al. 2019). In particular, it is found that AGNs in late-stage mergers with high Eddington ratios () show larger torus covering fractions than those in nonmergers. These results are in line with the theoretical prediction that a galaxy merger triggers rapid mass accretion deeply embedded by gas and dust (e.g., Hopkins et al. 2006; Blecha et al. 2018; Kawaguchi et al. 2020). However, since their sample is limited to U/LIRG populations, which have high star formation rates (SFRs), the relation of the “buried AGN” nature with the host properties (e.g., star-formation rate, gas mass, stellar mass) remains unclear.
To test if galaxy mergers commonly produce AGNs with large covering fractions regardless of their SFRs, here we focus on the AGNs in a late-stage merging galaxy that is less luminous in the infrared band than U/LIRGs. We choose Mrk 739 () as our target. It is a merging system consisting of Mrk 739E and Mrk 739W with a projected separation of 3.4 kpc, the second smallest value among the Swift/BAT dual-AGN sample by Koss et al. (2012). This defines this system as a late-stage (stage C) merger according to the criteria of Stierwalt et al. (2013). However, unlike many other late-stage mergers, Mrk 739 is not infrared luminous (; e.g., Imanishi & Saito 2014) enough to be categorized as a LIRG, and hence is not included in the sample of Yamada et al. (2021). The optical spectrum of Mrk 739E shows broad emission lines, identifying it as a type-1 AGN (Netzer et al. 1987, Koss et al. 2011, Tubín et al. 2021). Koss et al. (2011) suggest that Mrk 739W also contains an AGN on the basis of the hard photon index in the soft X-ray (0.5–10 keV) band. The optical spectra of Mrk 739W show no evidence for broad emission lines, which may be contaminated by strong starburst components (Tubín et al., 2021).
In this work, we aim to answer the question whether or not the AGN tori in the Mrk 739 system have large covering fractions. For this purpose, we conduct a broadband (0.5–70 keV) X-ray spectral analysis of Mrk 739, utilizing the currently best available dataset obtained with NuSTAR, Chandra, XMM-Newton, and Swift/BAT. The NuSTAR data of Mrk 739 are presented here for the first time.
The paper is organized as follows. In Section 2, we describe the observations and reduction of the data obtained with the four satellites. Section 3 describes the X-ray spectral model and give the results of spectral fitting. To constrain the torus structure by assuming realistic geometry, we apply an X-ray clumpy torus model (XCLUMPY; Tanimoto et al. 2019), which was also adopted in Yamada et al. (2021). Finally, we discuss the properties of the AGN of Mrk 739E, which is 15 times brighter than that of Mrk 739W, mainly focusing on its torus structure in Section 4. Section 5 reports the conclusions of this work. In this paper, we assume the solar abundances by Anders & Grevesse (1989). Throughout this paper, we adopt the cosmological parameters of , , and . Errors on spectral parameters correspond to 90% confidence limits for a single parameter of interest.
2 OBSERVATIONS AND DATA REDUCTION
The observation log of the X-ray spectral data used in this paper (NuSTAR, Chandra, XMM-Newton, and Swift/BAT) is summarized in Table 1. We conducted data reduction in accordance with the procedures described below.
2.1 NuSTAR
NuSTAR (Harrison et al., 2013) observed Mrk 739 with the two focal plane modules (FPMs: FPMA and FPMB), which are sensitive to X-ray energies in the 3–79 keV band. The observation was performed on 2017 March 16 for an exposure time of 18.5 ks. The data presented here were reduced by using HEAsoft v6.28 and CALDB v20201217. FPMs’ data were reprocessed by using nupipeline and nuproducts.
We extracted spectral data from a circular region with a radius of 60″, and subtracted the background taken from an annulus with inner and outer radii of 60″ and 120″ surrounding the source concentrically. Considering the limited photon statistics, we coadded the source spectra, background spectra, RMF, and ARF of the two FPMs by using addascaspec. We grouped bins so that each of them included at least 50 photon counts. The angular resolution of NuSTAR is 58″ in full width at half maximum (FWHM), which is not sufficient to separate the AGNs in the two galaxies (Mrk 739E and Mrk 739W) of the system. Hence, our NuSTAR spectrum contains emission from both AGNs and galaxies.
2.2 Chandra
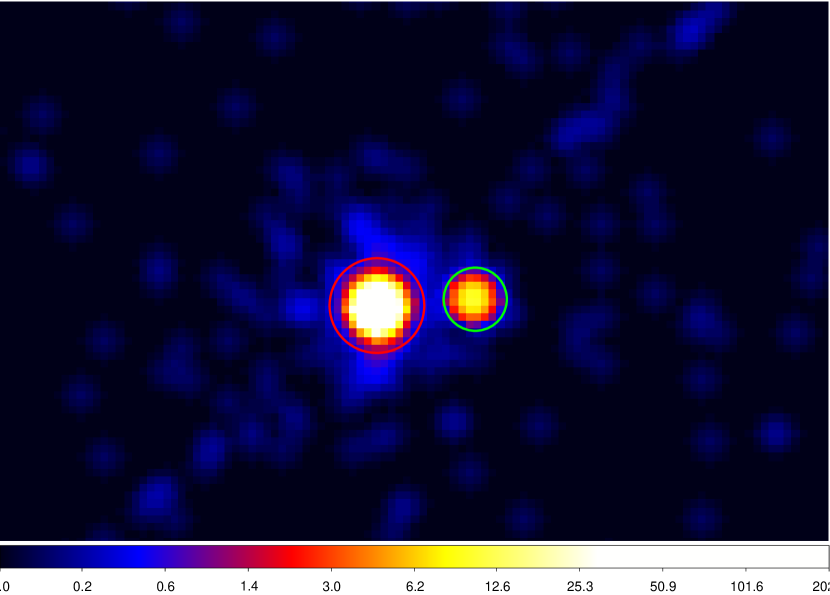
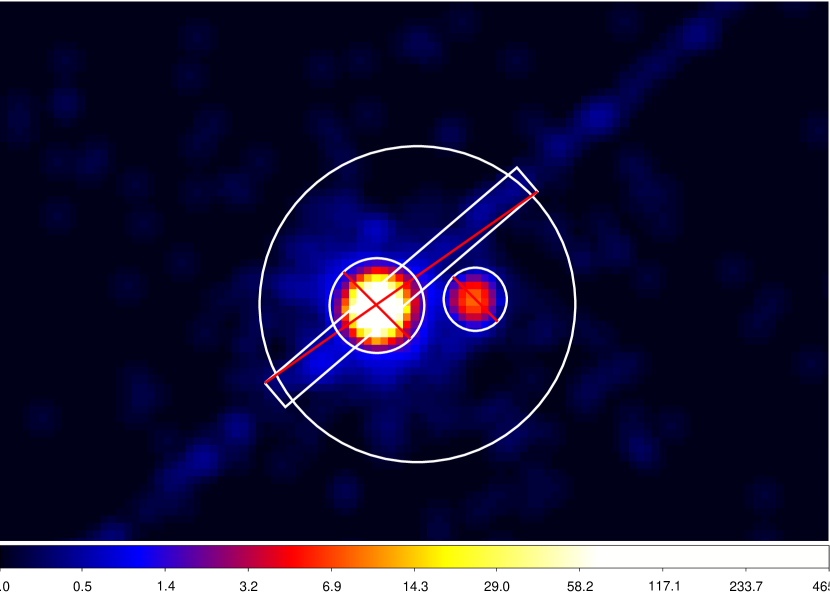
Chandra (Weisskopf et al., 2002) observed Mrk 739 with the Advanced CCD Imaging Spectrometer (ACIS: Garmire et al. 2003). The observation was performed on 2011 April 22 for an exposure time of 13.0 ks. The data were reduced in the standard manner using the Chandra Interactive Analysis of Observations (CIAO v4.12) software and calibration files (CALDB v4.9.2.1). Thanks to its good angular resolution (1″), Chandra was able to spatially resolve the two galaxies and the extended soft X-ray emission surrounding them (Koss et al., 2011).
Thus, we extracted three spectral regions: two circular regions with radii of 3″ and 2″, respectively, centered on the galactic centers of Mrk 739E and Mrk 739W. For the extended emission, we adopt a circular region with a radius of 10″ from which the two circular regions mentioned above were excluded (see Figure 1). Additionally, we excluded a rectangle region (2″10″) where instrumental noises are prominent. We subtracted the background, which was taken from a source-free circular region with a radius of 10″ on the same chip. We grouped bins of the spectra of Mrk 739E, Mrk 739W, and the soft extended emission, respectively, so that each bin included at least 20 photon counts.
2.3 XMM-Newton
XMM-Newton (Jansen et al., 2001) observed Mrk 739 on 2009 June 14 for an exposure time of 11.9 ks with the European Photon Imaging Cameras (EPICs). We reduced the data with the science analysis software (SAS) v18.0.0 and current calibration files (CCF) released on 2020 May 14. In this paper, we only utilized the data of pn (Strüder et al., 2001), which has larger effective area than MOS1 and MOS2.
The angular resolution of XMM-Newton, 15″ (FWHM), is not small enough to separate the two galactic centers of Mrk 739. Thus, we extracted spectral data from a single circular region with a radius of 40″. The background was taken from a circular source-free region with a radius of 40″ on the same chip. We grouped bins of source so that at least 50 photon counts were included per bin.
2.4 Swift/BAT
We also utilized the hard X-ray spectrum of Mrk 739 obtained with Burst Alert Telescope (BAT) on the Neil Gehrels Swift observatory (Gehrels et al., 2004) averaged over 105 months (Oh et al., 2018) from 2004 December to 2013 August.
| Satellite | ObsID | Start Date (UT) | End Date (UT) | Net exposure (ks)aaBased on the good time interval of FPMA for NuSTAR and EPIC-pn for XMM-Newton. |
|---|---|---|---|---|
| NuSTAR | 60260008002 | 2017-03-16 03:56:09 | 2017-03-16 09:05:16 | 18.5 |
| Chandra (ASIS-S) | 12863 | 2011-04-22 02:26:55 | 2011-04-22 06:03:45 | 13.0 |
| XMM-Newton | 0601780401 | 2009-06-14 08:23:45 | 2009-06-14 11:42:21 | 11.9 |
| Swift/BAT | - | 2004 December | 2013 August | - |
3 X-RAY SPECTRAL ANALYSIS
To best constrain the properties of the AGNs, we take the same approach as adopted by Yamada et al. (2018) for the local merging galaxy Mrk 463. We perform simultaneous fit to the six spectra: the individual spectra of Mrk 739E, Mrk 739W, and the extended emission observed with Chandra/ACIS-S (in the 0.5–7.0 keV, 0.8–5.0 keV, 0.5–3.0 keV bands, respectively), and the total spectra from the whole Mrk 739 system observed with NuSTAR/FPMs (3.0–60 keV), XMM-Newton/pn (0.5–10 keV), and Swift/BAT (20–70 keV). Here we adopt the energy intervals where the spectra have sufficiently high signal-to-noise ratios. Spectral fitting is performed on XSPEC (Arnaud, 1996) v12.11.1 based on -statistics. We always consider the Galactic absorption (total of H I and H2), whose hydrogen column density is fixed at (Willingale et al., 2013).
3.1 AGN Spectral Model
In this section, we describe the details of spectral models for the AGNs in Mrk 739E and Mrk 739W. We first begin with a simple phenomenological model (Model I). Then, we apply a more physically motivated one (Model II) to constrain the torus parameters.
3.1.1 Model I
A typical X-ray spectrum of an AGN (e.g., Ogawa et al. 2019) consists of a direct component, which is often subject to absorption by line of sight matter (e.g., warm absorbers, torus), reflected components from the torus and/or the accretion disk accompanied by fluorescence lines, and a Thomson-scattered component (plus emission from a photoionized plasma). In addition to the AGN emission, optically-thin thermal emission from the host galaxy is often present.
Thus, we consider these AGN components for the Mrk 739E and Mrk 739W spectra except for Thomson-scattered ones, which are not significantly required in our data. Firstly, we perform spectral fitting without any reflection components. We find, however, that the model systematically underproduces the hard X-ray flux above 10 keV by a factor of 2, suggesting the presence of a reflection hump by the torus and/or the accretion disk in Mrk 739. We also see a hint of a narrow emission line around 6.4 keV in the XMM-Newton spectrum. Accordingly, we add the pexrav (Magdziarz & Zdziarski, 1995) and zgauss components to represent the reflection continua from cold matter and Fe K fluorescence lines, respectively. The models for Mrk 739E and Mrk 739W are expressed as follows in XSPEC terminology:
| const0*phabs | (1) | ||||
| mtable{xout_mtable.fits} | |||||
| zcutoffpl | |||||
| pexrav + zgauss | |||||
| const0*phabs | (2) | ||||
| zcutoffpl | |||||
-
(1)
The const0 and phabs terms represent the cross calibration factor of among different instruments and the Galactic absorption, respectively. We set const0 of NuSTAR to unity as the reference. We also fix that of Swift/BAT at unity, which would be strongly coupled with const1 otherwise. Those of Chandra and XMM-Newton are set to the values derived by Madsen et al. (2017), 1.09 and 0.89, considering the limited photon statistics.
-
(2)
The const1 factor takes into account time variability of Mrk 739E among different observational epochs. We ignore time variability of Mrk 739W (i.e., const1 is set to unity) because the flux of Mrk 739W is too faint to detect any variability. To confirm the validity of this assumption, we also perform spectral fitting by adopting the const1 values of 0.3 or 3.0 (a typical variability range of nearby AGNs over 10 years; Kawamuro et al. 2016) for Chandra, XMM-Newton, and Swift/BAT data. Except for the two cases where the values are unacceptably increased by 30, we find that the choices of const1 values do not affect our main conclusion. The zphabs and cabs terms represent photoelectric absorption and Compton scattering, respectively. The hydrogen column density along the line of sight is fixed at (the best-fit value obtained with Model II, see Section 3.3.2.), which cannot be well constrained with Model I.
-
(3)
The multiplicative table model
mtable{xout_mtable.fits} represents absorptions by ionized matter, often called “warm absorbers”. To generate the table model, we utilized XSTAR v2.54a (Kallman & Bautista 2001; Bautista & Kallman 2001) assuming the solar abundances. We assume that the ionization parameter () and hydrogen column density () are variable among different epochs. Since NuSTAR does not cover the soft X-ray band, we adopt the same parameters as determined by the Chandra data for the NuSTAR spectrum. -
(4)
The zcutoffpl term is a direct component (a power-law with an exponential high energy cutoff). Here, we assume that the power-law photon index did not vary during the different observational epochs. The cutoff energy is fixed at 160 keV as a typical value of AGNs (Ricci et al., 2018). The pexrav term represents a reflection component from optically-thick cold matter (Magdziarz & Zdziarski, 1995). pexrav has eight parameters, the power law photon index (), the cutoff energy (), the reflection strength (, where is the solid angle of the reflector), the redshift (), the abundance (; elements heavier than He), the iron abundance , the inclination angle (), and the normalization (). We link , , and to those of the direct component. We assume that and (i.e., solar abundances). The inclinations of Mrk 739E and Mrk 739W are fixed at and , respectively (see the description of Model II component (5) in Equation (3)). We set of Mrk 739E to be free within a negative range () to obtain only the reflected component. Due to the limited photon statistics, we fix of Mrk 739W at , the average value for nearby moderately-obscured AGNs (Kawamuro et al., 2016). The zgauss term represents an Fe K fluorescence line, whose center energy and 1 width are fixed at 6.4 keV and of 20 eV, respectively. While we set the normalization of Mrk 739E to be free, we fix that of Mrk 739W so that the Fe K lines of the two AGNs have similar equivalent widths with respect to the pexrav components.
-
(5)
The last term, apec, represents optically-thin thermal plasma due to the star formation activity in the host galaxy. We assume the parameters to be invariable among different epochs.
In the spectral model of Mrk 739W, we do not include the warm-absorber and optically-thin thermal plasma, which are not significantly required from our spectra. The analysis results with Model I are mentioned in Section 3.3.
3.1.2 Model II
As a more physically motivated model, we replace the torus reflection component pexrav and zgauss in Model I with the X-ray clumpy torus model XCLUMPY (Tanimoto et al., 2019). This enables us to constrain the torus structure and to compare our results with those of AGNs in late mergers obtained by Yamada et al. (2021).
We find, however, that a hard X-ray excess around 20 keV remains with this model. This is because XCLUMPY whose parameters are mainly constrained by the line-of-sight absorption and the narrow Fe K equivalent width produces a much weaker hard X-ray reflection hump than the pexrav component in Model I. This suggests the presence of a relativistically blurred reflection component from the accretion disk that produces a strong reflection hump at 20 keV but not a “narrow” Fe K line (see also Section 3.3). Accordingly, we added a relxill component for Mrk 739E. The final spectral models of Mrk 739E and Mrk 739W are expressed as follows in XSPEC terminology:
| const0*phabs | (3) | ||||
| mtable{xout_mtable.fits} | |||||
| (zcutoffpl + relxill) | |||||
| atable{xclumpy_v01_RC.fits} | |||||
| atable{xclumpy_v01_RL.fits} | |||||
| const0*phabs | (4) | ||||
| zcutoffpl | |||||
| atable{xclumpy_v01_RC.fits} | |||||
-
(1)
Same as the component (1) of Equation (1).
- (2)
-
(3)
Same as the component (3) of Equation (1).
-
(4)
Same as the component (4) of Equation (1) in terms of zcutoffpl. The relxill term represents a relativistic reflection component from the accretion disk (Dauser et al., 2013; García et al., 2014). This model (RELXILL) combines the XILLVER code (García et al., 2014), which calculates a reflected spectrum from the accretion disk, and the RELLINE code (Dauser et al., 2010, 2013), which takes into account relativistic smearing effects. RELXILL has 14 parameters: the inner and outer radii of the disk, the boundary radius at which the emissivity index changes, the index which gives emissivity as between and , the index which gives emissivity as between and , the spin parameter of the black hole , the inclination angle between the line of sight and the line perpendicular to the disk, the redshift , the power-law index , the ionization parameter of the disk , the iron abundance , the cutoff energy , the ratio of the solid angle of the reflector to 222When this parameter is set to a negative value, only the reflected component is returned, and the normalization . The photon index () and cutoff energy () are linked between the direct component and RELXILL. The inclination angle () is fixed at the same value as in the pexrav model (see the component (5)). We assume that , ( is the gravitational radius), , which is a mean value for local Seyfert 1 galaxies (Patrick et al., 2012), , , and (i.e., solar abundances), because these parameters cannot be well constrained by our data. We set to obtain only the reflected component. Thus, the free parameter of RELXILL in our fitting is only the normalization . Since both zcutoffpl and relxill components are emitted from a compact region much smaller than light years, we assume that they are subject to the same absorption and time variability factor (const1).
-
(5)
The atable{xclumpy_v01_RC.fits} and atable{xclumpy_v01_RL.fits} term correspond to the reflection continuum and fluorescence lines from the torus, respectively, based on the XCLUMPY model (Tanimoto et al., 2019). The parameters of XCLUMPY are the hydrogen column density along the equatorial plane , the torus angular width , the inclination angle , the power-law photon index , the cutoff energy , the redshift , and the normalization . We link , , and to those of the direct component. The inclination of Mrk 739E is fixed at , a typical value for Seyfert 1 galaxies as constrained by the XCLUMPY model (Ogawa et al., 2021). The inclination of Mrk 739W is fixed at because a lower value makes pegged at its upper boundary (). Thus, the free parameters are and . Because of coupling between the two parameters, however, we find it difficult to determine both values simultaneously. Hence, we conduct three patterns of spectral fitting by fixing of Mrk 739E at , , or 333 We note that corresponds to the lower boundary of the parameter range in XCLUMPY, and adopting makes pegged at its lower boundary ( cm-2). . The torus angular width of Mrk 739W is fixed at , which cannot be well constrained. From and , the hydrogen column density along the line of sight () at the elevation angle () is calculated as follows:
(5) This value of is applied to the absorption terms in (2). Considering that the large size of the torus (pc), we assume that the flux of the torus reflection component is invariable among the different observation epochs, which were separated by 2–8 years.
-
(6)
Same as the component (5) of Equation (1).
The analysis results with Model II are mentioned in Section 3.3.2.
3.2 Extended Emission
Generally, extended emission around an AGN consists of scattered/photoionized component from the AGN and optically-thin thermal emission from the host galaxy. Since we find that thermal emission modelled by apec is not required by our data, we employ only a simple power-law as the scattered AGN component. The final model of the extended emission is expressed as follows in XSPEC terminology:
| const0*phabs | (6) | ||||
| zcutoffpl |
-
(1)
Same as Mrk 739E component (1).
-
(2)
The zcutoffpl term represents scattered components from the AGNs in Mrk 739E and Mrk 739W. This component is assumed to be constant over all the observations. We correct for the effect of excluding the rectangle area in the spectral extraction region of the Chandra spectrum by assuming a constant surface brightness.
3.3 Results
3.3.1 Results-of-Model-I
The phenomenological model, Model I, is able to reproduce the observed spectra of the six instruments simultaneously. Table 2 (Model I) summarizes the best-fit parameters. In Mrk 739E, time-variable warm absorbers with (21.5–22.0) are detected. Line-of-sight absorption by neutral material with is required in Mrk 739W. An -test verifies that the addition of the pexrav and zgauss components significantly improves the fit at a confidence level (/d.o.f = from /d.o.f = ). We obtain a reflection strength of and an equivalent width of a narrow Fe K line of eV for Mrk 739E. We note that this equivalent width is smaller than the theoretical prediction from the observed pexrav component (110 eV) as estimated with the pexmon model (Nandra et al., 2007). This may support the presence of a relativistic reflection component introduced in Model II (Section 3.1.2).
3.3.2 Results-of-Model-II
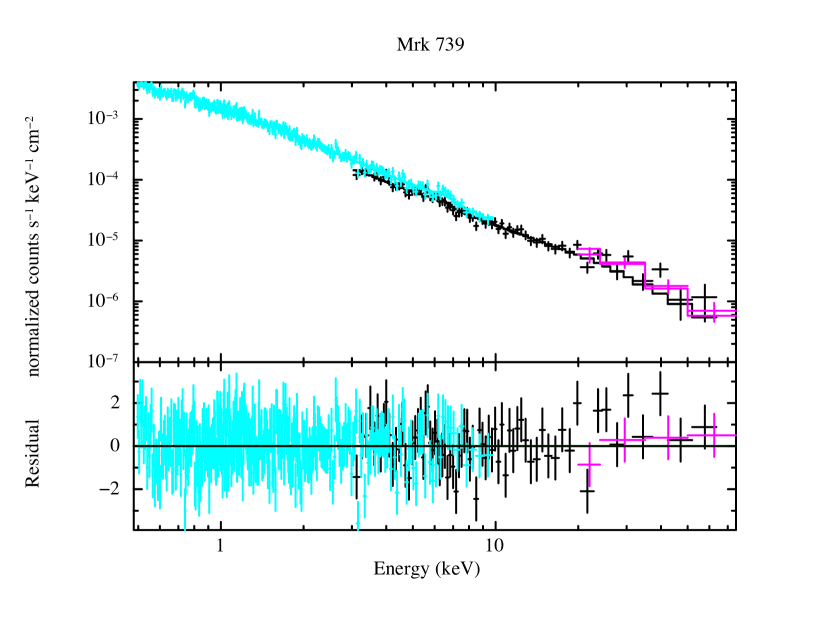
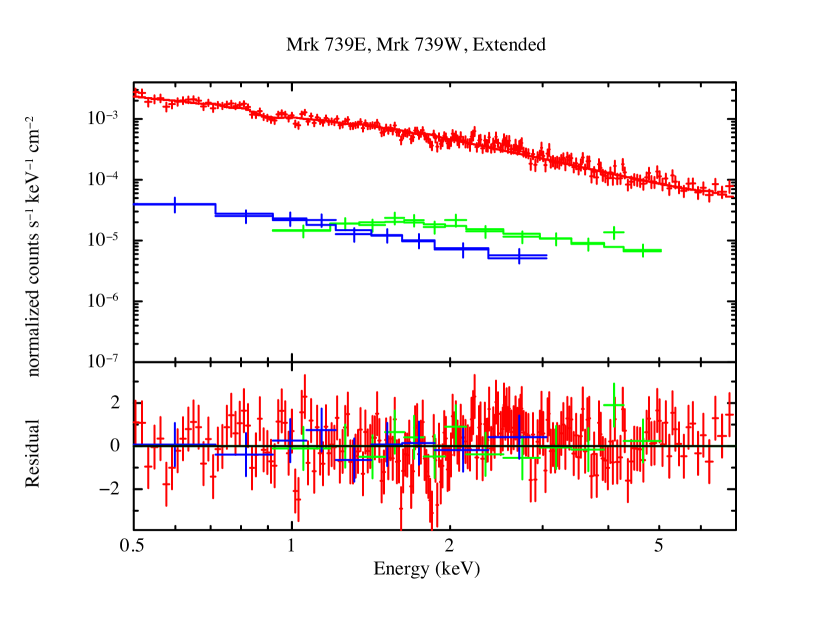
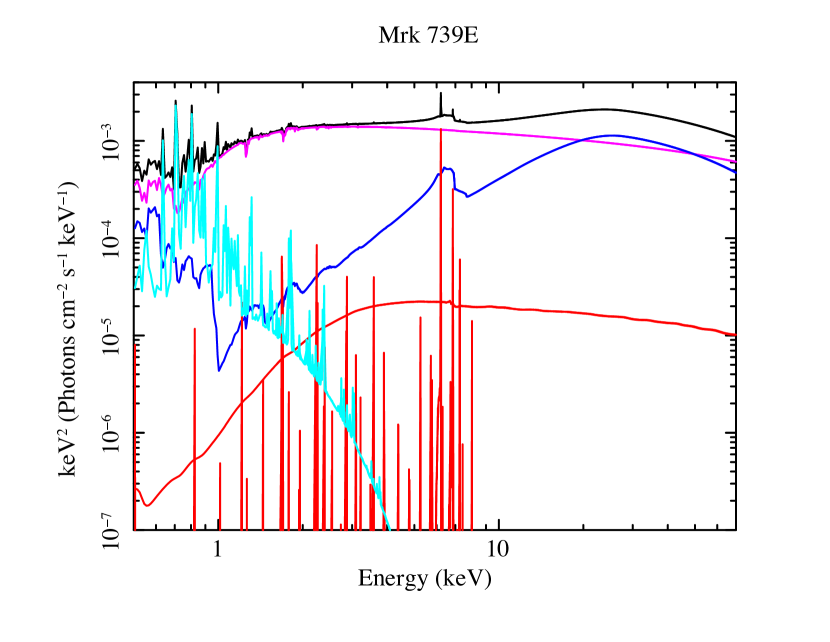
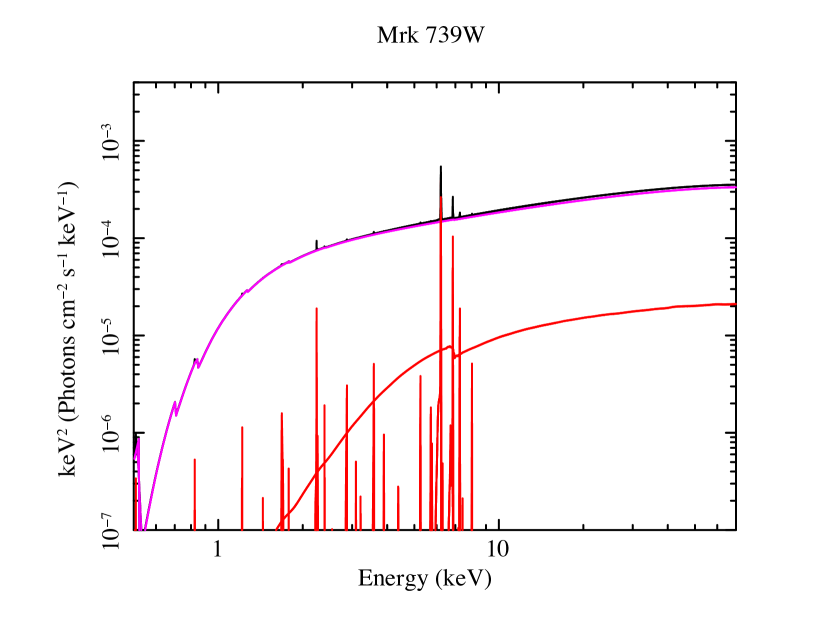
We find that Model II also well reproduces the data. Table 2 (Model II) summarizes the best-fit parameters for the case of . The presence of the variable warm absorbers in Mrk 739E is confirmed. An -test confirms that the addition of the relxill term provides a significantly better fit at a confidence level (/d.o.f = from /d.o.f = ). The observed spectra and the best-fit model are plotted in Figure 2 and Figure 3, respectively. As mentioned above, the main features in the observed spectra that constrain the torus parameters of XCLUMPY are the line of sight column density (or its upper limit) and the equivalent width of the Fe K line. As evident from Equation (5) and Equation (7) of this paper and Figure 3 of Ogawa et al. (2019), respectively, these constraints inevitably cause parameter coupling (anti correlation) between and . To check if our main results would be affected by this, we also perform spectral fitting by fixing at or for Mrk 739E. We confirm that the spectra are also well reproduced. The best-fit values of and reduced values for the three cases () are summarized in the Table 3.
| Region | Component | No. | Parameter | Model I | Model II | Units |
|---|---|---|---|---|---|---|
| Mrk 739E | mtable{xout_mtable.fits} | (1) | cm-2 | |||
| (2) | ||||||
| zcutoffpl | (3) | |||||
| (4) | keV-1 cm-2 s-1 | |||||
| relxill | (5) | keV-1 cm-2 s-1 | ||||
| pexrav | (6) | |||||
| zgauss | (7) | keV-1 cm-2 s-1 | ||||
| atable{xclumpy_v01_RC(L).fits} | (8) | cm-2 | ||||
| (9) | ||||||
| apec | (10) | cm-5 | ||||
| (11) | T | keV | ||||
| const1 | (12) | |||||
| (13) | ||||||
| (14) | ||||||
| - - - | (15) | cm-2 | ||||
| (16) | ||||||
| Mrk 739W | zcutoffpl | (17) | ||||
| (18) | keV-1 cm-2 s-1 | |||||
| pexmon | (19) | |||||
| atable{xclumpy_v01_RC(L).fits} | (20) | cm-2 | ||||
| - - - | (21) | cm-2 | ||||
| (22) | ||||||
| Extended | zcutoffpl | (23) | ||||
| (24) | keV-1 cm-2 s-1 | |||||
| const0 | (25) | |||||
| (26) | ||||||
| (27) | ||||||
| () | () |
Note. — (1) Hydrogen column density of warm absorbers at the epoch of the Chandra and XMM-Newton observation, respectively. (2) Logarithmic ionization parameter, () of warm absorbers at the epoch of the Chandra and XMM-Newton observation, respectively. (3) Power-law photon index of the direct component. (4) Power-law normalization at 1 keV. (5) Normalization of the RELXILL model. (6) The reflection strength of the pexrav model (the solid angle of the reflector normalized by ). (7) Normalization of the zgauss model. (8) Hydrogen column density along the equatorial plane of the XCLUMPY torus model. (9) Torus angular width. (10) Normalization of the apec model. (11) Temperature of the apec model. (12)–(14) Time variability constant of Chandra, XMM-Newton, and Swift/BAT relative to NuSTAR, respectively. (15) Hydrogen column density along the line of sight determined by the torus parameters through Equation (5). (16) Intrinsic 2–10 keV luminosity of Mrk 739E at the epoch of the Chandra observation. (17)–(22) Parameters for Mrk 739W corresponding to (3), (4), (6), (8), (15) and (16), respectively. (23) Power-law photon index of the extended emission. (24) Power-law normalization at 1 keV. (25)–(27) Cross-calibration constant of Chandra, XMM-Newton, and Swift/BAT relative to NuSTAR, respectively.
| (degree) | ( cm-2) | |
|---|---|---|
| 10 | 644.0/618(1.04) | |
| 15 | 644.7/618(1.04) | |
| 20 | 654.6/618(1.06) |
Note. — is a fixed value, while is a free parameter.
4 DISCUSSION
4.1 Result Summary
We have analyzed the highest-quality available broadband X-ray spectra of the Mrk 739 system obtained with NuSTAR, Chandra, XMM-Newton, and Swift/BAT, covering the 0.5–70 keV band. Thanks to the superior angular resolution of Chandra, it is possible to separately analyze the spectra of three different regions, Mrk 739E, Mrk 739W, and the extended emission (Figure 1). We verify that the spectra of the other instruments can be reproduced with the sum of these three spectra by taking into account time variability in the flux of the direct components and warm-absorber parameters (for Mrk 739E). In particular, the NuSTAR data constrain well the broadband spectrum of the brighter AGN, Mrk 739E. To model the reflection components from the tori, we employ two models; pexrav (Model I, Magdziarz & Zdziarski 1995) and XCLUMPY (Model II, Tanimoto et al. 2019). Here, we mainly discuss the results obtained by Model II, where more realistic torus geometry is assumed.
Through this analysis, we are able to best constrain the X-ray properties of the two AGNs. We obtain the intrinsic 2–10 keV luminosities of and and absorption column densities by neutral material of and for Mrk 739E and Mrk 739W, respectively, at the epoch of the Chandra observation in April 2011. These results are essentially consistent with the previous study using Chandra and Swift/BAT (Koss et al., 2011), except that the column density of Mrk 739E is smaller than their estimate because of the inclusion of the warm absorbers in our analysis. We confirm that Mrk 739E is an unabsorbed moderately-luminous AGN, whereas Mrk 739W is a weakly absorbed, low-luminosity AGN. In the following, we focus on the AGN properties of Mrk 739E, which is 15 times brighter than Mrk 739W in the 2–10 keV band.
4.2 AGN Properties of Mrk 739E
We examine whether the AGN torus in Mrk 739E has a larger covering fraction than those of “normal AGNs” (i.e., those in nonmergers or early-stage mergers) based on the results obtained by Model II. The torus covering fraction, is defined as the solid angle of torus matter with column densities of normalized by . Using a Swift/BAT selected AGN sample, Ricci et al. (2017b) find that the Eddington ratio () is the key parameter that determines the torus structure; rapidly decreases from 0.8 to 0.3 at . This suggests that the AGN tori are regulated by radiation pressure on dusty gas within sphere of influence of the SMBH (see also Ricci et al. 2022). By contrast, as we mention in Section 1, Yamada et al. (2021) find that AGNs in late-merger U/LIRGs show (mean and standard deviation) at , which is significantly larger than those of normal AGNs at the same Eddington ratios (see also Yamada et al. 2020). This implies that the AGNs in late mergers have distinct structures from normal AGNs, possibly affected by the merger-driven quasi-spherical mass outflow and resultant enhanced outflow (see Figure 13 of Yamada et al. 2021). Other recent studies also point towards a larger obscuration of AGNs in dual galaxy systems. De Rosa et al. (2018) study X-ray absorption properties of four dual systems with projected separations of kpc, and find that the fraction of obscured () AGNs, , is higher than that of isolated AGNs detected with Swift/BAT (; Ricci et al. 2015). Guainazzi et al. (2021) investigate the X-ray properties of 32 galaxy pairs with projected separations of 150 kpc and find that AGNs in galaxy pairs tend to be obscured (a fraction of ).
Using the torus parameters ( and ) of XCLUMPY, we calculate as follows (see also Equation (6) in Ogawa et al. 2021). Here, we define the critical elevation angle , which satisfies in the Equation (5). Then, can be calculated as follows:
| (7) | |||||
Since we are not able to determine and simultaneously due to their parameter coupling, we estimate for the three cases, , , or (see Section 3.1). We find that of Mrk 739E is smaller than 0.50 at a 90% confidence limit for any values of we adopted.
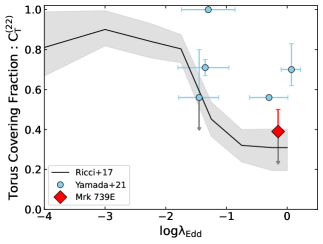
In the Figure 4, the relation between and obtained by Ricci et al. (2017b) for local hard X-ray selected AGNs, which are typically found in nonmerging galaxies, is shown. The points correspond to Mrk 739E (red) and the late-merger U/LIRGs (cyan; Yamada et al. 2021). The values of the late-merger U/LIRGs are calculated from the XCLUMPY parameters in the same manner as in this paper. Here, the Eddington ratio of Mrk 739E () is calculated from the bolometric luminosity based on the UV data (Koss et al., 2011), , and the black hole mass estimated by Koss et al. (2011), .
Figure 4 shows that the AGN torus of Mrk 739E has a smaller covering fraction than those of the late-merger U/LIRGs. Interestingly, the covering fraction is consistent with those of nonmergers at the same Eddington ratios. To verify the statistical significance of this result, we conduct Monte Carlo simulations with a sample size of by assuming that the intrinsic values of follow a gaussian distribution with a mean of and a standard deviation of , the distribution of the late-merger U/LIRGs. Additionally, we assume that varies from its intrinsic value with a standard deviation of , the 1- error obtained by our analysis. We find that the probability of having smaller than , the best fit value of our analysis, is . We thus suggest that the AGN torus of Mrk 739E has a smaller covering fraction than those of the late-merger U/LIRGs at a 95% confidence level. Accordingly, we suggest that Mrk 739E is an exception to the idea that dual systems generally show large obscurations (e.g., De Rosa et al. 2018, Guainazzi et al. 2021). The bolometric to 2–10 keV luminosity correction factor of Mrk 739E is calculated to be (based on the Chandra spectrum). Considering the fact that Mrk 739E has a high Eddington ratio (), this value is consistent with typical values of local hard X-ray selected AGNs at similar Eddington ratios, which show higher bolometric correction factors compared with those of AGNs at lower Eddington ratios ( at , see e.g., Vasudevan & Fabian 2007; Lusso et al. 2012). However, it is much smaller than those found for the late-merger U/LIRGs (; Yamada et al. 2021). This also supports the idea that the AGN in Mrk 739E is just neither deeply buried nor X-ray weak, even though it is in a late merger.
The difference in the AGN structure between Mrk 739E and late-merger U/LIRGs may be explained by considering the properties of its host galaxy. The stellar mass of Mrk 739E is estimated to be based on the K-band luminosity excluding the AGN region (Tubín et al., 2021). Using the far-infrared luminosity of the total Mrk 739 system, the SFR of Mrk 739E is constrained to be lower than , which includes the contribution from Mrk 739W. These and SFR values locates Mrk 739E as a main sequence star-forming galaxy or a star-formation quenching galaxy (Tubín et al., 2021), in contrast to the late-merger U/LIRGs, which are mostly star burst galaxies (e.g., Shangguan et al. 2019; Yamada et al. 2021). Assuming that the SFR is proportional to the 1.4th power of gas mass (Schmidt, 1959), 10 times smaller SFR- ratio of Mrk 739E means that it has a 0.2 times smaller gas-to-stellar mass ratio compared with the late-merger U/LIRGs. Thus, our results suggest that the gas-to-mass ratio of the host galaxy is an important parameter to determine the circumnuclear environment of an AGN in a late merger. In fact, recent numerical simulations of galaxy mergers show that both SFR and nuclear obscuration (in terms of column density) become weaker in gas-poor mergers than in gas-rich ones (Blecha et al., 2018). Our results are consistent with this picture.
5 CONCLUSION
In this paper, we have reported the results of broadband X-ray spectral (0.5–70 keV) analysis of the dual-AGN system Mrk 739, utilizing currently the highest-quality data observed with NuSTAR, Chandra, XMM-Newton and Swift/BAT. The latest X-ray clumpy torus model, XCLUMPY (Tanimoto et al., 2019), has been applied. Our main conclusions are summarized below.
-
1.
The X-ray spectrum of Mrk 739E is well reproduced by a direct power-law component and its reflection components from the accretion disk (RELXILL) and the torus (XCLUMPY). Time-variable warm absorbers are detected. The X-ray spectrum of Mrk 739W can be modelled by an absorbed power-law and its reflection from the torus.
-
2.
We have estimated the line of sight column densities by cold matter to be and and the intrinsic X-ray luminosities to be and for Mrk 739E and Mrk 739W, respectively. This confirms that Mrk 739E is an unabsorbed moderately-luminous AGN, whereas Mrk 739W is a weakly absorbed, low-luminosity AGN.
-
3.
On the basis of the parameters of XCLUMPY, we have determined the torus covering fraction of Mrk 739E to be . This is smaller than those of local late-merger U/LIRGs at similar Eddington rates, (mean and standard deviation; Yamada et al. 2021).
-
4.
Our result is a counterexample against the idea that AGNs are always deeply buried by gas and dust (i.e., the AGN tori have large covering fractions) in the late-stage mergers. We suggest that the gas-to-mass ratio of the host galaxy is an important parameter to determine the circumnuclear environment, which is consistent with recent numerical simulations of galaxy mergers. Further studies based on a larger sample of this type of AGNs are required to confirm this conclusion.
References
- Anders & Grevesse (1989) Anders, E., & Grevesse, N. 1989, Geochim. Cosmochim. Acta, 53, 197, doi: 10.1016/0016-7037(89)90286-X
- Arnaud (1996) Arnaud, K. A. 1996, in Astronomical Society of the Pacific Conference Series, Vol. 101, Astronomical Data Analysis Software and Systems V, ed. G. H. Jacoby & J. Barnes, 17
- Bautista & Kallman (2001) Bautista, M. A., & Kallman, T. R. 2001, ApJS, 134, 139, doi: 10.1086/320363
- Blecha et al. (2018) Blecha, L., Snyder, G. F., Satyapal, S., & Ellison, S. L. 2018, MNRAS, 478, 3056, doi: 10.1093/mnras/sty1274
- Dauser et al. (2013) Dauser, T., Garcia, J., Wilms, J., et al. 2013, Monthly Notices of the Royal Astronomical Society, 430, 1694–1708, doi: 10.1093/mnras/sts710
- Dauser et al. (2010) Dauser, T., Wilms, J., Reynolds, C. S., & Brenneman, L. W. 2010, Monthly Notices of the Royal Astronomical Society, 409, 1534–1540, doi: 10.1111/j.1365-2966.2010.17393.x
- De Rosa et al. (2018) De Rosa, A., Vignali, C., Husemann, B., et al. 2018, MNRAS, 480, 1639, doi: 10.1093/mnras/sty1867
- Ferrarese & Merritt (2000) Ferrarese, L., & Merritt, D. 2000, ApJ, 539, L9, doi: 10.1086/312838
- Fruscione et al. (2006) Fruscione, A., McDowell, J. C., Allen, G. E., et al. 2006, in Society of Photo-Optical Instrumentation Engineers (SPIE) Conference Series, Vol. 6270, Society of Photo-Optical Instrumentation Engineers (SPIE) Conference Series, ed. D. R. Silva & R. E. Doxsey, 62701V, doi: 10.1117/12.671760
- Gabriel et al. (2004) Gabriel, C., Denby, M., Fyfe, D. J., et al. 2004, in Astronomical Society of the Pacific Conference Series, Vol. 314, Astronomical Data Analysis Software and Systems (ADASS) XIII, ed. F. Ochsenbein, M. G. Allen, & D. Egret, 759
- García et al. (2014) García, J., Dauser, T., Lohfink, A., et al. 2014, The Astrophysical Journal, 782, 76, doi: 10.1088/0004-637x/782/2/76
- Garmire et al. (2003) Garmire, G. P., Bautz, M. W., Ford, P. G., Nousek, J. A., & Ricker, George R., J. 2003, in Society of Photo-Optical Instrumentation Engineers (SPIE) Conference Series, Vol. 4851, X-Ray and Gamma-Ray Telescopes and Instruments for Astronomy., ed. J. E. Truemper & H. D. Tananbaum, 28–44, doi: 10.1117/12.461599
- Gehrels et al. (2004) Gehrels, N., Chincarini, G., Giommi, P., et al. 2004, ApJ, 611, 1005, doi: 10.1086/422091
- Guainazzi et al. (2021) Guainazzi, M., De Rosa, A., Bianchi, S., et al. 2021, MNRAS, 504, 393, doi: 10.1093/mnras/stab808
- Harrison et al. (2013) Harrison, F. A., Craig, W. W., Christensen, F. E., et al. 2013, The Astrophysical Journal, 770, 103, doi: 10.1088/0004-637x/770/2/103
- Hopkins et al. (2008) Hopkins, P. F., Hernquist, L., Cox, T. J., & Kereš, D. 2008, The Astrophysical Journal Supplement Series, 175, 356–389, doi: 10.1086/524362
- Hopkins et al. (2006) Hopkins, P. F., Somerville, R. S., Hernquist, L., et al. 2006, ApJ, 652, 864, doi: 10.1086/508503
- Imanishi et al. (2006) Imanishi, M., Dudley, C. C., & Maloney, P. R. 2006, ApJ, 637, 114, doi: 10.1086/498391
- Imanishi et al. (2008) Imanishi, M., Nakagawa, T., Ohyama, Y., et al. 2008, PASJ, 60, S489, doi: 10.1093/pasj/60.sp2.S489
- Imanishi & Saito (2014) Imanishi, M., & Saito, Y. 2014, ApJ, 780, 106, doi: 10.1088/0004-637X/780/1/106
- Jansen et al. (2001) Jansen, F., Lumb, D., Altieri, B., et al. 2001, A&A, 365, L1, doi: 10.1051/0004-6361:20000036
- Kallman & Bautista (2001) Kallman, T., & Bautista, M. 2001, ApJS, 133, 221, doi: 10.1086/319184
- Kawaguchi et al. (2020) Kawaguchi, T., Yutani, N., & Wada, K. 2020, ApJ, 890, 125, doi: 10.3847/1538-4357/ab655a
- Kawamuro et al. (2016) Kawamuro, T., Ueda, Y., Tazaki, F., Ricci, C., & Terashima, Y. 2016, ApJS, 225, 14, doi: 10.3847/0067-0049/225/1/14
- Kormendy & Ho (2013) Kormendy, J., & Ho, L. C. 2013, Annual Review of Astronomy and Astrophysics, 51, 511–653, doi: 10.1146/annurev-astro-082708-101811
- Koss et al. (2012) Koss, M., Mushotzky, R., Treister, E., et al. 2012, The Astrophysical Journal, 746, L22, doi: 10.1088/2041-8205/746/2/l22
- Koss et al. (2011) Koss, M., Mushotzky, R., Veilleux, S., et al. 2011, The Astrophysical Journal, 735, L42, doi: 10.1088/2041-8205/735/2/l42
- Lusso et al. (2012) Lusso, E., Comastri, A., Simmons, B. D., et al. 2012, MNRAS, 425, 623, doi: 10.1111/j.1365-2966.2012.21513.x
- Madsen et al. (2017) Madsen, K. K., Beardmore, A. P., Forster, K., et al. 2017, AJ, 153, 2, doi: 10.3847/1538-3881/153/1/2
- Magdziarz & Zdziarski (1995) Magdziarz, P., & Zdziarski, A. A. 1995, MNRAS, 273, 837, doi: 10.1093/mnras/273.3.837
- Magorrian et al. (1998) Magorrian, J., Tremaine, S., Richstone, D., et al. 1998, AJ, 115, 2285, doi: 10.1086/300353
- Nandra et al. (2007) Nandra, K., O’Neill, P. M., George, I. M., & Reeves, J. N. 2007, MNRAS, 382, 194, doi: 10.1111/j.1365-2966.2007.12331.x
- Nasa High Energy Astrophysics Science Archive Research Center (2014) (Heasarc) Nasa High Energy Astrophysics Science Archive Research Center (Heasarc). 2014, HEAsoft: Unified Release of FTOOLS and XANADU, Astrophysics Source Code Library, record ascl:1408.004. http://ascl.net/1408.004
- Netzer et al. (1987) Netzer, H., Kollatschny, W., & Fricke, K. J. 1987, A&A, 171, 41
- Ogawa et al. (2021) Ogawa, S., Ueda, Y., Tanimoto, A., & Yamada, S. 2021, ApJ, 906, 84, doi: 10.3847/1538-4357/abccce
- Ogawa et al. (2019) Ogawa, S., Ueda, Y., Yamada, S., Tanimoto, A., & Kawaguchi, T. 2019, ApJ, 875, 115, doi: 10.3847/1538-4357/ab0e08
- Oh et al. (2018) Oh, K., Koss, M., Markwardt, C. B., et al. 2018, ApJS, 235, 4, doi: 10.3847/1538-4365/aaa7fd
- Patrick et al. (2012) Patrick, A. R., Reeves, J. N., Porquet, D., et al. 2012, MNRAS, 426, 2522, doi: 10.1111/j.1365-2966.2012.21868.x
- Ramos Almeida & Ricci (2017) Ramos Almeida, C., & Ricci, C. 2017, Nature Astronomy, 1, 679, doi: 10.1038/s41550-017-0232-z
- Ricci et al. (2015) Ricci, C., Ueda, Y., Koss, M. J., et al. 2015, ApJ, 815, L13, doi: 10.1088/2041-8205/815/1/L13
- Ricci et al. (2017a) Ricci, C., Bauer, F. E., Treister, E., et al. 2017a, MNRAS, 468, 1273, doi: 10.1093/mnras/stx173
- Ricci et al. (2017b) Ricci, C., Trakhtenbrot, B., Koss, M. J., et al. 2017b, Nature, 549, 488, doi: 10.1038/nature23906
- Ricci et al. (2018) Ricci, C., Ho, L. C., Fabian, A. C., et al. 2018, MNRAS, 480, 1819, doi: 10.1093/mnras/sty1879
- Ricci et al. (2021) Ricci, C., Privon, G. C., Pfeifle, R. W., et al. 2021, MNRAS, 506, 5935, doi: 10.1093/mnras/stab2052
- Ricci et al. (2022) Ricci, C., Ananna, T. T., Temple, M. J., et al. 2022, arXiv e-prints, arXiv:2209.00014. https://arxiv.org/abs/2209.00014
- Sanders & Mirabel (1996) Sanders, D. B., & Mirabel, I. F. 1996, ARA&A, 34, 749, doi: 10.1146/annurev.astro.34.1.749
- Schmidt (1959) Schmidt, M. 1959, ApJ, 129, 243, doi: 10.1086/146614
- Shangguan et al. (2019) Shangguan, J., Ho, L. C., Li, R., et al. 2019, ApJ, 870, 104, doi: 10.3847/1538-4357/aaf21a
- Stierwalt et al. (2013) Stierwalt, S., Armus, L., Surace, J. A., et al. 2013, ApJS, 206, 1, doi: 10.1088/0067-0049/206/1/1
- Strüder et al. (2001) Strüder, L., Briel, U., Dennerl, K., et al. 2001, A&A, 365, L18, doi: 10.1051/0004-6361:20000066
- Tanimoto et al. (2019) Tanimoto, A., Ueda, Y., Odaka, H., et al. 2019, The Astrophysical Journal, 877, 95, doi: 10.3847/1538-4357/ab1b20
- Tanimoto et al. (2020) Tanimoto, A., Ueda, Y., Odaka, H., et al. 2020, ApJ, 897, 2, doi: 10.3847/1538-4357/ab96bc
- Tanimoto et al. (2022) Tanimoto, A., Ueda, Y., Odaka, H., Yamada, S., & Ricci, C. 2022, ApJS, 260, 30, doi: 10.3847/1538-4365/ac5f59
- Toba et al. (2020) Toba, Y., Yamada, S., Ueda, Y., et al. 2020, ApJ, 888, 8, doi: 10.3847/1538-4357/ab5718
- Tubín et al. (2021) Tubín, D., Treister, E., D’Ago, G., et al. 2021, The Astrophysical Journal, 911, 100, doi: 10.3847/1538-4357/abedba
- Uematsu et al. (2021) Uematsu, R., Ueda, Y., Tanimoto, A., et al. 2021, ApJ, 913, 17, doi: 10.3847/1538-4357/abf0a2
- Urry & Padovani (1995) Urry, C. M., & Padovani, P. 1995, PASP, 107, 803, doi: 10.1086/133630
- Vasudevan & Fabian (2007) Vasudevan, R. V., & Fabian, A. C. 2007, MNRAS, 381, 1235, doi: 10.1111/j.1365-2966.2007.12328.x
- Weisskopf et al. (2002) Weisskopf, M. C., Brinkman, B., Canizares, C., et al. 2002, Publications of the Astronomical Society of the Pacific, 114, 1–24, doi: 10.1086/338108
- Willingale et al. (2013) Willingale, R., Starling, R. L. C., Beardmore, A. P., Tanvir, N. R., & O’Brien, P. T. 2013, MNRAS, 431, 394, doi: 10.1093/mnras/stt175
- Yamada et al. (2018) Yamada, S., Ueda, Y., Oda, S., et al. 2018, The Astrophysical Journal, 858, 106, doi: 10.3847/1538-4357/aabacb
- Yamada et al. (2021) Yamada, S., Ueda, Y., Tanimoto, A., et al. 2021, ApJS, 257, 61, doi: 10.3847/1538-4365/ac17f5
- Yamada et al. (2019) —. 2019, ApJ, 876, 96, doi: 10.3847/1538-4357/ab14f0
- Yamada et al. (2020) —. 2020, ApJ, 897, 107, doi: 10.3847/1538-4357/ab94b1