A numerical investigation of the mechanics of intracranial aneurysms walls: Assessing the influence of tissue hyperelastic laws and heterogeneous properties on the stress and stretch fields
Abstract
Numerical simulations have been extensively used in the past two decades for the study of IAs, a dangerous disease that occurs in the arteries that reach the brain. They may affect up to of the world’s population, with up to mortality rate, in case of rupture. Physically, the blood flow inside IAsshould be modeled as a fluid-solid interaction problem. However, the large majority of those works have focused on the hemodynamics of the intra-aneurysmal flow, while ignoring the wall tissue’s mechanical response entirely, through rigid-wall modeling, or using limited modeling assumptions for the tissue mechanics. One of the explanations is the scarce data on the properties of IAswalls, thus limiting the use of better modeling options. Unfortunately, this situation is still the case, thus our present study investigates the effect of different modeling approaches to simulate the motion of an IA. We used three hyperelastic laws — the Yeoh law, the three-parameter Mooney-Rivlinlaw, and a Fung-like law with a single parameter — and two different ways of modeling the wall thickness and tissue mechanical properties — one assumed that both were uniform while the other accounted for the heterogeneity of the wall by using a “hemodynamics-driven” approach in which both thickness and material constants varied spatially with the cardiac-cycle-averaged hemodynamics. Pulsatile numerical simulations, with patient-specific vascular geometries harboring IAs, were carried out using the one-way fluid-solid interactionsolution strategy implemented in solids4foam, an extension of OpenFOAM®, in which the blood flow is solved and applied as the driving force of the wall motion. We found that different wall morphology models yield smaller absolute differences in the mechanical response than different hyperelastic laws. Furthermore, the stretch levels of IAswalls were more sensitive to the hyperelastic and material constants than the stress. These findings could be used to guide modeling decisions on IAsimulations, since the computational behavior of each law was different, for example, with the Yeoh law yielding the smallest computational time.
keywords:
intracranial aneurysms , hyperelasticity , wall morphology , mechanical response , numerical simulationsnewfloatplacement\undefine@keynewfloatname\undefine@keynewfloatfileext\undefine@keynewfloatwithin
1 Introduction
Intracranial aneurysms (IAs)are pathological dilatations of the human vascular system normally found in the bifurcations of the cerebral arteries tree. The most common form has a saccular shape, with a prevalence of up to in the brain arteries [1], being a dangerous disease that may affect up to of the world’s population [2] and with up to mortality rate, in case of rupture [3, 4]. This pathology has, in the past three decades, been investigated experimentally [5, 6], which, for example, led to the understanding of the importance of hemodynamics on its development, but also numerically through Computational Fluid Dynamics (CFD), which provided detailed information on the hemodynamics [7] — although still being a debatable topic in the clinical practice [8, 9].
Due to the nature of the pathology, better modeling is continuously sought to allow for more reliable numerical simulations, for example, through the use of Fluid-Solid Interaction (FSI)modeling [10, 11], although numerical techniques to solve FSIproblems pose challenging numerical difficulties [12, 13]. Additionally, using an FSIstrategy employed for patient-specific IAgeometries requires the modeling of their wall tissue that also poses difficulties hard to overcome, such as the lack of patient-specific data of the wall thickness, the constitutive behavior of the tissue and its material properties. This is particularly important due to the large variability of the disease.
Previous experimental works showed that IAswalls are more likely to have wall thickness and mechanical and failure properties varying spatially [14, 15]. This local morphology is caused by the natural history of a particular IA[16, 17]. Meng et al. [18], for example, hypothesized two biological pathways, dependent on different local hemodynamic conditions, that would lead to different wall phenotypes — the authors name these two phenotypes as “type-I”, comprising small IAswith thin and translucent walls, and “type-II”, encompassing large IAswith thick, white or yellow, atherosclerotic walls. Moreover, a spectrum of morphologies would exist between these broad phenotypes, as investigated by Kadasi et al. [14], for example, who found that of IAsare type-I, are type-II, and contain both patch types.
How a patient-specific IAgrows also influences its mechanical behavior, classically considered to be well described by hyperelastic laws [19] — even though particular laws to suitably represent it do not exist [20]. In the last decade, a few works mechanically characterized samples of IAtissue using uniaxial tests to failure, obtaining the values of the material constants that appear in hyperelastic laws classically associated with artery tissue behavior [21]. Typical examples are the Mooney-Rivlin (MR)law [22], the Yeoh law [23], and an isotropic exponential Fung-like quadratic law [24]. Apart from the mechanical constants, other properties of IAstissue have also been reported by Costalat et al. [22], for example, who found that the tissue of unruptured IAsis stiffer than ruptured IAstissue. Finally, in possession of IAtissue samples, these works have also measured their average thickness, further confirming that an IAis globally thinner than its surrounding arteries.
Although it is still a challenge to measure the local morphology, i.e. the local wall thickness and tissue material properties, for a large number of patient-specific IAs, some works on the subject exist. Signorelli et al. [15], for example, used an “indentation device” to measure, in a point-wise manner, the elasticity modulus of an IAsac sample with a resolution of . Their findings suggest that the rupture site is less stiff, i.e. with a smaller elasticity modulus than the rest of the sac, where they found that stiff regions were mixed with thinner regions. The technique has the same drawbacks as classical uniaxial tests, though, because it still requires the aneurysm tissue to be collected, hence in vivo measurements are unfeasible. In this regard, imaging techniques are thought to be a promising alternative to measuring the local thickness of a patient-specific IAsac, as performed by Kleinloog et al. [25] through an experimental study in which the wall thickness of IAswas measured using a 7T Magnetic Resonance Imaging.
Cebral et al. [26] used CFDto investigate an IAsac’s local morphological heterogeneity. The authors subdivided the wall of a sample of IAsinto five regions with specific phenotypes: atherosclerotic, hyperplastic, thin, the rupture site, and “normal-appearing” by intraoperative observation and correlated each of them with local hemodynamics. They found a similar relationship between the local hemodynamics conditions investigated by Meng et al. [18], so-called “low-flow” and “high-flow” effects, and the wall phenotypes. Their study is a good example of how numerical simulations could be used to predict the IAsac heterogeneity on a patient-by-patient basis.
Therefore, accounting for all these modeling requirements makes the modeling of a patient-specific IAwall a challenge due to both the scarce experimental data to feed numerical models and the large variability of the disease, which prevents patient-specific computations. This is reflected in the modeling choices used by the few numerical works that investigated the mechanical response of IAs. For example, in terms of the approach to estimating the wall thickness, we found a majority that employed uniform thickness throughout the IAsac and branches [27, 28, 29, 30], and a small amount that employed a uniform thickness for the aneurysm sac and a different one on the branches [31], or a lumen-diameter thickness [10]. Finally, only a single work obtained the patient-specific thickness distribution of the IAsac [32] and compared it with a whole uniform wall model, nonetheless the authors used micro-computed tomography to scan the aneurysm sac, a technique that is difficult to apply in a larger cohort of IAs.
Regarding the selection of constitutive law, works that numerically solved the FSIproblem with patient-specific IAsubjects have used several different ones. Surprisingly, we found a majority that has chosen the small-strain Hookean law that, rigorously, should not be used in finite-deformation motions [33, 30, 11, 34]. Other works employed the classic neo-Hookean law [35] or more specialized ones, such as exponential laws [28] and the MRlaw [36], although in a smaller number, and not always using the material properties of patient-specific IAtissue.
Despite the uncertainty about which law to choose, the assessment of the impact of different material laws on the mechanics of IAswalls has been the subject of even fewer studies. Torii et al. [28] performed FSIsimulations for one IAcase, by assuming, first, the rigid wall assumption — thus “pure” CFDsimulations —, and three elastic laws: the Hookean law (thus, assuming small strains), the St. Venant-Kirchhofflaw, and another hyperelastic law using the exponential strain-energy function proposed by Demiray [37]. Their findings showed that the displacement profiles were qualitatively similar among all the elastic laws, although the maximum displacement with the exponential hyperelastic law was smaller than that for the St. Venant-Kirchhofflaw. Unfortunately, their results on the wall mechanics were limited to the displacement field, no stresses or strain were analyzed because their focus was on the hemodynamics.
An earlier trial to assess different constitutive laws in IAs’ mechanical response was conducted by Ramachandran et al. [38], with patient-specific IAsgeometries. The authors assumed them to be statically determined, i.e. their mechanical response was independent of the material properties, and investigated the impact of different constitutive laws on the wall stresses and strains by numerically simulating only the aneurysm sac with Computational Solid Dynamics (CSD)by using a numerical modeling similar to inflation experiments. They used both anisotropic and isotropic versions of Fung-like laws, the Yeoh law with three parameters, the St. Venant-Kirchhofflaw, and Hooke’s law too. Their results suggested that the aneurysm sac may indeed be statically determined regarding different material laws. However, they only studied the aneurysm sac, i.e. they removed the surrounding arteries portions that may have had an impact on the aneurysms sac stresses, and their pressure-inflation model employed static boundary conditions (BCs), which limits their conclusions. Indeed, the authors highlighted that these conclusions may not stand when the full vasculature would be simulated with dynamical BCsthat realistically reflect the cardiac cycle forces.
In this current scenario, it is clear that it remains broadly unknown what is the average impact of the use of different hyperelastic laws and wall morphology models in the mechanics of IAs, i.e. in the stress and strain fields of the IAsac. Therefore, the aim of this work was to assess what could be the impact of choosing different material laws and different morphology models to numerically obtain the mechanical response of IAs. More specifically, we investigated whether a wall model with uniform thickness and material constants, for example, would be acceptable to be used, given the dominant heterogeneity existing for this disease. This is essential in investigations of IArupture while promising tools that could extract the heterogeneity of the wall more accurately are not ready to do that for a large cohort of patient-specific IAsand, also, because ultimately the rupture event depends on the stress and strain levels on the wall.
2 Numerical Methodology
2.1 Sample Selection and Geometry Preparation
We selected twelve vascular geometries from digital subtraction angiography (DSA)examinations collected retrospectively. Nine were collected in the Albert Einstein Israelite Hospital, São Paulo, and approved to be used by the institution’s Research Ethics Committee as also by the Research Ethics Committee of the Faculty of Medicine of São Paulo State University (UNESP), Campus of Botucatu. The additional three vascular geometries were obtained from the Aneurisk dataset repository [39], which provides a set of IAsgeometries used during the Aneurisk project and are available under the “CC BY-NC 3.0” license. We used these additional geometries due to the lack of sufficient ruptured cases in the original dataset to build a representative sample.
The twelve vasculatures harbored thirteen bifurcation IAs, all of them originating from the more common bifurcation spots of IAoccurrences in the brain vessels (the internal carotid artery (ICA)and middle cerebral artery (MCA)). Seven were unruptured and six ruptured with maximum dome diameter ranging from, roughly, to , thus categorizing them as small- or medium-sized IAs(mean standard deviationequals for the ruptured group and for the unruptured group). For reference, they were labeled by appending their rupture status, prefix “r” for ruptured and “ur” for unruptured, to their parent artery. For example, an unruptured case in the ICAbifurcation is labeled “urICA”, followed by a natural number in case of repetition.
The DSAimages were segmented using the Vascular Modeling Toolkit (VMTK)® library [40] with the level-set segmentation method [41]. The selection of the volume of interestwas not defined a priori but chosen large enough to ensure that it enclosed only the aneurysm and its closest surrounding vessels. Subsequently, a triangulated surface was generated with the Marching Cubes algorithm [42, 43]. Inlet and outlet profiles were artificially created in the surfaces to impose BCsfor the numerical simulations.
2.2 Physical and Mathematical Modeling and Boundary Conditions
In the flow domain, blood was assumed to be a weakly compressible Newtonian fluid flowing in an isothermal laminar regime, hence the continuity, momentum, and an equation of state were solved for the fields of flow velocity, , pressure , and blood density . For a moving control volume in the fluid domain, , and using the arbitrary Lagrangian-Eulerian (ALE)framework, where the reference coordinate system is given by , the continuity equation is written as:
| (1) |
where is the velocity of the referential system of the ALEformulation, and is the outward normal vector to the control surface ; additionally, the momentum equation in integral form is given by:
| (2) |
where is the Cauchy stress tensor, given by:
| (3) |
and is the second-order identity tensor. Blood dynamic viscosity was assumed to be .
Finally, blood compressibility was assumed to be governed by the barotropic equation of state, which has already been used to model the behavior of blood in FSIproblems [44, 45, 46]. It can be applied for liquids at “low pressures” when the change in density is linearly related to the pressure change according to the definition of the bulk modulus of the fluid, :
| (4) |
In this case, the pressure and the fluid density are related by:
| (5) |
where the subscript “” indicates a reference state of the fluid, assumed to be blood at an average cardiac cycle pressure, , with . Blood bulk modulus was assumed to be [44].
The solid domain, i.e. the IAand artery walls, was assumed as isotropic and represented by a hyperelastic constitutive law. In the finite-deformation regime, the momentum equation was solved in the total Lagrangian formulation and integral form, written as:
| (6) |
where is the motion displacement, is the tissue density at the reference configuration, and is the deformation gradient of the motion, with . The subscript “” indicates any property or derivative that was evaluated with respect to the coordinates system of the reference configuration, indicated by . The reference configuration was assumed to be the domain configuration at the time zero and to be pre-stressed with a Cauchy prestress field calculated by . The second Piola-Kirchhoff prestress tensor, , was computed using the same approach employed by Bazilevs et al. [10].
Finally, the Cauchy stress of the solid, , was calculated using three different hyperelastic laws that are defined based on their strain-energy function, , as follows:
-
1.
the MRlaw with 3 material constants [47]:
(7) -
2.
the Yeoh law with 3 material constants
(8) -
3.
and an “isotropic” version of the exponential Fung-like law, originally proposed by Demiray [37]:
(9)
where and are the first and second invariants of the right Cauchy-Green deformation tensor. The complete constitutive model employed a volumetric-decomposition approach as explained in Holzapfel et al. [48]. In this framework, the volumetric part of the tissue motion, dependent on the tissue compressibility, was ultimately measured by the Poisson’s ratio of the tissue, through its bulk modulus, , as computed by the linearized theory:
| (10) |
For the simulations in this work, the Poisson ratio was assumed to be — we performed a parametric study of its influence on the stresses and stretch on an IAsac surface and found that by increasing it above , both average fields over the sac changed by less than , on average, for all the hyperelastic laws, while still yielding reasonable computational times. The linearized Young’s modulus for the hyperelastic laws was also calculated based on the uniaxial deformation, resulting in [49].
Boundary conditions (BCs)
At the flow inlet (see Fig. 1), a time-varying pulsatile velocity profile was imposed varying spatially according to the fully-developed laminar flow in a pipe:
| (11) |
where is the cross-sectional area of the inlet artery, is its diameter, and is the radial coordinate of the circular inlet section — an artificial circular-section extension, with a length equal to twice the diameter , was added to the artery inlet to impose this inlet flow condition. The blood flow rate, , corresponding to the flow pulse from the beginning of systole until the end of the diastole, was obtained by multiplying the normalized flow rate reported by Hoi et al. [50], for older adults, by the mean blood flow rate in the respective IAparent artery reported by Zarrinkoob et al. [51]. This population-averaged rate was employed because the patient-specific blood flow rate waveform at the ICAwas not available. An example of the profile used for IAson the ICAis shown in Fig. 2a. Moreover, the pressure gradient was set to zero at the inlet.
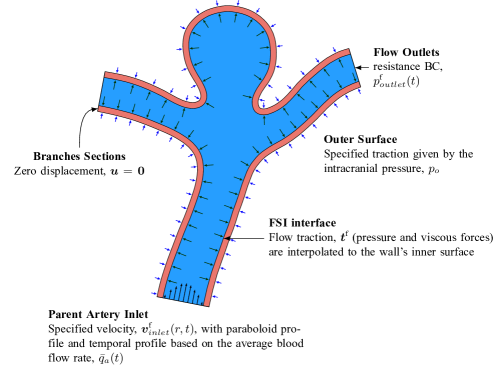
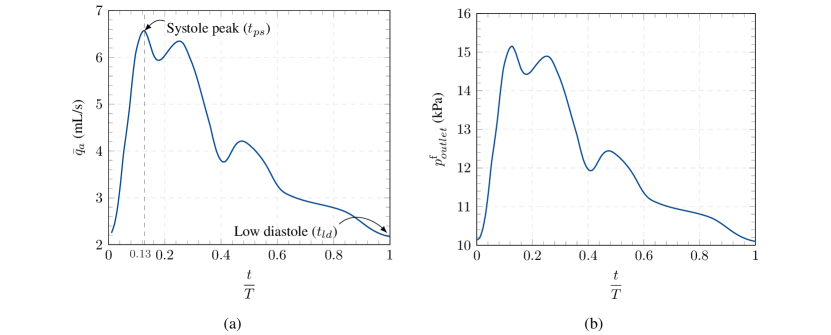
At the outlets, a flux-corrected velocity and a resistance BCfor pressure were imposed. The resistance BCis defined as being proportional to the blood flow rate profile, but with levels ranging between the normal cardiac cycle pressure levels, i.e. from (approximately , see Fig. 2b). Since the distances between the outlets and the aneurysm were not sufficiently long and we did not add cylindrical extensions at the outlets to avoid large computational meshes, reports show that it is important to use this BC[52].
On the outer surface of the solid wall (the abluminal surface), a pressure of , corresponding to the intracranial pressure, was imposed. Although the intracranial pressure seems to vary among patients, we have found similar values in related studies [53, 36]. On branch “sections” that were artificially created due to the segmentation process (indicated in Fig. 1), we imposed zero displacements, i.e.:
| (12) |
2.3 Modeling the Heterogeneity of the IA Wall
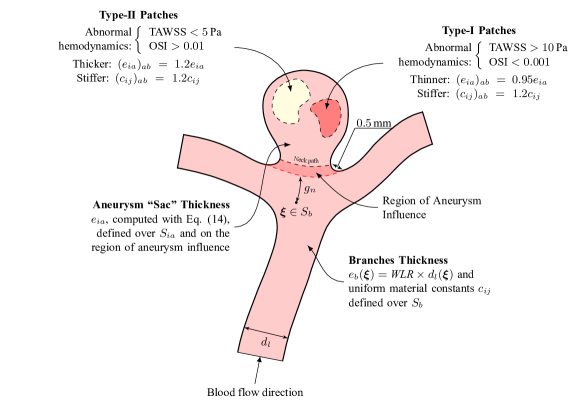
The modeling of the thickness, , and material constants of the IAsac wall — represented here as as they correspond to the constants appearing in the laws given by Eqs. 7, 8 and 9 — will be referenced as “wall morphology modeling” and two approaches were employed. In the uniform-wall model, we assumed that both and were uniform over the IAsac, while in the abnormal-wall modelwe assumed that the two wall properties’ distributions are governed by the adjacent time-averaged wall shear stress (TAWSS)and oscillatory shear index (OSI)fields of the intra-aneurysmal flow. Both approaches used the same modeling for the IA’s surrounding branches.
Computationally, both were built with scripts in VMTK® and an in-house code based on the Visualization Toolkit (VTK)®. The thickness field defined by each model was used to build the computational mesh of the solid domain (see Section 2.4), whereas the material constants fields were computationally created in these meshes. The starting point was the manual delineation of the neck contour, over the triangulated surface extracted from the DSAexams, by interactively marking its path. Mathematically, the neck contour or path, , separates the surface of the branches, , from the IAsac, (see Fig. 3 for a schematic example of and other terms used in this section).
Morphology of the Branches Wall
The thickness of , , was based on established evidence that arteries thickness is dependent on the vessel lumen diameter [54] and used the wall-to-lumen ratio (WLR)[55] to estimate the branch thickness. The WLRis defined as , where is the artery lumen diameter at a specified position along the vasculature. Therefore, the local branch thickness was calculated as (note that was defined at the reference configuration, hence defined in material coordinates, ).
The lumen diameter of each geometry was estimated by using VMTK®, by computing the distance between the vasculature centerlines and its surface [41]. Empirical values of the WLRin the cerebral arteries were reported by Nakagawa et al. [55] and used to define a functional form of WLRaccording to the lumen diameter, as follows:
| (13) |
Uniform-wall model
We estimated the uniform thickness of the IAsac, , as a weighted average of the surrounding branches thickness field, as follows:
| (14) |
where is a factor to control how much thinner the aneurysm wall was compared to the vasculature; was used consistently for all geometries, consequently was within the range that agrees with measured values available in the literature. The weight function, , was the minimum geodesic distance between each point of the surrounding branches, , and the line that separates the sac and what was named the region of aneurysm influence (see Fig. 3). This line may not be coincident with the aneurysm neck contour, because, depending on its morphology and location, there might exist regions that neither belong to the healthy vasculature nor the aneurysm sac. Therefore, it may be imagined as a separation between the hypothetical healthy vasculature and the region of aneurysm influence. This line was computed automatically as being apart from the neck contour.
Finally, the computational procedure used to build these fields created a discontinuity between the thickness on and the branches thickness distribution defined over . To correct this biologically unrealistic discontinuity, the resulting thickness was smoothed out using the array smoothing script provided by VMTK® with 15 iterations.
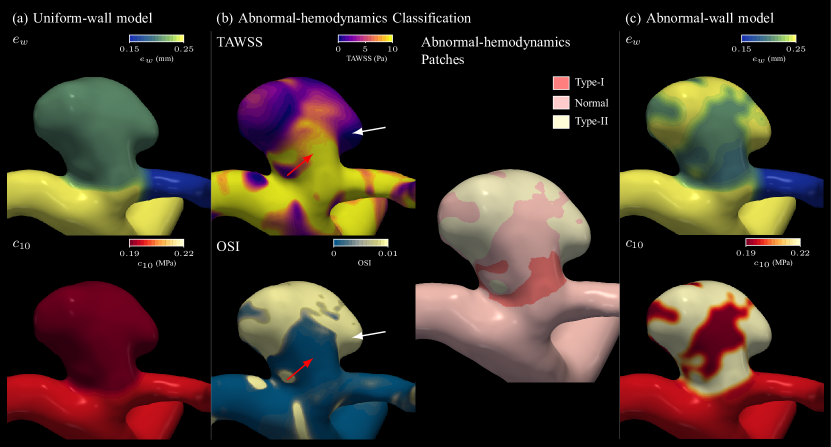
We assumed the material constants, , as uniform on both and , but with different values according to rupture status, following experimental evidence that ruptured IAsare less stiff than unruptured ones. Hence, the values for each constant (see Table 1) were based on averages of experimental data, with ruptured and unruptured IA, provided by Costalat et al. [22] for the MRlaw and Brunel et al. [23] for the Yeoh law. We were not able to find any work that fit mechanical data of IAtissue to the isotropic Fung law, hence we based the values used here on the constants used by Torii et al. [56], and , based on experiments with porcine carotid arteries. See Fig. 4a for an example of the resulting fields of and .
| Law | Constant | |||
|---|---|---|---|---|
| Ruptured | Unruptured | |||
| MR | () | |||
| () | ||||
| () | ||||
| Yeoh | () | |||
| () | ||||
| () | ||||
| Fung | () | |||
| (-) | ||||
Abnormal-wall model
We selected two “abnormal-hemodynamics” conditions adjacent to the aneurysm wall that were already associated with phenotypic changes, more specifically, with type-I and type-II regions as proposed by Meng et al. [18]. The type-I phenotype is more likely to be caused by the occurrence of high TAWSS, , and low OSI, (“high-flow” effects) and cause local wall thinning and stiffening. On the other hand, the type-II phenotype is more likely to be caused by disturbed flow characterized by low TAWSS, , and high OSI, (“low-flow effects”), causing local stiffening and thickening with atherosclerosis. Those specific thresholds for TAWSSand OSIwere chosen based on the averaged values reported by Furukawa et al. [57] and Cebral et al. [26].
For each patient-specific IAgeometry, these regions were identified after performing CFDsimulations using the rigid-wall assumption — the specific methodology of these simulations can be found elsewhere [58]. The TAWSSand OSIwere computed and the identification of the abnormal-hemodynamics patches was performed automatically by using an in-house code implemented with the VTK® library (see Fig. 4b). Patches that were neither identified as type-I or II were labeled “normal”.
The fields of aneurysm thickness, , and of each material constants on were computationally “updated” according to the illustration in Fig. 3. If a portion of the aneurysm is identified as a type-I patch, the thickness was decreased by and the material constants were increased by . On type-II patches, both thickness and material constants were increased by . The properties on normal patches remained unaltered, i.e. with the same properties as defined in the uniform-wall model(see Fig. 4c). Finally, these fields were also smoothed to avoid unrealistic discontinuities introduced during the computation procedure.
2.4 Computational Meshes and Numerical Strategies
The numerical simulations were performed in solids4foam [59], an extension of the foam-extend library [60, 61], version 4.0, which uses the second-order-accurate Finite Volume Method (FVM)as the discretization method. The one-way fluid-solid interaction (1WFSI)solution strategy implemented in solids4foam was used, in which the blood flow is first solved assuming a rigid wall and, at each time-step, the wall traction forces are applied as the driving force of the wall motion, whereas the solid deformation is not passed back to the fluid domain. This strategy was chosen to avoid the numerical instabilities that arise in the numerical solution of flow in arterial geometries. That allowed us to simulate a relatively large number of patient-specific IAgeometries. Furthermore, in this work we were interested in the mechanical response of the wall, hence only simulating it with the blood flow forces is sufficient for this comparative analysis.
The discretized version of the Eq. 6, with the different hyperelastic laws and morphology models, was solved by using the segregated algorithm in solids4foam, while the flow governing equations were solved with the PISOalgorithm [62], adapted for the flow of a compressible fluid. In the solution of both sub-problems, we selected second-order interpolation profiles for the spatial discretization to maintain the second-order accuracy level of the FVM. The central differences scheme was used for all the Laplacian terms, with non-orthogonal and skewness corrections [63]. Particularly for the flow’s momentum and pressure equations, the second-order upwind scheme was used for the advective term. Moreover, all the gradients in the equations were discretized with the least-squares scheme. The temporal discretization was performed by using the implicit first-order Euler approach for the solid momentum equation and the implicit second-order Euler approach for the flow’s momentum equation. Finally, the normalized residual convergence criteria were: for the flow ’s pressure equation, for the flow’s momentum equation, and for the outer iterations of the solid’s momentum.
The fluid and solid computational meshes were built with the triangulated surfaces extracted with VMTK®. The mesh of the flow domain was generated using the utility cartesianMesh provided by foam-extend as part of the cfMesh library. This utility automatically creates polyhedral meshes that are predominantly composed of hexahedral cells, i.e. the interior of the mesh consists of cells close in shape to hexahedra. To fit the curved boundary, the cells adjacent to the wall are, generically, polyhedra with a prismatic boundary-layer-refined region composed of five layers. Subsequently, the FSIinterface of this fluid mesh, a quadrilateral surface, was “re-meshed”, i.e. the structure of it was modified to only contain triangular faces by using VMTK®. This re-meshing procedure was necessary because of the possibility of pressure oscillations infecting the solid displacement solution when using quadrilateral cells with the segregated approach and the FVM[64]. The solid mesh was, then, created by extruding that re-meshed surface in the outward direction using VMTK® with the thickness field defined in Section 2.3. Six layers were used in the extrusion.
For the type of fluid meshes used in this work, mesh-sensitivity studies were carried out extensively with different IAsgeometries and were not included here. They yielded a volume density of cells in the range of (an example of this study can be found in Oliveira et al. [58]). This level of refinement was assured for the meshes used in this work. We carried out a separate mesh-independence study of the solid meshes by also using the 1WFSIstrategy with three systematically-refined meshes. The result was a mesh with a surface-cells density of approximately , with 6 layers of cells along with the thickness. We also carried out a time-step refinement study yielding a time-step of . Finally, two cardiac cycles were solved in each simulation, but only the second one was used for the analysis.
2.5 Data Analysis
Physical Variables of Analysis And Metrics Employed
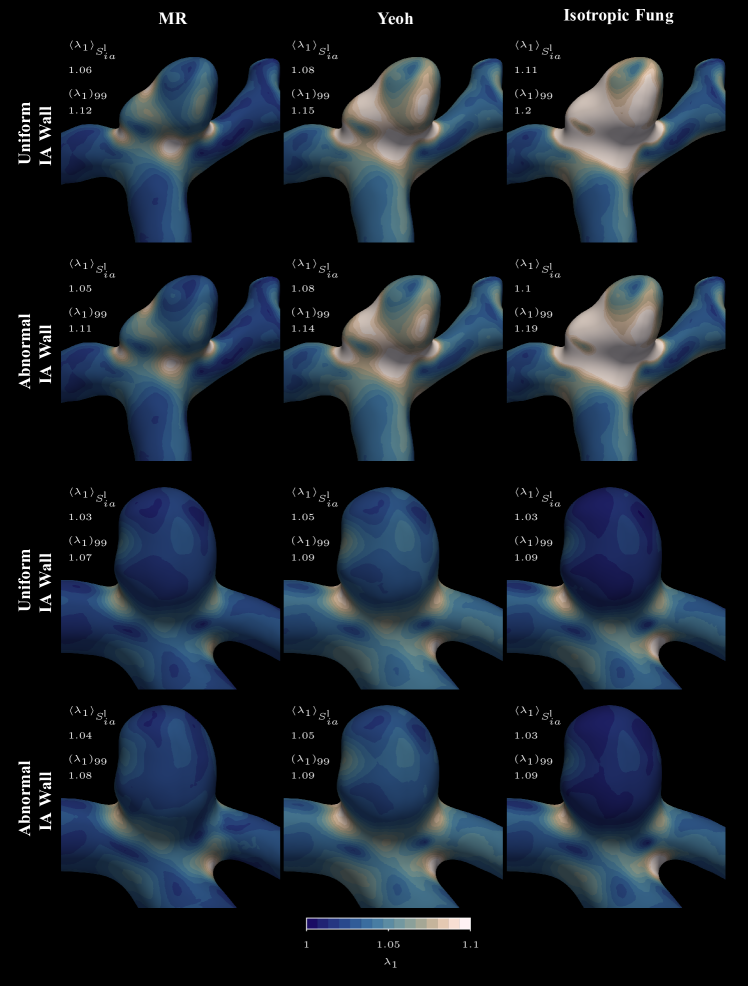
We selected the largest principal Cauchy stress field of the solid wall, (we drop the superscript “” henceforth), and its largest principal stretch, (given by the square root of the largest principal value of ) as the main subjects of our analysis. Both were taken at the deformed configuration at the peak-systole, i.e. (see Fig. 2a).
Both fields were analyzed only on the luminal and abluminal sides of the aneurysmal region, i.e. on and . To perform the statistical analysis, we computed two metrics of the fields. The \nth99 percentile of each field, and , were used as “proxies” of the fields’ maximum specifically for the statistical analysis, due to possible mesh-induced differences in the absolute maximum. The second metric was the surface average of a field over a surface, , defined as follows, for :
| (15) |
where is the area operator and is either or . For , the surface-average metric gives a measure of the total traction on caused by this stress. A similar physical meaning cannot be said about although the same definition was used regardless.
Statistical Analysis
Statistical tests were performed with n = 13, for the \nth99 percentiles and the surface averages, by using the SciPy library [66] with a significance level of (hence, confidence interval). All distributions were tested for normality by using the Shapiro-Wilk test.
To compare the two wall morphology models, for each hyperelastic law, the paired t-test and the Wilcoxon signed-rank tests were used for normal and non-normal distributions, respectively. Similarly, to compare the three distributions of the hyperelastic laws, the ANOVA test and the Kruskal-Wallis test were used a priori for normal and for non-normal distributions, respectively. Subsequently, pair-wise posthoc analyses were performed to test the distributions. The t-test and Dunn’s posthoc methods were employed, in this case, for normal and non-normal distributions, respectively, via Python’s scikit-posthoc library.
Relative Comparison Among Different Models
To quantify the differences among the metrics, we computed the absolute differences between the mean of the distributions obtained with each modeling approach. If is the mean of the distribution of a metric , for a fixed hyperelastic law, the mean difference between the uniform and abnormal wall morphologies for a sample was defined as:
| (16) |
where the superscript “WM” stands for “wall morphology”, and, consequentely, “UWM” and “AWM” indicate the uniform and abnormal-wall models.
Because three hyperelastic laws were employed and none can be assumed the “gold standard” to represent IAtissue, first, a difference similar to Eq. 16, but in a pair-wise manner between the three laws, MR, Yeoh, and isotropic Fung, was computed. Then, the maximum of these values was found, or mathematically:
| (17) |
where the superscript “HL” stands for “hyperelastic laws” and the pair assumes the values in the set of permutations among the three hyperelastic laws.
3 Results
A preliminary qualitative analysis of the and fields in two representative cases of the ruptured and unruptured groups (labeled from now on as and , respectively), namely, cases rMCA1and urICA1suggests that the different hyperelastic laws exert less influence on than on and this seems to be true for both IAs(see Fig. 5). The field in case rMCA1has a different overall magnitude on its sac depending on the law, whereas the qualitative differences in urICA1are less apparent (see on the top panel of Fig. 6 how the Fung and Yeoh laws produce higher levels of stretch in much larger areas than the MRlaw). On the other hand, for both and , the two morphology models produce similar fields, regardless of the particular hyperelastic law or the rupture status. Similar trends were found when inspecting the abluminal surface, .
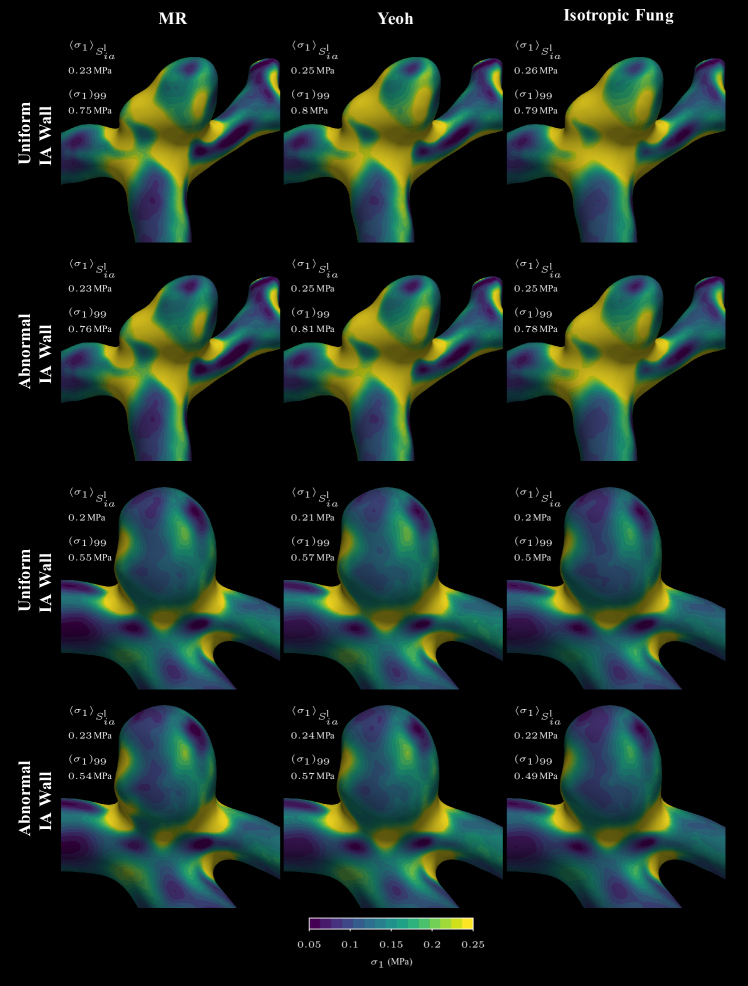
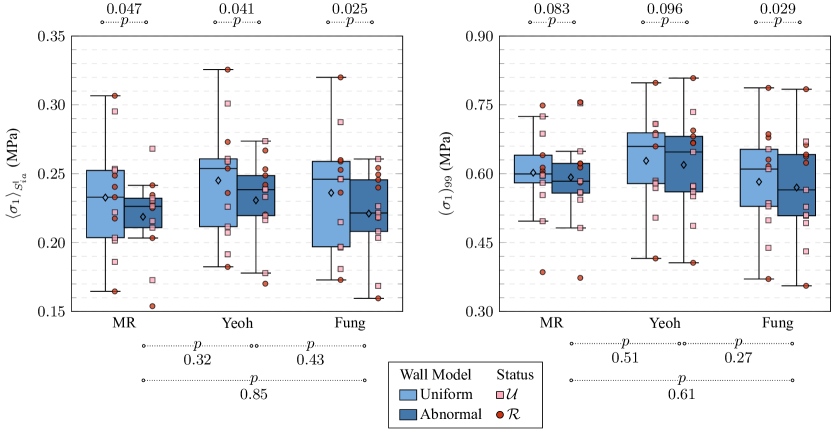
These two IAcases were chosen as representative examples because they yielded the largest absolute difference in the groups and , respectively. Nevertheless, the patterns indicated by them seem to be examples of larger trends. By comparing the sample’s distributions for the three hyperelastic laws (see Fig. 7), ’s metrics did not reach statistical significance ( and , with the uniform-wall modeland abnormal-wall model, respectively, for ; similar values were found for ). Furthermore, a posthoc analysis using the t-test in a pair-wise manner yielded that the three distributions are not significantly different (p-values depicted in Fig. 7 with the symbol “ ”, for the abnormal-wall modelonly; similar p-values were found with the uniform-wall model).
The opposite was the case for the distribution of ’s (Fig. 8), in which case the three distributions were significantly different ( with the uniform-wall modeland with the abnormal-wall modelfor , with similar values found for ). Nevertheless, a posthoc analysis, using Dunn’s test, indicated that only the differences between the pairs (MR, Yeoh) and (MR, Fung) were indeed significant (see p-values below the plots in Fig. 8).
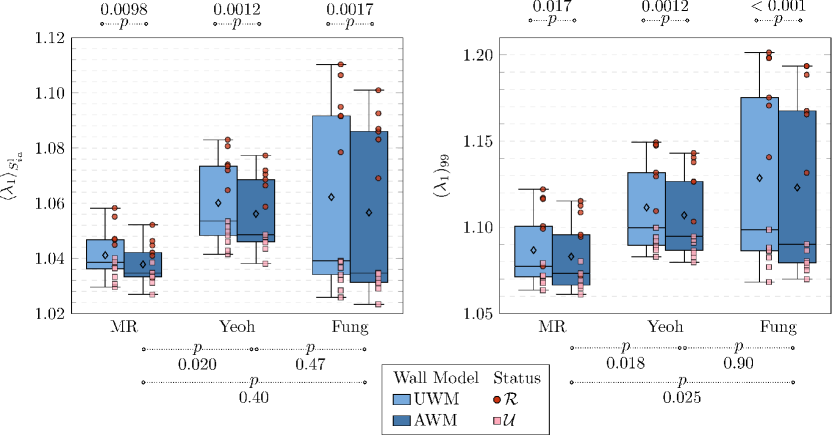
Furthermore, the different behavior of between the ruptured and unruptured cases evidenced above is part of a trend by noting a visible and consistent “separation” of levels according to rupture status (see the data points in Fig. 8), independently of hyperelastic law or morphology model. That gap is the largest for the isotropic Fung law, explaining the large dispersion of the distributions of ’s metrics, although the same can also be perceived with the Yeoh and MRmodels, to a smaller extent. This particular feature did not occur for ’s metrics — note that they spread over a range between, approximately, to but are not visibly segregated by rupture status (see the data points in Fig. 7).
By comparing the distributions between the uniform-wall modeland abnormal-wall model, they reached statistical significance for both metrics, irrespective of the hyperelastic law (see the p-values above the plots of Fig. 8). The same did not occur for the , for which statistical significance was only reached by ’s distributions with all laws, whereas the distribution of was only reached for the Fung law.
The absolute differences between the means of and were larger when the hyperelastic laws were compared than when comparing the wall morphology models (Table 2), especially on the luminal surface and irrespective of the morphology model, confirming that the mechanical response is more sensitive to the choice of hyperelastic law. More specifically, it is possible to note that the influence of the hyperelastic laws is more drastic for and depends on the rupture status — note how the mean absolute difference is larger for the ruptured group than the unruptured one in Table 2. Finally, as verified above, that difference for reached statistical significance, whereas it did not with .
| Side | Field Metric, | ||||||||||
|---|---|---|---|---|---|---|---|---|---|---|---|
| Abnormal | Uniform | MR | Yeoh | Fung | |||||||
| () | |||||||||||
| () | |||||||||||
| () | |||||||||||
| () | |||||||||||
| () | |||||||||||
| () | |||||||||||
| () | |||||||||||
| () | |||||||||||
It is important to note that similar plots of Figs. 7 and 8 were inspected for the metrics calculated on the abluminal surface and the same trends were found (as also indicated by Table 2). This suggests that the trends reported here occur on the whole wall of the IA.
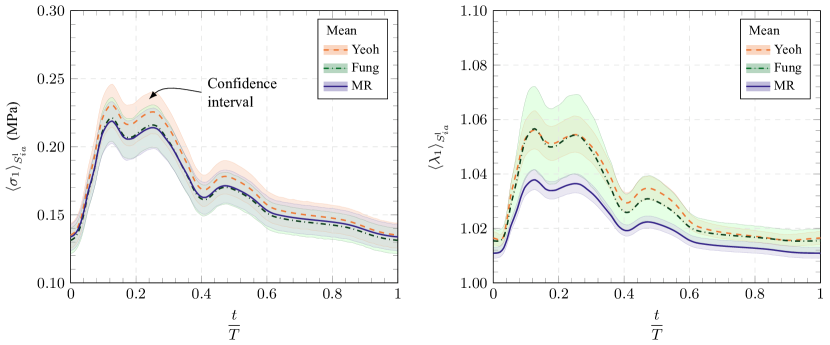
Finally, it is important to note that we performed the same analysis presented above for the and fields but taken at the instant of low diastole, (see Fig. 2a), and in general the same trends still hold for the . Regarding ’s metrics, the same trends above hold too, although the values of the absolute differences between the models tend to decrease uniformly. These trends can be perceived by inspecting and along a cardiac cycle in Fig. 9, where it is clear that the largest differences among the models occur near the peak-systole and any difference tends to decrease after the systolic period towards the diastolic period. The large differences among the hyperelastic laws during the systole probably occur as a manifestation of the nonlinearities of the modeling depending on the level of forces driving the motion, which are higher during the systole.
4 Discussion
The use of numerical simulations to study IAshas increased substantially in the last two decades, although the majority of the works were focused on the hemodynamics inside the IA[4], thus primarily using CFDas their main computational tool. Investigations on the hemodynamics were helpful to a more complete understanding of the role played by the blood flow in an IA’s natural history [67]. Nevertheless, investigations on the mechanical response of IAgeometries under physiologically realistic conditions, which seems to account for a small percentage of all the works on the subject, are of foremost importance and can be helpful to further understand both their mechanics and, more importantly, the rupture event, which is ultimately a phenomenon occurring in the wall tissue. As argued in the introduction of this work, the lack of that kind of study is understandable due to the complex modeling requirements to realistically represent a patient-specific IAwall tissue. In this regard, to the authors’ knowledge, our study is the first attempt to thoroughly assess the impact of both hyperelastic laws and wall morphology models — i.e. thickness and material constants — on the mechanical response of IAswith a relatively large population’s sample.
We employed a realistic modeling of the wall morphology — what we named the “abnormal-wall model” — and the technique to create it allows for patient-specific prediction of the wall morphology based on the underlying hemodynamics. Nonetheless, our results suggest that the abnormal-wall modelpredicts a similar mechanical response to a model where the aneurysm wall has uniform thickness and material constants, the uniform-wall model— a common alternative used in previous works when patient-specific data is missing, for example —, with absolute differences smaller than when different hyperelastic laws were compared and consistent for the whole cardiac cycle. These findings indicate that the uniform-wall modelmay be used to find the mechanical response in populational studies of IAs. Care must be taken, though, depending on the particular application of the numerical results because Cebral et al. [68], for example, using similar modeling to the abnormal-wall modelto investigate the rupture site of IAs, found that a wall with both uniform thickness and stiffness was not able to predict the rupture point specifically, compared to models with focal properties changes.
Furthermore, according to our results, when numerically simulating the geometry of an IA, the mechanical response in terms of the stretches, , was more sensitive to the constitutive law chosen and, additionally, yielded clear differences between ruptured and unruptured IAs. In that regard, the comparative behavior among each law is most likely to be related to their response given the stiffer material properties of the unruptured group. Therefore, as stiffer an IAtissue is, all laws tend to yield the same, or at least similar, mechanical response, in terms of stresses, whereas as less stiff it is, i.e. closer to a ruptured condition, the MRdeviates from both Yeoh and Fung results.
We found few studies that investigated the impact of different modeling choices on the mechanical response of IAs. Torii et al. [28] assessed the impact of different materials laws mainly on the hemodynamics, using a single IAgeometry, thus limiting the possibility of comparison with our results (regarding the wall motion the authors only reported the maximum displacement on the IAsac and only used one law that we also employed, the Fung law). Ramachandran et al. [38] also directly compared different material laws in patient-specific IAgeometries, although they assumed static BCsand simulated only the IAsac, i.e. without the branches walls. They employed anisotropic and isotropic versions of the Fung law, the Yeoh law, and both small and finite strain versions of Hooke’s law. Although the material constants they have employed were different, their conclusions broadly agree with the findings in this work, i.e. that the material laws predicted similar responses in terms of the wall stresses. Although, it is important to note that their study did not use the MRlaw, the one that presented the most divergent response compared to the Yeoh and Fung responses. The authors recognized, though, that their results could not hold as more patient-specific modeling features were added to the whole IAwall model in populational studies by avoiding the “uniform modeling choices applied across the patient population”. The comparison performed here between the uniform-wall modeland abnormal-wall modelsuitably addresses their concerns by showing that the absolute differences between a uniform wall IAand a realistic one, in terms of their mechanical response as given by and , are smaller than when comparing different material laws.
From a practical perspective, by assessing the impact of different materials laws and morphology models, suitable modeling can be chosen depending on the particular goals of the simulations. In large cohort studies, for example, simpler models could be used to assess average quantities over the IAssacs, while keeping the computational times low — for example, the Yeoh law yielded the fastest results while the uniform-wall modeland abnormal-wall modelyielded similar computational times.
Limitations
There exist some controversy on the BCsapplied on the artificial sections of the vascular branches because it is difficult to predict which numerical BCcan be realistically applied in there. The majority of works we found that have simulated CSDor FSIin vascular geometries commonly employed zero-displacements too [11, 53], although a few [10] applied a BCthat allows the arterial branch to slide along the section’s tangential direction, but constrains the displacement along with its normal — hence a “zero-shear traction” BC. We performed a numerical study comparing both and found that, although the displacement field was affected by different BCs, both and were unaltered on the aneurysm sacs, with qualitative differences on these fields only near the locations of the sections, as expected. Furthermore, we found that the sections should be made at least two local diameters away from the IAsneck lines to safely assume that the zero-displacement BCwould not influence the stress and stretch distribution on the IA. For all the geometries used here, this length was assured for all the branches, including the parent artery.
Additionally, it is important to note that we only employed isotropic laws, despite the tissue of arteries and IAsbeing anisotropic, based on evidence that anisotropic laws yield similar mechanical responses compared to their isotropic versions [38], although it is important to further confirm that in larger studies.
The values by which thickness and material constants were altered in the assumptions made for the abnormal-wall model(see Fig. 3) were somewhat arbitrary, even if based on scarce data available in the literature on this subject. For example, we could not find quantitative data on how much thinner the type-I patches are compared to normal walls. In atherosclerotic walls, hence type-II patches, data gathered by Holzapfel and Ogden [69], based on earlier studies, show that arteries with atherosclerotic plaques can be up to times thicker than when they are healthy. Similarly, their elastic modulus can be 4 times larger in the later stages of plaque development and in the presence of calcification, but much smaller than times in earlier stages. Due to this lack of data, the factors that correctly represented the histological observations for each patch were selected and used consistently among all geometries. Nevertheless, we carried out a parametric study by incrementally changing these scale factors of thickness and material constants separately on type-I and type-II patches (see supplementary material). By then computing and , we found a mean maximum absolute difference of and , respectively, computed between the extremes of the parametric intervals, when the thickness of type-II patches was varied — all the other yield smaller differences. Most importantly, the variation induced by focal changes in thickness and material constants were consistent among all IAs, as expected, therefore our main conclusions would likely withstand if other scale factors were chosen.
Finally, a further limitation was due to the use of the 1WFSInumerical strategy that ignores the two-way coupling between the fluid and solid domains. Nevertheless, given the comparative nature of this work, it is sufficient to set a baseline modeling for all cases simulated, in such a way that a “full” two-way fluid-solid interactionmodeling would alter the and consistently and, thus not altering our main conclusions.
5 Conclusions
The challenges involved in the experimental acquisition of mechanical properties of patient-specific IAsprevent the use of better modeling to study this disease, especially if numerical simulations are to be used to help in this endeavor. This scenario is particularly pressing because a better understanding of the rupture, and eventual prediction of it, passes through the capacity to compute the mechanical response of an IAwall. In this scenario, this study help to assess the likely impact of certain modeling choices on the mechanical response of IAs.
We found that different wall morphology models — i.e. different thickness and material properties — yield smaller absolute differences than when comparing different constitutive laws, in terms of both stress and stretches of the mechanical response. Furthermore, different hyperelastic laws produced significantly different stretch fields, explained by the likely higher sensitivity of stretch to the material constants of the law, indicating that ruptured aneurysms had much larger stretches than unruptured ones. The same behavior was not encountered for the stress fields in the IAsac. These findings may help future studies to choose more suitable modeling to investigate other aspects of the mechanical response of IAs.
6 Acknowledgements
This research was supported by grants 2017/18514-1 and 2019/19098-7 of the São Paulo Research Foundation (FAPESP)(the funder had no involvment in any step of the production of this manuscript). It was also supported by resources supplied by the Center for Scientific Computing (NCC/GridUNESP) of the UNESP(www2.unesp.br/portal#!/gridunesp), by ACENET (www.ace-net.ca) through Dalhousie University and Compute Canada (www.computecanada.ca).
References
- Diagbouga et al. [2018] M. R. Diagbouga, S. Morel, P. Bijlenga, B. R. Kwak, Role of Hemodynamics in Initiation/Growth of Intracranial Aneurysms, European Journal of Clinical Investigation 48 (2018) 1–12, doi:10.1111/eci.12992.
- The International Study of Unruptured Intracranial Aneurysms Investigators [1998] The International Study of Unruptured Intracranial Aneurysms Investigators, Unruptured Intracranial Aneurysms - Risk of Rupture and Risks of Surgical Intervention, The New England Journal of Medicine 339 (24) (1998) 1725–1733.
- Vlak et al. [2013] M. H. M. Vlak, G. J. E. Rinkel, P. Greebe, A. Algra, Risk of Rupture of an Intracranial Aneurysm Based on Patient Characteristics: A Case-Control Study, Stroke 44 (5) (2013) 1256–1259, ISSN 00392499, doi:10.1161/STROKEAHA.111.000679.
- Saqr et al. [2019] K. M. Saqr, S. Rashad, S. Tupin, K. Niizuma, T. Hassan, T. Tominaga, M. Ohta, What Does Computational Fluid Dynamics Tell Us about Intracranial Aneurysms? A Meta-Analysis and Critical Review, Journal of Cerebral Blood Flow and Metabolism 0 (0) (2019) 1–19, doi:10.1177/0271678X19854640.
- Meng et al. [2007] H. Meng, Z. Wang, Y. Hoi, L. Gao, E. Metaxa, D. D. Swartz, J. Kolega, D. D. Swartz, J. Kolega, Complex Hemodynamics at the Apex of an Arterial Bifurcation Induces Vascular Remodeling Resembling Cerebral Aneurysm Initiation, Stroke 38 (2007) 1924–1931, doi:10.1161/STROKEAHA.106.481234.
- Metaxa et al. [2010] E. Metaxa, M. Tremmel, S. K. Natarajan, J. Xiang, R. A. Paluch, M. Mandelbaum, A. H. Siddiqui, J. Kolega, J. Mocco, H. Meng, Characterization of Critical Hemodynamics Contributing to Aneurysmal Remodeling at the Basilar Terminus in a Rabbit Model, Stroke 41 (8) (2010) 1774–1782, ISSN 00392499, doi:10.1161/STROKEAHA.110.585992.
- Liang et al. [2019] L. Liang, D. A. Steinman, O. Brina, C. Chnafa, N. M. Cancelliere, V. M. Pereira, Towards the Clinical Utility of CFD for Assessment of Intracranial Aneurysm Rupture - A Systematic Review and Novel Parameter-Ranking Tool, Journal of NeuroInterventional Surgery 11 (2019) 153–158, ISSN 17598486, doi:10.1136/neurintsurg-2018-014246.
- Kallmes [2012] D. F. Kallmes, Point: CFD—Computational Fluid Dynamics or Confounding Factor Dissemination, American Journal of Neuroradiology 33 (2012) 393–398, doi:10.3174/ajnr.A2993.
- Cebral and Meng [2012] J. R. Cebral, H. Meng, Counterpoint: Realizing the Clinical Utility of Computational Fluid Dynamics—Closing the Gap, doi:10.3174/ajnr.a2993, 2012.
- Bazilevs et al. [2010a] Y. Bazilevs, M. C. Hsu, Y. Zhang, W. Wang, T. Kvamsdal, S. Hentschel, J. G. Isaksen, Computational Vascular Fluid-Structure Interaction: Methodology and Application to Cerebral Aneurysms, Biomechanics and Modeling in Mechanobiology 9 (2010a) 481–498, ISSN 16177959, doi:10.1007/s10237-010-0189-7.
- Lee et al. [2013a] C. J. Lee, Y. Zhang, H. Takao, Y. Murayama, Y. Qian, The Influence of Elastic Upstream Artery Length on Fluid-Structure Interaction Modeling: A Comparative Study Using Patient-Specific Cerebral Aneurysm, Medical Engineering and Physics 35 (9) (2013a) 1377–1384, ISSN 13504533, doi:10.1016/j.medengphy.2013.03.009.
- Causin et al. [2005] P. Causin, J. F. Gerbeau, F. Nobile, Added-Mass Effect in the Design of Partitioned Algorithms for Fluid-Structure Problems, Computational Methods in Applied Mechanical Engineering 194 (42-44) (2005) 4506–4527, ISSN 00457825, doi:10.1016/j.cma.2004.12.005.
- Förster et al. [2007] C. Förster, W. A. Wall, E. Ramm, Artificial Added Mass Instabilities in Sequential Staggered Coupling of Nonlinear Structures and Incompressible Viscous Flows, Computer Methods in Applied Mechanics and Engineering 196 (7) (2007) 1278–1293, ISSN 00457825, doi:10.1016/j.cma.2006.09.002.
- Kadasi et al. [2013] L. M. Kadasi, W. C. Dent, A. M. Malek, Colocalization of Thin-Walled Dome Regions with Low Hemodynamic Wall Shear Stress in Unruptured Cerebral Aneurysms, Journal of Neurosurgery 119 (1) (2013) 172–179, ISSN 0022-3085, doi:10.3171/2013.2.jns12968.
- Signorelli et al. [2018] F. Signorelli, C. Pailler-Mattei, B. Gory, P. Larquet, P. Robinson, R. Vargiolu, H. Zahouani, P.-E. Labeyrie, J. Guyotat, I. Pelissou-Guyotat, J. Berthiller, F. Turjman, Biomechanical Characterization of Intracranial Aneurysm Wall: A Multiscale Study, World Neurosurgery 119 (2018) e882–e889, ISSN 18788750, doi:10.1016/j.wneu.2018.07.290.
- Frösen et al. [2019] J. Frösen, J. Cebral, A. M. Robertson, T. Aoki, Flow-Induced, Inflammation-Mediated Arterial Wall Remodeling in the Formation and Progression of Intracranial Aneurysms, Neurosurgical Focus 47 (1) (2019) E21, ISSN 1092-0684, doi:10.3171/2019.5.FOCUS19234.
- Soldozy et al. [2019] S. Soldozy, P. Norat, M. Elsarrag, A. Chatrath, J. S. Costello, J. D. Sokolowski, P. Tvrdik, M. Y. S. Kalani, M. S. Park, The Biophysical Role of Hemodynamics in the Pathogenesis of Cerebral Aneurysm Formation and Rupture, Neurosurgical Focus 47 (1) (2019) 1–9, doi:10.3171/2019.4.focus19232.
- Meng et al. [2014] H. Meng, V. M. Tutino, J. Xiang, A. Siddiqui, High WSS or Low WSS? Complex Interactions of Hemodynamics with Intracranial Aneurysm Initiation, Growth, and Rupture: Toward a Unifying Hypothesis, American Journal of Neuroradiology 35 (7) (2014) 1254–1262, ISSN 1936959X, doi:10.3174/ajnr.A3558.
- Humphrey and Canham [2000] J. D. Humphrey, P. B. Canham, Structure, Mechanical Properties, and Mechanics of Intracranial Saccular Aneurysms, Journal of Elasticity 61 (2000) 49–81.
- Parshin et al. [2019] D. V. Parshin, A. I. Lipovka, A. S. Yunoshev, K. S. Ovsyannikov, A. V. Dubovoy, A. P. Chupakhin, On the Optimal Choice of a Hyperelastic Model of Ruptured and Unruptured Cerebral Aneurysm, Scientific Reports 9 (1) (2019) 15865, ISSN 2045-2322, doi:10.1038/s41598-019-52229-y.
- Holzapfel et al. [2010] G. A. Holzapfel, R. W. Ogden, B. Y. G. E. A. H. Olzapfel, Constitutive Modelling of Arteries, Proceedings of the Royal Society A: Mathematical, Physical and Engineering Sciences 466 (2118) (2010) 1551–1597, ISSN 1364-5021, doi:10.1098/rspa.2010.0058.
- Costalat et al. [2011] V. Costalat, M. Sanchez, D. Ambard, L. Thines, N. Lonjon, F. Nicoud, H. Brunel, J. P. Lejeune, H. Dufour, P. Bouillot, J. P. Lhaldky, K. Kouri, F. Segnarbieux, C. A. Maurage, K. Lobotesis, M. C. Villa-Uriol, C. Zhang, A. F. Frangi, G. Mercier, A. Bonafé, L. Sarry, F. Jourdan, Biomechanical Wall Properties of Human Intracranial Aneurysms Resected Following Surgical Clipping (IRRAs Project), Journal of Biomechanics 44 (15) (2011) 2685–2691, doi:10.1016/j.jbiomech.2011.07.026.
- Brunel et al. [2018] H. Brunel, D. Ambard, H. Dufour, P. Roche, V. Costalat, F. Jourdan, Rupture Limit Evaluation of Human Cerebral Aneurysms Wall: Experimental Study, Journal of Biomechanics 77 (2018) 76–82, ISSN 00219290, doi:10.1016/j.jbiomech.2018.06.016.
- Robertson et al. [2015] A. M. Robertson, X. Duan, K. M. Aziz, M. R. Hill, S. C. Watkins, J. R. Cebral, Diversity in the Strength and Structure of Unruptured Cerebral Aneurysms, Annals of Biomedical Engineering 43 (7) (2015) 1502–1515, doi:10.1007/s10439-015-1252-4.
- Kleinloog et al. [2014] R. Kleinloog, E. Korkmaz, J. J. M. Zwanenburg, H. J. Kuijf, F. Visser, R. Blankena, J. A. Post, Y. M. Ruigrok, P. R. Luijten, L. Regli, G. J. E. Rinkel, B. H. Verweij, Visualization of the Aneurysm Wall: A 7.0-Tesla Magnetic Resonance Imaging Study, Neurosurgery 75 (December) (2014) 614–622, doi:10.1227/NEU.0000000000000559.
- Cebral et al. [2019] J. R. Cebral, F. Detmer, B. J. Chung, J. Choque-Velasquez, B. Rezai, H. Lehto, R. Tulamo, J. Hernesniemi, M. Niemela, A. Yu, R. Williamson, K. Aziz, S. Sakur, S. Amin-Hanjani, F. Charbel, Y. Tobe, A. Robertson, J. Frösen, Local Hemodynamic Conditions Associated with Focal Changes in the Intracranial Aneurysm Wall, American Journal of Neuroradiology 40 (3) (2019) 510–516, ISSN 1936959X, doi:10.3174/ajnr.A5970.
- Torii et al. [2007] R. Torii, M. Oshima, T. Kobayashi, K. Takagi, T. E. Tezduyar, Influence of Wall Elasticity in Patient-Specific Hemodynamic Simulations, Computers and Fluids 36 (2007) 160–168, ISSN 00457930, doi:10.1016/j.compfluid.2005.07.014.
- Torii et al. [2008] R. Torii, M. Oshima, T. Kobayashi, K. Takagi, T. E. Tezduyar, Fluid-Structure Interaction Modeling of a Patient-Specific Cerebral Aneurysm: Influence of Structural Modeling, Computational Mechanics 43 (2008) 151–159, ISSN 01787675, doi:10.1007/s00466-008-0325-8.
- Lee et al. [2013b] C. J. Lee, Y. Zhang, H. Takao, Y. Murayama, Y. Qian, A Fluid-Structure Interaction Study Using Patient-Specific Ruptured and Unruptured Aneurysm: The Effect of Aneurysm Morphology, Hypertension and Elasticity, Journal of Biomechanics 46 (14) (2013b) 2402–2410, ISSN 00219290, doi:10.1016/j.jbiomech.2013.07.016.
- Valencia et al. [2009] A. Valencia, F. Muñoz, S. Arayaa, R. Rivera, E. Bravo, Comparison between Computational Fluid Dynamics, Fluid-Structure Interaction and Computational Structural Dynamics Predictions of Flow-Induced Wall Mechanics in an Anatomically Realistic Cerebral Aneurysm Model, International Journal of Computational Fluid Dynamics 23 (9) (2009) 649–666, ISSN 10618562, doi:10.1080/10618560903476386.
- Sanchez et al. [2013] M. Sanchez, D. Ambard, V. Costalat, S. Mendez, F. Jourdan, F. Nicoud, Biomechanical Assessment of the Individual Risk of Rupture of Cerebral Aneurysms: A Proof of Concept, Annals of Biomedical Engineering 41 (1) (2013) 28–40, ISSN 00906964, doi:10.1007/s10439-012-0632-2.
- Voß et al. [2016] S. Voß, S. Glaßer, T. Hoffmann, O. Beuing, S. Weigand, K. Jachau, B. Preim, D. Thévenin, G. Janiga, P. Berg, Fluid-Structure Simulations of a Ruptured Intracranial Aneurysm: Constant versus Patient-Specific Wall Thickness, Computational and Mathematical Methods in Medicine 2016, doi:10.1155/2016/9854539.
- Torii et al. [2006] R. Torii, M. Oshima, T. Kobayashi, K. Takagi, T. E. Tezduyar, Fluid-Structure Interaction Modeling of Aneurysmal Conditions with High and Normal Blood Pressures, Computational Mechanics 38 (2006) 482–490, ISSN 01787675, doi:10.1007/s00466-006-0065-6.
- Cho et al. [2020] K.-C. Cho, H. Yang, J.-J. Kim, J. H. Oh, Y. B. Kim, Prediction of Rupture Risk in Cerebral Aneurysms by Comparing Clinical Cases with Fluid–Structure Interaction Analyses, Scientific Reports 10 (1) (2020) 18237, ISSN 2045-2322, doi:10.1038/s41598-020-75362-5.
- Bazilevs et al. [2010b] Y. Bazilevs, M. C. Hsu, Y. Zhang, W. Wang, X. Liang, T. Kvamsdal, R. Brekken, J. G. Isaksen, A Fully-Coupled Fluid-Structure Interaction Simulation of Cerebral Aneurysms, Computational Mechanics 46 (2010b) 3–16, ISSN 01787675, doi:10.1007/s00466-009-0421-4.
- Sanchez et al. [2014] M. Sanchez, O. Ecker, D. Ambard, F. Jourdan, F. Nicoud, S. Mendez, J. P. Lejeune, L. Thines, H. Dufour, H. Brunel, P. Machi, K. Lobotesis, A. Bonafe, V. Costalat, Intracranial Aneurysmal Pulsatility as a New Individual Criterion for Rupture Risk Evaluation: Biomechanical and Numeric Approach (IRRAs Project), American Journal of Neuroradiology 35 (2014) 1765–1771, doi:10.3174/ajnr.A3949.
- Demiray [1972] H. Demiray, A Note on the Elasticity of Soft Biological Tissues, Journal of Biomechanics 5 (1972) 309–311, doi:10.1016/0021-9290(72)90047-4.
- Ramachandran et al. [2012] M. Ramachandran, A. Laakso, R. E. Harbaugh, M. L. Raghavan, On the Role of Modeling Choices in Estimation of Cerebral Aneurysm Wall Tension, Journal of Biomechanics 45 (16) (2012) 2914–2919, ISSN 00219290, doi:10.1016/j.jbiomech.2012.07.029.
- T. Passerini, M. Piccinelli, A. Veneziani and L. Antiga [2021] T. Passerini, M. Piccinelli, A. Veneziani and L. Antiga, aneurisk, http://ecm2.mathcs.emory.edu/aneuriskweb/index, 2021.
- VMTK [2017] VMTK, VMTK Website, http://www.vmtk.org/, [Accessed 19-June-2017], 2017.
- Piccinelli et al. [2009] M. Piccinelli, A. Veneziani, D. A. Steinman, A. Remuzzi, L. Antiga, A Framework for Geometric Analysis of Vascular Structures: Application to Cerebral Aneurysms, IEEE Transactions on Medical Imaging 28 (8) (2009) 1141–1155, doi:10.1109/TMI.2009.2021652.
- Antiga et al. [2002] L. Antiga, B. Ene-Iordache, L. Caverni, G. P. Cornalba, A. Remuzzi, Geometric Reconstruction for Computational Mesh Generation of Arterial Bifurcations from CT Angiography, Computerized Medical Imaging and Graphics 26 (2002) 227–235.
- Antiga et al. [2008] L. Antiga, M. Piccinelli, L. Botti, B. Ene-Iordache, A. Remuzzi, D. A. Steinman, An Image-Based Modeling Framework for Patient-Specific Computational Hemodynamics, Medical and Biological Engineering and Computing 46 (2008) 1097–1112, doi:10.1007/s11517-008-0420-1.
- Kanyanta [2009] V. Kanyanta, Towards Early Diagnosis of Atherosclerosis: Accurate Prediction of Wall Shear Stress, Ph.D. thesis, 2009.
- Kanyanta et al. [2009] V. Kanyanta, A. Ivankovic, A. Karac, Validation of a Fluid-Structure Interaction Numerical Model for Predicting Flow Transients in Arteries, Journal of Biomechanics 42 (11) (2009) 1705–1712, ISSN 00219290, doi:10.1016/j.jbiomech.2009.04.023.
- Tandis and Ashrafizadeh [2019] E. Tandis, A. Ashrafizadeh, A Numerical Study on the Fluid Compressibility Effects in Strongly Coupled Fluid–Solid Interaction Problems, Engineering with Computers ISSN 14355663, doi:10.1007/s00366-019-00880-4.
- Mooney [1940] M. Mooney, A Theory of Large Elastic Deformation, Journal of Applied Physics 11 (153), doi:10.1063/1.1713863.
- Holzapfel et al. [2000] G. A. Holzapfel, T. C. Gasser, R. W. Ogden, A New Constitutive Framework for Arterial Wall Mechanics and a Comparative Study of Material Models, Journal of Elasticity 61 (1-3) (2000) 1–48, ISSN 03743535, doi:10.1023/A:1010835316564.
- Holzapfel [2000] G. A. Holzapfel, Nonlinear Solid Mechanics, John Wiley & Sons, Inc., Chichester, 2000.
- Hoi et al. [2010] Y. Hoi, B. A. Wasserman, Y. J. Xie, S. S. Najjar, L. Ferruci, E. G. Lakatta, G. Gerstenblith, D. A. Steinman, Characterization of Volumetric Flow Rate Waveforms at the Carotid Bifurcations of Older Adults, Physiological Measurement 31 (3) (2010) 291–302, ISSN 09673334, doi:10.1088/0967-3334/31/3/002.
- Zarrinkoob et al. [2015] L. Zarrinkoob, K. Ambarki, A. Wåhlin, R. Birgander, A. Eklund, J. Malm, Blood Flow Distribution in Cerebral Arteries, Journal of Cerebral Blood Flow and Metabolism 35 (2015) 648–654, ISSN 15597016, doi:10.1038/jcbfm.2014.241.
- Chnafa et al. [2018] X. C. Chnafa, X. O. Brina, V. M. Pereira, X. D. A. Steinman, Better Than Nothing: A Rational Approach for Minimizing the Impact of Outflow Strategy on Cerebrovascular Simulations, American Journal of Neuroradiology 39 (2018) 337–343, doi:10.3174/ajnr.A5484.
- Valencia et al. [2013] A. Valencia, P. Burdiles, M. Ignat, J. Mura, E. Bravo, R. Rivera, J. Sordo, Fluid Structural Analysis of Human Cerebral Aneurysm Using Their Own Wall Mechanical Properties, Computational and Mathematical Methods in Medicine 2013 (2013) 1–18, ISSN 1748670X, doi:10.1155/2013/293128.
- Fung [1993] Y.-C. Fung, Biomechanics - Mechanical Properties of Living Tissues, Springer New York, New York, NY, ISBN 978-1-4419-3104-7 978-1-4757-2257-4, doi:10.1007/978-1-4757-2257-4, 1993.
- Nakagawa et al. [2016] D. Nakagawa, M. Shojima, M. Yoshino, T. Kin, H. Imai, S. Nomura, T. Saito1, H. Nakatomi, H. Oyama1, N. Saito, Wall-to-lumen Ratio of Intracranial Arteries Measured by Indocyanine Green Angiography, Asian Journal of Neurosurgery 11 (2016) 361–364, doi:10.4103/1793-5482.175637.
- Torii et al. [2010] R. Torii, M. Oshima, T. Kobayashi, K. Takagi, T. E. Tezduyar, Influence of Wall Thickness on Fluid–Structure Interaction Computations of Cerebral Aneurysms, International Journal for Numerical Methods in Biomedical Engineering 26 (2010) 336–347, ISSN 20407939, doi:10.1002/cnm.
- Furukawa et al. [2018] K. Furukawa, F. Ishida, M. Tsuji, Y. Miura, T. Kishimoto, M. Shiba, H. Tanemura, Y. Umeda, T. Sano, R. Yasuda, S. Shimosaka, H. Suzuki, Hemodynamic Characteristics of Hyperplastic Remodeling Lesions in Cerebral Aneurysms, PLOS ONE 13 (2018) 1–11, ISSN 1932-6203, doi:10.1371/journal.pone.0191287.
- Oliveira et al. [2021] I. L. Oliveira, G. B. Santos, J. Militzer, C. E. Baccin, R. T. Tatit, J. L. Gasche, A Longitudinal Study of a Lateral Intracranial Aneurysm: Identifying the Hemodynamic Parameters behind Its Inception and Growth Using Computational Fluid Dynamics, Journal of the Brazilian Society of Mechanical Sciences and Engineering 43 (2021) 138, doi:10.1007/s40430-021-02836-6.
- Cardiff et al. [2018] P. Cardiff, A. Karač, P. De Jaeger, H. Jasak, J. Nagy, A. Ivanković, Ž. Tuković, An Open-Source Finite Volume Toolbox for Solid Mechanics and Fluid-Solid Interaction Simulations, Tech. Rep., 2018.
- foam-extend Project [2017] foam-extend Project, foam-extend Website, https://sourceforge.net/projects/foam-extend/, [Accessed 19-June-2017], 2017.
- Weller et al. [1998] H. G. Weller, G. Tabor, H. Jasak, C. Fureby, A Tensorial Approach to Computational Continuum Mechanics Using Object-Oriented Techniques, Computers in Physics 12 (1998) 620–631.
- Issa [1986] R. I. Issa, Solution of the Implicitly Discretised Fluid Flow Equations by Operator-Splitting, Journal of Computational Physics 62 (1) (1986) 40–65, ISSN 10902716, doi:10.1016/0021-9991(86)90099-9.
- Jasak [1996] H. Jasak, Error Analysis and Estimation for the Finite Volume Method with Applications to Fluid Flows, Ph.D. thesis, Imperial College, 1996.
- Wheel [1999] M. A. Wheel, A Mixed Finite Volume Formulation for Determining the Small Strain Deformation of Incompressible Materials, International Journal for Numerical Methods in Engineering 44 (1999) 1843–1861.
- NumPy [2017] NumPy, NumPy Website, https://numpy.org/, [Accessed 05-May-2022], 2017.
- SciPy [2017] SciPy, SciPy Website, https://www.scipy.org, [Accessed 05-May-2022], 2017.
- Castro [2013] M. A. Castro, Understanding the Role of Hemodynamics in the Initiation, Progression, Rupture, and Treatment Outcome of Cerebral Aneurysm from Medical Image-Based Computational Studies, ISRN Radiology (2013) 1–17doi:10.5402/2013/602707.
- Cebral et al. [2015] J. R. Cebral, M. Vazquez, D. M. Sforza, G. Houzeaux, S. Tateshima, E. Scrivano, C. Bleise, P. Lylyk, C. M. Putman, Analysis of Hemodynamics and Wall Mechanics at Sites of Cerebral Aneurysm Rupture, Journal of NeuroInterventional Surgery 7 (7), ISSN 1759-8478, doi:10.1136/neurintsurg-2014-011247.
- Holzapfel and Ogden [2003] G. A. Holzapfel, R. W. Ogden (Eds.), Biomechanics of Soft Tissue in Cardiovascular Systems, Springer Vienna, Vienna, ISBN 978-3-211-00455-5 978-3-7091-2736-0, doi:10.1007/978-3-7091-2736-0, 2003.
Supplementary Material
Influence of Local Thickness and Material Constants
Two parametric studies were carried out by changing the scale factors applied to build the abnormal-wall modelby scaling the thickness and material constants of type-I and type-II patches. A simpler modeling of the flow was applied, though, by using a steady-state blood flow model at peak-systole conditions as the driven force of the arterial and IAwall motion and numerically solving it with the 1WFSIstrategy with the same BCspresented in main study. Only the Yeoh hyperelastic law was used — it is reasonable to assume that the same behavior would be found for the MRand Fung laws —, with . The study was carried out in two stages: first, by varying , locally, and, in the sequence, changing the fields of the the material constants, and .
In the first stage, uniform elasticities over the aneurysm, and , were assumed to isolate the effect of the varying on each patch type, calculated as follows:
-
1.
on type-I patches, was first kept unchanged and then decreased by , , , and , while keeping the type-II patches thicker;
-
2.
on type-II patches, was first kept unchanged and then increased by , , , and , while keeping the type-I patches thinner.
The computational meshes were created similarly as in the main study, but, in this case, for each new thickness field, a new mesh was generated, whereas a single fluid computational mesh was used.
In the second stage, uniform was assumed over — thus, a single mesh was used — to isolate the effect of varying the material constants, and , which were both, first, kept uniform and, then, decreased by , , and , on type-I and type-II patches at the same time.
Note that the parametric intervals employed () included the actual values selected for the abnormal wall morphology model. The surface-averages of and were computed over at the deformed configuration. The results are shown in Fig. S1.
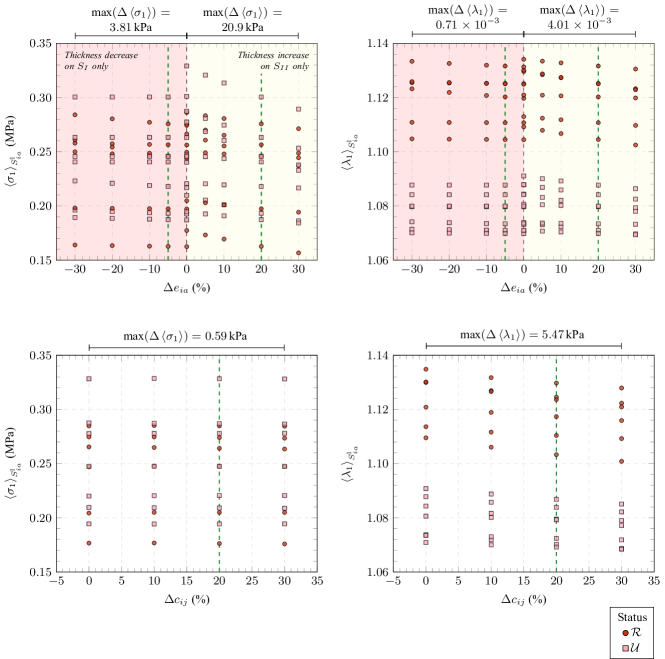
The plots show how and changed with both local changes in and . The absolute difference between the extremes of the parametric intervals was computed for each IAcase, and its average annotated above each plot.