Valence and magnetism in and
Abstract
151Eu Mössbauer spectroscopy shows that yttrium substitution in mixed-valent drives the initial 50:50 mix of Eu3+ and Eu2+ towards pure Eu2+, whereas lanthanum substitution has the opposite effect, but only for substitution levels above 50%. We find that total valence electron count and chemical pressure effects cannot account for the observed behaviour, however conserving the cell volume provides a consistent description of the changes in the Eu2+:Eu3+ ratio. Remarkably, lanthanum substitution also leads to a clear transition from static mixed-valent behavior at lower temperatures to dynamic mixed valent behavior at higher temperatures, with the onset temperature monotonically increasing with Eu content and extrapolating to a value of 340 K for the pure compound. Magnetic order persists at least as far as x=0.875 in both series, despite the drastic reduction in the amount of moment-carrying Eu2+ ions.
I Introduction
The rare earth palladium sulphides have been reported for the majority of the rare earths, including yttrium Keszler et al. (1985); Wakeshima et al. (1997); Wakeshima and Hinatsu (1999); Bonville et al. (2003). They all crystallise in the cubic structure ( #223) with the rare earth occupying the 2 site forming a bcc sublattice, the palladium on the 6 site and the sulphur on the 8 site. Remarkably, although the phases exist for the trivalent rare earths, but apparently not for the divalent alkaline earths (Ca and Sr), when prepared with europium Wakeshima et al. (2001) or ytterbium Bonville et al. (2003) a roughly 50:50 mix of divalent and trivalent rare earth is found.
Here we will use chemical substitution of yttrium and lanthanum for europium to investigate the stability of the valence distribution and its effects on magnetic ordering. Although both 170Yb and 151Eu Mössbauer spectroscopy can generally be used to identify the valence of their respective target ions, for 170Yb Mössbauer spectroscopy, the isomer shift between the two valence states is extremely small so the technique is almost totally dependent on the presence of an electric field gradient (efg) at the Yb3+ ions to identify trivalent ytterbium. Unfortunately the high symmetry of the 2 site makes the efg contribution effectively zero and the presence of the Yb3+ ions is only apparent in the magnetically ordered state well below T2 K Bonville et al. (2003). We will therefore only study using 151Eu Mössbauer spectroscopy where the two valence states are clearly isolated by a large difference in isomer shift, even at ambient temperatures.
We find that, by substituting Y for Eu, the remaining Eu sites become more and more divalent. In contrast, by substituting La for Eu we find that, initially, the remaining Eu sites stay roughly a 50:50 mixture of di- and tri-valent Eu, but for higher La substitution levels the remaining Eu rapidly becomes more trivalent. La substitution also leads to a transition from statically mixed valent behavior at lower temperatures to dynamically mixed valent behavior at higher temperatures with the onset temperature (Tonset) monotonically increasing with Eu content and passing through room temperature as pure is approached. Despite the decreasing fraction of moment-carrying Eu2+ ions, both and continue to exhibit some form of magnetic order at least as far as x=0.875, with transition temperatures of 3 K (Y) and 6 K (La).
II Experimental methods
Polycrystalline samples of and were prepared from stoichiometric mixtures of EuS (99.9% – American Elements) (99.9%), (99%), Pd (99.95%) and S (99.5%), all from Alfa-Aesar. The powders were mixed and then pressed to form a dense pellet. This was loaded into an alumina crucible and sealed under a partial pressure of helium in a fused silica tube. The sample was heated to 650∘C over three hours, held for an hour and then taken to 900∘C over a further three hours. After 75 hours at 900∘C the sample was furnace cooled and removed once it reached ambient temperature. In most cases this single thermal cycle was found to yield a single-phased product, however when an impurity was found (typically PdS seen by x-ray diffraction or EuS seen in susceptibility vs. temperature) the sample was crushed, pressed and subjected to a second 75 hr annealing cycle to 900∘C to remove the impurity.
X-ray diffraction measurements were made on a Rigaku Miniflex-II diffractometer using a Cu-Kα source. The instrument calibration was checked using NIST 676a and found to be consistent within fitted uncertainties. Full Rietveld refinement of the diffraction pattens was carried out using the GSAS/EXPGUI packages Larson and Von Dreele (2000); Toby (2001). As all three species occupy special sites in the structure, no positional parameters were adjusted during the fits. For the yttrium and lanthanum substituted samples only random occupation of the Eu(2) site was considered.
151Eu Mössbauer spectroscopy measurements were carried out using a 4 GBq 151SmF3 source, driven in sinusoidal mode. The drive motion was calibrated using a standard 57CoRh/-Fe foil. Isomer shifts are quoted relative to EuF3 at ambient temperature. The 21.6 keV gamma rays were recorded using a thin NaI scintillation detector. For temperatures above 5 K, the samples were cooled in a vibration-isolated closed-cycle helium refrigerator with the sample in a helium exchange gas. Temperatures below 5 K were achieved using a helium flow cryostat while pumping on the sample space and using a needle valve to throttle the flow. The spectra were fitted to a sum of Lorentzian lines with the positions and intensities derived from a full solution to the nuclear Hamiltonian Voyer and Ryan (2006).
Temperature- and magnetic field- dependent magnetization measurements (, ) were performed using a Quantum Design MPMS-3 SQUID magnetometer. The sample was confined in a #4 gelatin capsule and a transparent drinking straw was used as a sample holder. Low-temperature heat capacity measurements were made using semiadiabatic thermal relaxation technique as implemented in the heat capacity option of a Quantum Design Physical Property Measurement System (PPMS). For selected samples, the 3He option was used to cool to 0.4 K. Sintered samples of 20–70 mg mass with at least one flat surface were mounted on a micro-calorimeter platform using Apiezon N grease. The addenda (platform + grease) heat capacity was measured separately for each sample and subtracted from the total heat capacity using the PPMS software. Although the samples possibly had reduced density, the measured sample coupling parameter took reasonable values of more than 97%.
III Results
III.1
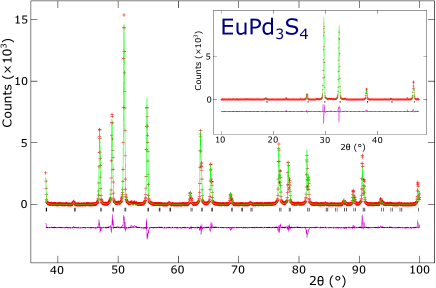
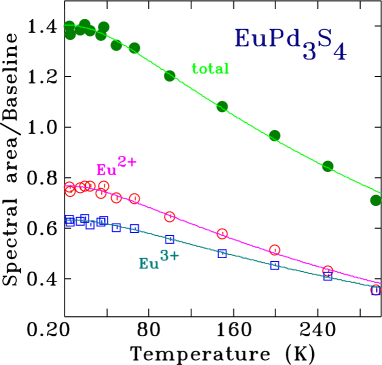
Fitting the x-ray diffraction pattern of the sample showed it to be single phased with the expected cubic structure Wakeshima et al. (1997) and a lattice parameter of Å (Fig. 1). The room temperature 151Eu Mössbauer spectrum showed two distinct contributions from Eu3+ and Eu2+ in the ratio 50.4(4):49.6(4), with the linewidth of the Eu2+ component being slightly broader, in complete agreement with previous reports Wakeshima et al. (2001). On cooling to 5 K the ratio becomes 46.2(5):53.8(5) (Fig. 2) as the Debye temperature of the Eu3+ component is slightly higher than that of the Eu2+ component. Fitting the temperature dependence of the two component areas to a simple Debye model, as shown in Fig. 3, yields Debye temperatures of 227(3) K (Eu3+) and 204(3) K (Eu2+). It is important to emphasise that any apparent changes in the Eu2+:Eu3+ ratio with temperature in Fig. 3 do not reflect actual changes in the ratio, rather they are the result of the different temperature dependences of the recoil-free-fractions (often denoted f) for the two species. In order to minimise the impacts of this effect, all valence ratios will be taken from low-temperature spectra.

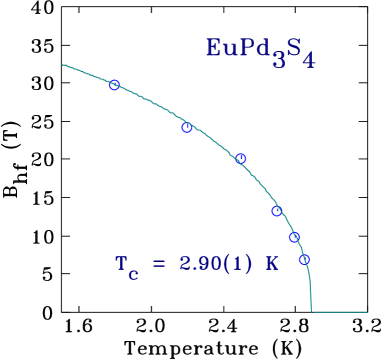
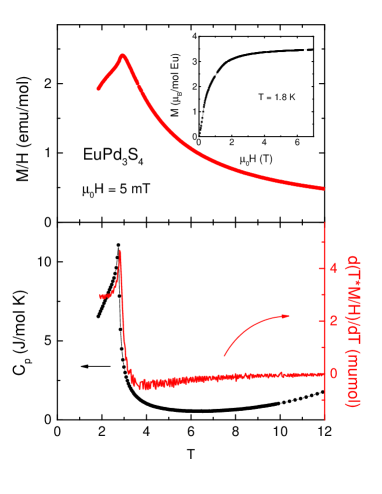
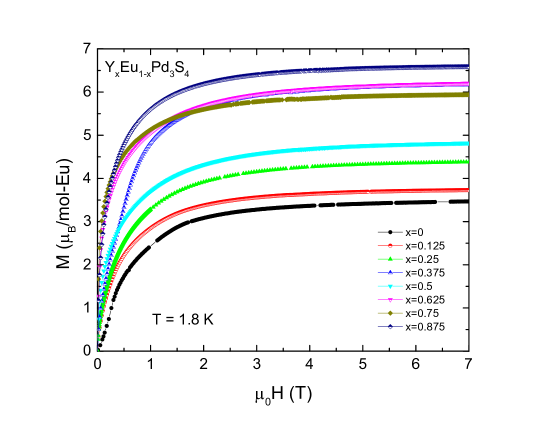
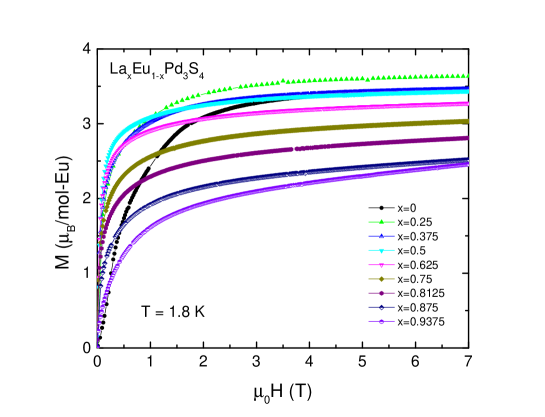
On cooling to 1.8 K, the Eu2+ component develops a clear magnetic splitting whereas the Eu3+ component is unchanged, consistent with trivalent europium being non-magnetic (Fig. 2). In principle one might anticipate a small transferred field at the Eu3+ sites from the ordered Eu2+ moments, however none was observed and no increase in the width of the Eu3+ component was detected (B1 T), perhaps as a result of cancellations arising from the antiferromagnetic ordering of the Eu2+ moments. The hyperfine field (Bhf) for the Eu2+ component at 1.8 K is 29.9(2) T, typical for ordered Eu2+, and fitting the temperature dependence shown in Fig. 4 to the expected Brillouin function yields a T=0 Bhf=37.9(6) T and an ordering temperature of TN=2.90(1) K in good agreement with both previous work Wakeshima et al. (2001) and our own susceptibility and Cp data (Fig. 5). The clear cusp in the susceptibility vs. temperature is consistent with antiferromagnetic (AF) ordering and it is accompanied by a sharp peak in the heat capacity. The high-field magnetisation curve taken at 1.8 K (inset to Fig. 5) shows that the system is readily saturated despite the AF order, consistent with the low ordering temperature as well as the low anisotropy typically associated with the Eu2+ ion. Furthermore, the maximum moment observed in the applied field of 7 T suggests a Eu2+ fraction of 50% (assuming a moment of 7 /Eu2+) consistent with the 53.8(5)% derived above from the 151Eu Mössbauer spectrum at 5 K, and with earlier results Abe et al. (1999); Wakeshima et al. (2001).
The unusual and apparently stable valence mix in leads to the question: “why?”. What makes europium (and ytterbium) “special”? How robust is the valence distribution? Can we change it?
As the Eu3+ ion is smaller than the Eu2+ ion, one might expect hydrostatic pressure to promote Eu2+ Eu3+ conversion. Alternatively, if we force some fraction of the R sites to be unambiguously trivalent, by replacing some of the europium with a formally trivalent ion, will this cause more of the remaining europium to become divalent to preserve the average electron count?
Although the driving that can be achieved by chemical substitution is not as clean as that generated by direct hydrostatic pressure, it is much easier to make direct measurements of the valence distribution, magnetisation and transition temperatures in doped samples at ambient pressures. We turn therefore to an investigation of the impacts of chemical substitution on using the non-moment bearing, trivalent La and Y ions with ) ) ) ). If, on the one hand, the total valence electron count is a dominant factor, then partially replacing the europium with an unambiguously trivalent ion should lead to a compensating increase in the Eu2+ fraction. On the other hand, if preserving the cell volume is critical, then the lattice expansion that would be caused by introducing the ) ) lanthanum ion could be compensated by some Eu2+ Eu3+ conversion (the reverse being expected for the ) ) yttrium ion). Alternatively, if the substitutions act as chemical pressures, then expanding the cell using lanthanum substitution should lead to Eu3+ Eu2+ conversion (again, the reverse process being expected for yttrium substitution). As we show below, we can clearly distinguish between these three options.
III.2 Valence impacts
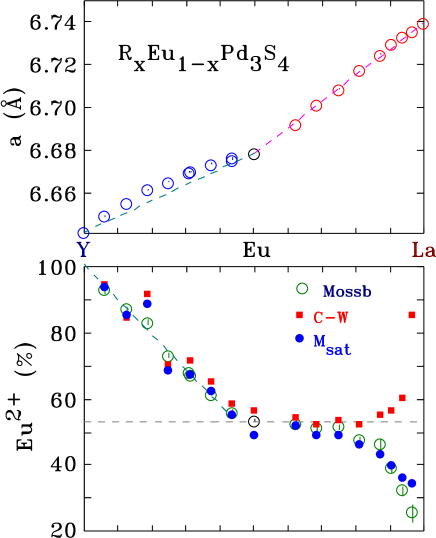
(bottom) The Eu2+ fractions in the pure and Y,La-substituted compounds showing that Y-substitution leads to a significant shift towards more Eu2+, while La-substitution initially appears to have no effect, but for there is a marked shift towards Eu3+. Open circles show values taken from 151Eu Mössbauer spectroscopy at 5 K(Y-substituted) or 10 K(La-substituted); solid symbols show values derived from bulk magnetisation data: high-temperature Curie-Weiss fits (red squares), saturation magnetisation (blue circles). The deviation of the Curie-Weiss values for the La-rich compounds reflects the development of dynamic effects discussed in the text.
Fitting the x-ray diffraction data for the yttrium and lanthanum substituted compounds showed that they all retained the expected structure but with progressively smaller (Y) or larger (La) lattice parameters (Fig. 6). There is a clear, and significant, change in lattice parameters for both Y and La substitution. We detect no indication of phase separation in the powder x-ray diffraction data, i.e. no broadening or splitting of peaks that would suggest segregation of the samples into Eu-richer and Eu-poorer phases.
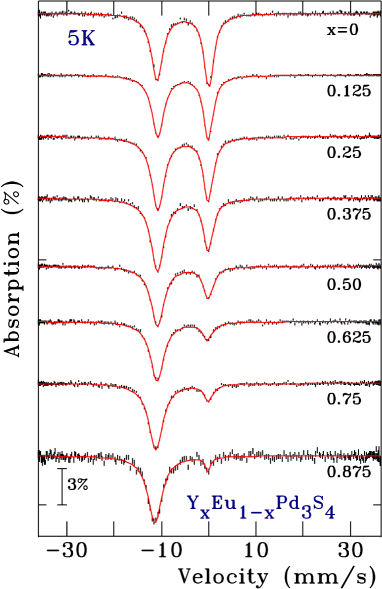
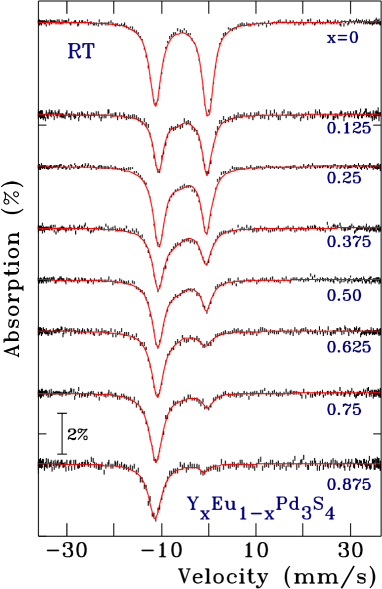
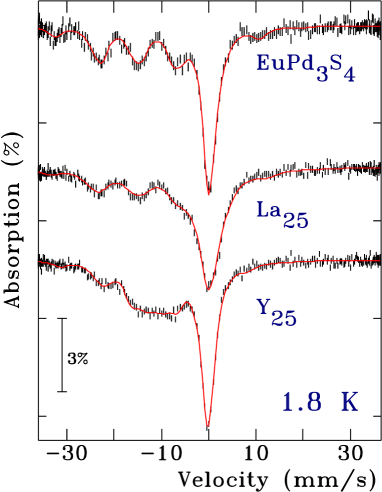
For the Y-substituted series, the fitted lattice parameters all lie visibly above the line connecting the Eu and Y compounds, suggesting that a shift towards more of the larger Eu2+ ion occurs, as the yttrium content is increased. This valence shift is confirmed directly by the 5 K 151Eu Mössbauer spectra shown in Fig. 7, where the line near 0 mm/s associated with the trivalent europium decreases rapidly in intensity as the level of yttrium substitution increases. (All valence ratios for the Y-substituted series were taken from 5 K spectra to minimise the impacts of f-factor differences for the two species, as noted above.) Both magnetisation measurements in the ordered state at 1.8 K (Fig. 8) and Curie-Weiss fits to the temperature dependence of the susceptibility above 10 K, further support these observations (see below). The Eu2+ fractions derived from all three measurements are summarised in the lower panel of Fig. 6.
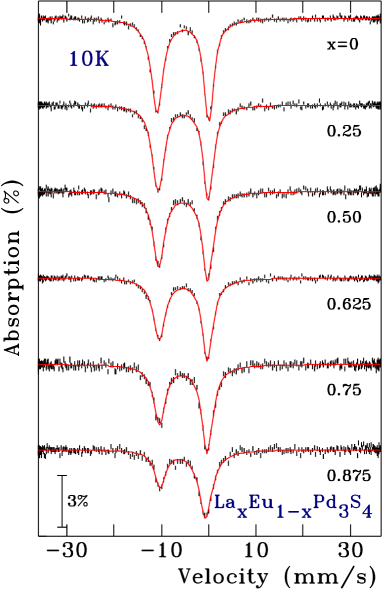
By contrast with the yttrium-substituted series, the effects of lanthanum substitution are more complex and nuanced. The lattice parameters of the La-substituted compounds lie much closer to the line connecting the two end members (upper panel of Fig. 6) for all substitution levels, and the Eu2+ fraction derived from 151Eu Mössbauer spectroscopy at 10 K (Fig. 9) is essentially constant (lower panel of Fig. 6) for x0.5. This is consistent with the fact that ) ) ) and initial La substitution does not force any significant change in the Eu2+:Eu3+ ratio. However, once about half of the europium has been replaced by lanthanum, further substitution leads to a marked change in behaviour, again consistent with the fact that ) is ultimately somewhat closer to ) rather than ). It is readily apparent from Fig. 9 that the line near 11 mm/s that corresponds to Eu2+ decreases in relative intensity and this rapid loss of the divalent fraction is confirmed by the magnetisation measurements shown in Fig. 10. We use 10 K Mössbauer data for the La-substituted series, rather than the 5 K data as was used for the Y-substituted series, to avoid complications due to the onset of magnetic ordering (see below).
Finally, as is clear in Fig. 6, the Eu2+ fraction derived from Curie-Weiss fits (data shown below) to the temperature dependence of the susceptibility, for with (measured on the same sample as part of the run used to obtain the saturation magnetisation) appears to show the opposite behaviour – a marked growth in the effective moment and hence the derived Eu2+ fraction. As we show below, this is most likely due to dynamic effects that lead to intermediate valence behaviour of the europium ions and makes a simple Curie-Weiss analysis intractable over the temperature range available to us.
III.3 Dynamics in the Yttrium and Lanthanum substituted series
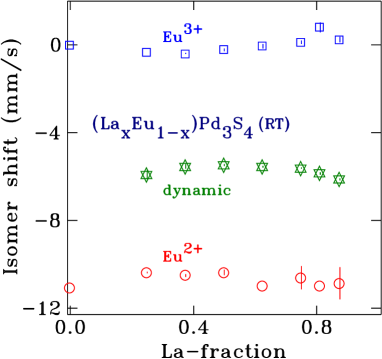
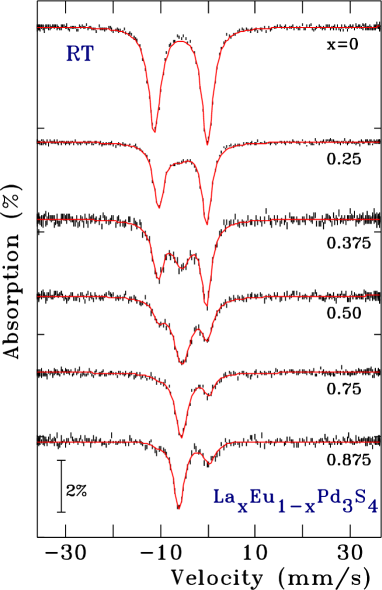
We have presented low-temperature Mössbauer data for the yttrium- (5 K) and lanthanum- (10 K) substituted series in order to minimise the impacts of the differing Debye temperatures of the two valence components in the spectra. Figures 11 and 12 present the room temperature Mössbauer spectra for the and series. As can be seen, the differences between the room temperature and 5 K yttrium data are minimal and certainly not qualitative. However, for the series, the changes in the spectra on warming go far beyond the simple, and expected, slight reduction in the apparent Eu2+ fraction with increasing temperature. As is clear from the RT spectra of shown in Fig. 12, an entirely new feature appears in the spectra and eventually dominates the pattern by x=0.875. This feature is a line located midway beween the lines associated with Eu2+ and Eu3+. As Fig. 13 shows, the position of this line is essentially composition independent, appearing for all compositions 0.25x1.00, and lying almost precisely midway between the Eu2+ and Eu3+ lines, leading us to identify it as being due to intermediate-valence europium: “Eu2.5+”. In many other intermediate-valence europium compounds such as Bauminger et al. (1973); Palenzona et al. (1986) and Abd-Elmeguid et al. (1985), where the electron exchange is between the europium and the conduction band, Röhler et al. (1982); Hossain et al. (2004) the isomer shift of the intermediate valence component is strongly temperature dependent Bauminger et al. (1973) as electrons initially associated with the Eu2+ ions spend more time in the conduction band so that the average europium valence (and hence isomer shift) changes. That is not the case here as the electron exchange is between Eu2+ and Eu3+ ions, and as long as the residence time on each ion is roughly the same, then the time-averaged valence is constant, even if the residence time (or equivalently, the hopping rate) changes.
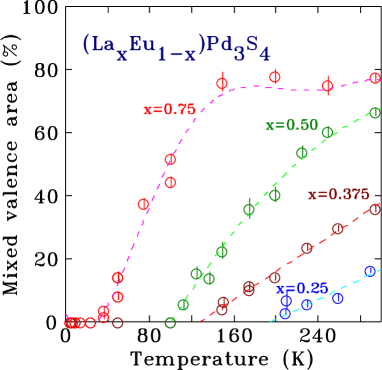
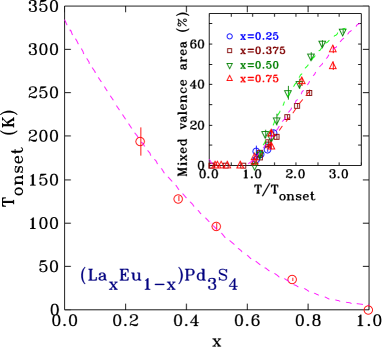
The area of the intermediate valence feature is strongly dependent on both temperature and composition (Fig. 14). At base temperature the area of the intermediate valence feature is zero, but as temperature increases beyond Tonset it starts to increase, with Tonset decreasing with increasing x, i.e. increasing with increasing Eu concentration. Fig 15 plots Tonset versus x; the extrapolation of the data to x=0, i.e. pure , suggests that Tonset should occur near T340 K. The inset to Fig 15 shows the intermediate valence area data presented in Fig. 14, plotted versus effective temperature, T/Tonset. The data scale well and this suggests that temperatures well above 340 K will need to be measures for pure in order to see the intermediate valence signal. The progressive decrease in Tonset apparent in Fig 15 for the La-substituted series suggests that lanthanum substitution reduces the barrier for electron hopping in .
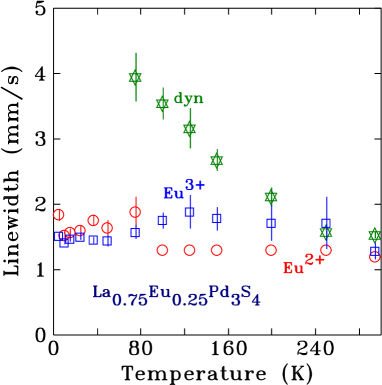
Finally, although the position of the Eu2.5+ line appears to be both composition and temperature independent, its width is not. As is clear from Fig. 16, the Eu2.5+ line becomes progressively sharper with increasing temperature while the widths of the Eu2+ and Eu3+ lines remain unchanged. This sharpening is characteristic of motional narrowing.
Thermally driven conversion of Eu2+ and Eu3+ to an average Eu2.5+ is consistent with rapid electron hopping between the two species. Clearly, the two valence states are equally stable in and in the absence of evidence for charge ordering, it would appear that the spatial distribution of the two species on the 2a site is essentially random. If a given site is randomly or , there would appear to be no reason to expect that selection to be time-independent, and given sufficient thermal energy an electron might be expected to jump from a Eu2+ site to a neighbouring Eu3+ site, exchanging the valence of the two sites in the process. If the residence time of the electron is much longer than the characteristic measuring time used to detect the valence (10–100 ns for Mössbauer spectroscopy) then the system appears static and two distinct valence states are seen. If the residence time is much shorter, then an averaged valence is seen. Intermediate residence times (“slow relaxation”) can lead to more complex behaviour in the spectrum, but in the current case where the two components are single lines with no significant quadrupole or magnetic splittings, slow relaxation simply leads to a broad dynamic component. Raising the temperature generally leads to faster hopping and a shorter residence time and the system evolves from fully static, through the slow relaxation regime, to dynamically averaged (or motionally narrowed). As can be seen for x=0.75 in Fig. 14, a weak broad line appears, it becomes stronger and sharper (Fig. 16) as more europium sites become dynamic and motional narrowing occurs, finally developing into a natural-width line as the hopping rate increases and moves up out of the Mössbauer window.
It is likely that the Eu2+/Eu3+ dynamics and the development of intermediate valence europium are the cause of the difference between the estimate of percentage of Eu2+ between the Mössbauer, M(H) and M(T) data for the lanthanum substituted samples shown in Fig. 6. The 151Eu Mössbauer and the saturation magnetisation measuerements were made at 10 K and 1.8 K respectively, well below Tonset, and the valence ratios derived from them are in agreement. However, the Curie-Weiss analysis relies on measurements made at much higher temperature ranges where the intermediate valence behaviour is both pronounced and temperature dependent. Indeed, as the intermediate valence fraction becomes larger (Fig. 14), the Curie-Weiss-derived Eu2+ fraction deviates more strongly from the Mössbauer and saturation magnetisation values (Fig. 6). A simple Curie-Weiss analysis of temperature-dependent susceptibility is not valid where the valence and hence europium moment is strongly temperature dependent.
Finally, we note that if the same intermediate valence behaviour is present in at RT it accounts for less than 10% of the total area (Fig. 11). The difference between the yttrium- and lanthanum- substituted series may reflect stabilisation of Eu2+ by yttrium substitution, but there is also a very rapid loss of Eu3+ as yttrium is added, so as we approach the substitution levels where the Eu2.5+ component dominated in , there is almost no Eu3+ left in to exchange electrons with the majority Eu2+, so the absence of intermediate valence europium may simply be the result of limited supply.
III.4 Magnetic ordering
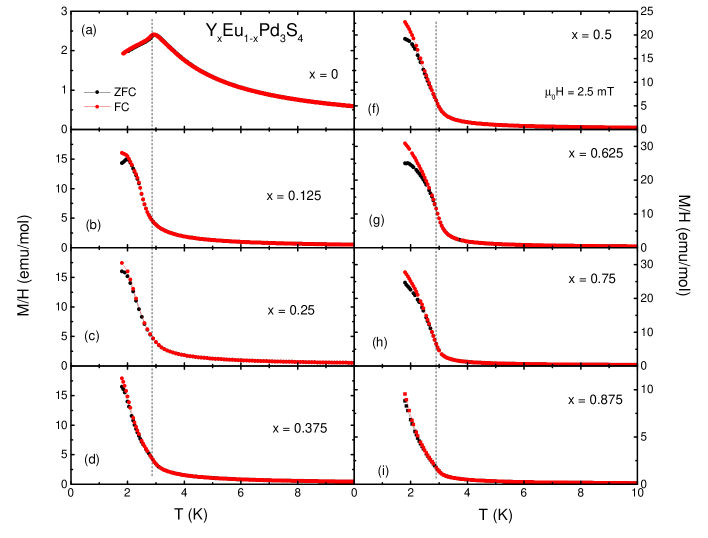
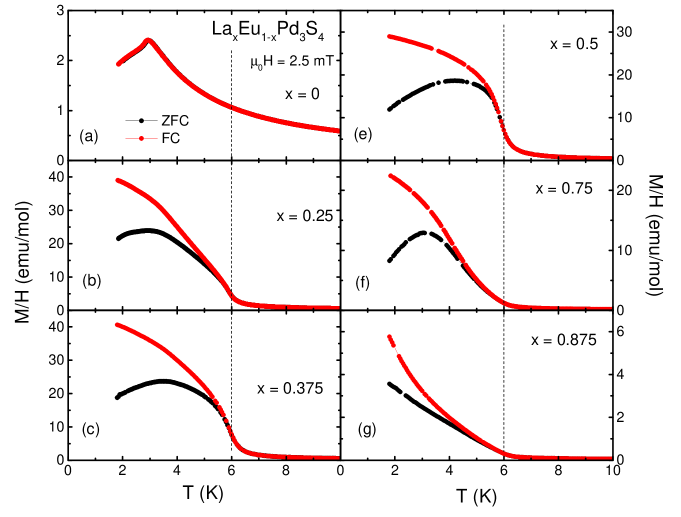
Although the Eu2+ fraction does increase as yttrium is added, there is a steady decline in the net moment-bearing rare-earth content of the series with increasing x. This decline is even stronger in the series as the Eu2+ fraction is either constant (up to x0.5) or decreases with increasing x. Despite these monotonic reductions in the moment-bearing fraction, Fig. 17 shows that both series continue to exhibit some form of magnetic order, at least as far as x=0.875. Furthermore, it is apparent from both the high-field magnetisation curves (Figs. 8 and 10) and low-field dc susceptibility (Figs. A.2 and A.4 in the appendix) that both series develop some ferromagnetic character to their ordering. Heat capacity measurements (Figs. A.1 and A.3 in the appendix) confirm the persistence of magnetic ordering. With increasing dilution, the signature of the ordering becomes progressively weaker, with a softer onset, but it is never lost.
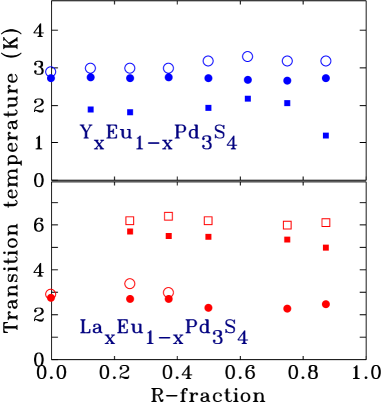
For the onset of magnetic order appears to be largely insensitive to the level of substitution, remaining near 3 K for all x. However the Y-substituted samples also exhibit a secondary feature around 2 K in the heat capacity data, and it too is largely independent of the composition.
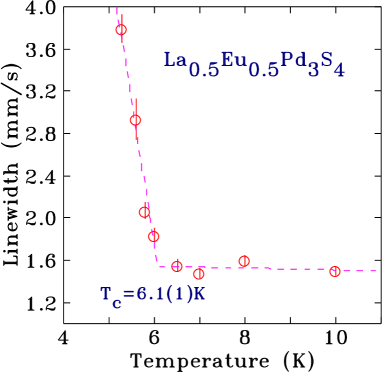
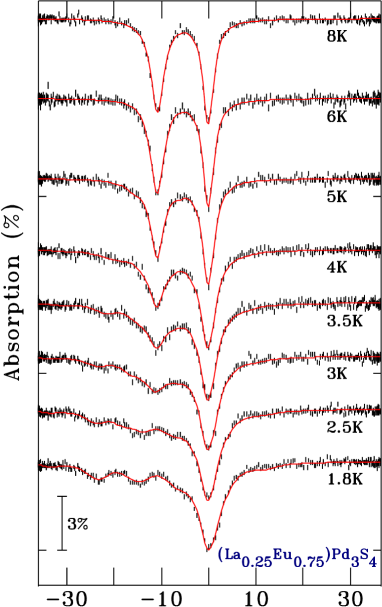
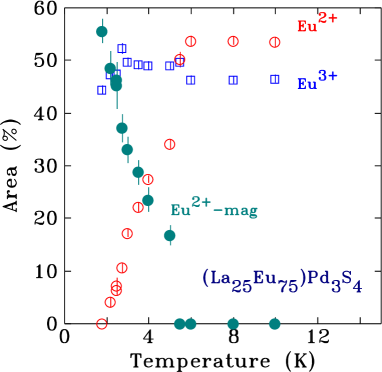
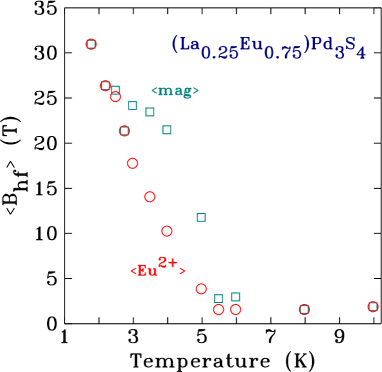
For , heat capacity (Fig. A.3 in the appendix) and dc susceptibility (Fig. A.4 in the appendix) measurements show that the ordering behaviour is more complex in the lanthanum substituted series. Whereas the 3 K feature from the parent compound persists for all finite x, but becomes progressively less distinct, a new feature develops at 6 K as lanthanum is added. This is despite the steady dilution of the moment bearing component: by 0.875 only 4% of the rare earth atoms are moment-bearing Eu2+, yet the 6 K magnetic feature is still apparent in both heat capacity and susceptibility. 151Eu Mössbauer spectroscopy confirms that the 6 K feature at x=0.75 is indeed magnetic and associated with the Eu2+ in the material. Although the 5 K limit of the closed-cycle fridge was not low enough to yield a fully resolved magnetic splitting, Fig. A.5 (in the appendix) shows that it is possible to observe the initial line broadening that occurs as order develops. Fitting the broad Eu2+ line at 5.3 K yields a hyperfine field of 11(1) T. Fig. 17 summarises the composition dependence of the transition temperatures observed for .
The form of Cp(T) for , and to a lesser extent , might lead one to suspect that either an impurity phase is present, or that the sample has perhaps separated into La-rich and La-poor regions, yielding distinct 6 K and 3 K transitions respectively. The magnitude of the Cp signal would require a rather significant impurity content to account for it. None was detected by x-ray diffraction, as noted earlier. Furthermore, the change in lattice parameter with x in the La-substituted series is quite strong (see Fig. 6) so any phase separation would yield broadened, or more likely split, diffraction lines. These were not seen in any sample studied here. Finally, the form of appears to be stable across the entire rare-earth series and for both the Y- and La- substituted series studied here, giving us no reason to expect phase separation. The monotonic composition and temperature evolution of the intermediate valence component apparent in Figs. 12 and 14 also argues for homogeneous, rather than phase separated samples. The 151Eu Mössbauer spectra in Fig. A.6 (in the appendix) reveal a progressive development of magnetic order on cooling: The Eu2+ component near 11 mm/s first broadens below 6 K, then a full magnetic pattern appears (more apparent on the low-velocity side of the Eu2+ component) on further cooling. Even at 1.8 K the magnetic component is extremely broad (compare the 1.8 K spectrum in Fig. A.6 (in the appendix) with that of at the same temperature in Fig. 2). A simple parametrisation of the spectra was obtained by using three components to fit the Eu2+ contribution: zero field, low-field and high-field. Fewer components gave a poor fit while using more led to instabilities. Following the areas of the magnetic and non-magnetic Eu2+ components (Fig. A.7 in the appendix) shows a gradual shift from non-magnetic to magnetic starting below 6 K with no apparent break near 3 K. The average magnetic field shown in Fig. A.8 (in the appendix) shows similar behaviour, again with no break near 3 K. We conclude that although the Eu2+ experiences a very broad range of magnetic environments, there is no evidence for phase separation.
IV Discussion
Given that the compound series exists for most, if not all of the trivalent rare earths (R) and yttrium Keszler et al. (1985); Wakeshima et al. (1997); Wakeshima and Hinatsu (1999); Bonville et al. (2003), but not, apparently, for the divalent alkaline earths, it is remarkable that not only accommodates such a large fraction of divalent europium, but that the fraction of Eu2+ is so robust against substitution by other trivalent rare earths: Substituting yttrium actually promotes the divalent state, whereas substituting lanthanum has little impact on the europium valence until at least half of the europium has been replaced.
It is clear that band filling or average valence electron count does not control the Eu2+:Eu3+ ratio in as both yttrium and lanthanum are trivalent yet act on the Eu2+:Eu3+ ratio in opposite directions. Similarly, chemical pressure arguments fail as lattice compression using yttrium substitution favours the larger Eu2+ ion, and lattice expansion using lanthanum leads to more of the smaller Eu3+ ion – the reverse of what would be predicted.
We are left with preservation of the average rare-earth size as the dominant factor controlling the Eu2+:Eu3+ valence ratio. Since ) is both smaller than ) and much smaller than ), converting Eu3+ into the larger Eu2+ as yttrium is added acts to maintain the average rare-earth size. By the same token, ) lies between those of Eu2+ and Eu3+, so lanthanum substitution initially has very little effect on the Eu2+:Eu3+ ratio. Only after half of the europium has been replaced do we see a shift in the balance towards Eu3+.
Hydrostatic pressure would provide a complementary window on how pure changes in volume affect the Eu2+:Eu3+ ratio, and synchrotron Mössbauer spectroscopy under pressure would be a useful extension of this study.
Remarkably, La-substitution also appears to reduce the barrier for electron hopping between the Eu2+ and Eu3+ ions in , and a temperature dependent intermediate valence component develops at progressively lower temperatures with increasing lanthanum content. Extrapolating the composition trend in the onset temperature leads to the prediction that electron hopping should start around 340 K in un-doped . The much weaker dynamic behaviour in the Y-substituted series may reflect a stronger bias towards Eu2+ in which may in turn stabilise the valence of the two europium components. Alternatively, the much lower availabilty of Eu3+ for electron exchange may be the limiting factor.
The evolution of low temperature magnetism, as seen by Mössbauer spectroscopy, heat capacity and low field magnetic susceptibility also differs between yttrium and lanthanum. Remarkably, suppression of the ordering by the dilution of the magnetic Eu2+ is not the primary impact in either series. Magnetic order persists in even as far as x=0.875, with the onset temperature essentially unchanged, despite only about 12% of the europium sites being occupied by a moment-bearing ion (Fig. 17). However the behaviour of the La-substituted series is perhaps more surprising. Not only does the magnetic order also persist to x=0.875 (where the moment-bearing fraction is only 4% because of the much lower Eu2+:Eu3+ ratio in the La-substituted series), but the onset temperature jumps from 3 K to 6 K for low x and remains near 6 K at least as far as x=0.875 (Fig. 17). We emphasise that our data do not provide access to the specific magnetic structures of the Y- and La- substituted materials. The behaviour of (T) and Cp(T) in Fig. 5 strongly suggests that the parent compound orders antiferromagnetically, however it is unlikely that this survives the substitutional disorder introduced when we replace the europium. The form of (T) clearly changes in both series (Figs. A.2 and A.4 in the appendix) and the magnetic order appears to develop at least some ferromagnetic character, although it is probably dominated by short ranged order. The extremely broad hyperfine field distributions and the presence of significant zero field components well below the onset of magnetic order in both and (Fig. A.9) point to inhomogeneous ordering in both of these magnetically diluted materials.
V Conclusions
The impact of yttrium and lanthanum substitution on mixed-valence has been studied using 151Eu Mössbauer spectroscopy, bulk magnetisation and heat capacity measurements. Average valence electron count clearly does not control the europium valence distribution as trivalent yttrium and lanthanum substitutions have opposite effects. Similarly, chemical pressure arguments fail as lattice compression using yttrium substitution favours the larger Eu2+ ion, with the reverse effect seen with lanthanum. It appears that preservation of the average rare-earth size is the dominant factor controlling the Eu2+:Eu3+ valence ratio.
Lanthanum substitution was also found to promote electron hopping between the Eu2+ and Eu3+ ions, leading to the formation of intermediate valence europium. Increasing lanthanum substitution both increases the amount of intermediate valence europium seen at ambient temperatures and reduces the temperature at which hopping starts to appear. An onset temperature of 340 K is predicted for undoped .
Inhomogeneous magnetic order is seen at all levels of substitution, with the onset temperature in the Y-substituted series being essentially unchanged at 3 K, while for the La-substituted series the onset temperature is seen to increase to 6 K despite the low concentration of magnetic ions.
Acknowledgements.
Financial support for this work was provided by Fonds Québécois de la Recherche sur la Nature et les Technologies, and the Natural Sciences and Engineering Research Council (NSERC) Canada. Work at the Ames Laboratory was supported by the U.S. Department of Energy, Office of Science, Basic Energy Sciences, Materials Sciences and Engineering Division. The Ames Laboratory is operated for the U.S. Department of Energy by Iowa State University under contract No. DE-AC02-07CH11358. BK is supported by the Center for the Advancement of Topological Semimetals (CATS), an Energy Frontier Research Center funded by the US DOE, Office of Basic Energy Sciences. Much of this work was carried out while DHR was on sabbatical at Iowa State University and their generous support during this visit is gratefully acknowledged.References
- Keszler et al. (1985) D. A. Keszler, J. A. Ibers, and M. H. Mueller, J. Chem. Soc., Dalton Trans. , 2369 (1985).
- Wakeshima et al. (1997) M. Wakeshima, T. Fujino, N. Sato, K. Yamada, and H. Masuda, Journal of Solid State Chemistry 129, 1 (1997).
- Wakeshima and Hinatsu (1999) M. Wakeshima and Y. Hinatsu, Journal of Solid State Chemistry 146, 226 (1999).
- Bonville et al. (2003) P. Bonville, C. Godart, E. Alleno, F. Takahashi, E. Matsuoka, and M. Ishikawa, Journal of Physics: Condensed Matter 15, L263 (2003).
- Wakeshima et al. (2001) M. Wakeshima, Y. Doi, Y. Hinatsu, and N. Masaki, Journal of Solid State Chemistry 157, 117 (2001).
- Larson and Von Dreele (2000) A. C. Larson and R. B. Von Dreele, Los Alamos National Laboratory Report LAUR 86-748 (2000).
- Toby (2001) B. H. Toby, J. Appl. Cryst. 34, 210 (2001).
- Voyer and Ryan (2006) C. J. Voyer and D. H. Ryan, Hyperfine Interact. 170, 91 (2006).
- Abe et al. (1999) K. Abe, J. Kitagawa, N. Takeda, and M. Ishikawa, Phys. Rev. Lett. 83, 5366 (1999).
- Bauminger et al. (1973) E. R. Bauminger, D. Froindlich, I. Nowik, S. Ofer, I. Felner, and I. Mayer, Phys. Rev. Lett. 30, 1053 (1973).
- Palenzona et al. (1986) A. Palenzona, S. Cirafici, and F. Canepa, J. Less Common Met. 119, 199 (1986).
- Abd-Elmeguid et al. (1985) M. M. Abd-Elmeguid, C. Sauer, and W. Zinn, J. Phys. C: Solid State Phys. 18, 345 (1985).
- Röhler et al. (1982) J. Röhler, D. Wohlleben, G. Kaindl, and H. Balster, Phys. Rev. Lett. 49, 65 (1982).
- Hossain et al. (2004) Z. Hossain, C. Geibel, N. Senthilkumaran, M. Deppe, M. Baenitz, F. Schiller, and S. L. Molodtsov, Phys. Rev. B 69, 014422 (2004).
Appendix A Additional figures and tables
This appendix contains additional figures showing heat capacity and susceptibility data for and .
We also present low temperature 151Eu Mössbauer data for showing the onset of magnetic broadening near 6 K, and spectra for showing the inhomogeneous magnetic order that develops below the transition temperature. The temperature dependence of some fitting parameters for the spectra is also shown.
The fitted lattice parameters and Eu2+ fractions used to construct Fig. 6 in the main body of the text are also tabulated here.


| x | a (Å) | Eu2+ fraction (%) | ||
| Mössbauer | Curie-Weiss | M(H) | ||
| 5% | 5% | |||
| 0.00 | 6.67858(8) | 53.8(5) | 57 | 49 |
| 0.125 | 6.67637(9) | 56.3(8) | 59 | 56 |
| 0.25 | 6.67371(13) | 61.5(5) | 66 | 63 |
| 0.375 | 6.66983(12) | 68.4(5) | 72 | 68 |
| 0.500 | 6.66527(20) | 73.3(9) | 71 | 69 |
| 0.625 | 6.66148(10) | 83.2(7) | 92 | 89 |
| 0.750 | 6.65514(12) | 87.3(8) | 85 | 86 |
| 0.875 | 6.64921(11) | 93(2) | 95 | 94 |
| 1.00 | 6.64193(17) | – | – | – |
| x | a (Å) | Eu2+ fraction (%) | ||
| Mössbauer | Curie-Weiss | M(H) | ||
| 5% | 5% | |||
| 0.00 | 6.67858(8) | 53.8(5) | 57 | 49 |
| 0.25 | 6.69217(18) | 53.1(6) | 55 | 52 |
| 0.375 | 6.70125(17) | 51.1(9) | 53 | 49 |
| 0.50 | 6.70871(17) | 51.5(8) | 54 | 49 |
| 0.625 | 6.71763(12) | 47(2) | 53 | 46 |
| 0.75 | 6.72490(14) | 46(2) | 56 | 43 |
| 0.8125 | 6.72981(12) | 39(1) | 57 | 40 |
| 0.875 | 6.73316(14) | 32(1) | 61 | 36 |
| 0.9375 | 6.73557(6) | 25(3) | 86 | 34 |
| 1.00 | 6.73948(9) | – | – | – |