MOCAS: A Multimodal Dataset for Objective Cognitive Workload Assessment on Simultaneous Tasks
Abstract
This paper presents MOCAS, a multimodal dataset dedicated for human cognitive workload (CWL) assessment. In contrast to existing datasets based on virtual game stimuli, the data in MOCAS was collected from realistic closed-circuit television (CCTV) monitoring tasks, increasing its applicability for real-world scenarios. To build MOCAS, two off-the-shelf wearable sensors and one webcam were utilized to collect physiological signals and behavioral features from 21 human subjects. After each task, participants reported their CWL by completing the NASA-Task Load Index (NASA-TLX) and Instantaneous Self-Assessment (ISA). Personal background (e.g., personality and prior experience) was surveyed using demographic and Big Five Factor personality questionnaires, and two domains of subjective emotion information (i.e., arousal and valence) were obtained from the Self-Assessment Manikin, which could serve as potential indicators for improving CWL recognition performance. Technical validation was conducted to demonstrate that target CWL levels were elicited during simultaneous CCTV monitoring tasks; its results support the high quality of the collected multimodal signals.
Index Terms:
Multimodal Dataset, Cognitive Workload Assessment, Human-robot Teams, Human-machine Systems, Affective Computing1 Introduction
Humans serve as the core part of any human-machine interaction system; thus the cognitive workload of human operators is a critical concern in the design and implementation of such systems [1]. Cognitive workload (CWL) can be defined as the quantitative amount of mental loads exceeding the operator’s ability to perform tasks [2]. It can also be considered as a mental strain to respond to tasks’ demands for performing specific tasks [3].
Previous research [4, 5, 6, 7, 8] has repeatedly shown that awareness and perception of human CWL can improve the performance of a human-machine interaction system as such awareness allows identifying and alleviating task errors that result from situations of task over-load or under-load. Monitoring the CWL of human operators in a human-robot team, for instance, enables the workload and autonomy levels of the robots to be adjusted as needed to help human operators efficiently and productively maintain their working state [9]. Similarly, recognizing the CWL of human drivers can improve the safety of human-vehicle systems [7].
Generally, CWL assessments can be categorized as subjective or objective. Subjective CWL estimation focuses on the self-assessment of one’s workload via subjective questionnaires such as the NASA-Task Load Index (NASA-TLX) [10]. Objective measurement of CWL relies on quantitative data concerning one’s physiological or behavioral responses when facing a certain level of workload. Accordingly, objective assessments can be further categorized as physiological or behavioral based on the data types utilized [11]. Physiological assessments perceive human biological metrics such as electroencephalography (EEG), functional near-infrared spectroscopy (fNIRS), skin temperature (SKT), and heart rate (HR), which change according to the reaction of the human nervous system to workload fluctuations. Behavioral assessments similarly analyze human behavioral responses such as facial landmarks, eye features, body gestures, and poses in relation to different levels of workload.
However, none of the aforementioned signals are optimal in terms of accuracy, robustness, and rapidity due to the drawbacks inherent in utilizing a unimodal data source [11]. For example, different sensors have different sensitivity to different task scenarios and to different human subjects, therefore it is non-trivial to identify one single metric that is both efficient and accurate for general scenarios [12]. Moreover, noise and the failure of a single-modality sensor can lead to serious errors and even invalidity of the recognition system. Multimodal fusion-based CWL assessments have been proposed as a solution to this problem; such assessments combine bio-signals from multiple modalities to provide latent and important information that is unobtainable from a single modal source, and have achieved better performance [11, 13, 14, 15, 16, 17, 12, 18]. Additionally personality traits have been shown capable of influencing observed responses when different human subjects face the same level of workload; that is, under a given level of CWL, different personality traits can generate physiological and behavioral signals with different features [19, 20, 21]. In addition, human emotion has been proven to have a close relation with CWL [22, 23]; for instance, one’s emotional state may directly affect CWL through expanding or shrinking cognitive resources [24]. Thus, investigating personal traits, human emotion, and their potential relation with CWL can broaden our awareness of individual differences and suggest additional indicators for use in CWL assessments, thereby improving the accuracy and robustness of those assessments.
Even as multimodal fusion methods are being increasingly utilized in the area of objective CWL assessment, the availability of open-source and sizable multimodal datasets remains limited, making it difficult for researchers to ensure their models and algorithms are fairly reproducible and verifiable. Furthermore, existing open-source datasets [25, 26, 27, 28, 29, 20, 30] were collected in the course of participants playing virtual games, such as dual N-back games [31, 32] and video games [33, 34], which weakens the applicability of those datasets to real-world CWL recognition; the CWL elicited by virtual game-based stimuli cannot faithfully mimic the realistic and idiosyncratic workload experienced in real human-machine systems [11, 35]. In addition, according to our best knowledge, no extant dataset covers behavioral data and emotion information (annotations), and only one [20] includes the personality traits of the human subjects, but this is limited to considering the cognitive loads and performance for game-based tasks that mean it is not suitable on realistic applications.
To fill the above-mentioned gaps, we constructed the Multimodal Dataset for Objective Cognitive Workload Assessment on Simultaneous Tasks (MOCAS). The data in MOCAS is based upon 21 human subjects participating in a simultaneous closed-circuit television (CCTV) monitoring task and consists of physiological data collected from two wearable sensors, behavioral data obtained from a camera, subjective CWL annotations via the Instantaneous Self-Assessment (ISA) [36] and NASA-TLX, subjective emotion annotations via the Self-Assessment Manikin (SAM) [37], personal trait background surveyed from the Big Five Factor personality questionnaire [38], and raw screen video recordings. MOCAS represents a useful addition to current research in the field of multimodal fusion CWL assessment: to our best knowledge, MOCAS is the first open-access dataset to obtain both physiological and behavioral data along with both CWL and emotion annotations including the personal traits and background of subjects. All data was collected from off-the-shelf and user-friendly sensors; accordingly, an assessment model built or trained or trained from our dataset can be applied to everyday applications with ease and efficiency.
2 Dataset Design
2.1 Dataset Design
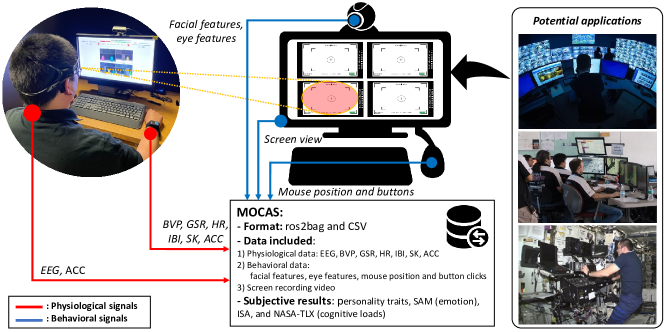
MOCAS was designed with consideration of a task scenario typical in real-world human-machine systems (as illustrated in Figure 1), in which one human subject undertakes a simultaneous CCTV monitoring task and multiple sensors track that person’s physiological and behavioral metrics. This dataset is intended to serve as an open-access, sizable, and multimodal data source for research in the field of objective assessment of cognitive workload, with the following aims:
-
•
Support the study of cognitive workload recognition with a focus on real-world applications using human-machine systems.
-
•
Encourage research on improving the accuracy of cognitive workload assessment using real-world applications of multimodal fusion approaches, especially combining physiological and behavioral data.
-
•
Offer novel opportunities for investigating how awareness of a subject’s personality traits and emotion states can improve cognitive workload assessment performance.
|
|
Scenarios |
|
|
|
|
|
||||||||||||||
|---|---|---|---|---|---|---|---|---|---|---|---|---|---|---|---|---|---|---|---|---|---|
|
8 |
|
EEG, EOG | X | X | O | X | ||||||||||||||
|
48 |
|
EEG | X | X | O | X | ||||||||||||||
|
40 | Reading and math test | ECG, GSR, HR | X | X | O | X | ||||||||||||||
|
48 |
|
|
X | X | O | X | ||||||||||||||
|
23 | N-back game and video game | ACC, GSR, TEMP, RR | X | O | O | X | ||||||||||||||
|
23 |
|
ACC, GSR, TEMP, RR | X | O | O | X | ||||||||||||||
|
62 |
|
ECG, PPG, GSR, ACC | X | X | O | X | ||||||||||||||
|
68 | N-back game | fNIRS | X | X | O | X | ||||||||||||||
|
22 | N-back game | ECG, GSR, PPG | X | X | O | X | ||||||||||||||
|
30 | Simultaneous CCTV monitoring task |
|
|
O | O | O |
”X” means not included, and ”O” means included.
Distinct from existing datasets related to cognitive workload, MOCAS evokes a target CWL with realistic CCTV monitoring tasks; it also includes more comprehensive multimodal data collected from both physiological and behavioral sensors, the personal backgrounds of participants (e.g., experience, preference, and personality traits), and emotion information (annotations). The major distinctions between existing CWL datasets and MOCAS are summarized in Table I.
2.2 Ethics statement
This study and the building of MOCAS was reviewed and approved by the Purdue University Institutional Review Board (IRB) with approval number IRB-2021-1813. The informed consent form for participants included the purpose and procedure of data collection, specific types of data collected, possible risks or discomforts, compensation and benefits, protocols to protect privacy and confidentiality, and permission for potential usage of the collected data (publishing the dataset and conducting related research). Each participant was provided with the approved informed consent form upon their arrival at the experimental site for data collection, was asked to fully read and understand the content, and was asked to sign a written signature if s/he agreed to participate in the data collection procedure and approved the potential usage of the collected data. Participants also acknowledged that they had the right to terminate the data collection at any time they wanted.
All collected raw data, consent forms, and questionnaire forms (on which each participant was assigned and presented with a participant number) are kept separately and only accessible to the investigators of this study or authorized researchers who consent to the End User License Agreement (EULA) governing usage of dataset. Some aspects of participants’ electronic data were de-identified (e.g., faces blurred) as befit the permissions they gave.
2.3 Participant recruitment
We reached out to potential participants by posting flyers all over Purdue campus, through social networking services, and by word of mouth. The investigators also used official contact lists (such as of faculty, staff, and students in the department) to recruit participants through emails. When contacted by potential participants, investigators gave further information about the experiment, confirmed participants’ availability, and sent back a confirmation email. When participants arrived at the site of data collection, they were provided with the informed consent form, and investigators were responsible for answering all their questions and concerns.
Thirty participants were recruited and participated in our data collection study during March and April 2022; however, only 21 had their data included in our dataset based on their permissions. All recruited participants were students and faculty/staff at Purdue University, and their ages range from 18 to 37 years old (mean = 24.3 years, S.D. = 5.2 years). In order to encourage participants’ engagement in this experiment, we also compensated $ 15 for each participation, and also provided additional compensations (e.g., amazon gift cards as prizes) to three participants who have the highest scores in the given tasks.
2.4 Stimuli design
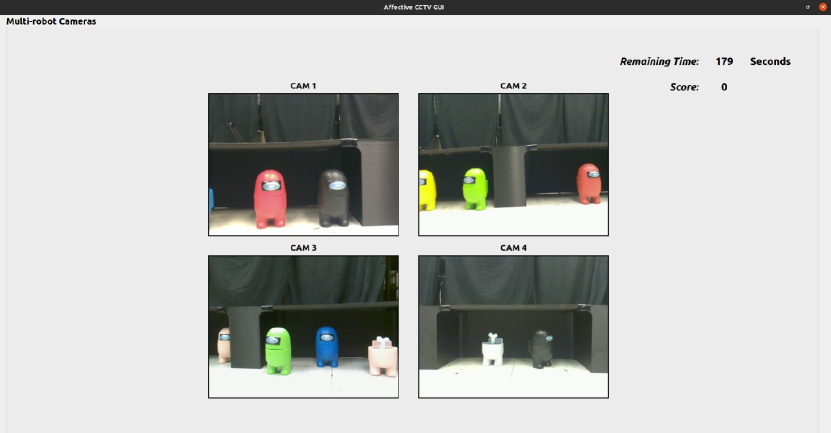
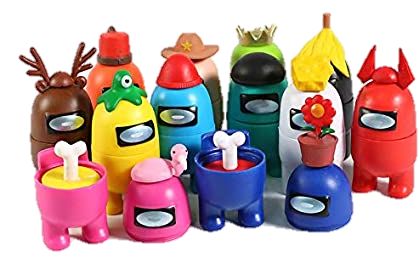
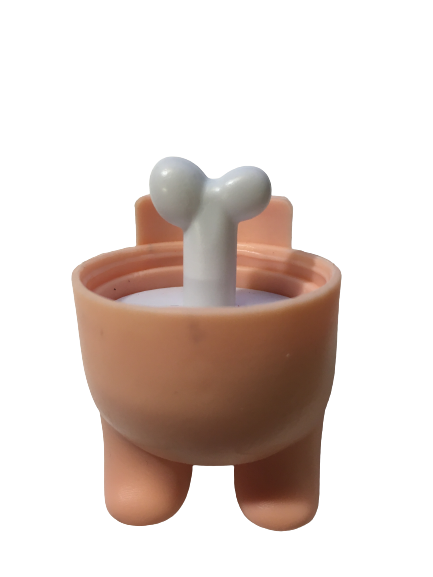
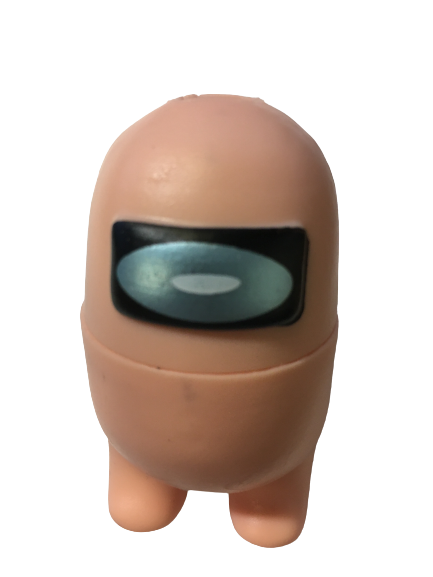
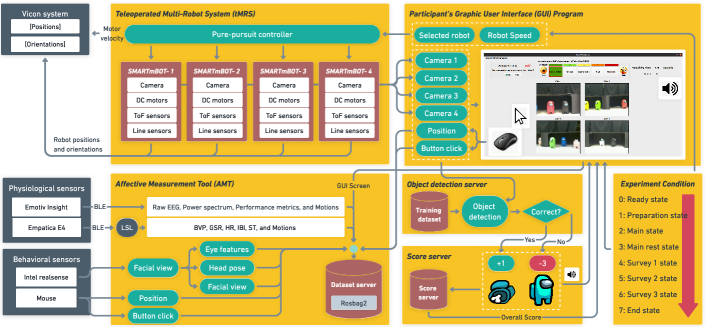
Video game scenarios such as N-back games and the Multi-Attribute Task Battery (MATB) are widely used for eliciting target cognitive workload levels, but have limited relevance to real-world applications. In the interest of better mimicking real-world workload scenarios, we proposed a CCTV monitoring task scenario as the stimulus and collected physiological and behavioral signals under different workload levels. Such tasks, in which human operators monitor and control a display interface (or multiple interfaces simultaneously), are widely required in diverse human-machine system task scenarios such as security monitoring [41, 42], air traffic management [43, 44, 45] and performance checking [46, 47]. Here, participants were asked to monitor multiple video streams captured by multiple patrol robot platforms passing by multiple separated rooms located in multiple corridors (Figure 2). As depicted in Figure 3, participants were asked to monitor and detect two types of objects: (a) abnormal objects and (b) normal objects. Each room contained a random number of objects with a random assortment of types. The number and speed of robots could be changed to present different levels of stimuli (e.g., low, medium, and high workloads). During the task, the participant was asked to observe the webcam streams captured by the robots and to use a mouse to click on camera views that contain any abnormal objects; the associated graphical user interface (GUI) is shown in Figure 3(a). Meanwhile, a webcam and two wearable sensors were set to record physiological and behavioral data from the participant. Correctly clicking an abnormal object would earn the participant 1 point; not doing so would cost them 3 points.
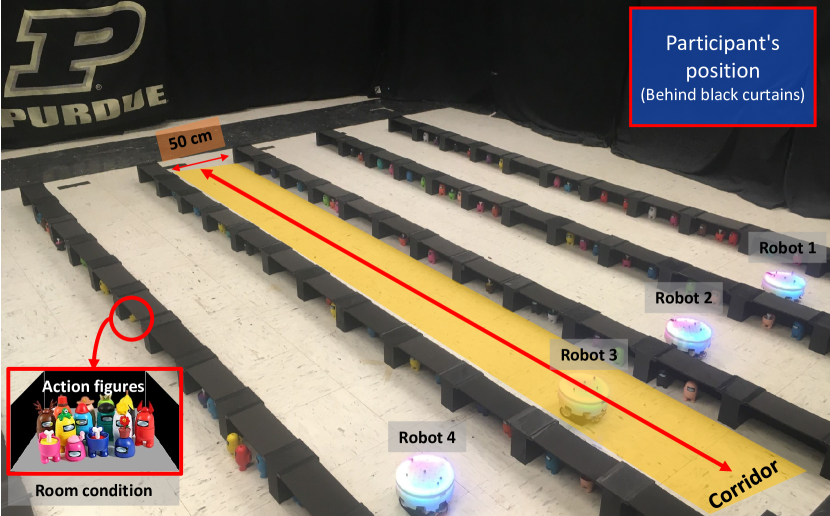

The designed CCTV monitoring task was conducted in a room, approximately 5 x 6 x 3 (width x depth x height), with a multi-robot system involving at most four mobile robot platforms [48] performing the patrol task (see Figure 2(a)) to provide video streams; also in the room was a desk supporting a 23-inch monitor, a common wireless keyboard, and a mouse (see Figure 2(b)) with which participants performed the monitoring task. During each collection period, only one participant was in the room. participants were not allowed to directly observe the multi-robot system during the experiment, but could hear the sounds generated by its movements.
2.5 Measures
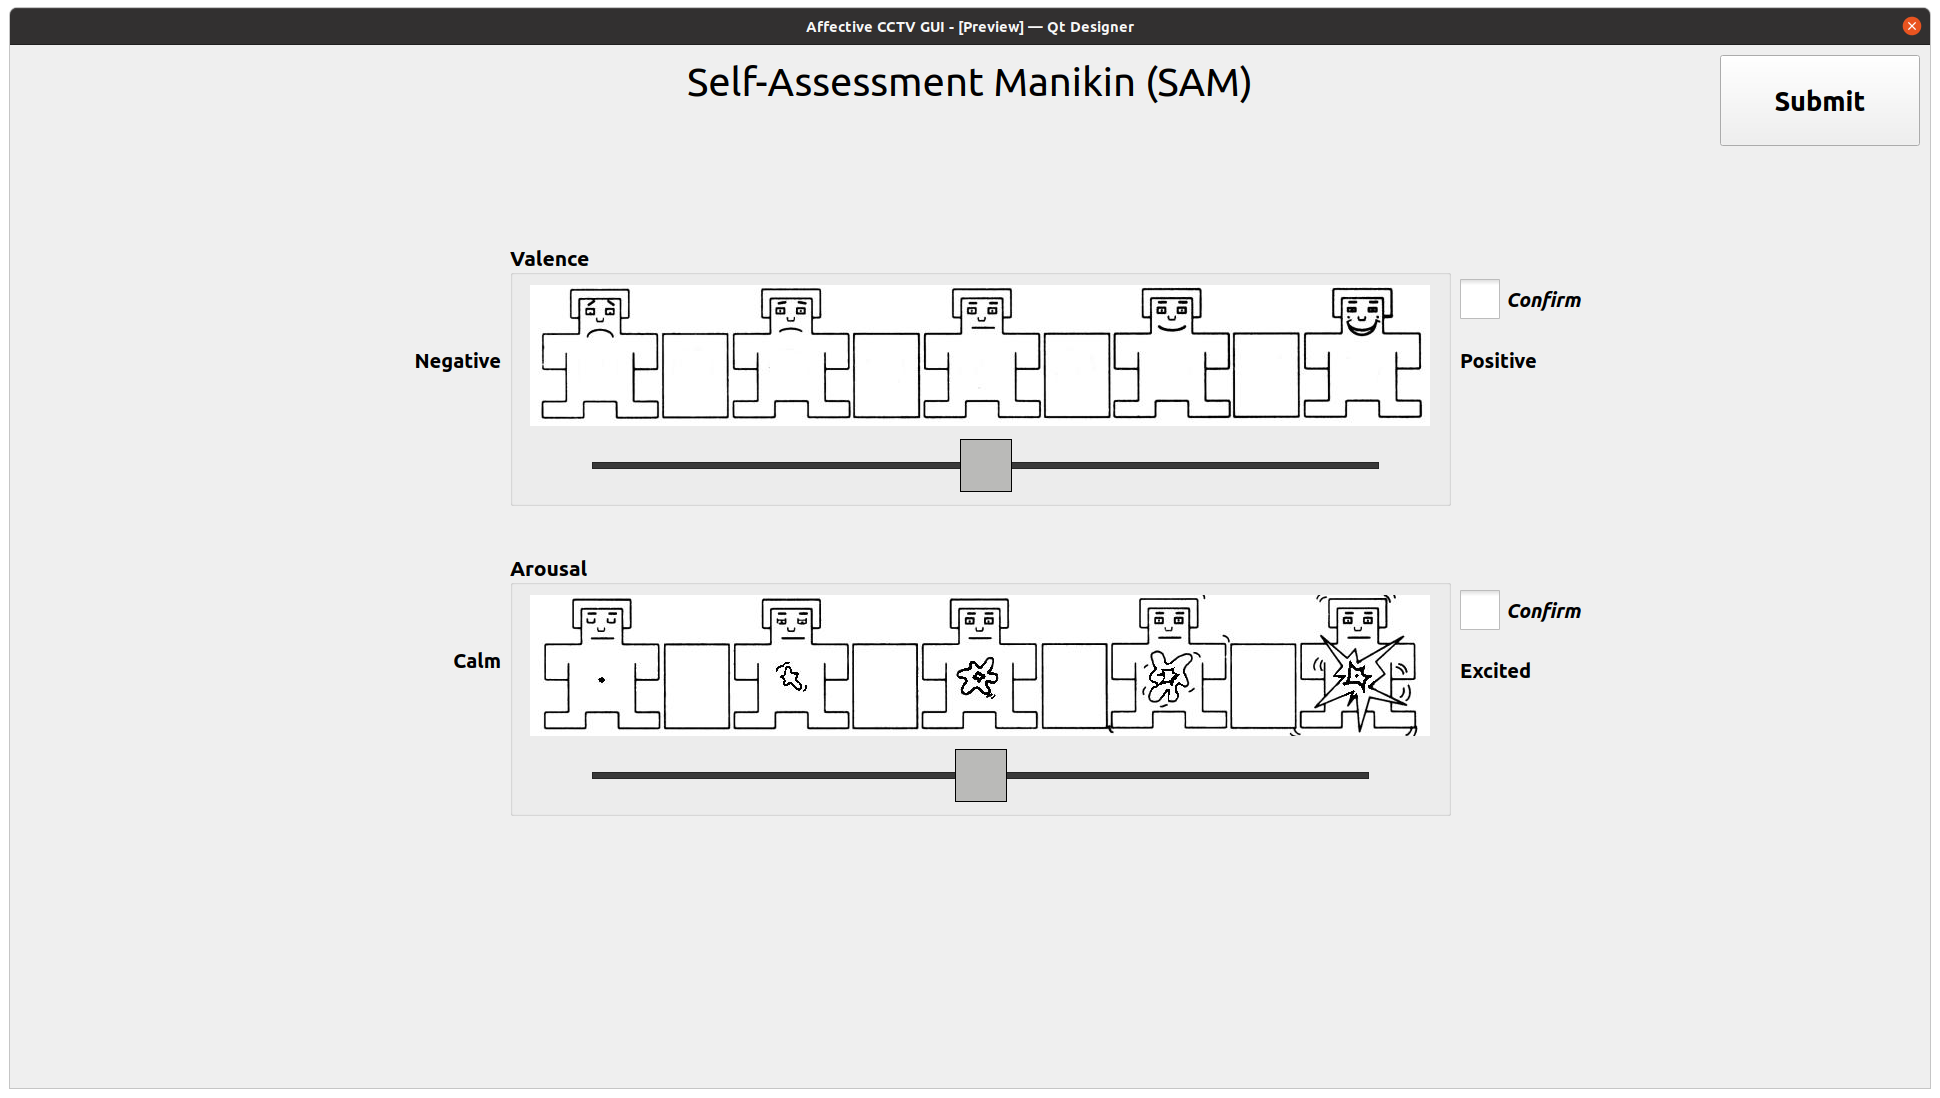
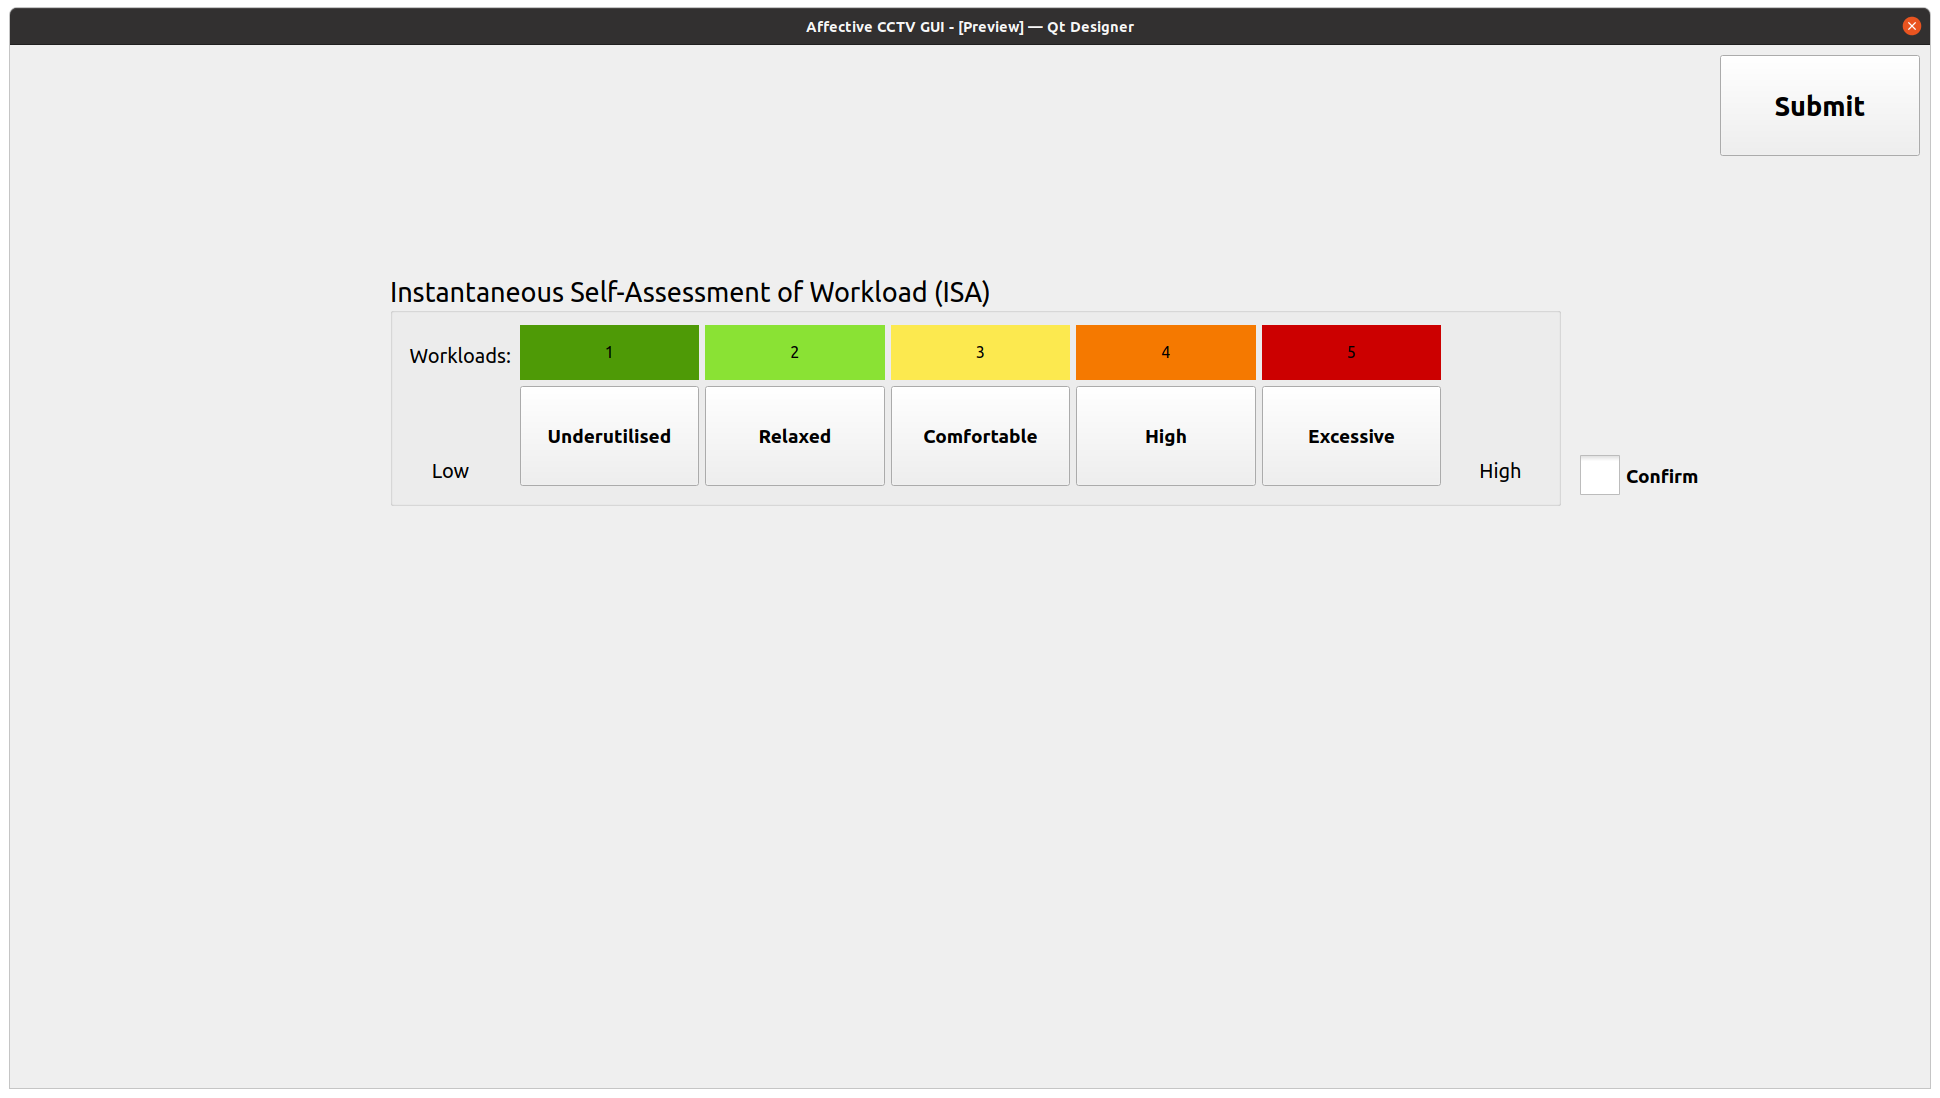
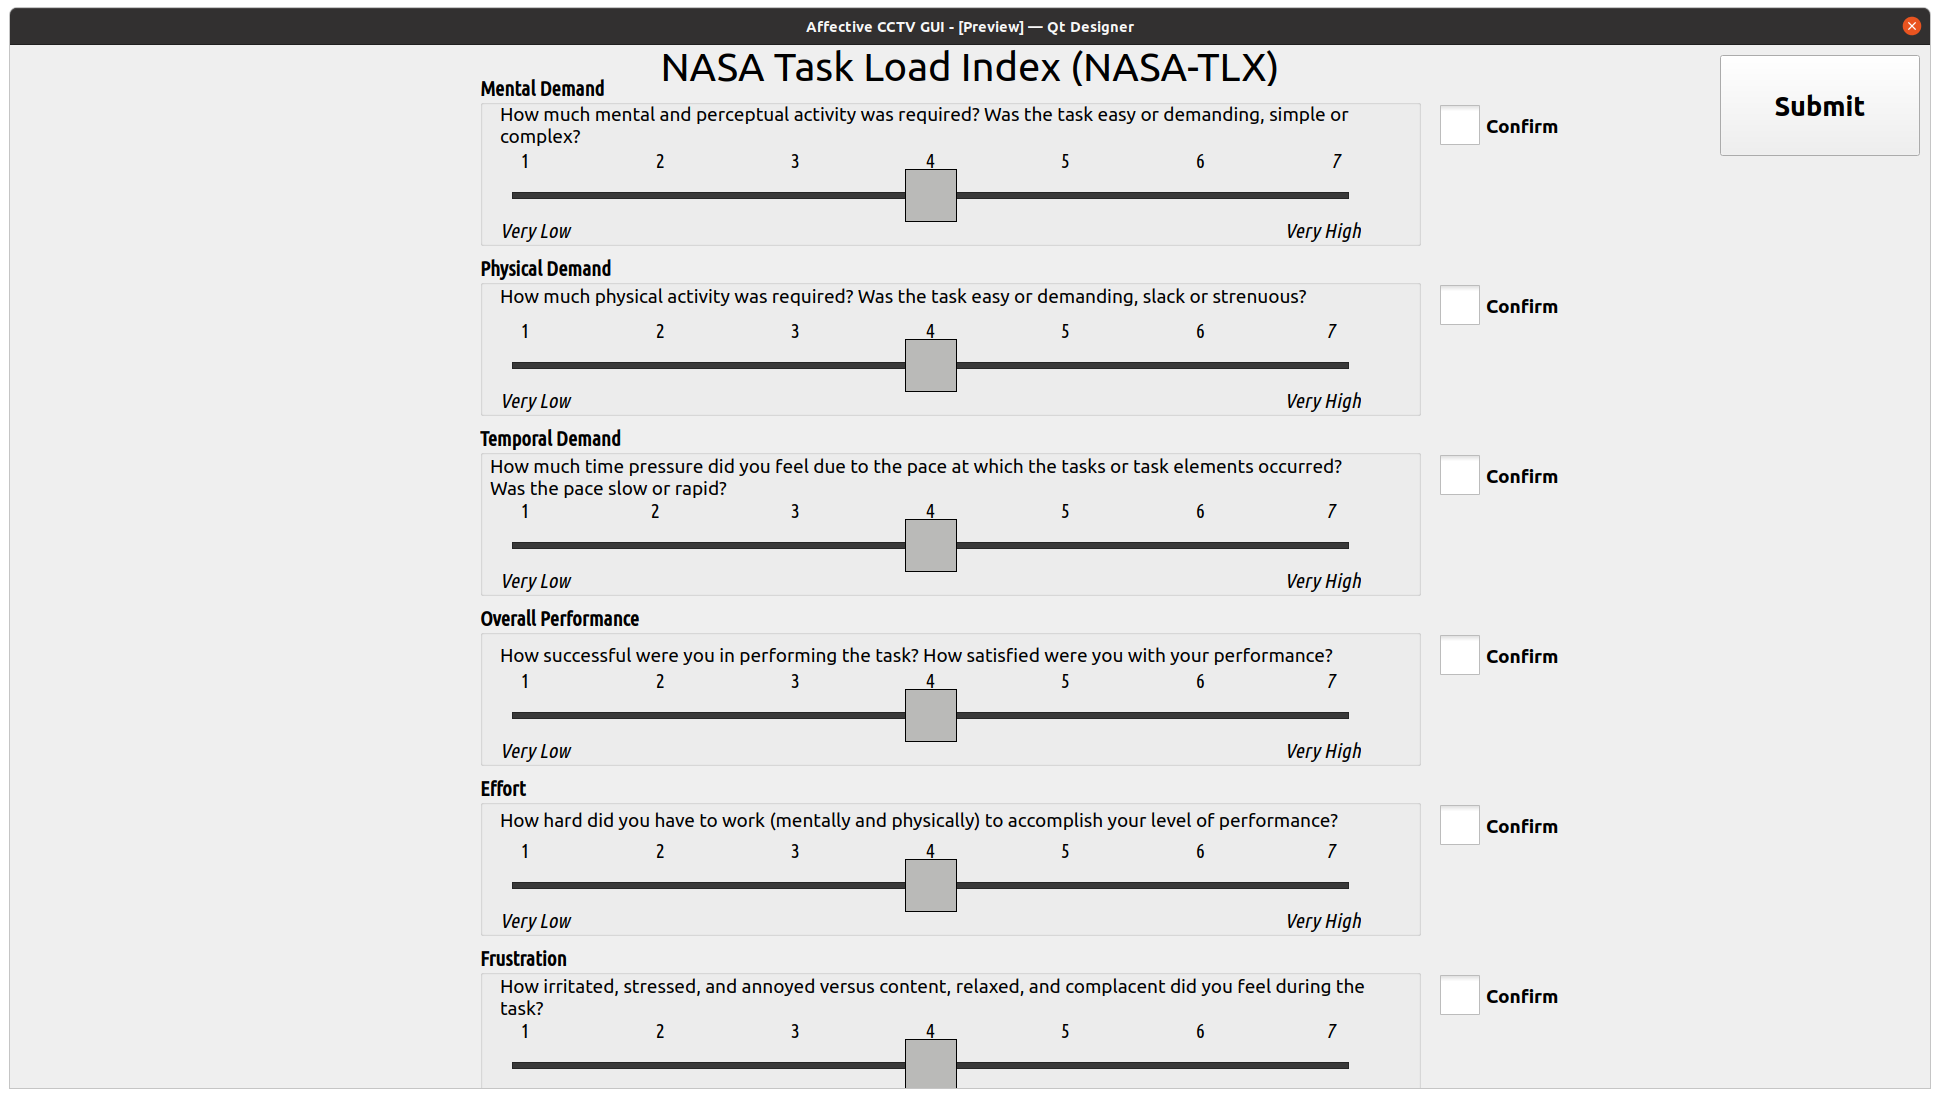
We assessed participants’ subjective cognitive workload using both ISA [36] and NASA-TLX [10], and also measured their subjective emotional state using SAM [37]. The ISA is a quick and simple assessment tool to measure mental workload with only five items (e.g., Underutilized, Relaxed, Comfortable, High, and Excessive). The NASA-TLX is a widely used assessment tool in physiology fields to measure task loads from five dimensions with 7-point scales on mental/physical/temporal demand, performance, effort, and frustration. The SAM is a non-verbal emotion assessment tool that directly measures the three domains related to emotional states. The details of aforementioned three measures can be found in Table II.
| Categories | Name | Scale range | Description | |||||
|---|---|---|---|---|---|---|---|---|
| Emotion | SAM | from -4 to 4 |
|
|||||
| Workload | ISA |
|
|
|||||
| Workload | NASA-TLX |
|
|
| Devices | Collected data | Data channels | Sampling rate | Signal range [min, max] |
| Empatica E4 Wristband | BVP (PPG) | 1 | N/A | |
| GSR | 1 | |||
| Heart rate (from BVP) | 1 | N/A | ||
| IBI (from BVP) | 1 | N/A | ||
| Body temperature | 1 | |||
| 9-axis IMU | 1 | |||
| Emotive Insight | Raw EEGs | 5 | N/A | |
| EEG band powers | 25 | |||
| Performance metrics | 7 | |||
| 9-axis IMU | 3 | 6 | ||
| Intel RealSense D435i | Compressed image | 640 x 480 | N/A | |
| Mouse Interface | Mouse positions | 2 | N/A | |
| Mouse buttons | 1 | N/A | [False, True] | |
| Monitor screen | Screen record video | 1 | 30 | N/A |
| GUI program | Experiment states | 1 | N/A |
2.6 Apparatus of data collection
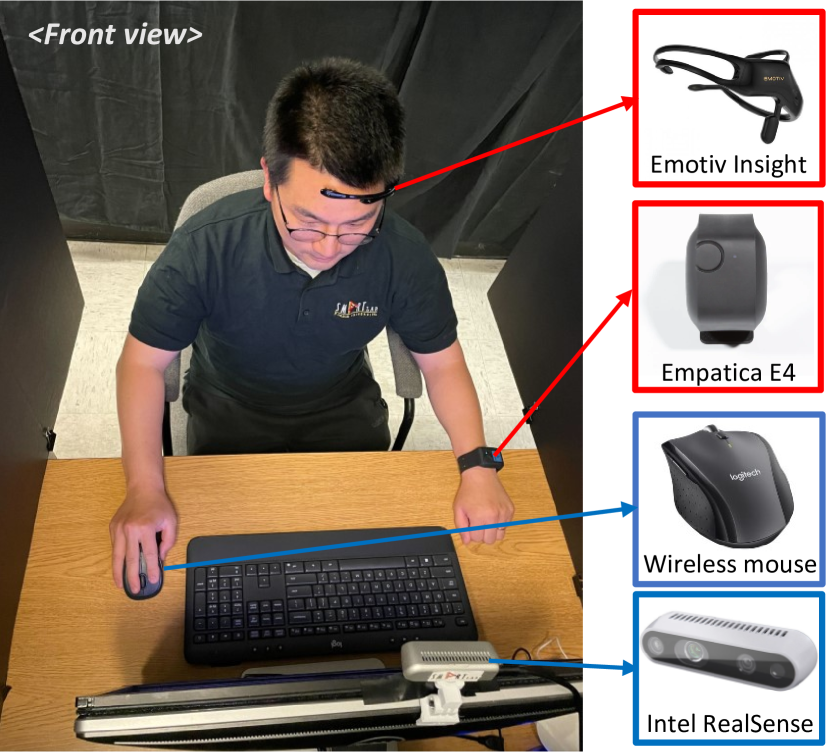
During the task, participants were required to wear two off-the-shelf wearable biosensors for physiological data collection, and their behavioral data was recorded through a webcam (i.e., Intel RealSense D435i) mounted on the monitor and a mouse as shown in Figure 2(c):
-
•
Emotiv Insight – captured 5-channel electroencephalogram (EEG), power spectrum (POW) (i.e., theta, alpha, beta, and gamma), and performance metrics generated from the EmotivPro SDK.
-
•
Empatica E4 Wristband – captured photoplethysmography (PPG), 9-axis acceleration, skin temperature (SKT), electrodermal activity (GSR, or EDA), heart rate (HR) and the inter-beat interval (IBI) derived from PPG.
-
•
Intel Realsense D435i – captured participant’s facial views and eye movements.
-
•
Mouse – recorded participant’s mouse movements.
Additionally, participant’s monitor screen, including CCTV video stream, mouse positions and status of pushed mouse buttons, was recorded for the experiment, enabling researchers to easily understand the status of the task performed by each participant. Table III summaries collected data in our dataset.
As illustrated in Figure 4, all sensors, devices and GUI programs used in the experiment were connected through Robot Operating System 2 (ROS2), where signals were collected as ROSbag2 files with synchronized time (e.g., ROS2 timestamp). The ROSbag2 format has more benefits than a traditional CSV format file in terms of collecting and analyzing the dataset [49], since it can ensure to synchronize the recording all topic data and to easily analyze the dataset by replaying both using a single ROSbag2 file.
2.7 Data collection procedures
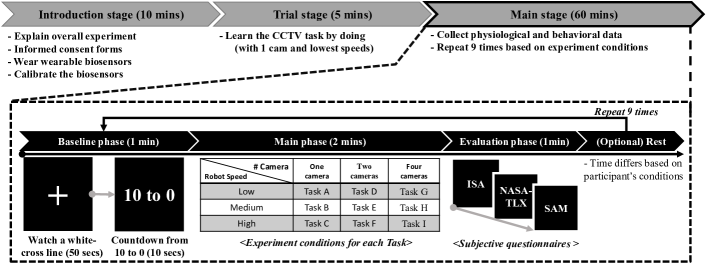
Each participant’s data collection procedure was conducted in following three main stages: (1) Introduction stage, (2) Trial stage, and (3) Main stage. Figure 5 illustrates the overall data collection procedures. Additionally, there is a supplementary video at https://youtu.be/BxVVj7R9b70 that explains the details of this experiment design and procedures.
Introduction stage: At the beginning of the data collection, investigators checked again if the participant satisfied the qualifications for this study (such as not having medical history on mental, heart disorders, skin allergies, etc.). The satisfied participants then read and signed the informed consent, and filled out demographic and personality questionnaires. The demographic questionnaire collected participants’ age, gender, level of education, medical history, experiences in conducting video-based surveillance or monitoring tasks, and daily usages of interacting with a monitor that indicated their capability and ability. The personality questionnaire was based on Big Five Personality Test to categorize participants’ personal traits into five personality traits using IPIP Big-Five Factor Markers [50] as follows:
-
•
Extraversion: a participant who has high scores tends to be outgoing/talkative/social, whereas one who has low scores tends to be reflective and reserved behavior.
-
•
Agreeableness: a participant who has high scores tends to be friendly and optimistic, whereas one who has low scores tends to be critical and aggressive.
-
•
Conscientiousness: a participant who has high scores tends to be careful and diligent, whereas one who has low scores tends to be impulsive and disorganized.
-
•
Emotional stability (or neuroticism): a participant who has high scores tends to be sensitive and nervous, whereas one who has low scores tends to be resilient and confident.
-
•
Intellect/Imagination (or openness to experience): a participant who has high scores tends to be inventive and curious, whereas one who has low scores tends to be traditional and conventional.
After that, investigators outlined the experimental process and gave instructions for each of the tasks that the participants need to complete, and then helped each participant wear and calibrate the physiological and behavioral sensors.
Trial stage: Following the introduction stage, participants were given time to get familiar with the hardware and software utilized and understand the tasks of this experiment. They conducted a trail experiment with one camera view and the minimum speed of the robots, which would not be included in the main experiment again. This stage was continued until participants fully understood and got familiar with the CCTV monitoring task in this study.
| Number of participants | 21 (7 females and 14 males) | |||||||
|---|---|---|---|---|---|---|---|---|
| Age | from 18 to 37 (mean=24.3 age, std.=5.2 age) | |||||||
| Wearing mask | 7 participants; P2, P3, P6, P11, P14, P17, P24 | |||||||
| Average time per an experiment | mean= 3.52 mins, std.=0.28 mins | |||||||
| Personality traits | Extraversion, Emotional stability, Agreeableness, Conscientiousness, and Intellect/Imagination | |||||||
| Physiological signals |
|
|||||||
| Behavioral features | facial view (30 Hz), and facial features & expressions (30 Hz) | |||||||
| Experiment status |
|
|||||||
| Subjective annotations |
|
|||||||
| Experiment scores | Obtained scores, Success click, Failure click, and Success rate (=success clicks/all clicks) |

Main stage: The main stage has four repeated sub-phases as illustrated in the dashed box in Figure 5: baseline phase (about 1 minute), main phase (about 2 minutes), evaluation phase (about 1 minute), and rest phase (optional). In each baseline phase, participants watched a white cross-line with a black background for 50 seconds, and then a countdown from 10 to 0, which helped participants refresh cognitive workload affected by their previous conditions. In each main phase, the participant operated one CCTV monitoring task selected from nine tasks at different workload levels decided by different combinations of three different numbers of camera views (one, two, or four cameras) and three different speeds of the multi-robot system (low, medium, and high speed). The order of nine tasks was randomly selected for each participant. After completing the assigned monitoring task, the participant moved to the evaluation phase to use the GUI-based questionnaires as shown in Figure 6 to report subjective cognitive workload via ISA and NASA-TLX respectively, and subjective emotion state via SAM. After finishing the above three sub-phases, the participant could ask for a rest based on his/her conditions. When the participant decided to continue, the experiment would start to repeat these four sub-phases.
3 Data Records
3.1 Dataset summary
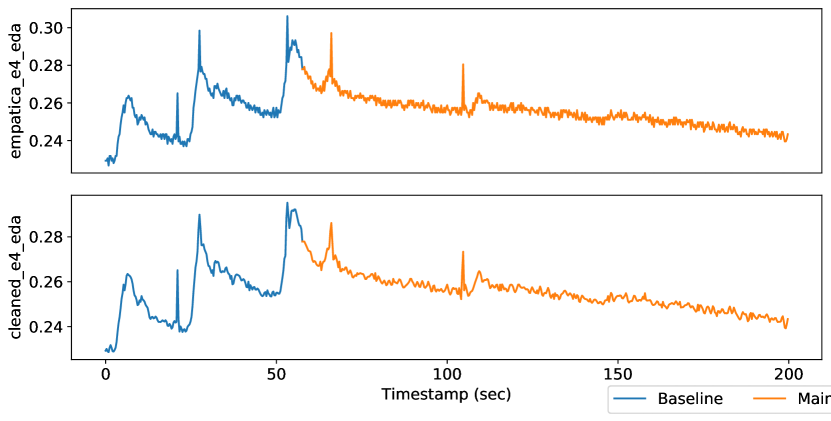
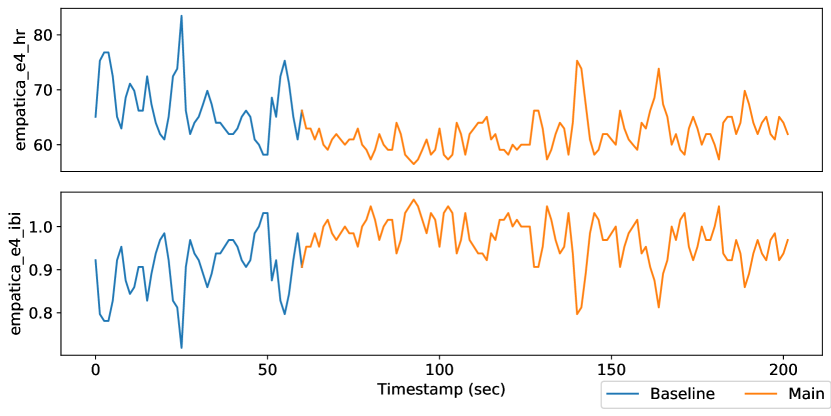
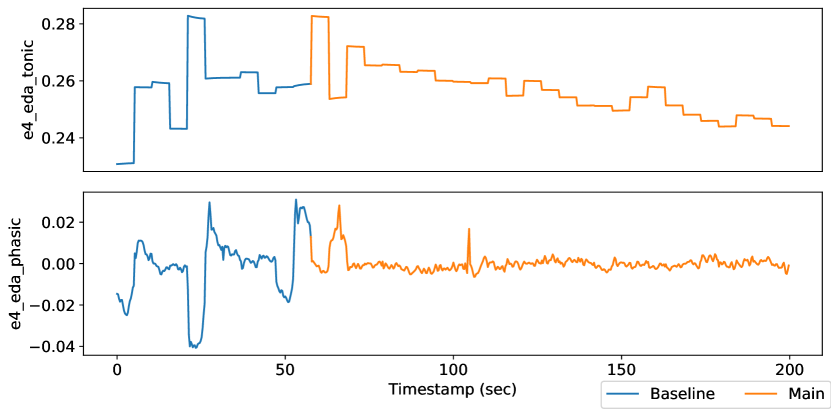
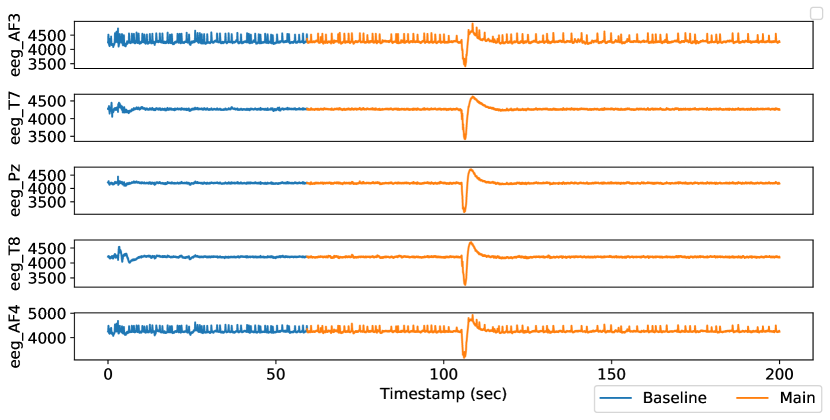
Table IV summaries the MOCAS, which contains multimodal data from 21 participants, including physiological signals, facial camera videos, mouse movement, screen record videos, and subjective questionnaires. Figure 7 shows the examples of physiological and behavioral data from the raw dataset. The total size of the dataset is about 722.4 GB that includes 754 ROSbag2 files.
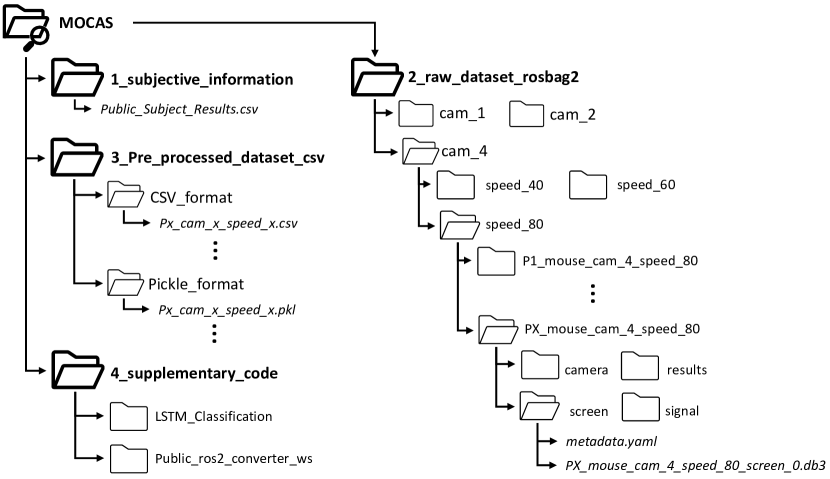
Figure 8 shows a folder tree of the online repository that displays directory paths and files for the MOCAS dataset. There are three major folders based on the types of the dataset:
-
•
1_subjective_information: a single csv file containing subject’s demographic (e.g., age, gender, personality trait, and experience), answers of the subjective questionnaires used in this experience, and performance (e.g., scores, success click, failure click, and success rate).
-
•
2_raw_dataset_rosbag2: raw rosbag2 files saved into each sub-folder depending on the experimental factors (e.g., robot speed and the number of camera views) and data types (e.g., camera, signal, results, and screen). The last sub-folder of this major folder has two files: and .
-
•
3_downsampled_dataset: downsampled CSV-format and Pickle-format [51] files with 100 Hz sampling rate. The overall size of the CSV files and Pickle file is 51.9 GB and 32.8 GB, respectively. Each file has the annotations of the subjective questionnaires, the number of camera view, robot speeds, features of the physiological and behavioral data, and filtered physiological signals.
-
•
4_supplementary_code: contains the converter codes from raw ROSbag2-format into pickle and csv-format files, and supplementary codes used on this paper. The codes are written by Python under Ubuntu 20.04.
3.2 Downsampled data
The raw ROSbag2 format files were converted to Pickel and CSV format with 100 Hz sampling rate, which were saved to two different folders based on the type of file format (i.e., CSV and Pickle [51]). Each file contains raw signals, each channel’s EEG signal divided from chunk EEG signals, cleaned BVP and GSR signals, physiological features from the GSR signals (e.g., tonic and phasic domains), and behavioral features from facial videos (e.g., Action units (AUs) [52], probability and types of facial expression [53], and Eye Aspect Ratio (EAR) [54]), as well as the results of the self-reporting questionnaires.
| Subjective questionnaires | Factor | F | P | Note | |||
|---|---|---|---|---|---|---|---|
| Camera_number | (2, 38) | 36.3 | P<0.001 | 0.66 | |||
| Robot_speed | (2, 38) | 30.84 | P<0.001 | 0.62 | |||
| ISA | Camera_number x Robot_speed | (4, 76) | 2.52 | 0.05 | 0.12 | ||
| Camera_number | (2, 38) | 49.13 | P<0.001 | 0.72 | |||
| Robot_speed | (2, 38) | 21.03 | P<0.001 | 0.53 | |||
| Raw-TLX | Camera_number x Robot_speed | (4, 76) | 1.09 | 0.37 | 0.05 | ||
| Camera_number | (2, 38) | 59.29 | P<0.001 | 0.76 | |||
| Robot_speed | (2, 38) | 17.36 | P<0.001 | 0.48 | |||
| NASA | Weighted-TLX | Camera_number x Robot_speed | (4, 76) | 0.86 | 0.49 | 0.04 | |
| Camera_number | (2, 38) | 13.29 | P<0.001 | 0.41 | |||
| Robot_speed | (2, 38) | 8.51 | P<0.001 | 0.31 | |||
| Arousal | Camera_number x Robot_speed | (4, 76) | 5.46 | P<0.001 | 0.22 | ||
| Camera_number | (2, 38) | 6.35 | P<0.001 | 0.25 | |||
| Robot_speed | (2, 38) | 24.79 | P<0.001 | 0.57 | |||
| SAM | Valence | Camera_number x Robot_speed | (4, 76) | 3.81 | 0.01 | 0.17 | ** |
| **: p <0.05 | |||||||
4 Analysis of dataset
4.1 Correlation between personality traits and physiological and behavioral signals
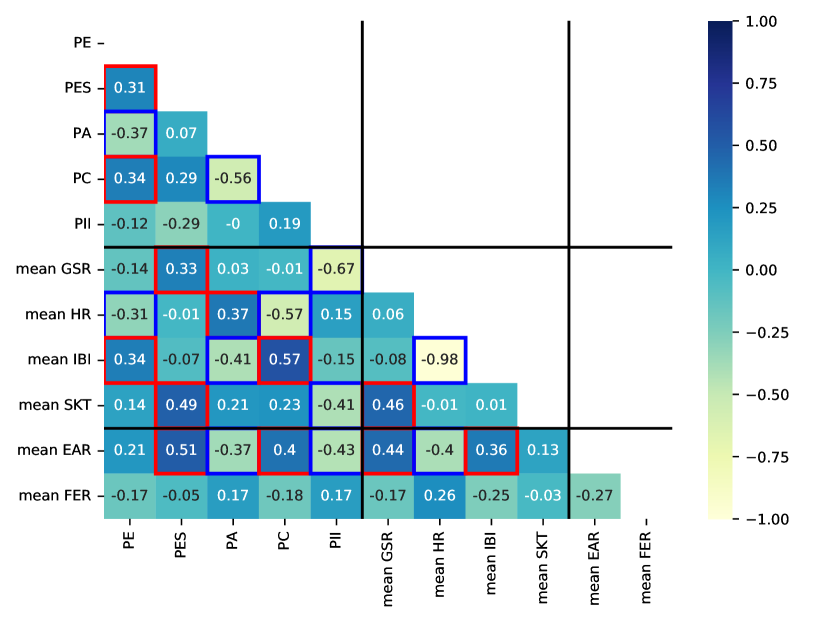
We calculated Pearson’s correlation coefficient () to find the relationship between the participant’s personal traits and the mean of their physiological and behavioral data. indicates the relationship between two variables with ranges from -1 to 1. The positive high means a proportional relationship between both variables, whereas the negative high means an inverse relationship [55]. Figure 9 shows the results of the Pearson’s correlation coefficient, where the PE is an extraversion marker of the IPIP Big-Five Factor Markers, the PES is emotional stability, the PA is agreeableness, the PC is conscientiousness, and the PII is an intellect/imagination.
From the results of Pearson’s correlation, we observed a moderate relationship between personal traits and physiological and behavioral features. The moderate positive relationship () is found between PE and mean IBI, between PES and mean GSR, SKT, and EAR, between PA and mean HR, and between the PC and mean IBI and EAR. On the other hand, the moderate negative relationship () is found between PE and mean HR, between PA and mean EAR and IBI, between PC and mean HR, and between PII and mean GSR, SKR, and EAR.

4.2 Subjective self-reporting annotations
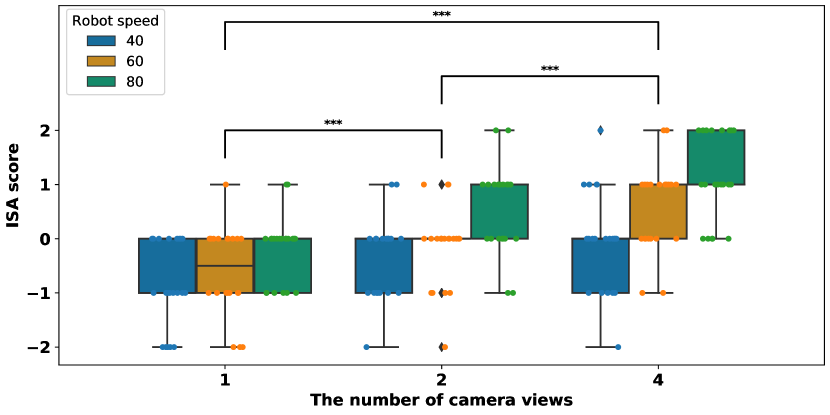
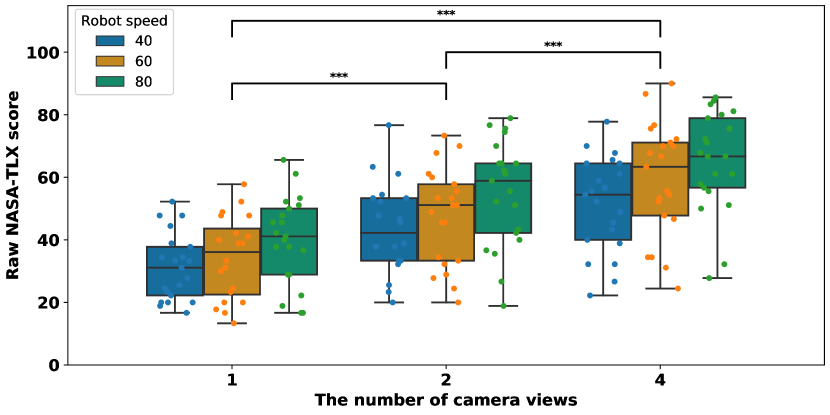
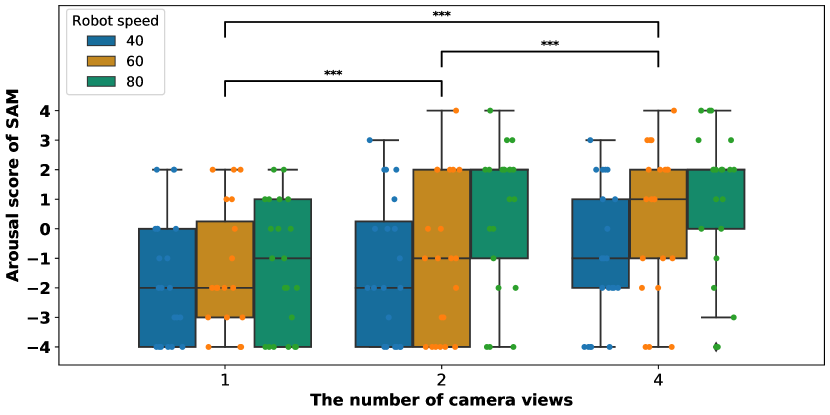
We conducted a two-way repeated-measures analysis of variance (rmANOVA) to validate the effects of the two within-subjects factors on participants’ cognitive and emotional states. The within-subjects factors are robot speed and the number of camera views (e.g., Robot_speed and Camera_number). We used Greenhouse-Geisser correction to adjust for violation of the sphericity assumption [56]. Table V and Figure 10 summarize the results of the rmANOVA based on the type of the subjective questionnaires.
ISA result for measuring cognitive workload: Figure 10(a) illustrates the results of the two-way rmANOVA results of the ISA score reported by the participants, where the string-type score are replaced into a range from -2 to 2, such as Underutilized (-2), Relaxed (-1), Comfortable (0), High (1), and Excessive (2). From the rmANOVA results using participants’ ISA score, we found a main effect of the number of camera views () and the robot speed on the cognitive workload (), but there is no interaction between the two within-subjects factors ().
NASA-TLX results for measuring cognitive workload: Figure10(b) illustrates the results of the two-way rmANOVA results of the raw and weighted NASA-TLX scores. The weights used in the weighted NASA-TLX score are in which the sequence is mental demand, physical demand, temporal demand, performance, effort, and frustration. From the two-way rmANOVA results using participants’ raw and weighted NASA-TLX scores, we found a main effect of the number of the camera views (raw: and weighted: ) and the robot speed on the cognitive workload (raw: and weighted: ), but there is no interaction between the two within-subjects factors (raw: and weighted: ).
SAM scores for measuring emotion state: Figure 10(c) and 10(d) illustrates the results of the two-way rmANOVA results of the SAM scores reported by the participants with a 7-point Likert scale. From the two-way rmANOVA results of participants’ arousal and valence scores in the SAM, we found a main effect of the number of the camera views (arousal: and valence: ) and the robot speed (arousal: and valence: ), and a significant interaction between the two within-subjects factors in the arousal score (), but there is no interaction in the valence score ().
4.3 Classification Evaluation
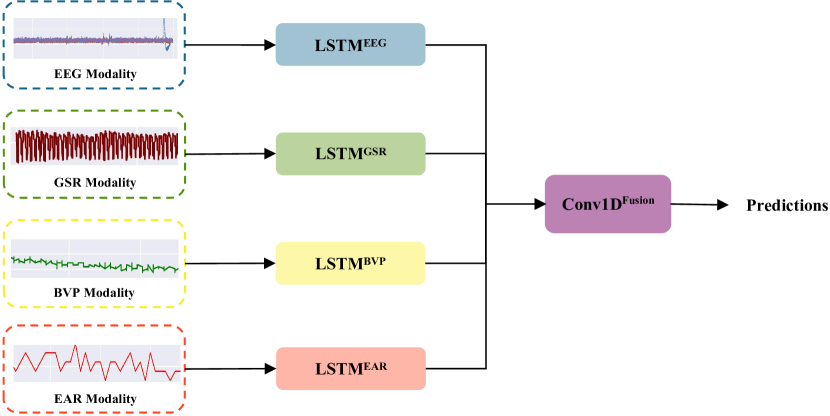
We further provided a three-class cognitive workload classification evaluation for the proposed MOCAS dataset, using the collected raw data of five modalities: EEG, EEG band powers (EEG_POW), EDA (or GSR), BVP, and EAR (see Table III for details). We mapped the subjective cognitive workload annotations from NASA-TLX questionnaires into three categories: scales from 0-40 were mapped to “low”, 40-60 to “medium” and 60-100 to “high”. We utilized a Long Short-Term Memory network (LSTM) [57] for unimodal classification, i.e., only using one modality as the input. We also adopted a Late-Fusion Long Short-Term Memory network (LF-LSTM) [58, 59] for multimodal fusion classification, i.e., using multiple modalities as the input. As depicted in Figure 11, in our LF-LSTM model, the raw signals from each modality firstly were passed through an LSTM network to generate time-related local features. Then the processed local features of all modalities were then concatenated and fed to a one-dimension convolutional neural network (CNN) to produce predictions. Information on the access to the code of our used LF-LSTM can be found in the Section Code Availability.
The mean and standard deviation values of the three-class accuracy of unimodal and multimodal fusion classification in the K-fold cross-validation (K=5) scheme are reported in Table VI. The highest classification accuracy reaches , supporting the high quality of utilized data in the MOCAS. Then we conducted an independent two sample t-test to compare the classification results of different modalities.
| Input Modality | Accuracy | |||
|---|---|---|---|---|
| Modality name | Frequency | Channel Number | Mean | Std |
| Fused | N/A | N/A | 74.68 | 7.76 |
| EEG | 128 | 5 | 48.25 | 10.23 |
| EEG_POW | 8 | 25 | 63.26 | 4.48 |
| GSR | 6 | 1 | 41.82 | 5.27 |
| BVP | 128 | 1 | 32.22 | 6.94 |
| EAR | 1 | 1 | 46.73 | 8.86 |
Generally, unimodal cognitive workload recognition using EEG_POW modality performs significantly better than using EAR modality (), EEG modality () and other single modalities (). EEG-related modalities, including EEG and EEG_POW, perform well since EEG signals correspond more directly to different brain activities under different workload levels [60]. Compared with EEG modality, EEG_POW modality decomposes the raw EEG signals into component frequency bands, whose features are more intuitive and have fewer noises, leading to better classification results [61]. Moreover, EAR modality also achieves reasonable performance, we owe this to the fact that when facing different monitoring task levels where different numbers of camera views and robot speed, eye movements of participants would change correspondingly. Furthermore, classification using multimodal fusion significantly achieves better performance than using EEG_POW () and any other single modalities (). This reflects the benefits of the multi-modal fusion mentioned in Section Background and Summary.
In addition, much as the methods, i.e., LSTM and LF-LSTM, utilized for classification using data from MOCAS reach sound performance, there is still much room for improvement, such as adoption of more advanced classification models [62, 63], data preprocessing and awareness of individual differences.
5 Dataset access
In order to protect the sensitive data and privacy of human subjects (e.g., physiological signals and facial views), only authorized researchers who consent to the End User License Agreement (EULA) are allowed to download the MOCAS. The researchers who want to access the MOCAS should visit our website and download the ELUA document; https://polytechnic.purdue.edu/ahmrs/dataset. After reviewing and filling the document up, they should email it to info@smart-laboratory.org and then request the access through Zenodo (https://zenodo.org/). Then, our research group will review and grant their access to our Zenodo repository having the downsampled MOCAS dataset, subjective information, and supplementary codes used in this paper. For sharing the raw dataset, we will sequentially invite their email address used in the Zenodo and the EULA document to access raw dataset uploaded on an additional repository (Purdue BOX, https://purdue.box.com/v/mocas-dataset), due to huge size of the raw dataset.
5.1 Limitations of the Physiological and Behavioral Signals
For the physiological signals, the commercial wearable biosensors used in this dataset tend to easily have unknown noises influenced by the participant’s movement. There are available open-source libraries to remove common noises for the biosensors, such as NeuroKit2 [64], pyphysio [65] and BioSPPy [66]. The downsampled CVS files of our dataset were cleaned using the NeuroKit2 to remove the noises from the BVP and GSR signals.
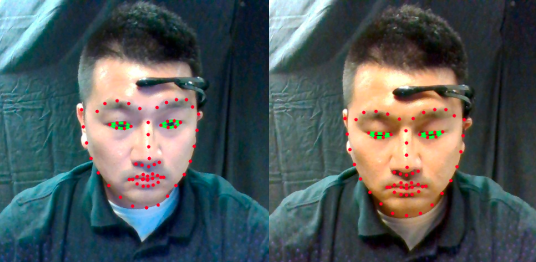
For the behavioral data, the MOCAS has only 15 of 21 participants’ behavioral features extracted from the front facial videos of those who did not wear the facial mask and who agreed to share their data with the public. The facial landmarks (e.g., AUs) were extracted using the pre-trained object detector with HOG (Histogram of Oriented Gradients) and SVM (Support Vector Machines) with a linear core [67], and eye features (e.g., EAR) were calculated based on the eye features of the facial landmarks.
5.2 Missing data
There are two missing files as below since Participant 2 (P2) discontinued experiments due to personal reasons.
-
•
-
•
Also, 1 of 187 files does not include the Emotive Insight data due to unexpected sensor disconnection;
-
•
.
5.3 Code availability
The code utilized for data format converting (ROSbag2 to CSV) and preprocessing with the code of LSTM and LF-LSTM used for classification validation is included in the supplementary_code file of the dataset repository. Additionally, a command-line tool of the ROS2 middleware for replaying the ROSbag2 format files using the command of ros2 bag play {rosbag2_file_name} or rqt_bag is also available there.
6 Conclusion
We proposed a new multimodal dataset for human cognitive workload. The dataset includes physiological signals and behavioral features measured from 21 human subjects conducting the generalized CCTV monitoring task with a real multi-robot system. The physiological signals are acquired by the two wearable sensors, such as EEG, PPG, GSR, HR, IBI, SKT, and motion data. The behavioral features include eye ratios, facial expression, and facial action units extracted from a facial view of the webcam. The proposed dataset consists of raw and downsampled data, a summary of the participants’ information, and the results of the subjective questionnaires. The total size of the raw dataset is about 722.4 GB, including 754 rosbag2 files. For the downsampled dataset, ’.csv’ (Comma Separated Value) and ’.pkl’ (Pickle) file formats were converted from raw datasets with sampling rates of 100 Hz. The size was 51.9 GB and 32.8 GB respectively. We also validated the quality of the dataset by analyzing the correlation between personality traits, physiological signals and behavioral features, evaluating the effects of within-subjects factors on the results of the questionnaires presented to subjects, and applying an LF-LSTM to classify the three-class cognitive workload classifications. As a result, we found that there are significant differences in factors within subjects (e.g., the number of camera views and robot speed) using statistical analysis, and also showed that the classification performance of the multimodal dataset outperforms that of the single-modal dataset through deep learning methods.
Additionally, we made the MOCAS dataset publicly available by uploading the dataset to the online repositories and codes used in this dataset. We hope that the proposed dataset can become a fundamental resource for other researchers to develop systems and algorithms in human cognitive workloads.
Acknowledgements
This material is based upon work supported by the National Science Foundation under Grant No. IIS-1846221. Any opinions, findings, and conclusions or recommendations expressed in this material are those of the author(s) and do not necessarily reflect the views of the National Science Foundation.
References
- [1] J. A. Adams, “Critical considerations for human-robot interface development,” in Proceedings of 2002 AAAI Fall Symposium, 2002, pp. 1–8.
- [2] C. D. Wickens, “Multiple resources and performance prediction,” Theoretical issues in ergonomics science, vol. 3, no. 2, pp. 159–177, 2002.
- [3] B. Cain, “A review of the mental workload literature,” 2007.
- [4] S. P. Marshall, “The index of cognitive activity: Measuring cognitive workload,” in Proceedings of the IEEE 7th conference on Human Factors and Power Plants. IEEE, 2002, pp. 7–7.
- [5] C. J. Patten, A. Kircher, J. Östlund, L. Nilsson, and O. Svenson, “Driver experience and cognitive workload in different traffic environments,” Accident Analysis & Prevention, vol. 38, no. 5, pp. 887–894, 2006.
- [6] C. J. Patten, A. Kircher, J. Östlund, and L. Nilsson, “Using mobile telephones: cognitive workload and attention resource allocation,” Accident analysis & prevention, vol. 36, no. 3, pp. 341–350, 2004.
- [7] M. A. Just, P. A. Carpenter, and A. Miyake, “Neuroindices of cognitive workload: Neuroimaging, pupillometric and event-related potential studies of brain work,” Theoretical Issues in Ergonomics Science, vol. 4, no. 1-2, pp. 56–88, 2003.
- [8] M. Pomplun and S. Sunkara, “Pupil dilation as an indicator of cognitive workload in human-computer interaction,” in Proceedings of the International Conference on HCI, vol. 273. Citeseer, 2003.
- [9] T. Mina, S. S. Kannan, W. Jo, and B.-C. Min, “Adaptive workload allocation for multi-human multi-robot teams for independent and homogeneous tasks,” IEEE Access, vol. 8, pp. 152 697–152 712, 2020.
- [10] S. G. Hart and L. E. Staveland, “Development of nasa-tlx (task load index): Results of empirical and theoretical research,” in Advances in psychology. Elsevier, 1988, vol. 52, pp. 139–183.
- [11] E. Debie, R. F. Rojas, J. Fidock, M. Barlow, K. Kasmarik, S. Anavatti, M. Garratt, and H. A. Abbass, “Multimodal fusion for objective assessment of cognitive workload: a review,” IEEE transactions on cybernetics, vol. 51, no. 3, pp. 1542–1555, 2019.
- [12] F. Chen, N. Ruiz, E. Choi, J. Epps, M. A. Khawaja, R. Taib, B. Yin, and Y. Wang, “Multimodal behavior and interaction as indicators of cognitive load,” ACM Transactions on Interactive Intelligent Systems (TiiS), vol. 2, no. 4, pp. 1–36, 2013.
- [13] E. B. Coffey, A.-M. Brouwer, and J. B. van Erp, “Measuring workload using a combination of electroencephalography and near infrared spectroscopy,” in Proceedings of the Human Factors and Ergonomics Society Annual Meeting, vol. 56, no. 1. Sage Publications Sage CA: Los Angeles, CA, 2012, pp. 1822–1826.
- [14] F. Putze, S. Hesslinger, C.-Y. Tse, Y. Huang, C. Herff, C. Guan, and T. Schultz, “Hybrid fnirs-eeg based classification of auditory and visual perception processes,” Frontiers in neuroscience, p. 373, 2014.
- [15] Y. Liu, H. Ayaz, and P. A. Shewokis, “Mental workload classification with concurrent electroencephalography and functional near-infrared spectroscopy,” Brain-Computer Interfaces, vol. 4, no. 3, pp. 175–185, 2017.
- [16] ——, “Multisubject “learning” for mental workload classification using concurrent eeg, fnirs, and physiological measures,” Frontiers in human neuroscience, vol. 11, p. 389, 2017.
- [17] J. Son, H. Oh, and M. Park, “Identification of driver cognitive workload using support vector machines with driving performance, physiology and eye movement in a driving simulator,” International Journal of Precision Engineering and Manufacturing, vol. 14, no. 8, pp. 1321–1327, 2013.
- [18] M. S. Hussain, R. A. Calvo, and F. Chen, “Automatic cognitive load detection from face, physiology, task performance and fusion during affective interference,” Interacting with computers, vol. 26, no. 3, pp. 256–268, 2014.
- [19] K. Z. Gajos and K. Chauncey, “The influence of personality traits and cognitive load on the use of adaptive user interfaces,” in Proceedings of the 22nd International Conference on Intelligent User Interfaces, 2017, pp. 301–306.
- [20] M. Gjoreski, T. Kolenik, T. Knez, M. Luštrek, M. Gams, H. Gjoreski, and V. Pejović, “Datasets for cognitive load inference using wearable sensors and psychological traits,” Applied Sciences, vol. 10, no. 11, p. 3843, 2020.
- [21] D. H. Wigboldus, J. W. Sherman, H. L. Franzese, and A. v. Knippenberg, “Capacity and comprehension: Spontaneous stereotyping under cognitive load,” Social Cognition, vol. 22, no. 3, pp. 292–309, 2004.
- [22] K. Fraser, I. Ma, E. Teteris, H. Baxter, B. Wright, and K. McLaughlin, “Emotion, cognitive load and learning outcomes during simulation training,” Medical education, vol. 46, no. 11, pp. 1055–1062, 2012.
- [23] L. F. Van Dillen, D. J. Heslenfeld, and S. L. Koole, “Tuning down the emotional brain: an fmri study of the effects of cognitive load on the processing of affective images,” Neuroimage, vol. 45, no. 4, pp. 1212–1219, 2009.
- [24] J. L. Plass and S. Kalyuga, “Four ways of considering emotion in cognitive load theory,” Educational Psychology Review, vol. 31, no. 2, pp. 339–359, 2019.
- [25] W. Lim, O. Sourina, and L. P. Wang, “Stew: Simultaneous task eeg workload data set,” IEEE Transactions on Neural Systems and Rehabilitation Engineering, vol. 26, no. 11, pp. 2106–2114, 2018.
- [26] N. J. McDonald and W. Soussou, “Quasar’s qstates cognitive gauge performance in the cognitive state assessment competition 2011,” in 2011 Annual International Conference of the IEEE Engineering in Medicine and Biology Society. IEEE, 2011, pp. 6542–6546.
- [27] I. Albuquerque, A. Tiwari, M. Parent, R. Cassani, J.-F. Gagnon, D. Lafond, S. Tremblay, and T. H. Falk, “Wauc: a multi-modal database for mental workload assessment under physical activity,” Frontiers in Neuroscience, p. 1037, 2020.
- [28] S. Schneegass, B. Pfleging, N. Broy, F. Heinrich, and A. Schmidt, “A data set of real world driving to assess driver workload,” in Proceedings of the 5th international conference on automotive user interfaces and interactive vehicular applications, 2013, pp. 150–157.
- [29] W.-K. Beh, Y.-H. Wu et al., “Maus: A dataset for mental workload assessmenton n-back task using wearable sensor,” arXiv preprint arXiv:2111.02561, 2021.
- [30] I. Mijić, M. Šarlija, and D. Petrinović, “Mmod-cog: A database for multimodal cognitive load classification,” in 2019 11th international symposium on image and signal processing and analysis (ispa). IEEE, 2019, pp. 15–20.
- [31] S. M. Jaeggi, M. Buschkuehl, J. Jonides, and W. J. Perrig, “Improving fluid intelligence with training on working memory,” Proceedings of the National Academy of Sciences, vol. 105, no. 19, pp. 6829–6833, 2008.
- [32] A. M. Owen, K. M. McMillan, A. R. Laird, and E. Bullmore, “N-back working memory paradigm: A meta-analysis of normative functional neuroimaging studies,” Human brain mapping, vol. 25, no. 1, pp. 46–59, 2005.
- [33] T. Vyvey, E. N. Castellar, and J. Van Looy, “Loaded with fun? the impact of enjoyment and cognitive load on brand retention in digital games,” Journal of Interactive Advertising, vol. 18, no. 1, pp. 72–82, 2018.
- [34] S. Kalyuga and J. L. Plass, “Evaluating and managing cognitive load in games,” in Handbook of research on effective electronic gaming in education. IGI Global, 2009, pp. 719–737.
- [35] N. Jakobi, P. Husbands, and I. Harvey, “Noise and the reality gap: The use of simulation in evolutionary robotics,” in European Conference on Artificial Life. Springer, 1995, pp. 704–720.
- [36] C. Jordan and S. Brennen, “Instantaneous self-assessment of workload technique (isa),” Defence Research Agency, Portsmouth, 1992.
- [37] M. M. Bradley and P. J. Lang, “Measuring emotion: the self-assessment manikin and the semantic differential,” Journal of behavior therapy and experimental psychiatry, vol. 25, no. 1, pp. 49–59, 1994.
- [38] D. N. Jackson and P. F. Tremblay, “The six factor personality questionnaire.” 2002.
- [39] V. Markova, T. Ganchev, and K. Kalinkov, “Clas: A database for cognitive load, affect and stress recognition,” in 2019 International Conference on Biomedical Innovations and Applications (BIA). IEEE, 2019, pp. 1–4.
- [40] Z. Huang, L. Wang, G. Blaney, C. Slaughter, D. McKeon, Z. Zhou, R. J. K. Jacob, and M. C. Hughes, “The tufts fnirs mental workload dataset & benchmark for brain-computer interfaces that generalize,” in Proceedings of the Neural Information Processing Systems (NeurIPS) Track on Datasets and Benchmarks, 2021. [Online]. Available: https://openreview.net/pdf?id=QzNHE7QHhut
- [41] K.-R. Müller, M. Tangermann, G. Dornhege, M. Krauledat, G. Curio, and B. Blankertz, “Machine learning for real-time single-trial eeg-analysis: from brain–computer interfacing to mental state monitoring,” Journal of neuroscience methods, vol. 167, no. 1, pp. 82–90, 2008.
- [42] R. Wang and B. Fang, “Affective computing and biometrics based hci surveillance system,” in 2008 international symposium on information science and engineering, vol. 1. IEEE, 2008, pp. 192–195.
- [43] J.-M. Hoc and M.-P. Lemoine, “Cognitive evaluation of human-human and human-machine cooperation modes in air traffic control,” The International Journal of Aviation Psychology, vol. 8, no. 1, pp. 1–32, 1998.
- [44] M. Pacaux-Lemoine and S. Debernard, “Common work space for human–machine cooperation in air traffic control,” Control Engineering Practice, vol. 10, no. 5, pp. 571–576, 2002.
- [45] L. Giraudet, J.-P. Imbert, M. Berenger, S. Tremblay, and M. Causse, “The neuroergonomic evaluation of human machine interface design in air traffic control using behavioral and eeg/erp measures,” Behavioural brain research, vol. 294, pp. 246–253, 2015.
- [46] Y. Liu, R. Feyen, and O. Tsimhoni, “Queueing network-model human processor (qn-mhp) a computational architecture for multitask performance in human-machine systems,” ACM Transactions on Computer-Human Interaction (TOCHI), vol. 13, no. 1, pp. 37–70, 2006.
- [47] K. Stowers, J. Oglesby, S. Sonesh, K. Leyva, C. Iwig, and E. Salas, “A framework to guide the assessment of human–machine systems,” Human factors, vol. 59, no. 2, pp. 172–188, 2017.
- [48] W. Jo, J. Kim, R. Wang, J. Pan, R. K. Senthilkumaran, and B.-C. Min, “Smartmbot: A ros2-based low-cost and open-source mobile robot platform,” arXiv preprint arXiv:2203.08903, 2022.
- [49] W. Jo, S. S. Kannan, G.-E. Cha, A. Lee, and B.-C. Min, “ROSbag-based multimodal affective dataset for emotional and cognitive states,” in 2020 IEEE International Conference on Systems, Man, and Cybernetics (SMC). IEEE, 2020, pp. 226–233.
- [50] L. R. Goldberg, “An alternative” description of personality”: the big-five factor structure.” Journal of personality and social psychology, vol. 59, no. 6, p. 1216, 1990.
- [51] G. Van Rossum, “pickle — python object serialization — python 3.10.5 documentation,” 2020. [Online]. Available: https://docs.python.org/3/library/pickle.html
- [52] Y.-I. Tian, T. Kanade, and J. F. Cohn, “Recognizing action units for facial expression analysis,” IEEE Transactions on pattern analysis and machine intelligence, vol. 23, no. 2, pp. 97–115, 2001.
- [53] N. Boyko, O. Basystiuk, and N. Shakhovska, “Performance evaluation and comparison of software for face recognition, based on dlib and opencv library,” in 2018 IEEE Second International Conference on Data Stream Mining & Processing (DSMP). IEEE, 2018, pp. 478–482.
- [54] S. Mehta, S. Dadhich, S. Gumber, and A. Jadhav Bhatt, “Real-time driver drowsiness detection system using eye aspect ratio and eye closure ratio,” in Proceedings of international conference on sustainable computing in science, technology and management (SUSCOM), Amity University Rajasthan, Jaipur-India, 2019.
- [55] D. Freedman, R. Pisani, and R. Purves, “Statistics (international student edition),” Pisani, R. Purves, 4th edn. WW Norton & Company, New York, 2007.
- [56] B. J. Winer, “Statistical principles in experimental design.(2d ed.) new york,” St. Louis, San Francisco: McGraw, 1971.
- [57] A. Graves, “Long short-term memory,” Supervised sequence labelling with recurrent neural networks, pp. 37–45, 2012.
- [58] Y.-H. H. Tsai, S. Bai, P. P. Liang, J. Z. Kolter, L.-P. Morency, and R. Salakhutdinov, “Multimodal transformer for unaligned multimodal language sequences,” in Proceedings of the conference. Association for Computational Linguistics. Meeting, vol. 2019. NIH Public Access, 2019, p. 6558.
- [59] N. Xu, A.-A. Liu, Y. Wong, Y. Zhang, W. Nie, Y. Su, and M. Kankanhalli, “Dual-stream recurrent neural network for video captioning,” IEEE Transactions on Circuits and Systems for Video Technology, vol. 29, no. 8, pp. 2482–2493, 2018.
- [60] P. Antonenko, F. Paas, R. Grabner, and T. Van Gog, “Using electroencephalography to measure cognitive load,” Educational psychology review, vol. 22, no. 4, pp. 425–438, 2010.
- [61] J. N. Saby and P. J. Marshall, “The utility of eeg band power analysis in the study of infancy and early childhood,” Developmental neuropsychology, vol. 37, no. 3, pp. 253–273, 2012.
- [62] A. Vaswani, N. Shazeer, N. Parmar, J. Uszkoreit, L. Jones, A. N. Gomez, Ł. Kaiser, and I. Polosukhin, “Attention is all you need,” Advances in neural information processing systems, vol. 30, 2017.
- [63] J. Zhou, G. Cui, S. Hu, Z. Zhang, C. Yang, Z. Liu, L. Wang, C. Li, and M. Sun, “Graph neural networks: A review of methods and applications,” AI Open, vol. 1, pp. 57–81, 2020.
- [64] D. Makowski, T. Pham, Z. J. Lau, J. C. Brammer, F. Lespinasse, H. Pham, C. Schölzel, and S. H. A. Chen, “NeuroKit2: A python toolbox for neurophysiological signal processing,” Behavior Research Methods, vol. 53, no. 4, pp. 1689–1696, feb 2021. [Online]. Available: https://doi.org/10.3758%2Fs13428-020-01516-y
- [65] A. Bizzego, A. Battisti, G. Gabrieli, G. Esposito, and C. Furlanello, “pyphysio: A physiological signal processing library for data science approaches in physiology,” SoftwareX, vol. 10, p. 100287, 2019.
- [66] C. Carreiras, A. P. Alves, A. Lourenço, F. Canento, H. Silva, A. Fred et al., “BioSPPy: Biosignal processing in Python,” 2015–, [Online]. [Online]. Available: https://github.com/PIA-Group/BioSPPy/
- [67] V. Kazemi and J. Sullivan, “One millisecond face alignment with an ensemble of regression trees,” in Proceedings of the IEEE conference on computer vision and pattern recognition, 2014, pp. 1867–1874.
![[Uncaptioned image]](/html/2210.03065/assets/Bio_Figures/Wonse_Jo.png) |
Wonse Jo received the B.S. in robotics engineering from Hoseo University, South Korea in 2013 and M.S. degrees in electronic engineering from the Kyung-Hee University, South Korea, in 2015. He is currently pursuing the Ph.D. degree in computer and information technology at Purdue University, West Lafayette, IN, USA. His research interests includes affective robotics/computing, human multi-robot interaction, environmental robotics, and field robotics |
![[Uncaptioned image]](/html/2210.03065/assets/Bio_Figures/Ruiqi_Wang.jpg) |
Ruiqi Wang (Student Member, IEEE) received a B.E. degree in robotics engineering from Beijing University of Chemical Technology, Beijing, China, in 2020. He is currently working towards the PhD degree in the Department of Computer and Information Technology at Purdue University, West Lafayette, IN, USA. His research interests include human-robot interaction, affective robotics and human-in-the-loop deep learning. |
![[Uncaptioned image]](/html/2210.03065/assets/Bio_Figures/Su_Sun.png) |
Su Sun received a B.E. degree in digital media technology from North China University of Technology, Beijing, China, in 2019. She is currently working towards the PhD degree in the Department of Computer and Information Technology at Purdue University, West Lafayette, IN, USA. Her research interests include deep learning & 3D geometry, SLAM, and 3D reconstruction. |
![[Uncaptioned image]](/html/2210.03065/assets/Bio_Figures/Revanth_Krishna_Senthilkumaran.jpg) |
Revanth Krishna Senthilkumaran is currently an undergraduate student in the Department of Electrical and Computer Engineering at Purdue University, West Lafayette, IN, USA. His research interests include human-robot interaction, embedded electronics, robot dynamics, and unmanned aerial systems. |
![[Uncaptioned image]](/html/2210.03065/assets/Bio_Figures/CURRENT-Dan-Foti.jpg) |
Daniel Foti received his A.B. in Biomedical Engineering from Harvard University in 2006. He received his Ph.D. in Clinical Psychology from Stony Brook University in 2013. He has been a faculty member in the Department of Psychological Sciences at Purdue University since 2013. His research uses psychophysiological methods to understand cognition and affect. |
![[Uncaptioned image]](/html/2210.03065/assets/Bio_Figures/Byung-Cheol_Min.jpg) |
Byung-Cheol Min (Member, IEEE) received a B.S. degree in electronics engineering and a M.S. degree in electronics and radio engineering from Kyung Hee University, Yongin, South Korea, in 2008 and 2010, respectively, and a Ph.D. degree in technology with a specialization in robotics from Purdue University, West Lafayette, IN, USA, in 2014. He is currently an Associate Professor and University Faculty Scholar with the Department of Computer and Information Technology and the Director of the SMART Laboratory, Purdue University. Prior to this position, he was a Postdoctoral Fellow with the Robotics Institute, Carnegie Mellon University, Pittsburgh, PA, USA. His research interests include multi-robot systems, human–robot interaction, robot design and control, with applications in field robotics, and assistive technology and robotics. He was a recipient of the NSF CAREER Award, in 2019; the Purdue PPI Outstanding Faculty in Discovery Award, in 2019; the Purdue CIT Outstanding Graduate Mentor Award, in 2019; the Purdue Focus Award, in 2020; the Purdue PPI Interdisciplinary Research Collaboration Award, in 2021; the Purdue Corps of Engagement Award, in 2022. He was named a Purdue University Faculty Scholar, in 2021. |