Now at ]Department of Chemistry and Chemical Technology, Bronx Community College, Bronx, New York 10453Now at ]Department of Physics and Astronomy, University of Rochester, Rochester, New York 14627Now at ]Department of Physics and Astronomy, Louisiana State University, Baton Rouge, LA 70803
The Daya Bay Collaboration
Improved Measurement of the Evolution of the Reactor Antineutrino Flux and Spectrum at Daya Bay
F. P. An
Sun Yat-Sen (Zhongshan) University, Guangzhou
W. D. Bai
Sun Yat-Sen (Zhongshan) University, Guangzhou
A. B. Balantekin
University of Wisconsin, Madison, Wisconsin 53706
M. Bishai
Brookhaven National Laboratory, Upton, New York 11973
S. Blyth
Department of Physics, National Taiwan University, Taipei
G. F. Cao
Institute of High Energy Physics, Beijing
J. Cao
Institute of High Energy Physics, Beijing
J. F. Chang
Institute of High Energy Physics, Beijing
Y. Chang
National United University, Miao-Li
H. S. Chen
Institute of High Energy Physics, Beijing
H. Y. Chen
Department of Engineering Physics, Tsinghua University, Beijing
S. M. Chen
Department of Engineering Physics, Tsinghua University, Beijing
Y. Chen
Shenzhen University, Shenzhen
Sun Yat-Sen (Zhongshan) University, Guangzhou
Y. X. Chen
North China Electric Power University, Beijing
J. Cheng
North China Electric Power University, Beijing
J. Cheng
North China Electric Power University, Beijing
Y.-C. Cheng
Department of Physics, National Taiwan University, Taipei
Z. K. Cheng
Sun Yat-Sen (Zhongshan) University, Guangzhou
J. J. Cherwinka
University of Wisconsin, Madison, Wisconsin 53706
M. C. Chu
Chinese University of Hong Kong, Hong Kong
J. P. Cummings
Siena College, Loudonville, New York 12211
O. Dalager
Department of Physics and Astronomy, University of California, Irvine, California 92697
F. S. Deng
University of Science and Technology of China, Hefei
Y. Y. Ding
Institute of High Energy Physics, Beijing
M. V. Diwan
Brookhaven National Laboratory, Upton, New York 11973
T. Dohnal
Charles University, Faculty of Mathematics and Physics, Prague
D. Dolzhikov
Joint Institute for Nuclear Research, Dubna, Moscow Region
J. Dove
Department of Physics, University of Illinois at Urbana-Champaign, Urbana, Illinois 61801
K. V. Dugas
Department of Physics and Astronomy, University of California, Irvine, California 92697
H. Y. Duyang
Shandong University, Jinan
D. A. Dwyer
Lawrence Berkeley National Laboratory, Berkeley, California 94720
J. P. Gallo
Department of Physics, Illinois Institute of Technology, Chicago, Illinois 60616
M. Gonchar
Joint Institute for Nuclear Research, Dubna, Moscow Region
G. H. Gong
Department of Engineering Physics, Tsinghua University, Beijing
H. Gong
Department of Engineering Physics, Tsinghua University, Beijing
W. Q. Gu
Brookhaven National Laboratory, Upton, New York 11973
J. Y. Guo
Sun Yat-Sen (Zhongshan) University, Guangzhou
L. Guo
Department of Engineering Physics, Tsinghua University, Beijing
X. H. Guo
Beijing Normal University, Beijing
Y. H. Guo
Department of Nuclear Science and Technology, School of Energy and Power Engineering, Xi’an Jiaotong University, Xi’an
Z. Guo
Department of Engineering Physics, Tsinghua University, Beijing
R. W. Hackenburg
Brookhaven National Laboratory, Upton, New York 11973
Y. Han
Sun Yat-Sen (Zhongshan) University, Guangzhou
S. Hans
[
Brookhaven National Laboratory, Upton, New York 11973
M. He
Institute of High Energy Physics, Beijing
K. M. Heeger
Wright Laboratory and Department of Physics, Yale University, New Haven, Connecticut 06520
Y. K. Heng
Institute of High Energy Physics, Beijing
Y. K. Hor
Sun Yat-Sen (Zhongshan) University, Guangzhou
Y. B. Hsiung
Department of Physics, National Taiwan University, Taipei
B. Z. Hu
Department of Physics, National Taiwan University, Taipei
J. R. Hu
Institute of High Energy Physics, Beijing
T. Hu
Institute of High Energy Physics, Beijing
Z. J. Hu
Sun Yat-Sen (Zhongshan) University, Guangzhou
H. X. Huang
China Institute of Atomic Energy, Beijing
J. H. Huang
Institute of High Energy Physics, Beijing
X. T. Huang
Shandong University, Jinan
Y. B. Huang
Guangxi University, No.100 Daxue East Road, Nanning
P. Huber
Center for Neutrino Physics, Virginia Tech, Blacksburg, Virginia 24061
D. E. Jaffe
Brookhaven National Laboratory, Upton, New York 11973
K. L. Jen
Institute of Physics, National Chiao-Tung University, Hsinchu
X. L. Ji
Institute of High Energy Physics, Beijing
X. P. Ji
Brookhaven National Laboratory, Upton, New York 11973
R. A. Johnson
Department of Physics, University of Cincinnati, Cincinnati, Ohio 45221
D. Jones
Department of Physics, College of Science and Technology, Temple University, Philadelphia, Pennsylvania 19122
L. Kang
Dongguan University of Technology, Dongguan
S. H. Kettell
Brookhaven National Laboratory, Upton, New York 11973
S. Kohn
Department of Physics, University of California, Berkeley, California 94720
M. Kramer
Lawrence Berkeley National Laboratory, Berkeley, California 94720
Department of Physics, University of California, Berkeley, California 94720
T. J. Langford
Wright Laboratory and Department of Physics, Yale University, New Haven, Connecticut 06520
J. Lee
Lawrence Berkeley National Laboratory, Berkeley, California 94720
J. H. C. Lee
Department of Physics, The University of Hong Kong, Pokfulam, Hong Kong
R. T. Lei
Dongguan University of Technology, Dongguan
R. Leitner
Charles University, Faculty of Mathematics and Physics, Prague
J. K. C. Leung
Department of Physics, The University of Hong Kong, Pokfulam, Hong Kong
F. Li
Institute of High Energy Physics, Beijing
H. L. Li
Institute of High Energy Physics, Beijing
J. J. Li
Department of Engineering Physics, Tsinghua University, Beijing
Q. J. Li
Institute of High Energy Physics, Beijing
R. H. Li
Institute of High Energy Physics, Beijing
S. Li
Dongguan University of Technology, Dongguan
S. C. Li
Center for Neutrino Physics, Virginia Tech, Blacksburg, Virginia 24061
W. D. Li
Institute of High Energy Physics, Beijing
X. N. Li
Institute of High Energy Physics, Beijing
X. Q. Li
School of Physics, Nankai University, Tianjin
Y. F. Li
Institute of High Energy Physics, Beijing
Z. B. Li
Sun Yat-Sen (Zhongshan) University, Guangzhou
H. Liang
University of Science and Technology of China, Hefei
C. J. Lin
Lawrence Berkeley National Laboratory, Berkeley, California 94720
G. L. Lin
Institute of Physics, National Chiao-Tung University, Hsinchu
S. Lin
Dongguan University of Technology, Dongguan
J. J. Ling
Sun Yat-Sen (Zhongshan) University, Guangzhou
J. M. Link
Center for Neutrino Physics, Virginia Tech, Blacksburg, Virginia 24061
L. Littenberg
Brookhaven National Laboratory, Upton, New York 11973
B. R. Littlejohn
Department of Physics, Illinois Institute of Technology, Chicago, Illinois 60616
J. C. Liu
Institute of High Energy Physics, Beijing
J. L. Liu
Department of Physics and Astronomy, Shanghai Jiao Tong University, Shanghai Laboratory for Particle Physics and Cosmology, Shanghai
J. X. Liu
Institute of High Energy Physics, Beijing
C. Lu
Joseph Henry Laboratories, Princeton University, Princeton, New Jersey 08544
H. Q. Lu
Institute of High Energy Physics, Beijing
K. B. Luk
Department of Physics, University of California, Berkeley, California 94720
Lawrence Berkeley National Laboratory, Berkeley, California 94720
The Hong Kong University of Science and Technology, Clear Water Bay, Hong Kong
B. Z. Ma
Shandong University, Jinan
X. B. Ma
North China Electric Power University, Beijing
X. Y. Ma
Institute of High Energy Physics, Beijing
Y. Q. Ma
Institute of High Energy Physics, Beijing
R. C. Mandujano
Department of Physics and Astronomy, University of California, Irvine, California 92697
C. Marshall
[
Lawrence Berkeley National Laboratory, Berkeley, California 94720
K. T. McDonald
Joseph Henry Laboratories, Princeton University, Princeton, New Jersey 08544
R. D. McKeown
California Institute of Technology, Pasadena, California 91125
College of William and Mary, Williamsburg, Virginia 23187
Y. Meng
Department of Physics and Astronomy, Shanghai Jiao Tong University, Shanghai Laboratory for Particle Physics and Cosmology, Shanghai
J. Napolitano
Department of Physics, College of Science and Technology, Temple University, Philadelphia, Pennsylvania 19122
D. Naumov
Joint Institute for Nuclear Research, Dubna, Moscow Region
E. Naumova
Joint Institute for Nuclear Research, Dubna, Moscow Region
T. M. T. Nguyen
Institute of Physics, National Chiao-Tung University, Hsinchu
J. P. Ochoa-Ricoux
Department of Physics and Astronomy, University of California, Irvine, California 92697
A. Olshevskiy
Joint Institute for Nuclear Research, Dubna, Moscow Region
J. Park
Center for Neutrino Physics, Virginia Tech, Blacksburg, Virginia 24061
S. Patton
Lawrence Berkeley National Laboratory, Berkeley, California 94720
J. C. Peng
Department of Physics, University of Illinois at Urbana-Champaign, Urbana, Illinois 61801
C. S. J. Pun
Department of Physics, The University of Hong Kong, Pokfulam, Hong Kong
F. Z. Qi
Institute of High Energy Physics, Beijing
M. Qi
Nanjing University, Nanjing
X. Qian
Brookhaven National Laboratory, Upton, New York 11973
N. Raper
Sun Yat-Sen (Zhongshan) University, Guangzhou
J. Ren
China Institute of Atomic Energy, Beijing
C. Morales Reveco
Department of Physics and Astronomy, University of California, Irvine, California 92697
R. Rosero
Brookhaven National Laboratory, Upton, New York 11973
B. Roskovec
Charles University, Faculty of Mathematics and Physics, Prague
X. C. Ruan
China Institute of Atomic Energy, Beijing
B. Russell
Lawrence Berkeley National Laboratory, Berkeley, California 94720
H. Steiner
Department of Physics, University of California, Berkeley, California 94720
Lawrence Berkeley National Laboratory, Berkeley, California 94720
J. L. Sun
China General Nuclear Power Group, Shenzhen
T. Tmej
Charles University, Faculty of Mathematics and Physics, Prague
K. Treskov
Joint Institute for Nuclear Research, Dubna, Moscow Region
W.-H. Tse
Chinese University of Hong Kong, Hong Kong
C. E. Tull
Lawrence Berkeley National Laboratory, Berkeley, California 94720
Y. C. Tung
Department of Physics, National Taiwan University, Taipei
B. Viren
Brookhaven National Laboratory, Upton, New York 11973
V. Vorobel
Charles University, Faculty of Mathematics and Physics, Prague
C. H. Wang
National United University, Miao-Li
J. Wang
Sun Yat-Sen (Zhongshan) University, Guangzhou
M. Wang
Shandong University, Jinan
N. Y. Wang
Beijing Normal University, Beijing
R. G. Wang
Institute of High Energy Physics, Beijing
W. Wang
Sun Yat-Sen (Zhongshan) University, Guangzhou
College of William and Mary, Williamsburg, Virginia 23187
X. Wang
College of Electronic Science and Engineering, National University of Defense Technology, Changsha
Y. Wang
Nanjing University, Nanjing
Y. F. Wang
Institute of High Energy Physics, Beijing
Z. Wang
Institute of High Energy Physics, Beijing
Z. Wang
Department of Engineering Physics, Tsinghua University, Beijing
Z. M. Wang
Institute of High Energy Physics, Beijing
H. Y. Wei
[
Brookhaven National Laboratory, Upton, New York 11973
L. H. Wei
Institute of High Energy Physics, Beijing
L. J. Wen
Institute of High Energy Physics, Beijing
K. Whisnant
Iowa State University, Ames, Iowa 50011
C. G. White
Department of Physics, Illinois Institute of Technology, Chicago, Illinois 60616
H. L. H. Wong
Department of Physics, University of California, Berkeley, California 94720
Lawrence Berkeley National Laboratory, Berkeley, California 94720
E. Worcester
Brookhaven National Laboratory, Upton, New York 11973
D. R. Wu
Institute of High Energy Physics, Beijing
Q. Wu
Shandong University, Jinan
W. J. Wu
Institute of High Energy Physics, Beijing
D. M. Xia
Chongqing University, Chongqing
Z. Q. Xie
Institute of High Energy Physics, Beijing
Z. Z. Xing
Institute of High Energy Physics, Beijing
H. K. Xu
Institute of High Energy Physics, Beijing
J. L. Xu
Institute of High Energy Physics, Beijing
T. Xu
Department of Engineering Physics, Tsinghua University, Beijing
T. Xue
Department of Engineering Physics, Tsinghua University, Beijing
C. G. Yang
Institute of High Energy Physics, Beijing
L. Yang
Dongguan University of Technology, Dongguan
Y. Z. Yang
Department of Engineering Physics, Tsinghua University, Beijing
H. F. Yao
Institute of High Energy Physics, Beijing
M. Ye
Institute of High Energy Physics, Beijing
M. Yeh
Brookhaven National Laboratory, Upton, New York 11973
B. L. Young
Iowa State University, Ames, Iowa 50011
H. Z. Yu
Sun Yat-Sen (Zhongshan) University, Guangzhou
Z. Y. Yu
Institute of High Energy Physics, Beijing
B. B. Yue
Sun Yat-Sen (Zhongshan) University, Guangzhou
V. Zavadskyi
Brookhaven National Laboratory, Upton, New York 11973
Joint Institute for Nuclear Research, Dubna, Moscow Region
S. Zeng
Institute of High Energy Physics, Beijing
Y. Zeng
Sun Yat-Sen (Zhongshan) University, Guangzhou
L. Zhan
Institute of High Energy Physics, Beijing
C. Zhang
Brookhaven National Laboratory, Upton, New York 11973
F. Y. Zhang
Department of Physics and Astronomy, Shanghai Jiao Tong University, Shanghai Laboratory for Particle Physics and Cosmology, Shanghai
H. H. Zhang
Sun Yat-Sen (Zhongshan) University, Guangzhou
J. L. Zhang
Nanjing University, Nanjing
J. W. Zhang
Institute of High Energy Physics, Beijing
Q. M. Zhang
Department of Nuclear Science and Technology, School of Energy and Power Engineering, Xi’an Jiaotong University, Xi’an
S. Q. Zhang
Sun Yat-Sen (Zhongshan) University, Guangzhou
X. T. Zhang
Institute of High Energy Physics, Beijing
Y. M. Zhang
Sun Yat-Sen (Zhongshan) University, Guangzhou
Y. X. Zhang
China General Nuclear Power Group, Shenzhen
Y. Y. Zhang
Department of Physics and Astronomy, Shanghai Jiao Tong University, Shanghai Laboratory for Particle Physics and Cosmology, Shanghai
Z. J. Zhang
Dongguan University of Technology, Dongguan
Z. P. Zhang
University of Science and Technology of China, Hefei
Z. Y. Zhang
Institute of High Energy Physics, Beijing
J. Zhao
Institute of High Energy Physics, Beijing
R. Z. Zhao
Institute of High Energy Physics, Beijing
L. Zhou
Institute of High Energy Physics, Beijing
H. L. Zhuang
Institute of High Energy Physics, Beijing
J. H. Zou
Institute of High Energy Physics, Beijing
(October 4, 2022)
Abstract
Reactor neutrino experiments play a crucial role in advancing our knowledge of neutrinos. A precise measurement of reactor electron antineutrino flux and spectrum evolution can be key inputs in improving the knowledge of neutrino mass and mixing as well as reactor nuclear physics and searching for physics beyond the standard model.
In this work, the evolution of the flux and spectrum as a function of the reactor isotopic content is reported in terms of the inverse-beta-decay yield at Daya Bay with 1958 days of data and improved systematic uncertainties.
These measurements are compared with two signature model predictions: the Huber-Mueller model based on the conversion method and the SM2018 model based on the summation method.
The measured average flux and spectrum, as well as their evolution with the isotopic fraction, are inconsistent with the predictions of the Huber-Mueller model.
In contrast, the SM2018 model is shown to agree with the average flux and its evolution but fails to describe the energy spectrum.
Altering the predicted IBD spectrum from fission does not improve the agreement with the measurement for either model.
The models can be brought into better agreement with the measurements if either the predicted spectrum due to fission is changed
or the predicted , , , and spectra are changed in equal measure.
reactor antineutrino anomaly, sterile neutrino, 5 MeV bump, Huber-Mueller Model, Daya Bay
pacs:
14.60.Pq, 29.40.Mc, 28.50.Hw, 13.15.+g
The detection of reactor electron antineutrinos with the inverse-beta-decay (IBD) process plays a crucial role in advancing our knowledge of neutrinos including the discovery of neutrinos Reines and Cowan (1956), establishment of large mixing angle solution of neutrino oscillation Eguchi et al. (2003), and the discovery of non-zero mixing angle An et al. (2012). Looking forward, the JUNO experiment requires an accurate knowledge of the reactor neutrino spectrum to determine the neutrino mass ordering An et al. (2016a).
For commercial reactors, uranium isotopes are introduced at beginning of a fueling cycle and plutonium isotopes are gradually generated.
Four fission isotopes , , , and account for over the 99.7% of the antineutrino flux with energy above the IBD detection threshold An et al. (2017a).
A reactor antineutrino prediction, the Huber-Mueller (HM) model Huber (2011); Mueller et al. (2011), is determined by converting cumulative beta spectra to antineutrino spectra for , , and and by summing all involved beta decay branches in databases for .
The average of reactor neutrino flux measurements is only 95%-96% of the HM prediction, known as the reactor antineutrino
anomaly (RAA) Mention et al. (2011); Adey et al. (2019a); Yoon et al. (2021); de Kerret et al. (2020).
Another anomaly is about the spectrum. The measured neutrino spectrum is poorly described by the HM model, e.g. a notable “bump” around 5 MeV An et al. (2016b); Choi et al. (2016); Abe et al. (2014).
Together with other experimental anomalies at short-baseline Aguilar-Arevalo et al. (2001, 2010); Anselmann et al. (1995), the RAA has motivated a new generation of short-baseline reactor neutrino experiments to search for a sterile neutrino Alekseev et al. (2018); Ko et al. (2017); Serebrov et al. (2019); Andriamirado et al. (2020); Abreu et al. (2019); Almazán et al. (2021); Barinov et al. (2022).
The effect of weak magnetism Wang and Hayes (2017), neutron capture Huber and Jaffke (2016), fission-neutron energy Littlejohn et al. (2018) and database inaccuracies Hayes et al. (2015) on the prediction has been postulated.
In particular, approximately 30% of the antineutrino flux comes from forbidden decays which can imply an uncertainty
as large as the total flux deficit and the bump Hayes et al. (2014); Hayen et al. (2019); Li and Zhang (2019); Fang and Brown (2015); Sonzogni et al. (2015).
Another prediction approach is the summation method, which adds up all related decay branches from databases for all four isotopes.
One such example, the SM2018 calculation Estienne et al. (2019), with the latest experimental inputs, predicted a uniformly lower flux from
than the HM model.
Kopeikin et al. Kopeikin et al. (2021) reported the measured ratio between cumulative spectra from and that is also systematically lower than the HM prediction.
Both SM2018 and Kopeikin imply a much smaller discrepancy with neutrino flux measurement than HM.
The most recent results from Daya Bay on the total flux in terms of IBD yield, i.e., the number of antineutrinos per fission multiplied by the IBD cross section Adey et al. (2019a) and evolution of the
spectrum as a function of reactor burnup used a 1230-day data sample An et al. (2017b).
These results showed that the yield is about 8% less than the HM prediction while the
yield is consistent with the model.
The latest total and energy differential yields from and with a 1958-day data sample are reported in Ref. Adey et al. (2019b).
Evolution studies have been performed for the NEOS Huber (2017) and RENO Bak et al. (2019) experiments.
In this Letter, using the 1958-day data sample taken from December 2011 to August 2017 with the Daya Bay experiment Adey et al. (2018a), we report the direct measurement of the total and energy differential IBD yields, and , and their evolution with reactor status with improved systematic uncertainties.
Compared to the unfolded spectra of and Adey et al. (2019b),
the measurements in this work do not introduce extra uncertainties from the unfolding method and the theoretical uncertainty of and
which allows a more powerful examination of the combined reactor flux and spectrum prediction of the HM and SM2018 models.
The Daya Bay experiment, equipped with eight antineutrino detectors (ADs), measures the electron antineutrinos from six commercial reactors Adey et al. (2018b); An et al. (2016c, 2017c).
The results in this Letter are based on approximately 3.5 million IBD candidates detected with the four near-site ADs.
The IBD process, , is identified by the prompt-delayed coincidence.
The delayed signal corresponds to the neutron captured on gadolinium.
The prompt energy, , including the kinetic energy of positron and its annihilation gammas,
is related to the antineutrino energy .
The true deposit is reconstructed as .
The reconstructed energy resolution is about 8% at 1 MeV and
a detector response matrix is constructed taking into account all detector effects Adey et al. (2018a).
The measured energy spectrum is corrected for the spent-nuclear-fuel contribution and the nonequilibrium contribution An et al. (2017b); Adey et al. (2019b) for each AD and week, instead of being treated as time independent in the previous analysis An et al. (2017b).
To measure the IBD yield, a quantity is calculated for the AD and week, and is 5, 8, 9, and 1 for , , , and , respectively An et al. (2017a). It describes the number of fissions of an isotope detected by an AD, and
the definition is
(1)
where is the number of target protons of the AD, is the average survival probability of reactor electron antineutrinos integrated over energy from the reactor to the AD calculated under 3-active-neutrino framework in the week, is the detection efficiency, is the distance of the AD-reactor pair,
is the thermal power of the reactor for the week, which is provided by the reactor company,
is the running time of that AD in that week, is the fission fraction of the isotope in the reactor and week, and is the energy per fission of the isotope Ma et al. (2013).
The effective fission fraction for the isotope, (, , , and ), for that AD and week, , is defined by , in which .
Data are sorted into 13 groups according
to their effective fission fraction , which represents the burnup status of reactors and
is analogous to the use of An et al. (2017b).
In this data set, ranges from approximately 0.22 to 0.36, and , correspondingly, ranges from 0.66 to 0.49.
The first group corresponds to between 0.22 and 0.24, due to low statistics, with the additional 12 groups each having a 0.01 interval in from 0.24 to 0.36.
The effective fission fraction of the group, , is calculated as ,
where the information in each AD and week are added together if their ’s belong the group.
The effective fission fractions averaged over all detectors and time (, , , and ) are (0.564, 0.076, 0.304, and 0.056).
The energy differential IBD yield is measured for six reconstructed energy regions: 0.7-2, 2-3, 3-4, 4-5, 5-6, and 6-8 MeV and
the energy differential yield, , for the energy region and the fission group is calculated as An et al. (2017a, b)
(2)
where the integral is over the energy region,
is the measured energy spectrum of the AD in the week,
the divisor gives the total number of fissions for the energy region, and the calculation of is the same , except that the neutrino survival probability in Eq. 1 is calculated for the region only.
The sum over is the total yield, , of that group.
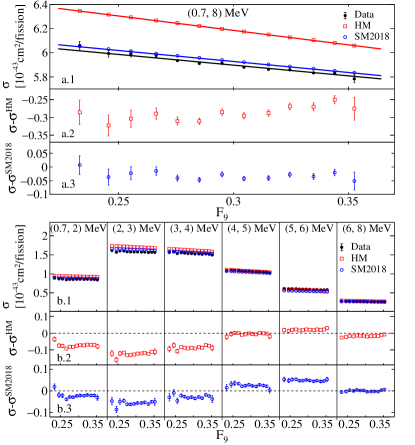
The evolution of total and energy differential yield with are plotted in Fig. 1.
Figure 1: The panels a.1 and b.1 show the total IBD yields in [0.7, 8] MeV and energy differential yield in six reconstructed energy regions as a function of the effective fission fraction of , , respectively.
The best-fit and best-determined lines for the measurements and predictions of the evolution of the total yield are shown in a.1, respectively.
The difference between the measurement and the HM and SM2018 predictions for the total yield (a.2 and a.3) and energy differential yields (b.2 and b.3) are also shown. The error bars represent the statistical uncertainties.
The units of all panels are .
The uncertainties in have statistical, background and the following systematic components.
For the IBD detection efficiency, the AD-correlated uncertainty is improved from 1.7% to 0.75% Adey et al. (2019a), and
the AD-uncorrelated uncertainty is 0.11% Adey et al. (2019b).
The uncertainty of the number of target protons is 0.92% and is AD-correlated An et al. (2017a).
The reactor power measurement uncertainty is 0.5% and is assigned to be reactor-uncorrelated and time-correlated An et al. (2017a).
The uncertainty of the energy per fission is taken into account Ma et al. (2013).
The fission fraction uncertainty for the each isotope and reactor is 5%, but the uncertainties of the four isotopes are further constrained with the normalization condition and the correlation matrix An et al. (2017a) and
are assigned to be reactor- and time-correlated.
The spent nuclear fuel uncertainty is improved from 100% to 30% Adey et al. (2018a).
The nonequilibrium effect uncertainty is 30% An et al. (2017a).
The -induced oscillation uncertainty is also included Adey et al. (2018a).
The uncertainty of the energy differential yield of further includes
all the energy spectrum uncertainties from the background shape and detector response Adey et al. (2019b),
in which the uncertainties in the absolute energy scale is reduced to be less
than 0.5% for larger than 2 MeV.
The predicted total and energy differential yields of the isotope, (, , , and )
and (, , , and ) are obtained
by convolving the product of model prediction and IBD cross section An et al. (2017a) with the detector response matrix.
The total yield predictions is defined as
(3)
where are the yields per isotope. Likewise, using the energy differential predictions, , we define the predicted energy differential yields
(4)
The evolution plots of and with are shown in Fig. 1.
The differences between the measured and predicted total and energy differential yields are also plotted as a function of in Fig. 1.
The uncertainties of and are from all sources involved in the effective fission fraction calculation as described in Eq. 1, 3 and 4.
Model uncertainties are poorly defined and not included unless explicitly stated otherwise.
The total yield evolution is compared to the predictions with two characteristic variables, average yield and normalized evolution slope .
The average yield of and slope of are two direct observables in Fig. 1.
The evolution of the predicted yield can be described as a linear function of for the observed range of .
In addition, if the prediction in Eq. 3 is off by a normalization factor ,
for example, induced by large-mass sterile neutrinos Mention et al. (2011); An et al. (2014); Palazzo (2013) or by a global uncertainty, e.g. from the detection efficiency,
the prediction would be
(5)
The comparison in the normalized evolution slope is free of any normalization issue.
The total yield measurements in the 13 fission groups
are fitted to the following linear function,
(6)
with the function,
(7)
to extract and ,
where is a covariance matrix
determined by randomly sampling all the related uncertainty sources described above.
The best-fit results are = and =
with the over the number of degrees of freedom, , of 9.6/11.
The dominant uncertainty of is from the IBD detection efficiency and number of target protons.
The dominant uncertainty of is from statistics.
The uncertainties from the effective fission fraction calculation are not significant for them.
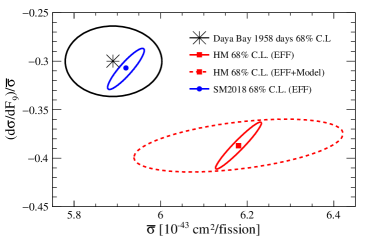
The best-fit line is shown in Fig. 1, and the results and 68% confidence level contour are shown in Fig. 2.
Figure 2: The measured and and their 68% confidence level (C.L.) contour is shown.
The predictions of the HM and SM2018 models are shown with their 68% C.L. contours with effective fission fraction (EFF) uncertainty.
The HM model 68% C.L. contour including its model uncertainties Huber (2011); Mueller et al. (2011) is also shown.
For predictions, and can be directly calculated for a set of known fission fractions at Daya Bay.
A joint distribution of and is obtained by randomly sampling the effective fission fractions according to their covariance matrix. The mean values and uncertainties of and are obtained with the distribution.
The results for the HM are = and = ( and if including the model uncertainties Huber (2011); Mueller et al. (2011)).
The HM prediction in and are rejected at 3.6 and 3.0 standard deviations.
For SM2018, the results are consistent with the Daya Bay measurements.
These results are shown in Fig. 2 and
the best-determined lines are plotted in Fig. 1.
The energy differential yield evolution is compared to models with the average yields and normalized evolution slopes in six reconstructed energy regions.
The data are simultaneously fitted to six linear functions,
(8)
with the function,
(9)
to extract six pairs of parameters of and ,
where is a covariance matrix with a combined row (column) index of ()
for the () reconstructed energy region and () fission fraction group.
is also determined by a random sampling method of all the related uncertainty sources described earlier.
The best-fit is 76/66.
The fit also gives the covariance matrix of and ,
which includes the covariance matrix, , for the six
and the covariance matrix, , for .
The six results are strongly correlated because their dominant uncertainties are from the IBD detection
efficiency and number of target protons, and the matrix deviates strongly from a diagonal matrix.
The six results are all limited by data statistics and largely uncorrelated, and is close to diagonal.
The correlation between and is insignificant.
For the predictions, a joint 12-dimension distribution of and is obtained by randomly sampling the effective fission fractions as for the study of the predicted total yield and its normalized evolution rate.
The mean values of and are obtained with the distribution
as well as the covariance matrix for , , and
the covariance matrix for , .
The difference of with the measurement
and results are plotted in Fig. 3.
The uncertainty associated with prediction is much smaller than that from measurement.
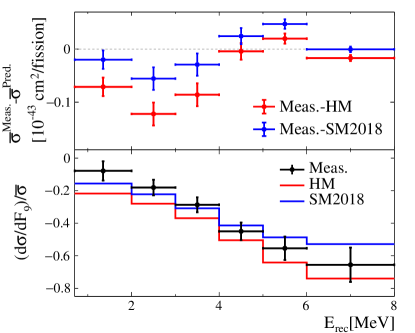
Figure 3: The upper panel shows the difference between the measured energy differential yields and predictions for six reconstructed energy bins, where the error bars are from the measurement. The lower panel shows the normalized evolution slopes for the measurement and predictions, where the uncertainties of measurement are shown.
The average IBD yields of six energy regions, are compared to the HM and SM2018 predictions .
Their difference is quantified as a calculated with the difference of - and
their covariance matrix of +.
The resulting and
the corresponding extent of discrepancy in standard deviations are shown in Tab. 1.
The models do not agree with Daya Bay, and because of
the deficit around 3 MeV and/or the bump around 5 MeV found in the measurement (Fig. 1) and
the strong correlation among the measurements in different energy regions, their ’s are rather large,
and they correspond to 25 and 27 standard deviations for the HM and SM2018 models, respectively.
The latter, due to the larger discrepancy in the 4-6 MeV region with the measurement, has a slightly worse than HM.
The normalized evolution slopes of the six energy regions, , are compared to HM and SM2018.
Their difference is quantified with a calculated with the difference of - and their covariance matrix of
+. The resulting is shown in Tab. 1.
While the HM and SM2018 models poorly predict the spectral shape,
their predicted relative changes with the fuel composition have much better agreement with the measurement.
Table 1: Comparison results of the measurement with the HM and SM2018 predictions for the average IBD yields of six energy regions, , (middle column) and the normalized evolution slopes, (right column).
The of the comparison (corresponding number of standard deviations) is given.
Model
HM
675/6 (25)
11/6 (1.8)
SM2018
748/6 (27)
5.5/6 (0.7)
To understand the difference between the Daya Bay differential IBD yield evolution and the predictions,
three types of modified models with new free parameters are introduced on top of the HM and SM2018 predictions.
The first modification to each model is to alter only the energy differential yield prediction in each reconstructed energy region by the fraction together with the global normalization factor , as in Eq. 5,
model,eg
(10)
Depending on what the base model is,
the modified models are further labelled as HM+ and SM2018+.
This is motivated by the fact that the majority of the the neutrino flux is due to .
In the second modification to each model, the prediction is
model,eg
(11)
where only the energy differential yield predictions in each reconstructed energy region is allowed to change by the fraction together with the global normalization factor .
The modified models are labelled as HM+ and SM2018+ next.
This is motivated given that is the second largest contributor to the neutrino flux.
The third modification to each model is to equally scale the predicted spectra of four isotopes in each reconstructed energy region by the fraction ,
model,eg
(12)
The motivation is that particular studies Xubo et al. (2018); Hayen et al. (2019) have suggested that all four isotopes may have a common problem in predictions.
They are labelled as HM+Equ and SM2018+Equ.
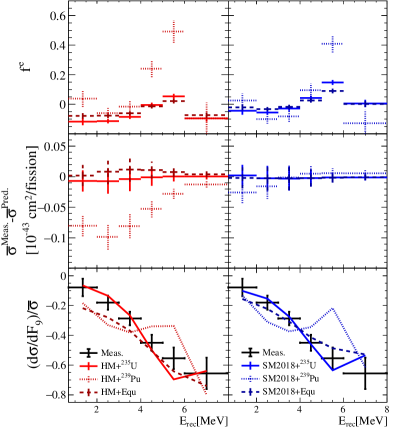
We fit the measured energy differential yields in the 6 energy regions and 13 fission fraction groups to the modified models with the following
Even when the energy spectra are modified, both the HM and SM2018 model predictions remain incompatible with the data at well over three standard deviations as shown in Tab. 2.
For both models, as seen in Fig. 4, the required changes of the spectrum in some regions are higher than 40%,
which is far beyond the range of uncertainties caused by the various postulated mechanisms Hayes et al. (2015); Wang and Hayes (2017); Huber and Jaffke (2016); Littlejohn et al. (2018); Hayes et al. (2014); Hayen et al. (2019); Li and Zhang (2019); Fang and Brown (2015); Sonzogni et al. (2015) and is unreasonable.
This observation can be phenomenologically traced back to the features of Fig. 1.
For example, the - in the 2-4 MeV region shows a positive slope and is not proportional to ,
which contradicts the assumption of pure -caused anomaly Huber (2017); Bak et al. (2019).
The attempts to adjust the predicted spectrum of or all spectra in equal measure all lead to good agreement with the data using this metric.
As shown in Tab. 2, their best-fit results for -adjusting models are all consistent with 1.
The deduced and
are consistent with the measurements as shown in Fig. 4.
HM+235U works slightly better than HM+Equ model, as their best-fit shown in Tab. 2.
But with the current precision of the Daya Bay data set, it is difficult to distinguish whether , by itself, or a mix of fission isotopes, are responsible for the flux and spectrum anomalies.
In summary, the total and energy differential IBD yield evolution as a function of fuel composition are measured and compared to the predictions of two signature models: the HM model based on the conversion method and the SM2018 model based on the summation method.
While the measurement of the total IBD yield evolution is found to be incompatible with the HM model prediction, it is consistent with the SM2018 prediction.
On the other hand, the predictions of spectrum evolution for both HM and SM2018 model show large discrepancies from the data.
We exclude at high significance the hypothesis that the energy spectrum in HM or SM2018 models is responsible for the entire difference with the data, regardless of how the normalization of the Daya Bay data is treated.
In contrast, good consistency with the data can be achieved either by altering the spectrum or all four isotopes’ spectra in equal measure in the SM2018 model. For the HM model, the spectrum adjustment works slightly better than adjusting all spectra, as indicated by the total yield evolution measurement. Future enhancements to the models could prioritize -specific causes or factors common to the four isotopes.
Daya Bay is supported in part by the Ministry of Science and Technology of China,
the U.S. Department of Energy,
the Chinese Academy of Sciences,
the National Natural Science Foundation of China,
the Guangdong provincial government,
the Shenzhen municipal government,
the China General Nuclear Power Group,
Key Laboratory of Particle and Radiation Imaging (Tsinghua University), the Ministry of Education,
Key Laboratory of Particle Physics and Particle Irradiation (Shandong University), the Ministry of Education,
Shanghai Laboratory for Particle Physics and Cosmology,
the Research Grants Council of the Hong Kong Special Administrative Region of China,
the University Development Fund of The University of Hong Kong,
the MOE program for Research of Excellence at National Taiwan University,
National Chiao-Tung University, and NSC fund support from Taiwan,
the U.S. National Science Foundation,
the Alfred P. Sloan Foundation,
the Charles University Research Center UNCE/SCI/013 in the Czech Republic,
the Joint Institute of Nuclear Research in Dubna, Russia,
the CNFC-RFBR joint research program, the National Commission of Scientific and Technological Research of Chile,
and the Tsinghua University Initiative Scientific Research Program.
We acknowledge Yellow River Engineering Consulting Co., Ltd., and China Railway 15th Bureau Group Co., Ltd., for building the underground laboratory. We are grateful for the ongoing cooperation from the China General Nuclear Power Group and China Light and Power Company.