Many-body description of STM-induced fluorescence of charged molecules
Abstract
A scanning tunneling microscope is used to study the fluorescence of a model charged molecule (quinacridone) adsorbed on a sodium chloride (NaCl)-covered metallic sample. Fluorescence from the neutral and positively charged species is reported and imaged using hyper-resolved fluorescence microscopy. A many-body excitation model is established based on a detailed analysis of voltage, current and spatial dependencies of the fluorescence and electron transport features. This model reveals that quinacridone adopts a large palette of charge states, transient or not, depending on the voltage used and the nature of the underlying substrate. This model has a universal character and explains the electronic and fluorescence properties of many other molecules adsorbed on thin insulators.
Fluorescence of neutral and charged molecules has been reported with sub-nanometer resolution in scanning tunneling microscopy induced-luminescence (STML) experiments over the last few years qiu2003vibrationally ; zhang2016visualizing ; imada2016real ; Doppagne2017Vibronic ; doppagne2018electrofluorochromism ; kimura2019selective ; chen2019spin ; Kaiser2019 ; Rai2020 ; kong2021 ; Hung2021 ; dolezal2021exciton ; dolezal2021real . In these experiments, charged emission is generally probed during transient charging of neutral molecules adsorbed on a thin decoupling layer doppagne2018electrofluorochromism ; Rai2020 ; dolezal2021exciton . STML of molecules whose ground state on surface is a negatively charged doublet (D) has also been reported for perylenetetracarboxylic dianhydride (PTCDA) in two recent reports kimura2019selective ; dolezal2021real . In these experiments, a low energy emission line was reported, which was assigned either to phosphorescence or to the emission of the negatively charged molecule (negative trion). For PTCDA, deciphering which of those two emission channel is at play is tedious, especially because the transition dipole moments of both phosphorescence and negative trions are oriented along the same molecular axis and would give rise to similar patterns in STML maps.
Here, we report on a STML study of a model quinacridone (QA) molecule, whose ground state is a positively charged doublet (D) when adsorbed on 4ML NaCl/Ag(111). A rare property of this molecule is that neutral and positively charged fluorescence dipoles are oriented at 65∘ from each other, giving rise to radically different patterns in STML maps. This allows us to undoubtedly exclude phosphorescence processes and to assign the low energy emission line to the positive QA trion. Based on a comparison between the spatial, voltage and current dependencies of the charged and neutral emission lines, and on conductance spectra, an excitation mechanism based on a many-body description of the system schulz2015many ; Yu2017 ; miwa2019 ; doppagne2020single ; fatayer2021probing ; song2022 can be set, which reveals that QA can be populated in four different charged states (namely QA-, QA0, QA+, and QA2+) and three different spin multiplicity (singlet, doublet, triplet) during a single voltage sweep. This excitation mechanism is backed up by data obtained on the same QA molecule deposited on NaCl on Au(111) where the ground state of the molecule is a doubly positively charged singlet state (S). We believe that this excitation model bears a universal character that can be applied to STML experiments of both charged or neutral molecules.
The STM data were acquired with a low temperature (4.5 K) Omicron setup operating in ultrahigh vacuum adapted to detect the light emitted at the tip-sample junction (see Supplemental Material for details). The Ag(111) or Au(111) substrate was cleaned with successive sputtering and annealing cycles. Electrochemically etched gold tips were gently introduced in the substrate to tune their plasmonic response. NaCl was thermally evaporated on substrate maintained at room temperature. The sample was then annealed to 400-430 K to obtain NaCl films with thicknesses of three to four monolayers(ML). Eventually, the NaCl-covered substrate was introduced into the STM chamber and cooled down to 4.5 K. QA molecules were thermally sublimated (at 560 K) from a quartz crucible onto the cold substrate.
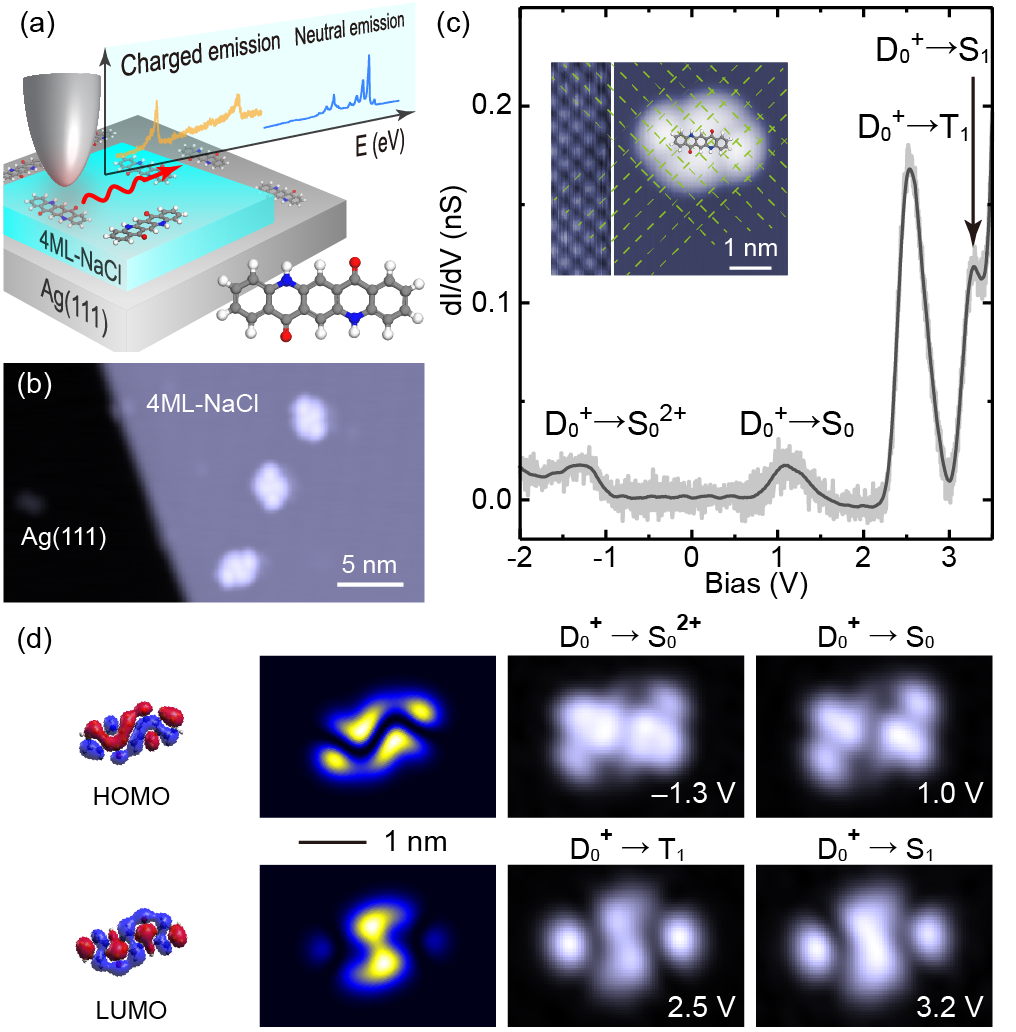
Figure 1a shows a sketch of the experiment, where the tip of a scanning tunneling microscope (STM) is used to excite the fluorescence QA on 4 ML NaCl/Ag(111). In Fig. 1b one identifies individual QA molecules adsorbed on the NaCl decoupling layer. Figure 1c provides a typical conductance spectrum (d/d) acquired on the decoupled QA, together with a close-up view of a QA molecule revealing its detailed adsorption site on NaCl. Here, the two oxygen atoms of the molecule are located above a Sodium atom. Interestingly, the d/d spectrum reveals two nearly symmetric resonances below ( = 1.3 V) and above ( = 1.0 V) the Fermi level, whose associated maps (Fig. 1d) reveal patterns strongly resembling the shape of the DFT-calculated HOMO (highest occupied molecular orbital). Indeed, in this electronic configuration, adding (D S0) or removing (D S) an electron from the molecule with the tip involves the HOMO of the QA molecule. Similar conclusions have been reported in previous STM works one decoupled molecules repp2006imaging ; hollerer2017charge ; kimura2019selective ; they generally indicate that the molecular ground state on NaCl is the positively charged doublet state (D).
In contrast, the d/d resonances recorded at higher positive voltages reveal patterns that are characteristic of the LUMO (lowest unoccupied molecular orbital). For reasons that will become clear later, we assign these resonances to transitions to the triplet (D T1) and excited singlet (D S1) state of the neutral molecule. The resonance corresponding to a transition to the triplet state appears notably more intense than the transition to the excited singlet state, a phenomenon that can be associated to the larger spin multiplicity of this state (See Supplemental Material). The role of molecular triplet states was inferred or more directly measured in several scanning probe measurements recently kimura2019selective ; chen2019spin ; fatayer2021probing ; peng2021 . Identifying it here as a resonance in d/d spectra, and clarifying its role in emission spectra is therefore of importance.
In Fig. 2a we show STM-induced luminescence (STML) spectra acquired over the short (in blue) and long (in red) axes of QA at a bias of = 2.7 V, together with a reference spectrum acquired on the bare Ag(111) (in black). The blue spectrum reveals a high energy emission line at h = 1.99 eV (labeled X0) followed by a set of vibronic lines at slightly lower energy that fit well the emission of neutral QA (S S0 transition). The same contribution can be identified in the red spectrum, but with a much weaker emission intensity. It is accompanied by two low energy lines at h = 1.23 eV (labeled X+) and h = 1.39 eV, whose identification cannot rely only on literature.
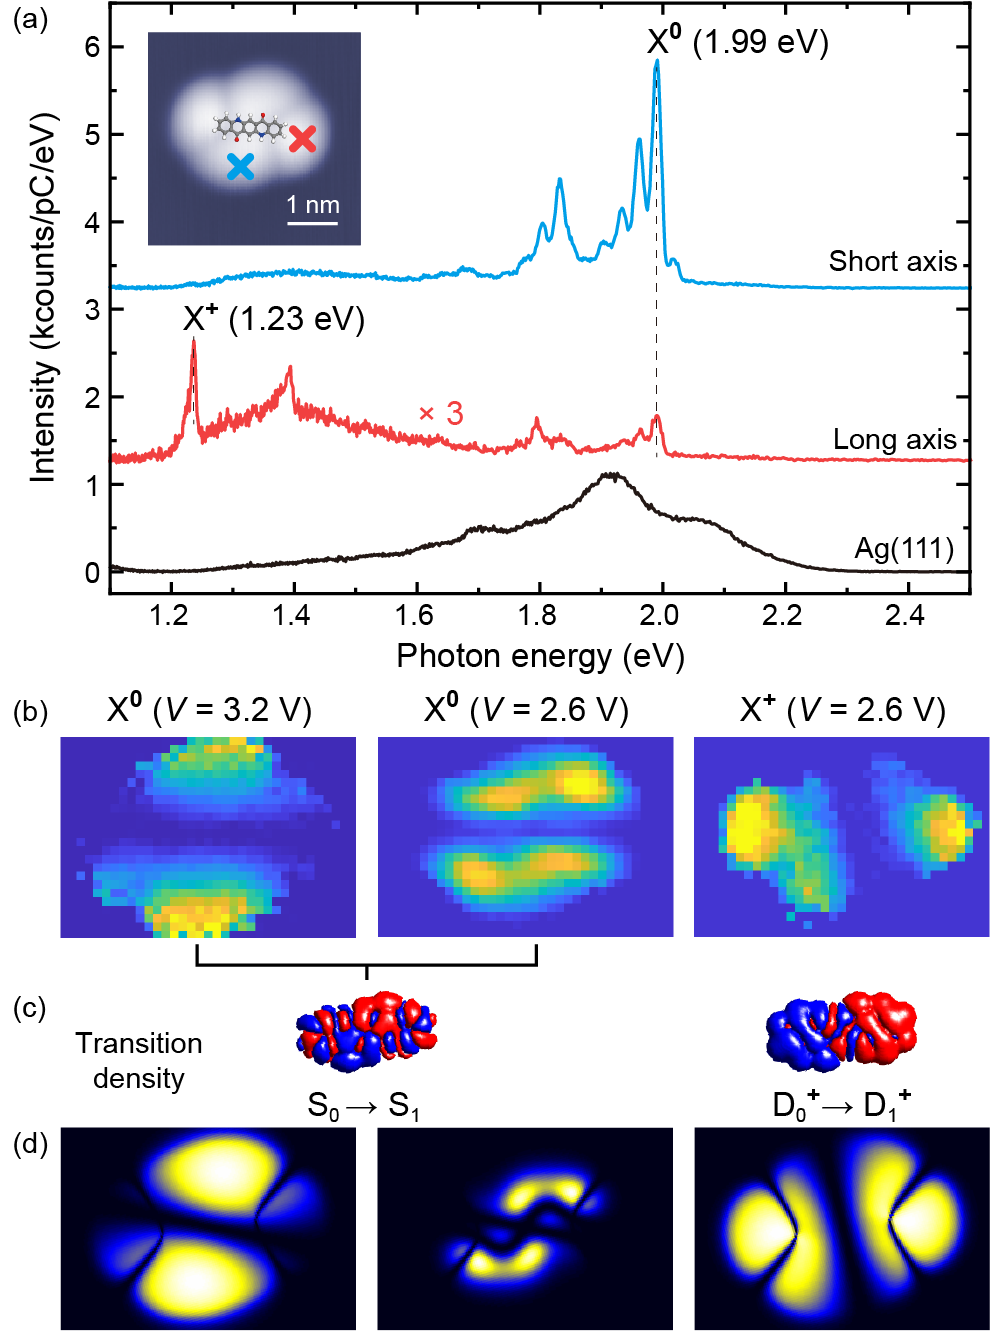
In Fig. 2b we display hyper resolved fluorescence maps (HRFMs) of the emission intensity of the X0 line (recorded at = 3.2 V and = 2.6 V) and of the X+ line (recorded at = 2.6 eV). The HRFMs exhibit two bright features separated by a nearly horizontal (X0 line) or vertical (X+ line) node. It has been demonstrated in earlier works chen2010 ; zhang2016visualizing ; doppagne2020single ; roslawska2022prx , that the pattern in HRFMs is characteristic of the excited transition dipole moment and its orientation. More precisely, the axis joining the two bright lobes in the HRFMs provides the dipole orientation. One notes that for the X0 line, the dipole axis is tilted by with respect to the long axis of QA, as shown by the TDDFT-simulated S S0 transition dipole in Fig. 2c (see Supplemental Material for details), that is a transition of the neutral molecule. Note that the same orientation is expected for the dipole associated to the phosphorescence T S0 of the QA molecule. In contrast, the HRFM of the h = 1.23 eV line reveals a transition dipole moment nearly parallel to the long QA axis. This behaviour agrees very well with TDDFT simulations (Fig. 2c) of the positively charged QA trion (X+) corresponding to a D D radiative transition. For the 1.39 eV line, the HRFM reveals a pattern similar to the one for X+ (see Supplemental Material). Together with spectra recorded in the short-wave infrared range (see Supplemental Material) that confirm the assignment of the 1.23 eV line to the 0-0 of X+, these data associate the 1.39 eV line to the luminescence hot trions (i.e. emission from a non-relaxed vibronic state of D). Eventually, the X0 HRFMs recorded at = 3.2 V and = 2.6 eV reveal two slightly different patterns, a difference that reflects different excitation mechanisms as can be accounted for in a more complex theoretical model, as described below (see also Fig. 2d).
To support our assignment of the spectral contributions and to determine with precision the excitation mechanism leading to the emission of both charged and neutral QA molecules, we recorded the voltage (Fig. 3a) and current (Fig. 3b,c) dependencies of the X0 and X+ lines. Figure 3a shows that the emission onset of X+ coincides with the resonant tunneling into the triplet state (D T1). Besides, and independently of the used voltage bias, the X+ emission intensity is linear with current (Fig. 3b,c), indicating a single electron excitation process. Based on these observations we can build a robust many-body scheme (Fig. 3d) to explain the X+ emission mechanism. The molecule initially in the ground D state can be driven, for V 2.3 V, into T1 by injection of an electron from the tip directly into the LUMO of the molecule. The molecule can turn back to its cationic state by electron tunneling to the substrate either from the LUMO (T D) or from the HOMO, populating thus a higher excited state D (T D)note . In the latter case, the trionic excited state D rapidly decays to D. The radiative transition (D D) is eventually responsible for the X+ emission line (as confirmed by TDDFT, see Supplemental Material). The only condition for this mechanism to occur is that T1 has a higher energy than D in the diagram of Fig. 3d.
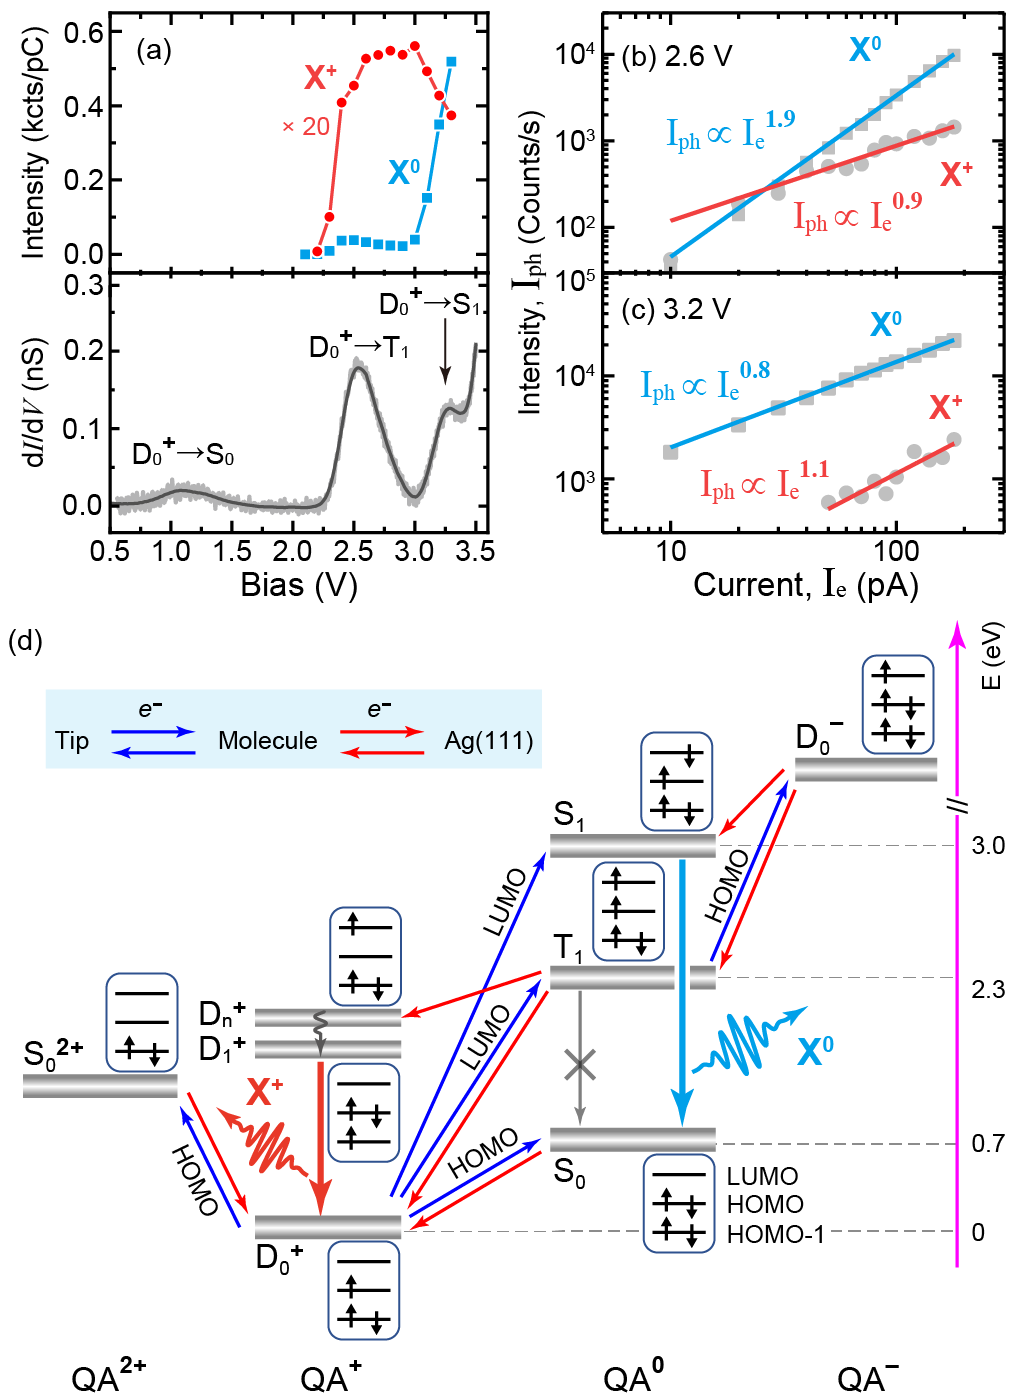
The situation is more complex for the X0 emission. The voltage dependency in Fig. 3a reveals here two emission onsets: A first one that leads to a weak X0 emission and that coincides with the (D T1) transition in the d/d spectrum, and a second onset leading to a much brighter emission intensity at a voltage that matches the (D S1) transition. The plot of Fig. 3b reveals a nearly quadratic dependency of the X0 intensity with current for voltages corresponding to the first onset. This last observation clearly indicates a two-electron excitation mechanism. In contrast, the linear dependency of the X0 emission after the second onset (Fig. 3c) indicates a one-electron process for this voltage range.
One easily understands the observation of an intense X0 emission for V 3.0 V: above this voltage, one can populate the singlet excited state S1 of the molecule, which in turn rapidly decays in the neutral ground state S0 by emitting a X0 photon. For 2.3 V V 3.0 V, only T1 is populated. As T1 is a long lived triplet state, a second tunneling event from the tip can take place, driving the QA molecule in the negatively charged doublet state D. From there, the tunneling of an electron from the HOMO to the sample can leave the molecule in the S1 state, where radiative recombination to S0 may occur. We note that, in contrast to the other many-body states discussed so far that are all directly observed either in conductance or fluorescence spectra, the presence of the D state can, in principle, only be inferred from the current and voltage dependencies of the X0 line. However, some information on this two-electron excitation mechanism can also be deduced from the difference between the X0 line HRFM recorded at = 3.2 V and = 2.6 V (Fig. 2b-d). Whereas the first one can be well reproduced by considering a simple charge transfer from the tip to the LUMO of the molecule (reflecting the D S1 transition), the second involves the LUMO (D T1 transition) and the HOMO (T D transition).
This can be accounted for in a theoretical rate-equation model where the input rates of all tip-mediated processes - tunneling and photon emission - are made as a function of the tip position. The tip-mediated tunneling rates (blue arrows in Fig. 3d) are considered proportional to the relevant partial density of stateshamann85 ; schulz2015many and the plasmon-mediated photon emission (thick vertical arrows in Fig. 3d) is included by evaluating the plasmon-exciton coupling strengthroslawska2022prx . The details of the rate-equation model and its parameterization are described in Supplemental Material. We solve the rate equations in the steady state for a given voltage at each position of the tip and thus extract the HRFM maps. The calculated maps, shown in Fig. 2d, are in an excellent agreement with the experiment, which demonstrates that, beyond the information related to the plasmon-exciton coupling, the detailed pattern of the HRFM can be used to identify the role of specific molecular many-body states in the STML excitation mechanism.
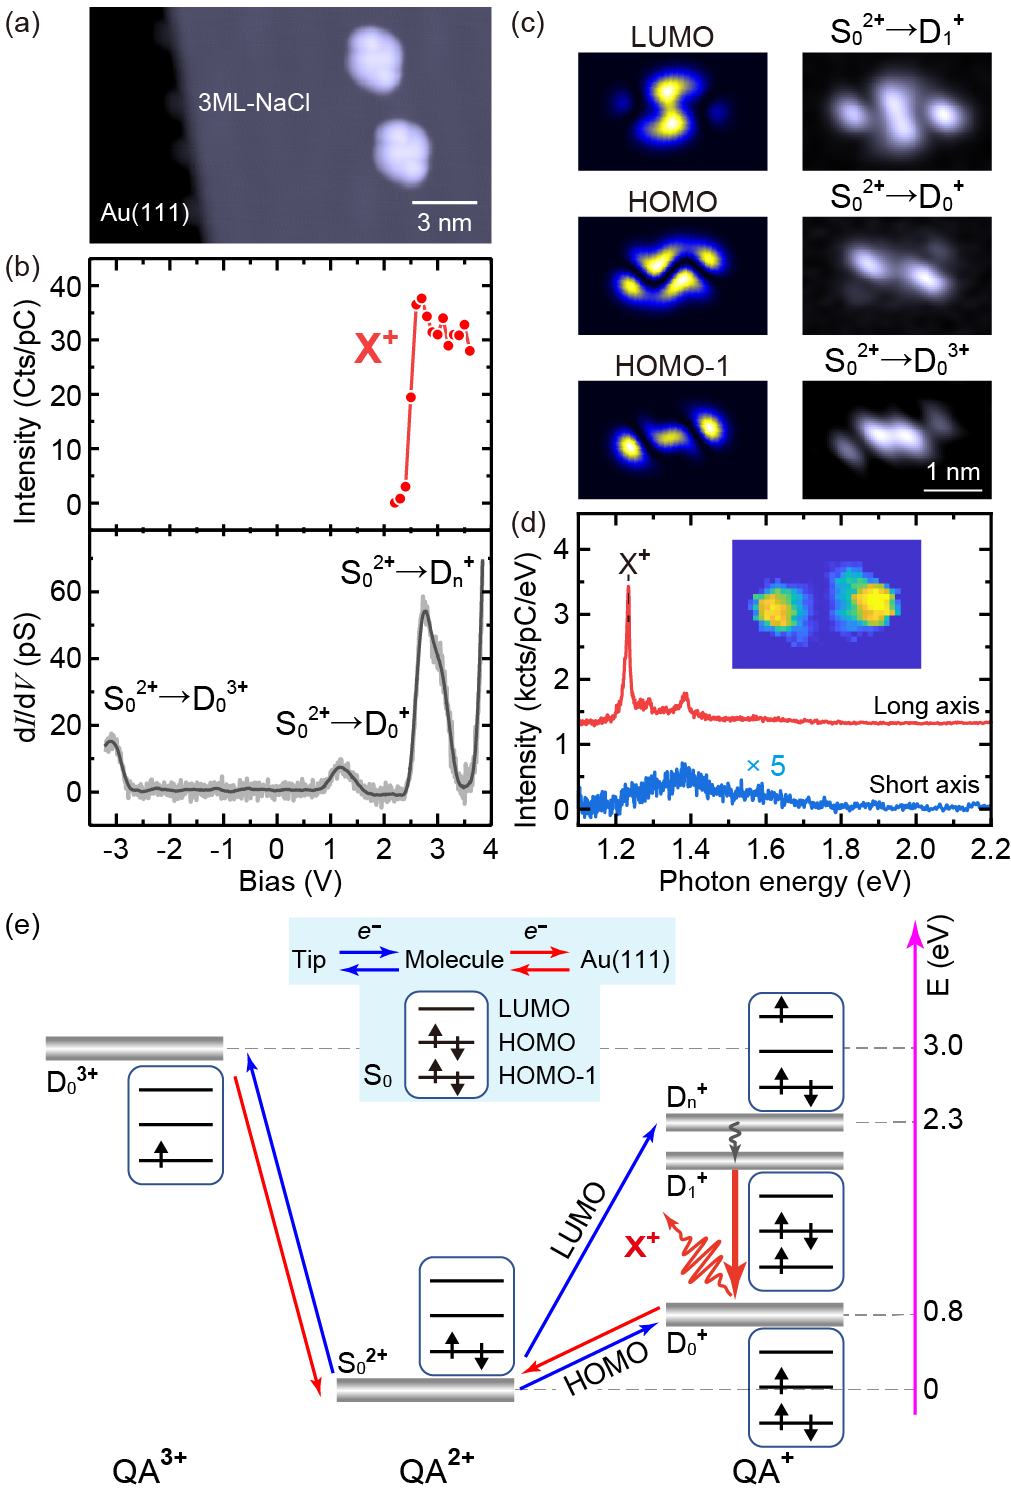
To further confirm and extend our understanding of the excitation mechanism, we performed the same experiment with QA adsorbed on 3ML NaCl/Au(111), as shown in Fig. 4a. Au(111) has a work function higher by 0.8 eV than Ag(111), which causes a shift of the molecular states to higher energies, and eventually leads to an adsorbed molecule in a doubly charged singlet state S. This unusual electronic configuration can be visualized in Fig. 4b where the d/d spectrum reveals three spectroscopic features assigned respectively to transitions to the triply charged doublet state D ( = 3 V), the doublet state D ( = 1 V) and the excited doublet state D ( = 2.5 V) note . STML spectra and HRFM reveal (Fig. 4d) the characteristic features of the X+ emission. The X0 emission is absent, independently of the used voltage, current and tip position conditions. Indeed, as the molecule is initially in a doubly charged state, populating S1, a mandatory step for the X0 emission, would rely on an inefficient two-electron process and require a very high voltage to enable the D S1 transition. The X+ voltage onset ( 2.3 V, see Fig. 4b) correlates well with the S D transition, and suggests a non-radiative D D transition.
On the basis of these observations one can therefore establish the many-body state diagram of Fig. 4e. This diagram easily explains that the constant height d/d images (Fig. 4c) show patterns corresponding (i) to the LUMO for the resonance corresponding to the S D transition, (ii) to the HOMO for the resonance corresponding to the S D, and (iii) to the HOMO-1 for the resonance corresponding to the S D transition. Note that, in this last case, the molecule is transiently driven in an unexpected triply charged state. Eventually, we want to stress that our representation could be further improved by accounting for molecular vibrations and substrate reorganisations that are known to play an important role in the energy of the allowed electronic transitions fatayer2018reorganization ; hernangomez2020 .
Overall, we report on STML measurements of a model system for charged molecules. Our study reveals that the emission line appearing strongly red-shifted with respect to the neutral fluorescence in this case should be assigned to trionic emission. Our paper also provides a very consistent picture based on current, voltage and spacial dependencies of STML signals as well as on conductance spectra and maps for the same molecule on two different substrates. This shows that a molecule can be populated in four different charged states and three different spin multiplicities during a single voltage sweep. This also allows establishing a solid many-body model explaining in details the transport and light emission mechanisms, which can readily be applied to other STML experiments dealing with decoupled molecules or more complex emitters.
We thank Niklas Humberg and Moritz Sokolowski for drawing our attention to the quinacridone molecule and for providing it. Anna Rosławska, Katharina Kaiser and Kirill Vasilev are also acknowledge for fruitful discussions. We are grateful to Virginie Speisser and Michelangelo Romeo for technical support. This project has received funding from the European Research Council (ERC) under the European Union’s Horizon 2020 research and innovation program (grant agreement No 771850). The International Center for Frontier Research in Chemistry (FRC) is acknowledged for financial support. This work has been supported by the University of Strasbourg’s IdEx program and by the “Investissements d’Avenir” LabEx PALM (ANR-10-LABX-0039-PALM).
References
- (1) X. Qiu, G. Nazin, and W. Ho, Science 299, 542 (2003).
- (2) Y. Zhang, Y. Luo, Y. Zhang, Y.-J. Yu, Y.-M. Kuang, L. Zhang, Q.-S. Meng, Y. Luo, J.-L. Yang, Z.-C. Dong, et al., Nature 531, 623 (2016).
- (3) H. Imada, K. Miwa, M. Imai-Imada, S. Kawahara, K. Kimura, and Y. Kim, Nature 538, 364 (2016).
- (4) B. Doppagne, M. C. Chong, E. Lorchat, S. Berciaud, M. Romeo, H. Bulou, A. Boeglin, F. Scheurer, and G. Schull, Phys. Rev. Lett. 118, 127401 (2017).
- (5) B. Doppagne, M. C. Chong, H. Bulou, A. Boeglin, F. Scheurer, and G. Schull, Science 361, 251 (2018).
- (6) K. Kimura, K. Miwa, H. Imada, M. Imai-Imada, S. Kawahara, J. Takeya, M. Kawai, M. Galperin, and Y. Kim, Nature 570, 210 (2019).
- (7) G. Chen, Y. Luo, H. Gao, J. Jiang, Y. Yu, L. Zhang, Y. Zhang, X. Li, Z. Zhang, and Z. Dong, Phys. Rev. Lett. 122, 177401 (2019).
- (8) K. Kaiser, L. Gross, and F. Schulz, ACS Nano 13, 6947 (2019).
- (9) V. Rai, L. Gerhard, Q. Sun, C. Holzer, T. Repän, M. Krstić, L. Yang, M. Wegener, C. Rockstuhl, and W. Wulfhekel, Nano Letters 20, 7600 (2020).
- (10) F.-F. Kong, X.-J. Tian, Y. Zhang, Y.-J. Yu, S.-H. Jing, Y. Zhang, G.-J. Tian, Y. Luo, J.-L. Yang, Z.-C. Dong, et al., Nat. Commun. 12, 1 (2021).
- (11) T.-C. Hung, B. Kiraly, J. H. Strik, A. A. Khajetoorians, and D. Wegner, Nano Letters 21, 5006 (2021).
- (12) J. Dolezal, S. Canola, P. Merino, and M. Svec, ACS Nano 15, 7694 (2021).
- (13) J. Dolezal, S. Canola, P. Hapala, R. C. de Campos Ferreira, P. Merino, and M. Svec, ACS Nano 16, 1082 (2021).
- (14) F. Schulz, M. Ijäs, R. Drost, S. K. Hämäläinen, A. Harju, A. P. Seitsonen, and P. Liljeroth, Nat. Phys. 11, 229 (2015).
- (15) P. Yu, N. Kocić, J. Repp, B. Siegert, and A. Donarini, Phys. Rev. Lett. 119, 056801 (2017).
- (16) K. Miwa, H. Imada, M. Imai-Imada, K. Kimura, M. Galperin, and Y. Kim, Nano Lett. 19, 2803 (2019).
- (17) B. Doppagne, T. Neuman, R. Soria-Martinez, L. E. P. López, H. Bulou, M. Romeo, S. Berciaud, F. Scheurer, J. Aizpurua, and G. Schull, Nat. Nanotechnol. 15, 207 (2020).
- (18) S. Fatayer, F. Albrecht, I. Tavernelli, M. Persson, N. Moll, and L. Gross, Phys. Rev. Lett. 126, 176801 (2021).
- (19) S. Jiang, T. Neuman, A. Boeglin, F. Scheurer, and G. Schull, (arxiv.2209.01471).
- (20) J. Repp, G. Meyer, S. Paavilainen, F. E. Olsson, and M. Persson, Science 312, 1196 (2006).
- (21) M. Hollerer, D. Lüftner, P. Hurdax, T. Ules, S. Soubatch, F. S. Tautz, G. Koller, P. Puschnig, M. Sterrer, and M. G. Ramsey, ACS Nano 11, 6252 (2017).
- (22) J. Peng, S. Sokolov, D. Hernangómez-Pérez, F. Evers, L. Gross, J. M. Lupton, and J. Repp, Science 373, 452 (2021).
- (23) C. Chen, P. Chu, C. A. Bobisch, D. L. Mills, and W. Ho, Phys. Rev. Lett. 105, 217402 (2010).
- (24) A. Rosławska, T. Neuman, B. Doppagne, A. G. Borisov, M. Romeo, F. Scheurer, J. Aizpurua, and G. Schull, Phys. Rev. X 12, 011012 (2022).
- (25) A direct transition to D is unlikely as it would require a change of electronic configuration involving two different electrons and would not account for the LUMO pattern in the S D image in Fig. 4c.
- (26) J. Tersoff and D. R. Hamann, Phys. Rev. B 31, 805 (1985).
- (27) S. Fatayer, B. Schuler, W. Steurer, I. Scivetti, J. Repp, L. Gross, M. Persson, and G. Meyer, Nat. Nanotechnol. 13, 376 (2018).
- (28) D. Hernangómez-Pérez, J. Schlör, D. A. Egger, L. L. Patera, J. Repp, and F. Evers, Phys. Rev. B 102, 115419 (2020).